Embed Size (px)
Citation preview
1
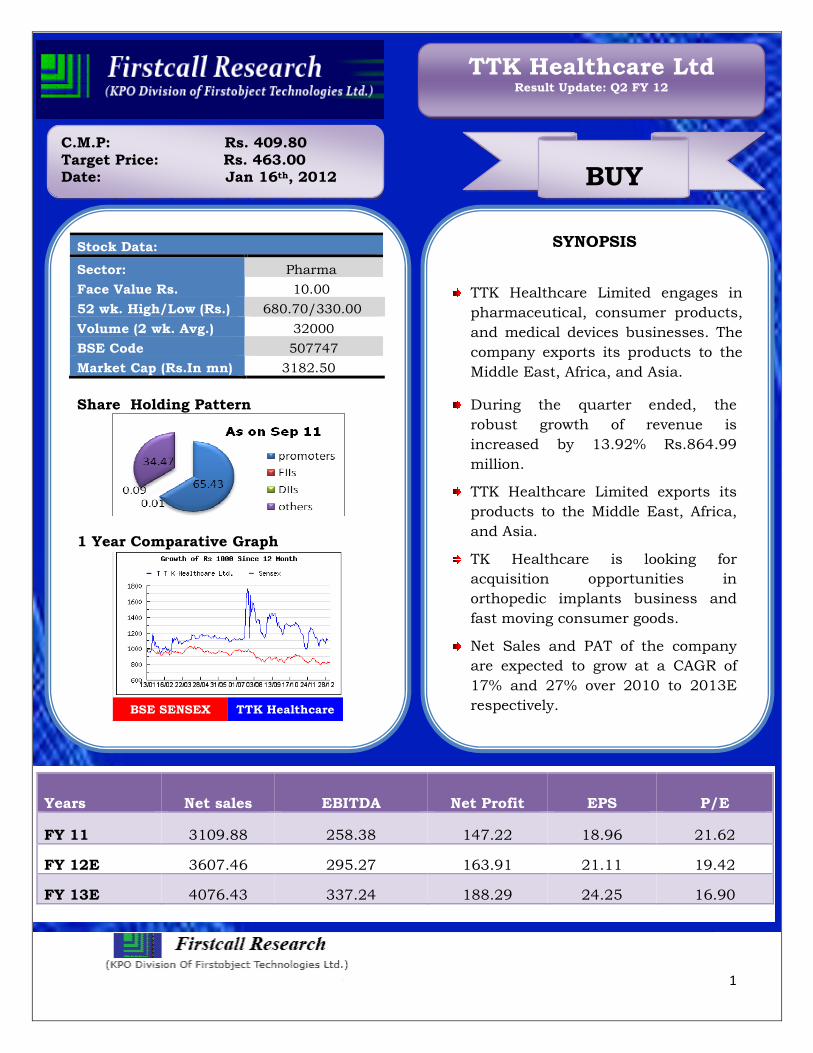
SYNOPSIS
TTK Healthcare Limited engages in
pharmaceutical, consumer products,
and medical devices businesses. The
company exports its products to the
Middle East, Africa, and Asia.
During the quarter ended, the
robust growth of revenue is
increased by 13.92% Rs.864.99
million.
TTK Healthcare Limited exports its
products to the Middle East, Africa,
and Asia.
TK Healthcare is looking for
acquisition opportunities in
orthopedic implants business and
fast moving consumer goods.
Net Sales and PAT of the company
are expected to grow at a CAGR of
17% and 27% over 2010 to 2013E
respectively.
Years Net sales EBITDA Net Profit EPS P/E
FY 11 3109.88 258.38 147.22 18.96 21.62
FY 12E 3607.46 295.27 163.91 21.11 19.42
FY 13E 4076.43 337.24 188.29 24.25 16.90
Stock Data:
Sector: Pharma
Face Value Rs. 10.00
52 wk. High/Low (Rs.) 680.70/330.00
Volume (2 wk. Avg.) 32000
BSE Code 507747
Market Cap (Rs.In mn) 3182.50
Share Holding Pattern
1 Year Comparative Graph
BSE SENSEX TTK Healthcare
C.M.P: Rs. 409.80 Target Price: Rs. 463.00 Date: Jan 16th, 2012 BUY
TTK Healthcare Ltd Result Update: Q2 FY 12
2
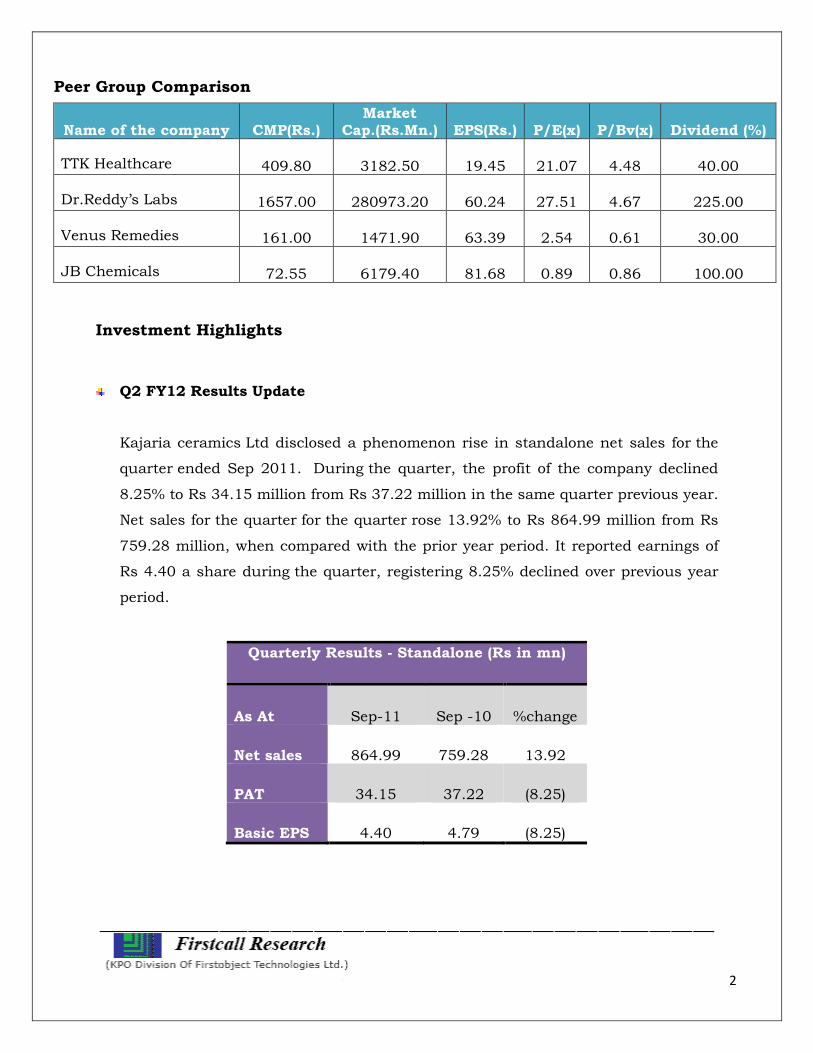
Peer Group Comparison
Name of the company CMP(Rs.) Market
Cap.(Rs.Mn.) EPS(Rs.) P/E(x) P/Bv(x) Dividend (%)
TTK Healthcare 409.80 3182.50 19.45 21.07 4.48 40.00
Dr.Reddy’s Labs 1657.00 280973.20 60.24 27.51 4.67 225.00
Venus Remedies 161.00 1471.90 63.39 2.54 0.61 30.00
JB Chemicals 72.55 6179.40 81.68 0.89 0.86 100.00
Investment Highlights
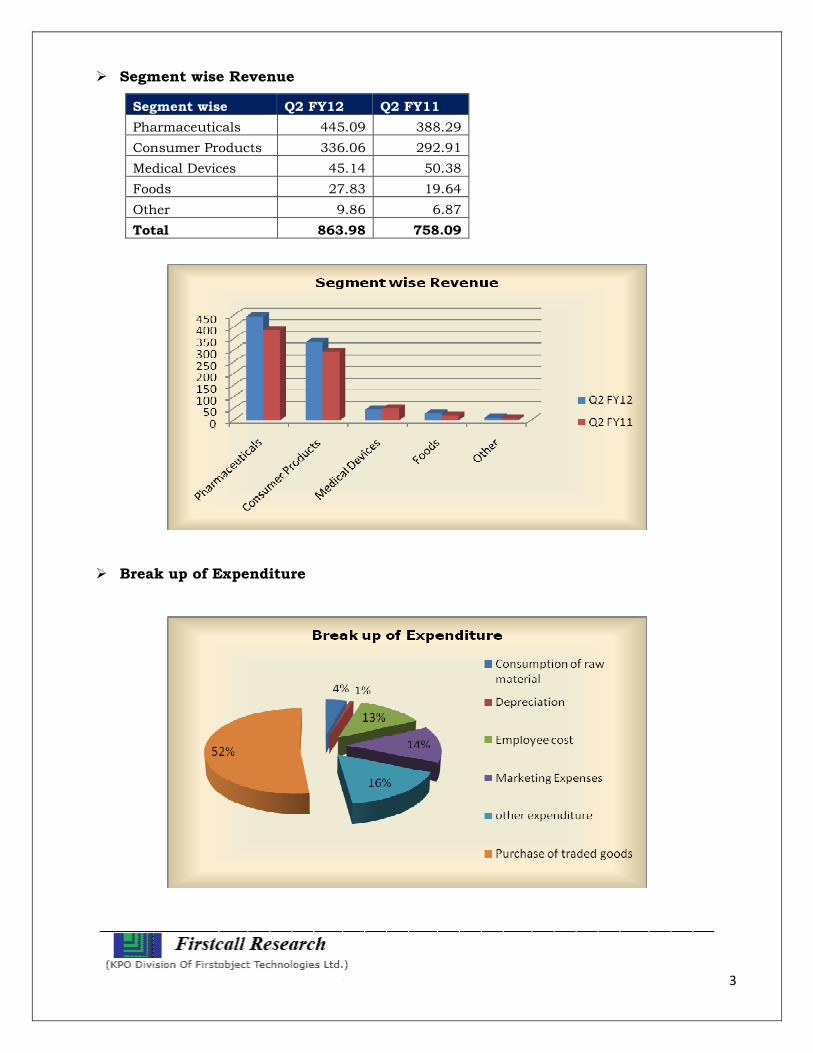
Q2 FY12 Results Update
Kajaria ceramics Ltd disclosed a phenomenon rise in standalone net sales for the
quarter ended Sep 2011. During the quarter, the profit of the company declined
8.25% to Rs 34.15 million from Rs 37.22 million in the same quarter previous year.
Net sales for the quarter for the quarter rose 13.92% to Rs 864.99 million from Rs
759.28 million, when compared with the prior year period. It reported earnings of
Rs 4.40 a share during the quarter, registering 8.25% declined over previous year
period.
Quarterly Results - Standalone (Rs in mn)
As At Sep-11 Sep -10 %change
Net sales 864.99 759.28 13.92
PAT 34.15 37.22 (8.25)
Basic EPS 4.40 4.79 (8.25)
3
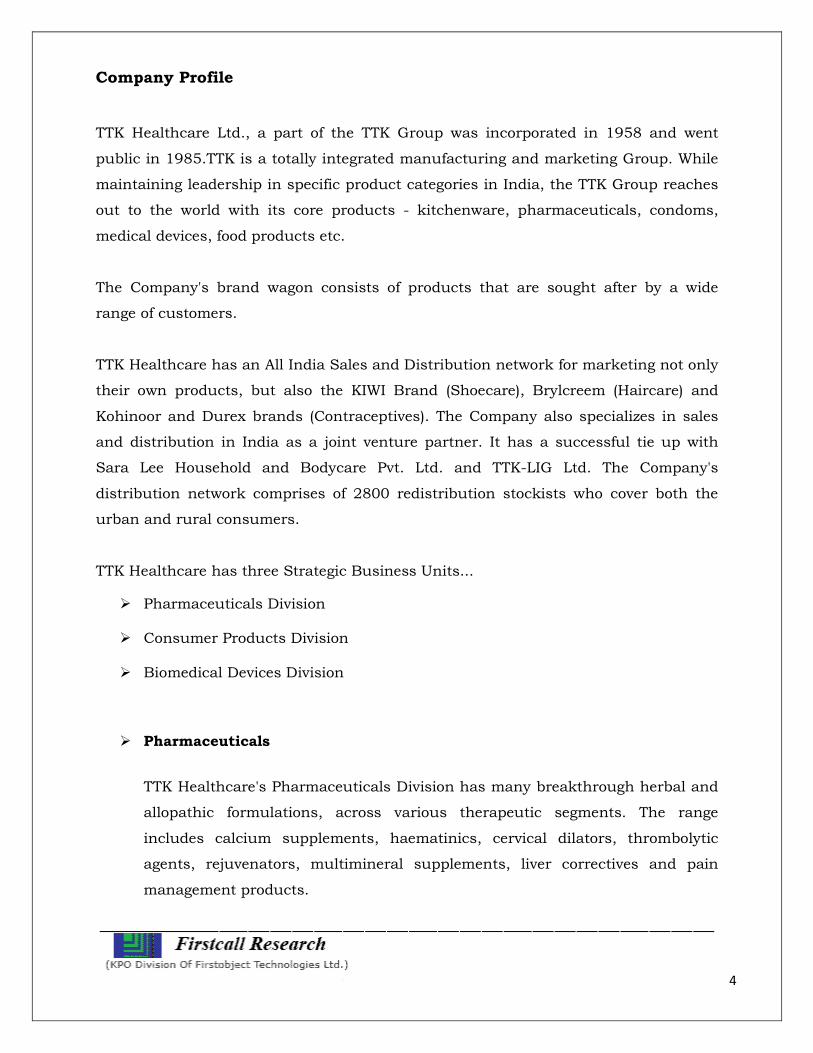
� Segment wise Revenue
Segment wise Q2 FY12 Q2 FY11
Pharmaceuticals 445.09 388.29
Consumer Products 336.06 292.91
Medical Devices 45.14 50.38
Foods 27.83 19.64
Other 9.86 6.87
Total 863.98 758.09
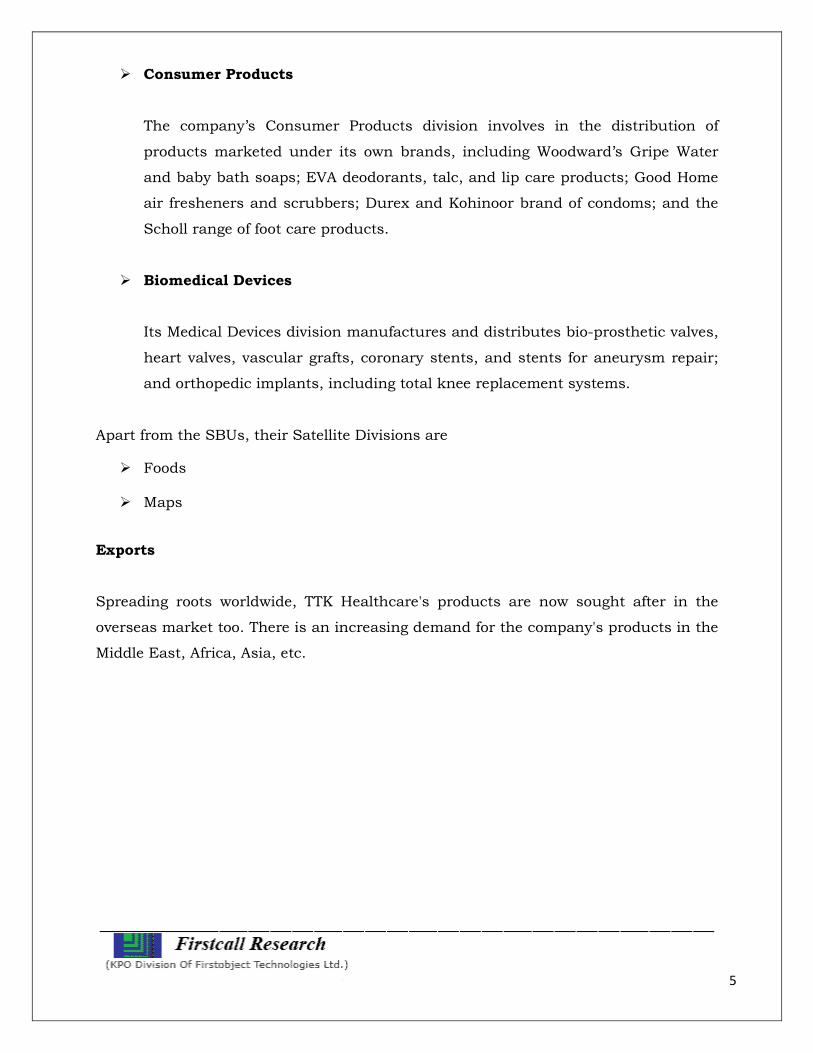
� Break up of Expenditure
4
Company Profile
TTK Healthcare Ltd., a part of the TTK Group was incorporated in 1958 and went
public in 1985.TTK is a totally integrated manufacturing and marketing Group. While
maintaining leadership in specific product categories in India, the TTK Group reaches
out to the world with its core products - kitchenware, pharmaceuticals, condoms,
medical devices, food products etc.
The Company's brand wagon consists of products that are sought after by a wide
range of customers.
TTK Healthcare has an All India Sales and Distribution network for marketing not only
their own products, but also the KIWI Brand (Shoecare), Brylcreem (Haircare) and
Kohinoor and Durex brands (Contraceptives). The Company also specializes in sales
and distribution in India as a joint venture partner. It has a successful tie up with
Sara Lee Household and Bodycare Pvt. Ltd. and TTK-LIG Ltd. The Company's
distribution network comprises of 2800 redistribution stockists who cover both the
urban and rural consumers.
TTK Healthcare has three Strategic Business Units...
� Pharmaceuticals Division
� Consumer Products Division
� Biomedical Devices Division
� Pharmaceuticals
TTK Healthcare's Pharmaceuticals Division has many breakthrough herbal and
allopathic formulations, across various therapeutic segments. The range
includes calcium supplements, haematinics, cervical dilators, thrombolytic
agents, rejuvenators, multimineral supplements, liver correctives and pain
management products.
5
� Consumer Products
The company’s Consumer Products division involves in the distribution of
products marketed under its own brands, including Woodward’s Gripe Water
and baby bath soaps; EVA deodorants, talc, and lip care products; Good Home
air fresheners and scrubbers; Durex and Kohinoor brand of condoms; and the
Scholl range of foot care products.
� Biomedical Devices
Its Medical Devices division manufactures and distributes bio-prosthetic valves,
heart valves, vascular grafts, coronary stents, and stents for aneurysm repair;
and orthopedic implants, including total knee replacement systems.
Apart from the SBUs, their Satellite Divisions are
� Foods
� Maps
Exports
Spreading roots worldwide, TTK Healthcare's products are now sought after in the
overseas market too. There is an increasing demand for the company's products in the
Middle East, Africa, Asia, etc.
6
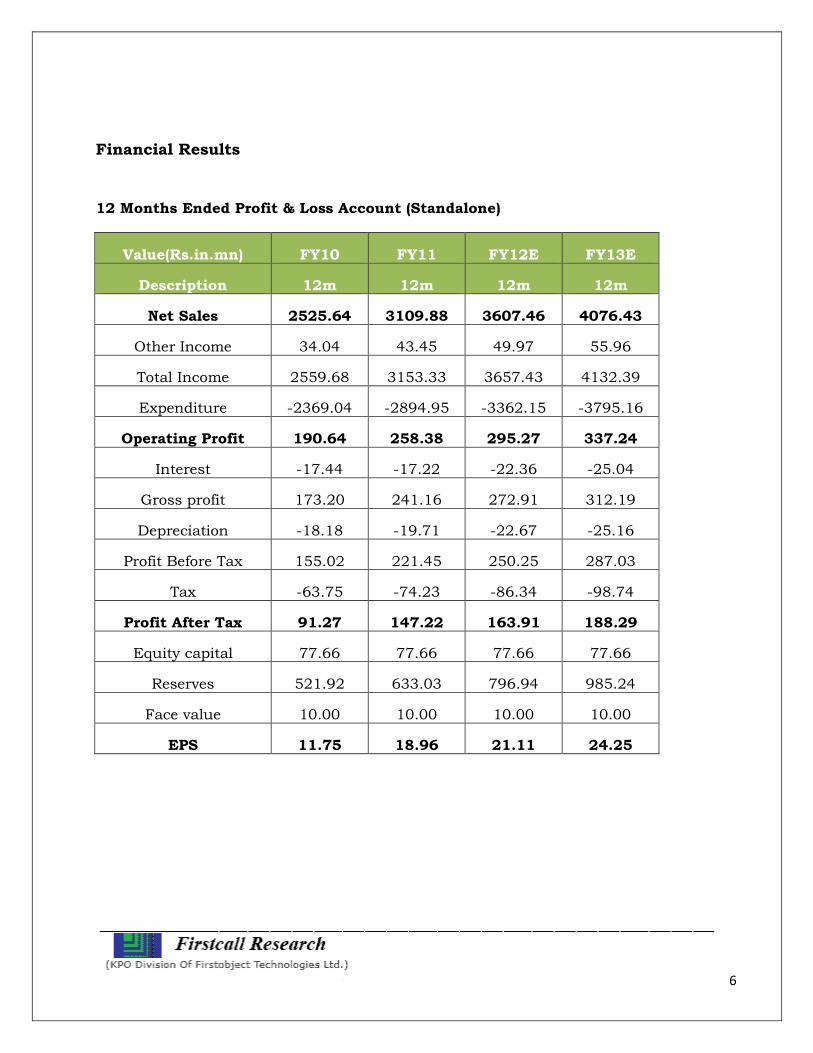
Financial Results
12 Months Ended Profit & Loss Account (Standalone)
Value(Rs.in.mn) FY10 FY11 FY12E FY13E
Description 12m 12m 12m 12m
Net Sales 2525.64 3109.88 3607.46 4076.43
Other Income 34.04 43.45 49.97 55.96
Total Income 2559.68 3153.33 3657.43 4132.39
Expenditure -2369.04 -2894.95 -3362.15 -3795.16
Operating Profit 190.64 258.38 295.27 337.24
Interest -17.44 -17.22 -22.36 -25.04
Gross profit 173.20 241.16 272.91 312.19
Depreciation -18.18 -19.71 -22.67 -25.16
Profit Before Tax 155.02 221.45 250.25 287.03
Tax -63.75 -74.23 -86.34 -98.74
Profit After Tax 91.27 147.22 163.91 188.29
Equity capital 77.66 77.66 77.66 77.66
Reserves 521.92 633.03 796.94 985.24
Face value 10.00 10.00 10.00 10.00
EPS 11.75 18.96 21.11 24.25
7
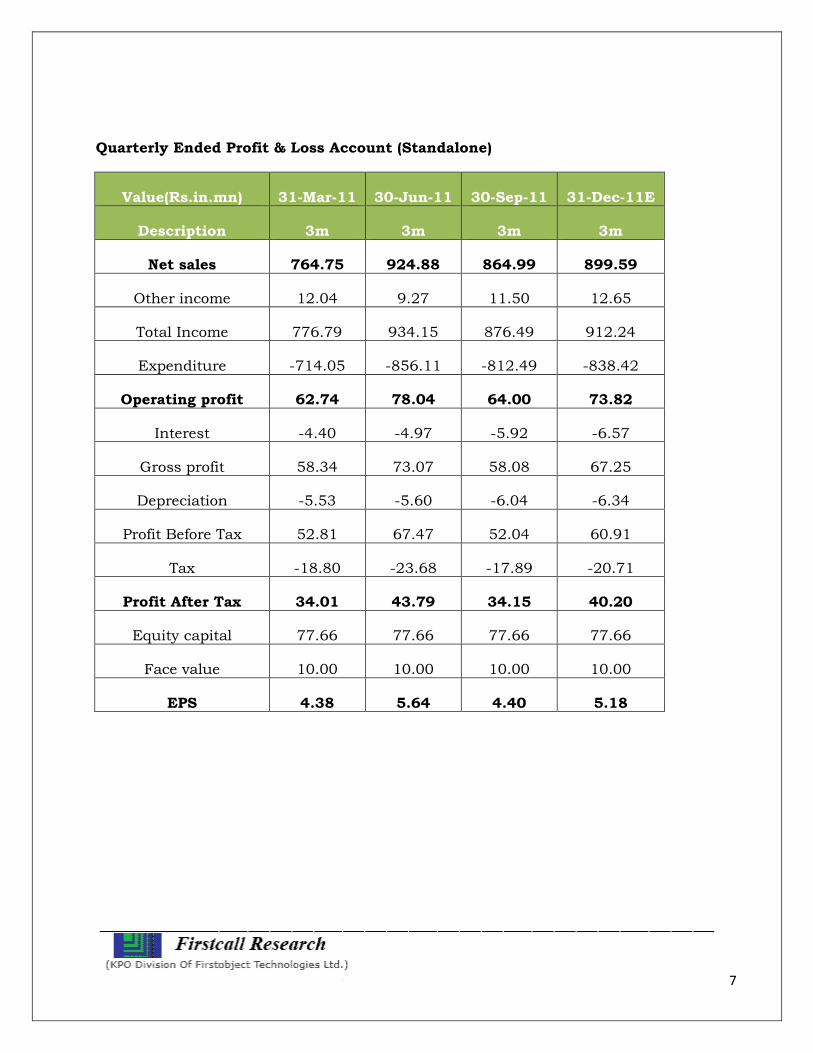
Quarterly Ended Profit & Loss Account (Standalone)
Value(Rs.in.mn) 31-Mar-11 30-Jun-11 30-Sep-11 31-Dec-11E
Description 3m 3m 3m 3m
Net sales 764.75 924.88 864.99 899.59
Other income 12.04 9.27 11.50 12.65
Total Income 776.79 934.15 876.49 912.24
Expenditure -714.05 -856.11 -812.49 -838.42
Operating profit 62.74 78.04 64.00 73.82
Interest -4.40 -4.97 -5.92 -6.57
Gross profit 58.34 73.07 58.08 67.25
Depreciation -5.53 -5.60 -6.04 -6.34
Profit Before Tax 52.81 67.47 52.04 60.91
Tax -18.80 -23.68 -17.89 -20.71
Profit After Tax 34.01 43.79 34.15 40.20
Equity capital 77.66 77.66 77.66 77.66
Face value 10.00 10.00 10.00 10.00
EPS 4.38 5.64 4.40 5.18
8
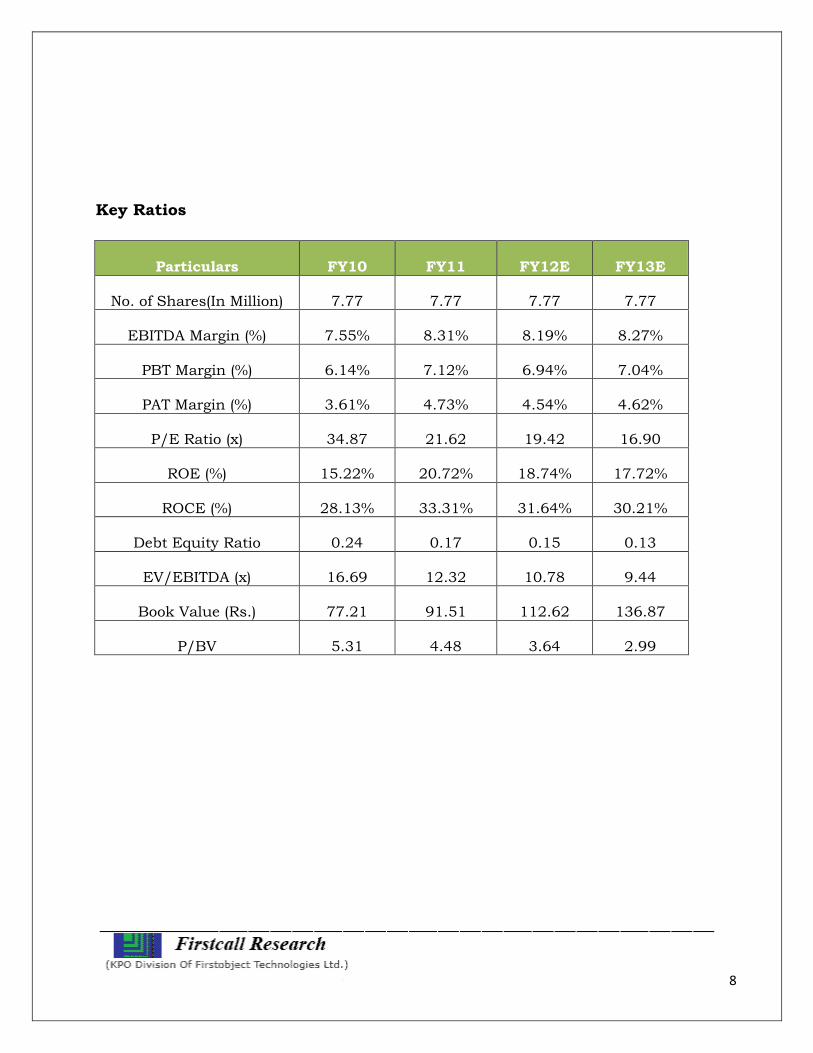
Key Ratios
Particulars FY10 FY11 FY12E FY13E
No. of Shares(In Million) 7.77 7.77 7.77 7.77
EBITDA Margin (%) 7.55% 8.31% 8.19% 8.27%
PBT Margin (%) 6.14% 7.12% 6.94% 7.04%
PAT Margin (%) 3.61% 4.73% 4.54% 4.62%
P/E Ratio (x) 34.87 21.62 19.42 16.90
ROE (%) 15.22% 20.72% 18.74% 17.72%
ROCE (%) 28.13% 33.31% 31.64% 30.21%
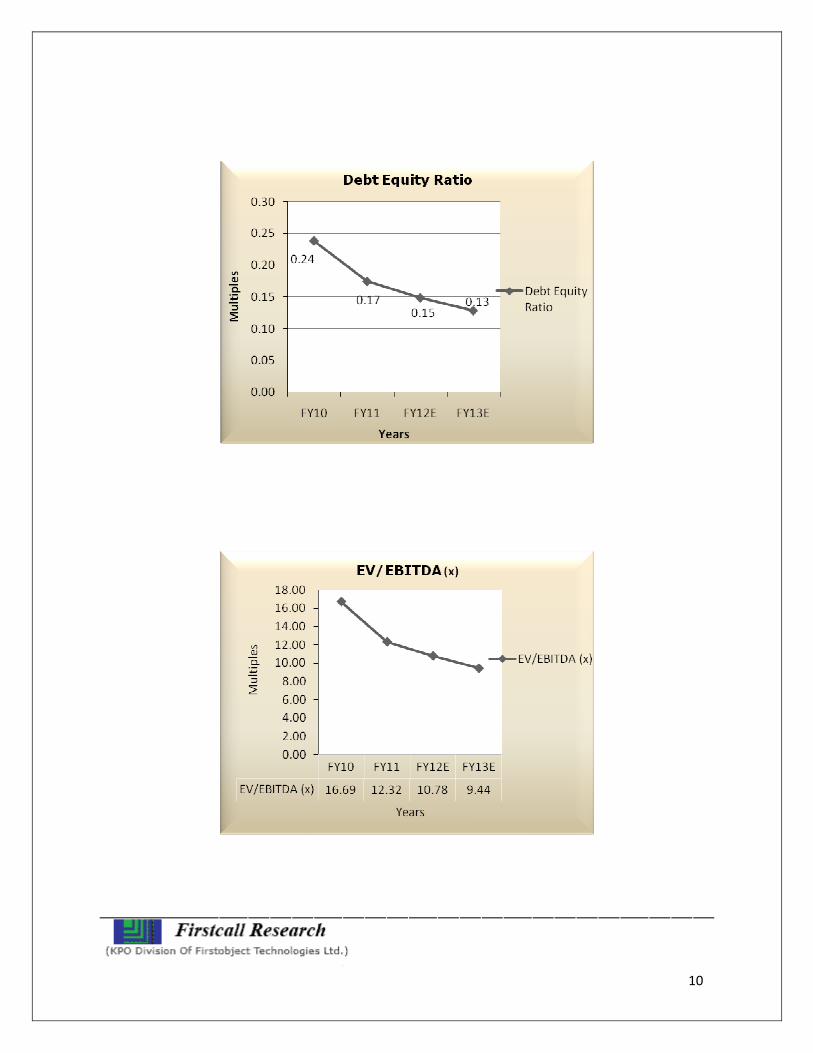
Debt Equity Ratio 0.24 0.17 0.15 0.13
EV/EBITDA (x) 16.69 12.32 10.78 9.44
Book Value (Rs.) 77.21 91.51 112.62 136.87
P/BV 5.31 4.48 3.64 2.99
9
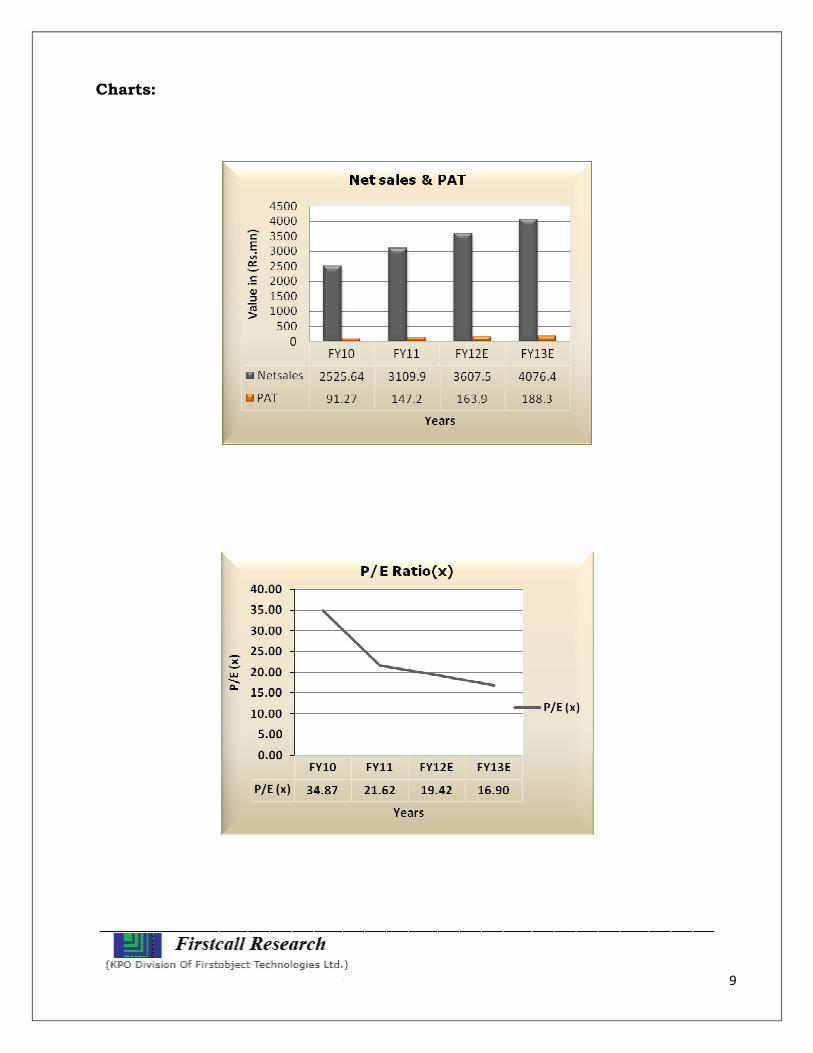
Charts:
10
11
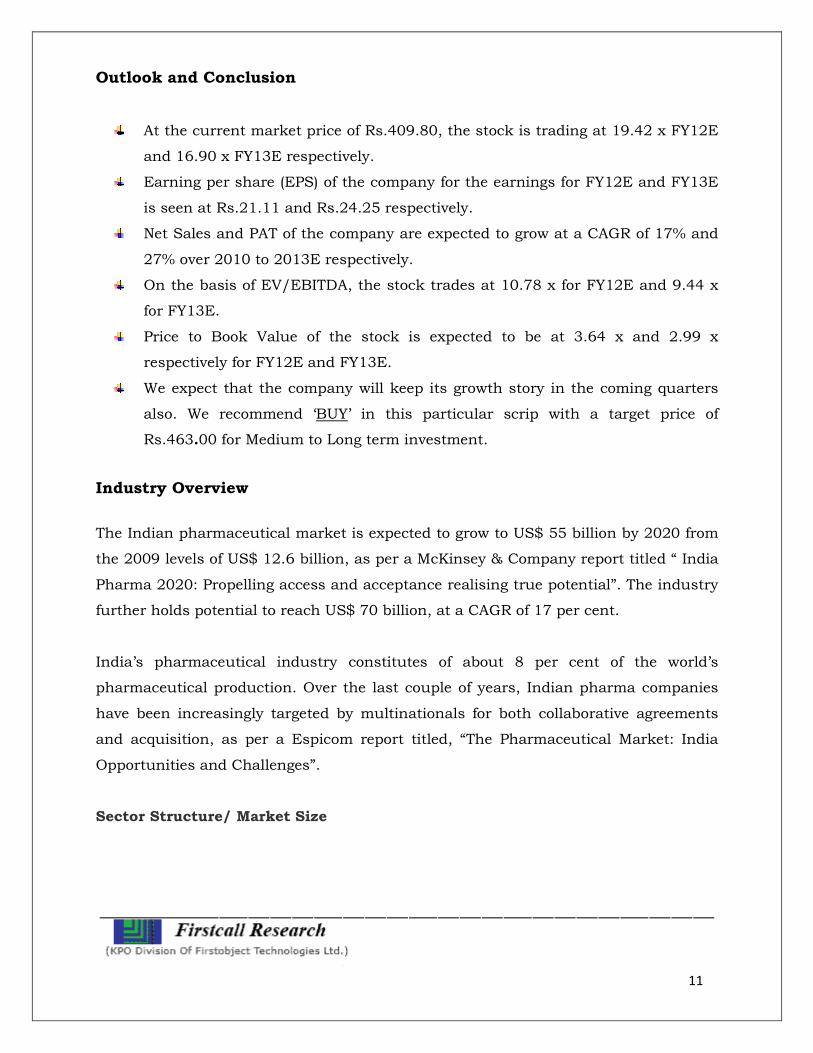
Outlook and Conclusion
At the current market price of Rs.409.80, the stock is trading at 19.42 x FY12E
and 16.90 x FY13E respectively.
Earning per share (EPS) of the company for the earnings for FY12E and FY13E
is seen at Rs.21.11 and Rs.24.25 respectively.
Net Sales and PAT of the company are expected to grow at a CAGR of 17% and
27% over 2010 to 2013E respectively.
On the basis of EV/EBITDA, the stock trades at 10.78 x for FY12E and 9.44 x
for FY13E.
Price to Book Value of the stock is expected to be at 3.64 x and 2.99 x
respectively for FY12E and FY13E.
We expect that the company will keep its growth story in the coming quarters
also. We recommend ‘BUY’ in this particular scrip with a target price of
Rs.463.00 for Medium to Long term investment.
Industry Overview
The Indian pharmaceutical market is expected to grow to US$ 55 billion by 2020 from
the 2009 levels of US$ 12.6 billion, as per a McKinsey & Company report titled “ India
Pharma 2020: Propelling access and acceptance realising true potential”. The industry
further holds potential to reach US$ 70 billion, at a CAGR of 17 per cent.
India’s pharmaceutical industry constitutes of about 8 per cent of the world’s
pharmaceutical production. Over the last couple of years, Indian pharma companies
have been increasingly targeted by multinationals for both collaborative agreements
and acquisition, as per a Espicom report titled, “The Pharmaceutical Market: India
Opportunities and Challenges”.
Sector Structure/ Market Size
12
The US$ 12 billion valued pharmaceutical industry in India is expected to grow at an
annual compound annual growth rate (CAGR) of 10-11 per cent. The industry spends
around 18 per cent of its revenue on research and development (R&D).
India is one of the most significant emerging markets for the global pharmaceutical
industry. Moreover, India is expected to join the league of top 10 global
pharmaceuticals markets in terms of sales by 2020 with the total value reaching US$
50 billion, according to a report by PricewaterhouseCoopers (PwC).
The domestic pharma market is expected to grow at a CAGR of 15 to 20 percent to
reach a value anywhere between USD 50 and 74 billion by 2020, says a PwC report
titled ‘India Pharma Inc: Enhancing Value through Alliances & Partnerships’.
Exports
India’s exports of drugs, pharmaceutical & fine chemicals stood at US$ 9.26 billion
during April 2010–Feb 2011, up 16.15 per cent as compared to US$ 7.97 billion in the
same period during the previous year. India’s exports has recorded a growth rate of
over 20.07 per cent, during the period of the two financial years in the study, the
exports to rest of the world has grown by 9 per cent, according to DGCIS data from
Pharmexcil Research.
India and Russia signed a memorandum of understanding (MoU) last year. Another
will be signed in December 2011, as per Mr Devendra Chaudhry, Joint Secretary,
Department of Pharmaceuticals. Indian pharma companies export drugs worth US$
600 million to Russia every year. Pharma sector accounts for the largest Indian export
to Russia.
Growth
The drugs and pharmaceuticals sector attracted foreign direct investments (FDI) worth
US$ 4.89 billion between April 2000 and August 2011, according to the latest data
published by Department of Industrial Policy and Promotion (DIPP).
13
Indian pharmaceutical market is predicted to grow to US$ 55 billion by 2020 from
US$ 12.6 billion in 2009, according to a report by McKinsey.
On back of a high middle-class population base, improvements in medical
infrastructure and the establishment of intellectual property rights, the Indian pharma
industry is estimated to grow manifold.
Generics
Generics will continue to dominate the market while patent-protected products are
likely to constitute 10 per cent of the pie till 2015, according to McKinsey report ‘India
Pharma 2015 - Unlocking the potential of Indian Pharmaceuticals market’. Moreover,
as per a press release by research firm RNCOS, the report titled ‘Booming Generics
Drug Market in India'. The report further projects the Indian generic drug market to
grow at a CAGR of around 17 per cent between 2010-11 and 2012-13.
India tops the world in exporting generic medicines worth US$ 11 billion. Currently,
the Indian pharmaceutical industry is one of the world's largest and most developed,
according to Mr Srikant Kumar Jena, Union Minister of State for Chemicals and
Fertilisers.
• Dr Reddy's Laboratories Ltd has entered into a MoU with Tokyo-based Fujifilm
Corporation to form a joint venture (JV) in Japan. The venture would develop,
manufacture and promote generic drugs in Japan
• Ranbaxy Laboratories announced that it is on track to launch the generic
version of the world's largest-selling drug, Lipitor-the anti-cholesterol pill, on
November 30, 2011 in the United States (US), as per Tsutomu Une, Chairman,
Ranbaxy
• Natco Pharma has applied for India's first compulsory licence to sell a generic
version of Bayer's patented medicine, stating in its application that the German
company's drug was unaffordable for the average Indian
14
• Natco Pharma has also entered into an exclusive agreement with Mabxience,
part of Chemo Sa Lugano of Switzerland. Natco will purchase four drug
substances (biogenerics) from Chemo Sa Lugano and use them for
manufacturing finished dosage pharma formulations
• British consumer goods major Reckitt Benckiser is converting its Baddi plant in
Himachal Pradesh into a global hub for manufacturing over-the-counter (OTC)
pharmaceutical products. The facility, will export Reckitt brands as well as
domestic Paras brands
Diagnostics Outsourcing/ Clinical Trials
In India, the clinical research industry is estimated to be a US$ 2.2 billion with a
healthy CAGR of 23 per cent. India is ranked as the third largest emerging market and
is growing fastest in conducting number of trials. The Indian diagnostic market is
projected to grow at a CAGR of more than 22 per cent between 2010 and 2012, as per
a RNCOS research report “Indian Diagnostic Market Analysis.”
Investments
• A six-member pre-trade mission from Maryland, US, visited the Ticel
Biotechnology Park and the biotechnology infrastructure facility, to explore
areas of collaboration in biotechnology and pharmaceuticals. The advance
planning team met with industry representatives and officials to explore
partnerships and investment opportunities
• Aurobindo Pharma Ltd has received final approval from the US Food & Drug
Administration (USFDA) to manufacture and market Gabapentin tablets.
Gabapentin tablets are the generic equivalent of Neurontin tablets of Pfizer
Pharmaceuticals, indicated for the treatment of partial seizures and other
nervous system disorders. Aurobindo now has a total of 139 abbreviated new
drug application approvals including 110 final approvals and 29 tentative
approvals from the US
15
• Strides Arcolab Ltd, maker of intellectual property led pharmaceutical products
announced that it has received US FDA approval for clindamycin injection,
USP, an antibiotic used to treat bacterial infections
• Sanofi-aventis Group is setting up its largest vaccine making facility in
Hyderabad. "The new plant, our biggest facility in the world, is coming up here,"
according to Christopher A Viehbacher, Chief Executive Officer, Sanofi-aventis
• GlaxoSmithKline (GSK) has set aside US$ 1-2 billion to support its expansion
plans in India. "We can afford a deal worth US$ 1- US$ 2 billion in the Indian
pharmaceutical space," as per Andrew Witty, global CEO, GSK
• Lupin is set to enter the US oral contraceptive market. The company has
received final approval from the US Food and Drug Administration (USFDA) to
market a generically similar version of Watson's oral contraceptive NOR-QD
tablets
• Singapore-based pharmaceuticals company Invida has agreed to acquire New
Delhi's Shalaks Pharmaceuticals for US$ 25 million
• A three-day pharma business meet of India, Latin America and Caribbean (LAC)
took place on September 28, 2011. "The objective of the meeting was to provide
business opportunity to Indian pharma exporters, especially Small and Medium
Enterprises," as per P V Appaji, Executive Director, Phamaceutical Export
Promotion Council
• Daiichi Sankyo Company Ltd and Ranbaxy Laboratories Ltd have announced
expansion of their business in Mexico, to maximise their hybrid business
model. As part of the plan, the two companies will launch Olmesartan
Medoxomil, used to treat high blood pressure, in Mexico before the year-end
• Aventis Pharma Ltd, a unit of France's Sanofi, plans to acquire unlisted
Universal Medicare's nutraceuticals business to boost its consumer healthcare
and wellness segment in India. Aventis was close to buying the over-the-counter
(OTC) business of Universal Medicare for about US$ 109.5 million
Government Initiative
A high-level inter-ministerial group chaired by the Prime Minister Mr Manmohan
Singh has decided to continue with the 100 per cent foreign direct investment (FDI)
16
regime in the pharmaceuticals sector. "There is going to be no cap. 100 per cent FDI
would be allowed," as per Arun Maira, Member, Planning Commission.
Marking a new trend of investments from foreign players in the Indian pharma sector,
the need for overseas investors to get a no-objection from their JV partner before
venturing out on their own or roping in another local firm has been removed by the
Pharmaceuticals Export Promotion Council. It is expected that this measure will
promote the competitiveness of India as an investment destination and be
instrumental in attracting higher levels of FDI and technology inflows into the country.
The Union Minister of Commerce and Industry and Minister of Trade and Industry,
Singapore, have signed a ‘Special Scheme for Registration of Generic Medicinal
Products from India’, which seeks to fast-track the registration process for Indian
Generic medicines in Singapore.
The Department of Pharmaceuticals has prepared a "Pharma Vision 2020" for making
India one of the leading destinations for end-to-end drug discovery and innovation and
for that purpose provides requisite support by way of world class infrastructure,
internationally competitive scientific manpower for pharma research and development
(R&D), venture fund for research in the public and private domain and such other
measures.
Road Ahead
On back of aggressive marketing initiatives, the pharma companies witnessed rural
market sales doubling. India's rural drug market grew by 18.8 per cent in the 12
months period ended April 2011 as compared with 10.9 per cent in the previous year.
With the focus of companies shifting to smaller deals catering to niche segments and
markets, partnerships seems to be the new norm in the pharmaceutical sector. Today,
domestic pharmaceutical majors are talking less of patent litigation and more of
patent settlements. The fight seems to be giving way to partnerships and experts
consider this the new way forward. Companies such as Ranbaxy and Dr Reddy’s were
known for big acquisitions.
17
Interestingly, the international drug-makers have introduced generic or low-priced
version of popular medicines and have also decreased prices of their existing products
- in order to increase their share in the globally important market - in India. The
Indian-makers business model is built around selling large volume of cheap generic
medicines at lower margins in the country, to add to twin purpose of affordability and
popularity.
"The industry posting healthy growth consecutively for the second year reflects the
inherent strengths of the industry and improving healthcare standards in the
country... demand for drugs and pharmaceuticals is on the rise, and is likely to
continue next year as well. The nutraceutical segment will continue to have better-
than-average growth with people getting more conscious of their general health and
well-being," as per Ganesh Nayak, Executive Director, Zydus Cadila.
________________ ____ _________________________ Disclaimer:
This document prepared by our research analysts does not constitute an offer or solicitation
for the purchase or sale of any financial instrument or as an official confirmation of any
transaction. The information contained herein is from publicly available data or other
sources believed to be reliable but do not represent that it is accurate or complete and it
should not be relied on as such. Firstcall India Equity Advisors Pvt. Ltd. or any of it’s
affiliates shall not be in any way responsible for any loss or damage that may arise to any
person from any inadvertent error in the information contained in this report. This document
is provide for assistance only and is not intended to be and must not alone be taken as the
basis for an investment decision.
18
Firstcall India Equity Research: Email – [email protected]
C.V.S.L.Kameswari Pharma
U. Janaki Rao Capital Goods
A. Rajesh Babu FMCG
H.Lavanya Oil & Gas
Ashish.Kushwaha Diversified
Firstcall India also provides
Firstcall India Equity Advisors Pvt.Ltd focuses on, IPO’s, QIP’s, F.P.O’s,Takeover
Offers, Offer for Sale and Buy Back Offerings.
Corporate Finance Offerings include Foreign Currency Loan Syndications,
Placement of Equity / Debt with multilateral organizations, Short Term Funds
Management Debt & Equity, Working Capital Limits, Equity & Debt
Syndications and Structured Deals.
Corporate Advisory Offerings include Mergers & Acquisitions(domestic and
cross-border), divestitures, spin-offs, valuation of business, corporate
restructuring-Capital and Debt, Turnkey Corporate Revival – Planning &
Execution, Project Financing, Venture capital, Private Equity and Financial
Joint Ventures
Firstcall India also provides Financial Advisory services with respect to raising
of capital through FCCBs, GDRs, ADRs and listing of the same on International
Stock Exchanges namely AIMs, Luxembourg, Singapore Stock Exchanges and
other international stock exchanges.
For Further Details Contact:
3rd Floor,Sankalp,The Bureau,Dr.R.C.Marg,Chembur,Mumbai 400 071
Tel. : 022-2527 2510/2527 6077/25276089 Telefax : 022-25276089
E-mail: [email protected]
www.firstcallindiaequity.com