Embed Size (px)
Citation preview
© 2010 The Shifting Patterns of Agricultural Production and Productivity Worldwide. The Midwest Agribusiness Trade Research and Information Center, Iowa State University, Ames, Iowa.
CHAPTER 11
The Changing Pattern and Sources ofThe Changing Pattern and Sources ofAgricultural Growth in IndiaAgricultural Growth in India
Alka Singh and Suresh Pal
1. INTRODUCTIONThe Indian economy has moved decisively to a higher path of growth in re-
cent years, making it one of the fastest-growing economies in the world. The rate of economic growth measured in real per capita gross domestic product (GDP) (1999-2000 prices) averaged less than 5% per year during the 1980s and 1990s, increasing to more than 7% per year during the period 2003-07 (Planning Com-mission 2008). The economy is now poised to sustain these more rapid rates of expansion, with the potential to bring signifi cant improvements to the lives of millions of the country’s poor.
In contrast, the country’s agricultural economy has performed erratically during the past several decades. Indian agricultural output, especially that of rice and wheat in irrigated areas, recorded a quantum jump in growth during the 1970s and 1980s in response to the widespread adoption of new seed- and fertilizer-based technologies. This was accompanied by substantial growth in rural infrastructure, mainly through public investments. The growth stimulus spread into rain-fed agricultural production beginning in the 1980s with the rapid adoption of high-yielding varieties of coarse cereals, oilseeds, pulses, and cotton. Rising yield growth and cropping intensities greatly contributed to buoy-ant agricultural growth, despite frequent instability due to weather events. The livestock sector, the second-largest component of India’s agricultural GDP, also
Alka Singh is a principal scientist and Suresh Pal is head of the Division of Agricultural Economics, Indian Agricultural Research Institute, New Delhi.

316 SINGH AND PAL
has had exemplary growth since the 1980s. However, this impressive overall growth performance obscures very different growth rates across different sectors, states, and social groups.
In recent years, agricultural growth has slowed, with wide year-to-year fl uc-tuations. Beginning in the early 1990s, agricultural growth was substantially below that of the non-agricultural sector, and the gap is widening. The com-paratively slow growth of agriculture would perhaps have been of less concern if there had been a commensurate decline in the percentage of the population dependent on agriculture. But this has not been the case; in fact, the offi cial sta-tistics showed that the agricultural population has continued to increase. This widening gap may seriously jeopardize the national goal of inclusive economic growth, as two-thirds of India’s population still depends on agriculture and al-lied sectors for gainful employment and a secure livelihood.
The diffi culty of improving agricultural productivity on a sustainable ba-sis is further compounded by increasing pressure on natural resources and the environment, the vulnerability of agriculture to external shocks like cli-mate change, and the fragmentation and small scale of Indian farms. Given these natural resource and structural constraints, agricultural growth must increasingly rely on sustained and improving productivity growth through continued technological and institutional innovations. There are some positive developments on these fronts that have helped maintain agricultural growth at a reasonable level and have thereby insulated the country from the recent global food crisis. In this chapter we examine the broad pattern of agricultural growth in the country, its sources and regional dimensions. We particularly underscore the recent success stories, diversifi cation patterns, and binding constraints.
In the next section we present the main characteristics of Indian agriculture and its changing contribution to India’s national economy. This is followed by a detailed discussion of the pattern of growth in agriculture, and the regional and commodity dimensions of that growth. Trends in total factor productivity are also reviewed at length in Section 3. An in-depth analysis of sources of growth in Indian agriculture—particularly recent trends in public investment such as irrigation, research, and infrastructure development—is provided in Section 4. In Section 5, we address challenges faced by Indian agriculture and the possible strategies for dealing with them. We conclude the chapter with some observa-tions about options for accelerating India’s agricultural growth.

THE CHANGING PATTERN AND SOURCES OF AGRICULTURAL GROWTH IN INDIA 317
2. AGRICULTURE IN THE INDIAN ECONOMYThe Indian economy has grown at an impressive rate in recent times. This
sharp uptrend in growth can be attributed in (perhaps signifi cant) part to a se-ries of economic reforms initiated by the government in the early 1990s. The composition of growth has also changed substantially. In earlier times, agricul-tural and manufacturing sectors fueled much of the country’s economic growth. Since the 1990s, a newly emerging services sector has been the main driver of growth, along with manufacturing, while the relative contribution of agricul-ture to current economic growth has shrunk signifi cantly. Agriculture’s share of Indian GDP fell from 37.9% during the early 1980s to less than half of that share (17%) during 2008-09. However, in real terms, Indian agriculture has con-tinued to grow, albeit at varying rates, owing to several factors. Agriculture has an impressive long-run record, from delivering the country from serious food shortages, to becoming food self-reliant, to growing a food-surplus economy. Agriculture still contributes signifi cantly to export earnings and is an important source of raw materials and demand for the booming non-agricultural sector. The country is increasingly taking its place in the global production marketplace as a leading producer of many agricultural commodities, including milk, wheat, rice, and cotton.
The shifting contribution of agriculture and other sectors of the economy is quite consistent with the evolution of economic growth witnessed in the devel-oped countries. In contrast to the slowdown in the rate of growth of agricultural output, non-agricultural GDP shows a robust and rising growth trend. And while agriculture’s share of total employment has declined, it is still a dominant source of employment, from employing 73.9% of the economically active population in 1973-74 down to 56.5% in 2004-05. A comparison of agriculture’s share of do-mestic output and employment shows that the decline in agriculture’s share of the labor force is slower than the decline in its share of output (Table 11.1). This clearly indicates the increasing gap between average incomes of workers engaged in agricultural and non-agricultural occupations and also highlights the inability of the non-agricultural sector to provide gainful employment to the masses.
Agricultural GDP grew by 3.5% per year during the 1980s (characterized by wider technology dissemination), which was substantially slower than the rate of growth of either the non-agricultural sector or the overall economy (Table 11.1). The 1980s pace of growth carried through to the middle of the 1990s, but there-after agricultural growth slowed to 2.5% for the following decade against a target

318 SINGH AND PAL
growth of 4% per year1 (Planning Commission 2008). The main challenge to In-dia’s agricultural sector continues to be the failure to meet growth targets, along with degraded natural resources, the predominance of rain-fed agriculture, and a preponderance of small farmers.
2.1. Structural Changes in AgricultureThough the relative contribution of agriculture to the national economy
has changed, the basic characteristics of Indian agriculture have not. Indian agriculture continues to be dominated by smallholders; in fact, their number has risen much faster in the recent period. As a result, there has been a sig-nifi cant reduction in the average size of a farm holding—close to one hectare at present (Table 11.2). Net cultivated area remains at around 140 million hectares, and more than half of this area is rain-fed. Much of the agricultural production is for domestic consumption, and only about one-tenth of the to-tal value of production is exported. The output of food grains has registered a two-fold increase since the early green revolution period (1970), and output has jumped again in recent years. One signifi cant shift in the growth process has been its source, with much of the more recent (post-1980) increase in output attributable to yield growth, followed by changes in cropping patterns, with a minimal contribution of area growth.
Table 11.1. Share of agriculture in India’s gross domestic product and employment
Source: MoF (Economic Survey, 2007-08).Note: Nominal values defl ated to 1999-2000 prices.aThe share was computed only for the terminal years.bData pertain to 1993-94, 1999-00, and 2004-05, respectively.
1The Government of India envisaged annual growth of 4% per year in the agriculture sector in its National Agricultural Policy, 2000, and Eleventh Five Year Plan (2007-2012).
Agriculture and Allied
Sector’s Sharea Real Average
Annual Growth Rate
Period
Total GDP at Factor Cost
Share in Employmentb
Total GDP
GDP Agriculture and Allied
Sector GDP Non-agriculture
(percentage) (percent per year) 1981-82 to 1990-91 31.4 61.0 5.4 3.5 6.4
1991-92 to 1996-97 27.8 56.6 5.7 3.7 6.6 1997-98 to 2006-07 18.5 52.1 6.6 2.5 7.9

THE CHANGING PATTERN AND SOURCES OF AGRICULTURAL GROWTH IN INDIA 319
The crop sector continued to be a principal component of overall agricultural output, accounting for more than two-thirds of the value of agricultural output in 2008, with the livestock sector accounting for about one-quarter of total out-put (Table 11.3). Since the early 1980s there has been a modest decline in the crop sector’s share of agricultural output while the livestock and fi sheries sectors increased their respective market shares. The increasing share of output coming from the livestock sector—17.5% in the triennium ending (TE) 1981 to 24.5% in 2006 (Table 11.3)—refl ects both supply-side and demand-side factors. Livestock production is considered to be remunerative and labor intensive, and thus it suits the needs of smallholders. At the same time, Indian farmers are responding well to opportunities in commercial agriculture and diversifying to meet the rising demand for livestock products. Milk and milk products now make a major contri-bution to livestock output, such that India is now the largest milk producer in the world. The livestock sector has also diversifi ed, with more production of poultry meat and eggs over recent years. The fi shery sector still accounts for less than 5% of agricultural GDP, albeit with a steadily increasing share over the past several decades. However, the sector saw a considerable shift from marine to inland pro-duction, with inland production becoming increasingly important of late.
The crop sector is dominated by food grains production, which accounted for about 64.5% of the total cropped area during 2005-06. Food grains pro-duction increased markedly, to total 230 million metric tons in 2008, through
Indicator 1971 1981 1991 2001 2006
Average size of holding (ha) 2.30 1.84 1.57 1.33 n.a.
Net cultivated area (mha) 139.72 141.93 141.63 141.45 141.89
Total cropped area (mha) 165.19 176.75 182.24 189.75 192.80
Total irrigated area (mha) 38.43 51.41 65.68 78.73 82.63
Share of rural population (%) 80.1 76.7 74.3 72.2 n.a.
Share of exports in AgGDP (%) 2.7 3.9 4.4 6.1 9.1
Share of agriculture in national GDP (%)
40.6 34.4 29.6 23.2 18.2
Total food grain production (million tons)
105.17 133.30 168.38 212.85 217.28
Food grain yield (metric tons/ha) 0.85 1.03 1.38 1.73 1.76
Table 11.2. Major trends in Indian agriculture
Sources: Compiled from MoA (various years) and CSO (various years).
320 SINGH AND PAL
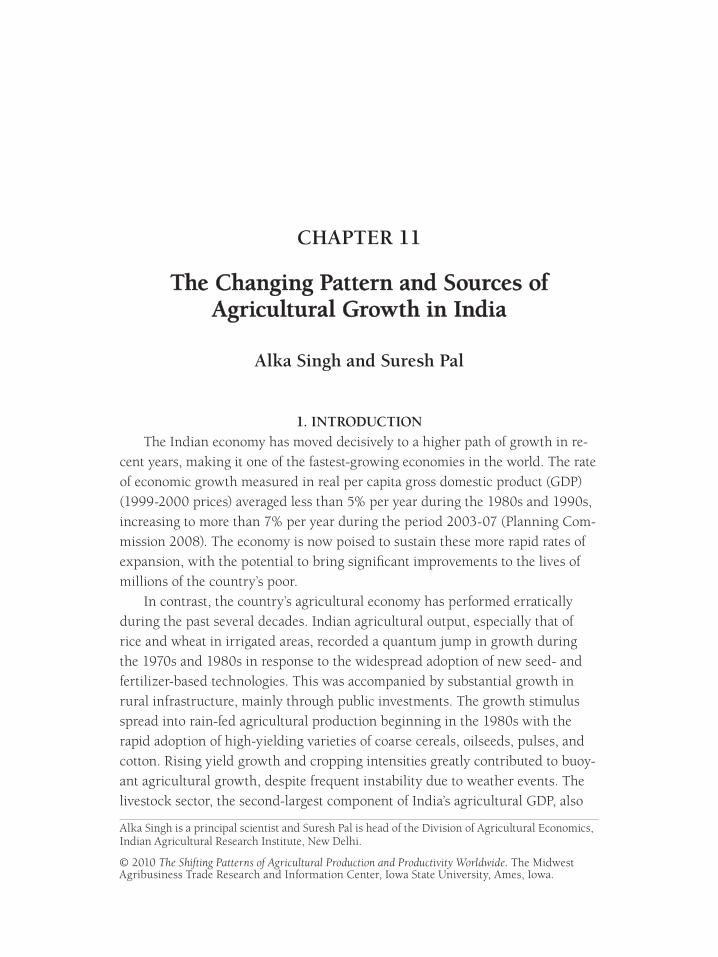
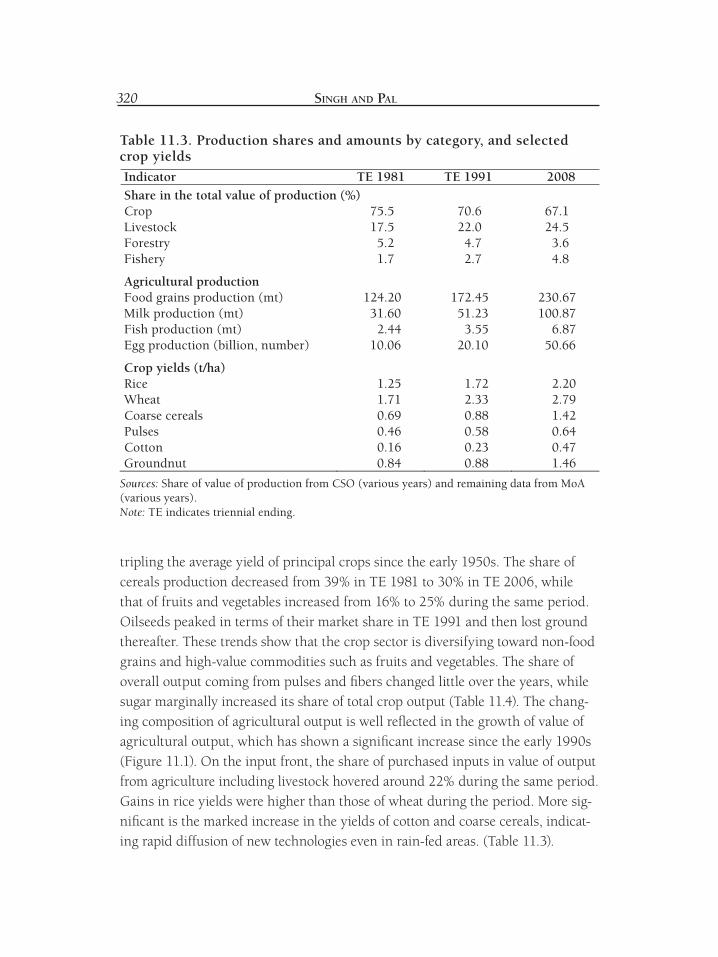
tripling the average yield of principal crops since the early 1950s. The share of cereals production decreased from 39% in TE 1981 to 30% in TE 2006, while that of fruits and vegetables increased from 16% to 25% during the same period. Oilseeds peaked in terms of their market share in TE 1991 and then lost ground thereafter. These trends show that the crop sector is diversifying toward non-food grains and high-value commodities such as fruits and vegetables. The share of overall output coming from pulses and fi bers changed little over the years, while sugar marginally increased its share of total crop output (Table 11.4). The chang-ing composition of agricultural output is well refl ected in the growth of value of agricultural output, which has shown a signifi cant increase since the early 1990s (Figure 11.1). On the input front, the share of purchased inputs in value of output from agriculture including livestock hovered around 22% during the same period. Gains in rice yields were higher than those of wheat during the period. More sig-nifi cant is the marked increase in the yields of cotton and coarse cereals, indicat-ing rapid diffusion of new technologies even in rain-fed areas. (Table 11.3).
Indicator TE 1981 TE 1991 2008
Share in the total value of production (%) Crop 75.5 70.6 67.1 Livestock 17.5 22.0 24.5 Forestry 5.2 4.7 3.6 Fishery 1.7 2.7 4.8
Agricultural production Food grains production (mt) 124.20 172.45 230.67 Milk production (mt) 31.60 51.23 100.87 Fish production (mt) 2.44 3.55 6.87 Egg production (billion, number) 10.06 20.10 50.66
Crop yields (t/ha) Rice 1.25 1.72 2.20 Wheat 1.71 2.33 2.79 Coarse cereals 0.69 0.88 1.42 Pulses 0.46 0.58 0.64 Cotton 0.16 0.23 0.47 Groundnut 0.84 0.88 1.46
Table 11.3. Production shares and amounts by category, and selected crop yields
Sources: Share of value of production from CSO (various years) and remaining data from MoA (various years).Note: TE indicates triennial ending.
THE CHANGING PATTERN AND SOURCES OF AGRICULTURAL GROWTH IN INDIA 321
2.2. Agricultural Trade India’s agricultural trade is diverse, ranging from raw products to processed
and ready-to-eat items. The share of India’s agricultural exports in total exports has varied between 11% and 15% since 2000. During 2007-08, the value of agri-cultural exports totaled more than U.S.$7 billion, of which marine products and oil meal were among the largest contributors. The composition of agricultural trade has changed signifi cantly in the recent period. The proportion of Indian agricultural exports coming from fruits and vegetables, fl owers, cotton, sugar
Figure 11.1. Value of agricultural output and input (1999-2000 prices) Source: Period from CSO (various years, www.mospi.gov.in).Note: Nominal values defl ated to 1999-2000 prices.
Crop Group TE 1981 TE 1991 TE 2001 TE 2006 (percentage)Cereals 38.7 35.9 33.8 30.1Pulses 6.1 6.4 4.9 5.2Oilseeds 8.6 12.0 7.9 8.5Fruits and vegetables
16.3 17.2 24.1 25.0
Sugar 5.1 4.9 6.4 7.3Fibers 4.4 4.3 3.3 4.0
Table 11.4. Compositional changes within crop sectors
Sources : CSO (various years), NAAS (2009).Notes: TE indicates triennial ending. Data are percent shares of value of crop productions.

322 SINGH AND PAL
and molasses, and livestock products has increased considerably. Cereals (mostly basmati and non-basmati rice), tea, coffee, cashews, and spices are other promi-nent products, each accounting for between 5% and 10% of the country’s total agriculture exports. India’s agricultural imports, on the other hand, have consti-tuted only a small portion of the country’s total imports (less than 5%) during the current decade. The country imports mainly vegetable oil and pulses, which alone account for about 70% of total agricultural imports.
3. AGRICULTURAL GROWTH PATTERNAgricultural growth was signifi cant during the 1980s and early 1990s, as
evidenced by the performance of the crops, livestock, and fi sheries sectors (Table 11.5). The crop sector showed modest (but still substantial) growth during the early 1990s, but it consistently slowed down thereafter. The rate of growth in livestock production also began to slow in the mid-1990s but has remained higher than the corresponding rate of growth in food grains and oilseeds. There is a noticeable decline in growth rates after the mid-1990s across all agricultural sectors, with growth in some sectors (including pulses and oilseeds, livestock, and fi sheries) rebounding in recent years. A substantial cause for concern has been the ratcheting down in the pace of growth of cereals output in recent de-cades, given the fact that the substantial share of agricultural output still derives from this sector and is the mainstay of India’s food security. Consequently, the
Crops
Period Cereals
Pulses and
Oilseeds Fruits and Vegetables
Other Crops
All Crops Livestock Fishery
(percent per year)
1981-82 to 1990-91
3.52 5.41 2.84 1.71 2.97 4.78 5.74
1991-92 to 1996-97
2.36 2.92 6.07 2.18 3.09 4.00 7.05
1997-98 to 2001-02
1.49 -1.43 4.11 3.82 2.25 3.53 2.63
2002-03 to 2006-07
1.28 4.29 2.97 2.25 2.46 3.69 3.23
Table 11.5. Period average growth of real agricultural output by sector
Source: Planning Commission (2008).Note: Respective nominal totals defl ated to 1999-2000 prices.

THE CHANGING PATTERN AND SOURCES OF AGRICULTURAL GROWTH IN INDIA 323
overall rate of growth of agricultural GDP has been well below a target rate of 4% per year. The annual data suggest that the rate of growth of crop output peaked by the mid-1990s and has slowed afterward. In contrast, the horticulture sector exhibited impressive output growth throughout the entire 1990s. Although it, too, slowed thereafter, it has sustained a rate of output growth that is more than twice as fast as the corresponding growth in cereals output. However, food grain production spiked in 2008 as global commodity prices soared, while the high-value livestock, fi sheries, and fruits and vegetables sectors sustained growth rates of at least 3% per year.
One fact concealed in these period averages is the wide year-to-year fl uctua-tions in growth performance. In some years, growth rates increased by as much as 10% (between 2002-03 and 2003-04) compared with the average growth of 4.5% between 2002-03 and 2006-07. Unfavorable weather conditions cor-responded with low-growth years, and these lowered the overall growth rate. However, excluding the abnormally poor years of 2002-03 and 2004-05, the av-erage growth of GDP from agriculture and allied sectors (1999-2000 prices) dur-ing the 1997-98 to 2008-09 period was estimated at 3.7% per year.
3.1. Agricultural Diversifi cation Indian agricultural production began to diversify gradually in the 1980s,
as refl ected by changes in sectoral and crop contributions to the total value of agricultural output, and this trend began to accelerate during the 1990s. This pattern is visible in the distinctly different growth patterns between food grains and non-food grains. The share of area under food grains has declined since the early 1980s, with a small decline in the share of area under rice and wheat, compounded by a marked decline in the area under coarse cereals (Table 11.6). Notwithstanding these shifting area shares, the yields of coarse cereals grew at markedly higher rates than yields for other grains such as rice and wheat, espe-cially during the 1990s (Table 11.6). The offi cial statistics show that about 60% of the cropped area for coarse cereals in the late 1990s was planted to high-yield-ing varieties, even though the coverage of irrigation was much lower for coarse grains. Among the food grains, the growth scenario is completely different for pulses, as shown by the crop’s declining growth in output, area, and yield, espe-cially during the 1990s. However, during the last decade, there was appreciable acceleration in the growth of pulse production, owing to growth in both area and yield. The growth performance of oilseeds as a group surpassed that all of

324 SINGH AND PAL
Cro
p G
rou
p
1980
-81
to 1
990-
9119
90-9
1 to
199
9-20
00
2000
-01
to 2
006-
07
Are
a P
rod
uct
ion
Y
ield
A
rea
Pro
du
ctio
n
Yie
ld
A
rea
Pro
du
ctio
nY
ield
(p
erce
nt
per
year
) F
ood
grai
ns
-0.2
3 2.
85
2.74
-0
.07
2.02
1.
52
0.
48
2.09
2.
82
Cer
eals
-0
.26
3.03
2.
90
0.04
-0
.02
1.59
0.16
1.
95
3.10
C
oars
e ce
real
s -1
.34
0.40
1.
62
-2.1
2 -0
.02
1.82
-0.4
1 3.
25
4.25
P
uls
es
-0.0
9 1.
52
1.61
-0
.60
0.59
0.
93
1.
91
3.42
1.
65
Non
-foo
d gr
ain
s 1.
12
3.77
2.
31
1.18
2.
69
1.09
2.46
5.
09
3.87
O
ilse
eds
1.51
5.
20
2.43
-0
.86
1.63
1.
15
2.
71
6.69
4.
91
Cot
ton
-1
.25
2.80
4.
10
2.71
2.
29
-0.4
1
1.45
17
.48
15.7
9 A
ll p
rin
cipa
l cro
ps
0.10
3.
19
2.56
0.
27
2.29
1.
33
1.
06
3.17
3.
80
Tab
le 1
1.6.
Are
a, p
rod
uct
ion
, an
d y
ield
gro
wth
rat
es o
f p
rin
cip
al c
rop
s in
In
dia
Sour
ce: M
oA (
2008
).N
otes
: Are
a re
pres
ents
pla
nte
d ar
ea o
f ea
ch c
rop
cate
gory
. Are
a, p
rodu
ctio
n, a
nd
yiel
d gr
owth
rat
es c
alcu
late
d as
an
nu
al a
vera
ge g
row
th o
f re
spec
tive
are
a, o
utp
ut,
an
d yi
eld
inde
xes
(bas
e: t
rien
niu
m e
ndi
ng
1981
-82=
100)
.

THE CHANGING PATTERN AND SOURCES OF AGRICULTURAL GROWTH IN INDIA 325
other crop groups during the 2001-07 period and was distinctly superior to its past rates of growth. Both area and, particularly, yield components contributed signifi cantly to this dramatic expansion in output. More importantly, unlike the slowdown in output growth of cereals and pulses during the 1990s, oilseed output continued to expand. Of India’s major cash crops, cotton merits special mention because of its strong growth performance, especially in recent years. This was made possible mainly through signifi cant advances in seed technology, especially Bt cotton and the resulting high growth in yield per hectare (Qaim et al. 2006; Gandhi et al. 2006).
The livestock sector is also noteworthy, as its overall growth performance outpaced that of the crop sector by a wide margin, enabling the country to enjoy higher per capita availability of milk and other livestock products. However, the pace of growth dropped steadily, from 4.8% in the 1980s to 3.7% during 2002-06 (Table 11.5). Milk and milk products constitute around two-thirds of all livestock output (by value) and thus heavily infl uence the overall trend for the sector. How-ever, considerable diversifi cation toward production of poultry meat and eggs has occurred, as evident from the spectacular growth of these commodities since the 1980s. The share of meat and meat products in total agricultural output has re-mained fairly stable over the last three decades (Chand and Raju 2008).
What are the major drivers of agricultural diversifi cation toward high-value commodities? There are a number of factors responsible for this shift. The most important among these is greater demand for high-value commodities such as fruits, vegetables, and livestock products as per capita incomes increase. As in-comes rise, people consume more higher-value commodities and less traditional food items such as cereals. This effect has been more pronounced in the recent past because of the spectacular growth in the Indian economy. Demographic changes are also at play, including increased urbanization, increased female literacy, and increased participation of women in the workforce, especially in urban areas and small towns. These demand-side factors were matched by posi-tive developments on the supply side. Farmers responded to the incentives of-fered by high-value commodities, both for domestic and international markets. This was particularly true for the fruits and vegetables, poultry, and fi sheries sectors, in which new farming opportunities and technologies emerged. Imports of improved seed varieties and planting materials were permitted under a new seed policy introduced during the late 1980s. Because these commodities pro-vided comparatively high and regular returns to smallholders in a short period,

326 SINGH AND PAL
farmers directed resources to these areas. Finally, the participation of the private sector in retail marketing and input supply and other production-enhancing un-dertakings, including new forms of contractual arrangements with growers, pro-vided further impetus to the growth of high-value commodities (Joshi, Gulati, and Cummings 2007).
3.2. Regional Patterns of Agricultural GrowthThe structure and regional distribution of agricultural production varies mark-
edly among regions and states. At the national level, the rate of growth in net state domestic product (NSDP)2 from agriculture slowed signifi cantly when comparing the period 1984-85 to 1995-96 with the period 1995-96 to 2004-05 (Table 11.7). Almost all the major states of India, except Bihar and Orissa, the two poorest states, exhibited impressive rates of growth during the earlier period. This period is in fact a turning point in Indian agriculture, as the sector witnessed not only im-pressive growth rates but also better distribution of growth among different states of the country. Notable was the growth performance of the rain-fed states of Mad-hya Pradesh and Rajasthan, primarily because of large shifts from coarse cereals to oilseed production. The shift toward oilseeds refl ected the commodity’s relative profi tability fueled by an appreciable increase in administered prices coupled with a faster rate of yield growth compared with coarse cereals. Both these effects were realized through concerted government efforts under the Oilseed Mission.3 Anoth-er important development was the impressive growth performance of West Bengal, especially in rice production. The spread of modern seed varieties and an increase in area cultivated under summer (boro) paddy with improved irrigation and input management contributed to this performance. Gujarat also deserves special men-tion, as it has attained 9.6% growth per year in agricultural state domestic product since 1999-2000. The main sources of its growth are a massive boom in cotton production, growth in high-value commodity groups like livestock, and fruits and vegetables, and wheat production (Gulati, Shah, and Shreedhar 2009).
The national slowdown in agricultural output growth during the post-1995-96 period was evident in all states except Bihar. The slowdown even affected
2NSDP is one of the important indicators for measuring economic growth in states and union ter-ritories of the country.3The Oilseed Mission was launched by the Indian government in 1986 to increase oilseed production and achieve self-suffi ciency in edible oils. Subsequently, pulses, oil palm, and corn were also brought within the purview of the Mission in the early 1990s.

THE CHANGING PATTERN AND SOURCES OF AGRICULTURAL GROWTH IN INDIA 327
the comparatively well developed northwestern region of the country, including states such as Punjab and Haryana. Many other states in rain-fed regions of the country, which account for 60% of the total cultivated area, also saw signifi -cantly poorer growth performances during this period. These rain-fed areas are characterized by relatively higher incidences of poverty, more limited (off-farm) employment opportunities, higher production risks, and high rates of out-migra-tion, and thus the slowdown in these areas is particularly problematic.
Although growth in agricultural output has slowed in recent years, there are some signifi cant exceptions to this general trend. For example, corn pro-duction has increased rapidly (5% per year from 1997 to 2007) as the intro-
State
Growth of Net State Domestic Product in
Agriculture
Net State Domestic Product
Yield of Food
Grains
Rural Population Below the National Poverty
Line 1984-85 to
1995-96 1995-96 to
2004-05 2007-08 2006-07 2004-05 (percent per year) (Rs/ha, 1000s) (t/ha) (percent)Punjab 4.00 2.16 53.4 4.02 9.10 Haryana 4.60 1.98 48.5 3.39 13.60 Uttar Pradesh 2.82 1.87 37.4 2.06 33.40 Tamil Nadu 4.95 -1.36 64.2 2.61 22.80 West Bengal 4.63 2.67 69.0 2.51 28.60 Bihar -1.71 3.51 35.2 1.66 42.10 Andhra Pradesh
3.18 2.69 56.4 2.23 11.20
Gujarat 5.09 0.48 34.1 1.42 19.10 Rajasthan 5.52 0.30 19.1 1.12 18.70 Orissa -1.18 0.11 27.7 1.36 46.80 Madhya Pradesh
3.63 -0.23 17.7 1.17 36.90
Maharashtra 6.66 0.10 34.1 0.94 29.60 Karnataka 3.92 0.03 28.4 1.29 20.80 Kerala 3.60 -3.54 74.6 n.a. 13.20 Assam 1.65 0.95 47.3 1.29 22.30 All India 3.62 1.85 40.6 1.76 28.30
Table 11.7. Measures of state agricultural and economy-wide activity
Sources: State domestic product from CSO (various years); yield from MoA (2008); poverty indicator from Planning Commission.

328 SINGH AND PAL
duction of winter corn and use of modern hybrids has spread rapidly. The area under corn also continues to expand, even in the states that typically have grown little if any corn such as Karnataka and Andhra Pradesh in southern India. Much of the crop was used as feed in the fl ourishing poultry sector in these southern states. Beginning in the 1980s, the production of boro rice also increased markedly, especially in the eastern part of the country. This was further enhanced by the spread of hybrid rice, which offers signifi cant yield advantages (up to two metric tons per hectare) over conventionally bred variet-ies. The northern states have had no signifi cant spurt in productivity growth, but they have maintained their comparatively high yields, with impressive improvement in the grain quality of rice. Yields have not improved in the pulses at the aggregate level but crop duration has been reduced, particularly in pigeon peas and chick peas, which has extended their reach into several non-traditional areas. The spread of Bt hybrids has improved yields in cot-ton. Similarly, farmers’ access to improved varieties of vegetable seeds has led to increased production in the eastern, southern, and hill states characterized by predominantly small farms. All of these developments, among others, have contributed to the growth of Indian agriculture.
3.3. Partial and Total Factor Productivity Trends Crop growth performances clearly show that the relative roles of area expan-
sion and yield growth varied among crops. As a general rule, yield growth con-tributed more than area expansion to the growth in output for most crops, with the exception of cotton during the 1990s when yield growth was negative (Table 11.6). However, yield growth for all principal crops taken together slowed from an average of 2.56% per year during the 1980s to 1.33% per year during the 1990s, and the same pattern held true for most of the crops. The growth in crop yield, especially of coarse cereals and non-food grains, showed signs of recovery in more recent years. Cotton yields continued to decline during the 1990s, but development of hybrid cotton varieties, better pest management practices, and the introduction and rapid adoption of Bt cotton led to a rapid turnaround, with double-digit growth in yield and production after 2000.
Although yields have tended to increase over time in most of the states, and for all of India, there remains large spatial (state) variation in crop yields. The states with the highest productivity measured in terms of net state domestic product (measured in rupees [Rs] per hectare of total cropped area in the state in
THE CHANGING PATTERN AND SOURCES OF AGRICULTURAL GROWTH IN INDIA 329
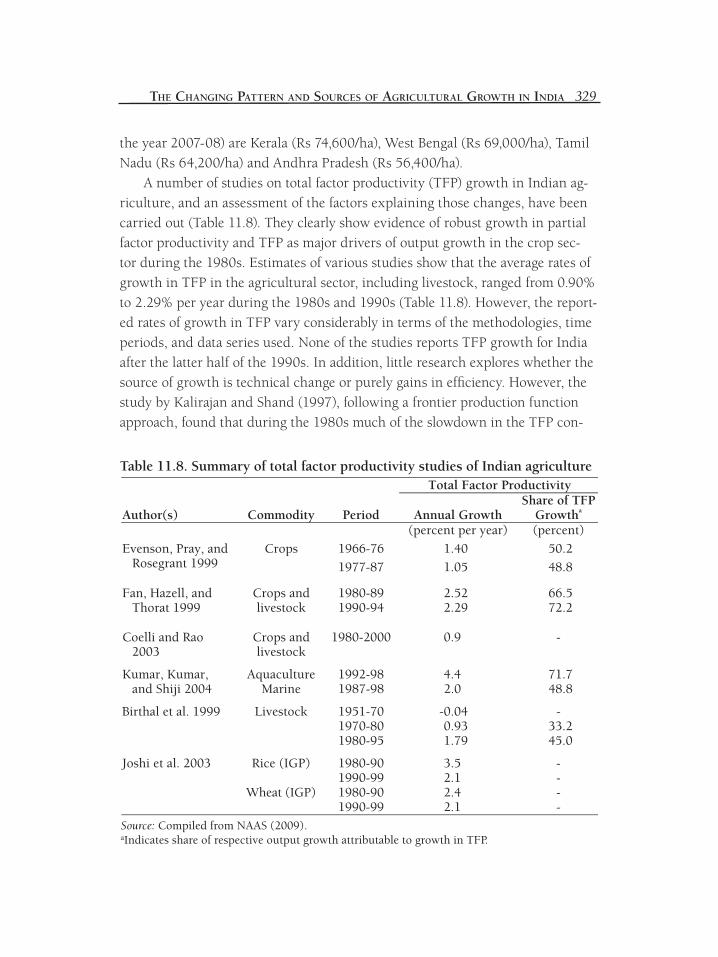
the year 2007-08) are Kerala (Rs 74,600/ha), West Bengal (Rs 69,000/ha), Tamil Nadu (Rs 64,200/ha) and Andhra Pradesh (Rs 56,400/ha).
A number of studies on total factor productivity (TFP) growth in Indian ag-riculture, and an assessment of the factors explaining those changes, have been carried out (Table 11.8). They clearly show evidence of robust growth in partial factor productivity and TFP as major drivers of output growth in the crop sec-tor during the 1980s. Estimates of various studies show that the average rates of growth in TFP in the agricultural sector, including livestock, ranged from 0.90% to 2.29% per year during the 1980s and 1990s (Table 11.8). However, the report-ed rates of growth in TFP vary considerably in terms of the methodologies, time periods, and data series used. None of the studies reports TFP growth for India after the latter half of the 1990s. In addition, little research explores whether the source of growth is technical change or purely gains in effi ciency. However, the study by Kalirajan and Shand (1997), following a frontier production function approach, found that during the 1980s much of the slowdown in the TFP con-
Table 11.8. Summary of total factor productivity studies of Indian agriculture
Source: Compiled from NAAS (2009).aIndicates share of respective output growth attributable to growth in TFP.
Total Factor Productivity
Author(s) Commodity Period Annual Growth Share of TFP
Growtha (percent per year) (percent)
Evenson, Pray, and Rosegrant 1999
Crops 1966-76 1.40 50.2
1977-87 1.05 48.8
Fan, Hazell, and Thorat 1999
Crops and livestock
1980-89 2.52 66.5 1990-94 2.29 72.2
Coelli and Rao 2003
Crops and livestock
1980-2000 0.9 -
Kumar, Kumar, and Shiji 2004
Aquaculture 1992-98 4.4 71.7 Marine 1987-98 2.0 48.8
Birthal et al. 1999
Livestock
1951-70 1970-80 1980-95
-0.04 0.93 1.79
- 33.2 45.0
Joshi et al. 2003 Rice (IGP) 1980-90 1990-99
3.5 2.1
- -
Wheat (IGP) 1980-90 1990-99
2.42.1
--

330 SINGH AND PAL
tribution to output growth could be attributed to low rates of technological prog-ress, together with gradual improvements in technical effi ciency, but the output growth in the sector had become increasingly dependent on input growth.
As with crop yields, the measured rates of growth of TFP varied markedly throughout the country. For example, the Indo-Gangetic Plains witnessed im-pressive TFP growth in rice (3.5% per year) and wheat (2.4% per year) during the 1980s, thus underscoring the key role of technology in making the country food secure (Joshi et al. 2003). However, the study showed deceleration in TFP growth, especially for rice, during the 1990s, thus raising concerns about the sustainability of the rice-wheat cropping system. Kumar, Kumar, and Mittal (2004) also found that TFP grew more rapidly in the agricultural sector during the 1980s relative to the 1990s in the Indo-Gangetic Plains. By way of contrast, TFP in the livestock sector grew little before the 1970s. The sector saw the pace of productivity growth picking up during the 1980s when TFP growth reached nearly 1.8% per year, contributing 45% to total output growth (Birthal et al. 1999). In the fi sheries sector, TFP growth was much higher in aquaculture as compared to marine production during the 1990s. The TFP index for aquacul-ture grew by 4.4% annually and accounted for more than 70% of the growth in aquaculture production (Kumar, Kumar, and Shiji 2004).
In an effort to explain the rate of productivity growth, Kumar, Kumar, and Mittal (2004) identifi ed research, extension, literacy, and infrastructure as the most important sources of TFP growth in the Indo-Gangetic Plains. Extension accounted for about 45% of the TFP growth, followed by public research (36%) and literacy (10%). Investment in agricultural research and development (R&D) also made a signifi cant contribution to Indian productivity growth according to Evenson, Pray, and Rosegrant (1999) and Fan, Hazell, and Thorat (1999).
4. SOURCES OF AGRICULTURAL GROWTH4.1. Public Investment in Agriculture
Public investment in agriculture targeted to infrastructure and the provision of farm services has been an important element of agricultural policy in India. The experiences of the green revolution showed that a strategy of strong public support for agriculture has paid rich dividends. Initially most public investment in India was directed toward irrigation infrastructure, particularly surface irrigation. Invest-ment eventually extended to such areas as R&D, public provision of critical inputs like seed and fertilizer, rural electrifi cation, animal health, and agricultural prod-

THE CHANGING PATTERN AND SOURCES OF AGRICULTURAL GROWTH IN INDIA 331
uct markets. Empirical evidence supports a positive correlation between public and private investment (Roy and Pal 2002). This positive correlation could be seen in the development of groundwater irrigation in India, whereby public investment in rural electrifi cation encouraged farmers to invest in tubewell installation. This led to rapid growth in the adoption of groundwater irrigation, beginning especially in northwest India and then spreading to other parts of the country.
The broad trends in public investment constitute three phases during the post-independence period. First, although investment has increased signifi -cantly over the years since independence, it rose rapidly during the food crisis of the 1960s and 1970s. Second, driven by the objective of food security, the government invested heavily in agriculture during the early 1970s, and this level was sustained during the subsequent period. Third, spurred by a slow-down in agricultural growth beginning in the mid-1990s, the government once again stepped up its investment in agriculture, leading to a spike in investments during the fi rst decade of this millennium (Figure 11.2). An upward trend in private investment commenced in the mid-1970s and a sharper rise was further witnessed in the 1990s.
The pattern of public investment has changed signifi cantly over time. It be-came more broad based (spatial coverage and items of investment), and the share of centrally funded and state-operated schemes also rose over time. The rising
Figure 11.2. Gross capital formation in agriculture from the public sector, 1999-2000 pricesSource: CSO (various years).

332 SINGH AND PAL
burden of subsidies eroded the government’s ability to invest in agriculture, and there is an emerging consensus that these subsidies should be rationalized and the resulting savings diverted to public investments in the sector.
4.2. IrrigationMost of the public investment in agriculture has been for development
of irrigation infrastructure, mainly surface irrigation. But investment in rural electrifi cation has also expanded and in turn stimulated investments into tube-well technologies, thereby affecting crop productivity. Studies indicate that the increased use of irrigation and the spread of high-yielding crop varieties have been major sources of growth in Indian agriculture. This trend has continued, but a number of issues have emerged requiring immediate attention. Per capita demand for water is projected to increase markedly, but without commensurate increases in its availability. It is estimated that the latent demand for water for various purposes will far exceed availability by 2050, and other sectors (urban domestic, industries, etc.) will compete with agriculture for water (NAAS 2009).
The fi rst major issue for agriculture is the optimal use of surface irrigation (canal and tank irrigation) and increased technical effi ciency in water use, which is currently estimated at about 25% to 35% in most irrigation systems (Planning Commission 2008). Substantial investment is needed for upgrades in irrigation infrastructure to reduce water losses. In addition, better distribution of irrigation water and recovery of irrigation charges are envisaged through participation of farmers in water user associations. These associations, in partnership with ir-rigation departments, can effectively maintain irrigation channels, manage water distribution at the farm level, and recover costs from member farmers. Successful joint management has yet to materialize, especially in terms of cost recovery.
The second major issue is improvement of water use effi ciency through water-saving technologies like drip and sprinkler irrigation and conservation ag-ricultural practices (zero tillage and aerobic rice). These technologies can reduce pressure on groundwater irrigation. Technological advancements are also needed to address poor quality water. A large part of India (northwest plains and coasts) is facing the problem of salt-affected water, and any technological advancement to reclaim and use this and other poor quality water will help sustain crop pro-ductivity in these regions. Besides technological options, policy and institutional options are needed to control groundwater depletion. The state of Punjab has en-acted a ban on summer paddy, a crop that is transplanted in May, while Haryana

THE CHANGING PATTERN AND SOURCES OF AGRICULTURAL GROWTH IN INDIA 333
has withdrawn price supports for summer paddy. There is also a move to shift to volumetric pricing of electricity for tubewell irrigation to control water extraction.
4.3. Agricultural R&DThe creation of a strong R&D system for agriculture has been an important
policy goal of the Government of India. As a result, India is one of the few devel-oping countries to sustain a positive rate of growth in real public investment in agricultural research. Research funding increased from 0.3% of agricultural GDP in 1971 to more than 0.5% in 2004 for both agricultural research and education, and all signs point to a continuation of this uptrend. India has seen two structural changes in funding and the use of this investment. First, the central government’s share of funding has risen over time and now accounts for nearly half of total funding. Second, allocation to the dryland regions, for such things as natural re-source management research and livestock development, has been increasing. The only region that continues to receive low investment is the eastern region, where funding by state governments is very low. Another noteworthy trend is that an increasing amount of funding is being allocated competitively, thus opening up ac-cess to funding to a broader set of public institutions (Pal and Byerlee 2003).
Besides raising the amount of public investment, the government, through the Indian Council of Agricultural Research (ICAR), has addressed organiza-tional issues to enhance research effectiveness. The government has made a number of policy reforms recently, and the focus is now on accelerating the pace of implementation of these reforms. Highlights of these institutional reforms are
• strengthening the monitoring and evaluation of institutes and their pro-grams and the use of information communication technology in research management;
• strengthening the research and development continuum through stronger linkages between research, technology transfer, and end-users; and
• managing intellectual property for rapid transfer of technology and foster-ing partnership among actors in R&D, especially between the public and private sectors.
Management of intellectual property rights (IPRs) represents a major shift in R&D, and these measures warrant further elaboration. India has put in place legislation to comply with the agreements related to IPRs under the World Trade Organization. Among these, protection of plant varieties, farmers’ rights, and other innovations are of great signifi cance to agriculture. ICAR has established a

334 SINGH AND PAL
unit for IPRs management and has developed IPRs policy and guidelines for their implementation. The main elements of the policy are as follows:
• ICAR will seek and maintain ownership rights for all intellectual proper-ties, such as plant varieties, process and product innovations, research data, computer programs, designs, and publications, generated by its in-stitutes.
• ICAR will encourage its institutes to use IPR policy to accelerate tech-nology fl ow to farmers, promote competitive markets for innovations/technologies, especially in the private domain, and promote inclusive and sustainable agricultural growth.
• ICAR will offer incentives for innovation by sharing the benefi ts of re-search with researchers, entrepreneurs, and farmers.
With the establishment of the Protection of Plant Varieties and Farmers’ Rights Act, a large number of extant and new varieties have been registered for protection. These varieties are being commercialized through partnership with state and private seed agencies. In addition, efforts are being made to conserve and protect genetic resources through in situ and ex situ measures. ICAR also en-courages conservation of animal and fi sh genetic resources by registering species.
Networking and partnership for pooling of resources, expertise, and skills are important for generating synergies in research. This concept is promoted through a number of network projects involving ICAR institutes and other insti-tutions. These projects are in high-priority research areas and complement the network of coordinated research projects in India.
The private sector role in many facets of agriculture has expanded, from sup-plying inputs (seeds, fertilizers, pesticides, animal feed, etc.), to product marketing and value chain development, to commercialization of technologies. For instance, the private sector provides 58% of total commercial seeds (Planning Commission 2008). The non-profi t private sector, such as research foundations and civil society organizations, is also active in agricultural development, including R&D. All of these organizations will increasingly depend on public R&D organizations for a variety of support. ICAR has instituted initiatives to foster partnerships with pri-vate and civil society organizations. These efforts have been accelerated to promote partnership with the private sector under externally funded projects of the World Bank. An emphasis on commercialization of technologies is also encouraging part-nership with the private sector, whereby public research institutions license their technologies to the private sector on a non-exclusive basis.

THE CHANGING PATTERN AND SOURCES OF AGRICULTURAL GROWTH IN INDIA 335
4.4. Use of InputsTable 11.9 illustrates the rapid uptake of new seed and fertilizer technol-
ogy during the green revolution. Average per hectare use of fertilizer doubled in every decade from 1971 to 1991. Subsequently the rate of increase was not as high but was still impressive; in fact, in absolute terms the increase in the ap-plication rate of fertilizer during the 1990s equaled that of the 1970s. Currently, the average rate of fertilizer application is 113 kg/ha, which is still much below the recommended level. Another notable feature of fertilizer use is that there is considerable interregional variation, especially in irrigated areas. For example, in the Punjab, average fertilizer use is as high as 209 kg/ha. Nitrogen fertilizer is most commonly used by farmers, with a high imbalance in the use of other plant nutrients (e.g., phosphorus and potassium). Recently, the government has pro-vided price subsidies to encourage a more balanced use of plant nutrients. Simi-lar trends are echoed in the use of other purchased inputs, and this is somewhat refl ected by the growth in institutional credit to agriculture.
Private investment in farm mechanization and tubewell irrigation has been another major driver of economic growth. There were only 148,000 tractors in India in 1971 (Table 11.9). The number rose to more than two million tractors by 2006. Similarly, the share of cropped area irrigated by tubewells increased from 16.6% in 1971 to 26% in 1981, and rose further to 44% in 2006. This in-vestment in farm mechanization and irrigation has not only contributed to an increase in crop productivity but also has helped raise the intensity of cropping. Another advantage of the expansion of tubewell irrigation has been a greater
1971 1981 1991 2001 2006Fertilizer use (kg/ha) 16.5 34.24 69.84 91.13 113.26Number of tractors
(000)a 148.2 275.9 738.4 1,221.8 2,361.2
Share of tubewells in irrigated area (%)
16.63 26.2 38.42 40.84 43.86
Quality seed distribution (000 tons)
n.a. 450 575 918 1,550
Institutional credit (Rs/ha)
53.58 232.42 631.39 3,261.40 10,544.45
Table 11.9. Inputs use in Indian agriculture, 1971-2006
Source: MoA (various issues).aData pertain to 1972, 1977, 1987, 1992, and 2003, respectively.

336 SINGH AND PAL
stability in crop yields, thereby reducing the size of government interventions to maintain buffer stock. However, as with fertilizer use, the most disquieting fea-ture of farm mechanization and irrigation is that these developments have been mostly concentrated in the northwestern region of the country (in states such as Punjab and Haryana). This has led to charges of over-investment in mechaniza-tion (which results in a higher cost of production and lower farm income), and overuse of irrigation water in this region has led to questions about the long-term sustainability of the rice-wheat production system in this part of India.
One recent development concerning input use and crop establishment practices has been the adoption of resource conservation agriculture, mainly in the rice-wheat system. The most widely adopted technology is direct sowing of wheat after paddy in untilled fi elds, which is known as zero tillage. Estimates place more than three million hectares under zero-till wheat in 2005. The main advantages of this technology are (a) tractor fuel savings and a reduction in car-bon emissions; (b) savings in the use of irrigation water, mainly groundwater; (c) carbon sequestration and low or delayed carbon dioxide emissions; and (d) a reduction in herbicide use (Laxmi, Erenstein, and Gupta 2007).
4.5. Price Support and Terms of TradeGovernment interventions in providing price support to farmers and im-
proving the physical and economic access of poor consumers to food have been important elements of agricultural price policy in India since 1965 when the Commission for Agricultural Costs and Prices (CACP, formerly the Agricultural Price Commission) was established. The government procures food grains at a predetermined price called the Minimum Support Price announced by the gov-ernment on the recommendation of the CACP. Although the price is announced for two dozen commodities, there is procurement of only a few select commodi-ties (rice and wheat). The commodities are distributed to the public at a price lower than market price through fair price shops managed by the state govern-ments. Part of the stock is used as a buffer to reduce temporal variations in avail-ability of food grains.
These government interventions have been successful in improving food ac-cess and ensuring a fairly stable price environment. This in turn has encouraged farmers to adopt new technology and use modern inputs and crop practices and thereby helps improve crop productivity, which in turn strengthens national food security, which is a signifi cant impact of agricultural price policy (Acharya

THE CHANGING PATTERN AND SOURCES OF AGRICULTURAL GROWTH IN INDIA 337
1997). This, coupled with other interventions, such as development of market infrastructure and regulation of markets to control exploitative practices of trad-ers, has helped in providing incentives to farmers and reducing margins in the market. This effect has been so signifi cant that some observers have charged that the government has discouraged private corporate participation in food grain markets (Chand 2003). However, because government operations are confi ned to so few food grain surplus states, there is tremendous opportunity for the corpo-rate sector to participate in food grain trade.
With the demand side of the Indian food economy developing rapidly, a number of initiatives have been enacted recently to attract corporate investment in agricultural marketing. An act prohibiting direct purchase of produce from farmers by traders was relaxed, and model legislation was prepared in 2003 to allow participation of the corporate sector. Since then, most states have adopted this legislation, and some private fi rms are directly procuring produce from farmers. Some fi rms have established terminal markets,4 mainly for high-value commodities like fruits and vegetables, while others are procuring produce from farmers through dissemination of market information using informational tech-nology (for example, the e-Choupal program of ITC Limited). Another related development has been the practice of contract farming, in which a processing or agricultural company enters into a contract with farmers to purchase produce at a pre-agreed price. The company also provides crop information, inputs on credit, and other support for better yields and produce quality. Although there have been some instances of both companies and farmers failing to comply with contracts, the arrangements have worked well, especially for high-value com-modities (Joshi, Gulati, and Cummings 2007).
In addition to these major policy changes, several other market reforms initi-ated by the government have improved the discovery and stability of agricultural prices. These reforms relate to relaxation of control over movement and storage of food grains and of futures markets, attracting investment in market infrastructure and agro-processing, and liberalization of trade. Although the impact of these re-forms will not be clear for some time, all signs point to improvement in incentives for farmers. The domestic terms of trade (i.e., farm output to input prices) did not favor agriculture during the 1980s but started to improve in the early 1990s. Also,
4These are professionally managed enterprises that provide complete market services to farmers at their door step and operate in hub-and-spoke format.

338 SINGH AND PAL
domestic agricultural commodity prices have remained much more stable than international prices, which have shown a high degree of volatility. A stable price environment and better incentives will encourage farmers to invest in productivity-enhancing inputs and practices and thereby contribute to agricultural growth.
5. FUTURE CHALLENGES AND STRATEGYNotwithstanding the impressive performance of Indian agriculture in the
past, there are a number of challenges which, if not addressed, in time may hold back not only the agricultural sector but also the entire Indian economy. We have seen this in the recent past when impressive economic growth but moder-ate agricultural growth puts upward pressure on food prices and exacerbates rural-urban income disparities. The fi rst and foremost challenge is to attain and sustain a target growth of 4% per year in agricultural output as envisaged by the Planning Commission. This growth should be inclusive and geographically widespread in terms of participation of smallholders and those in marginal pro-duction environments. Most of this growth will be realized through higher pro-ductivity through the application of modern technology. However, participation of smallholders will also entail institutional innovations to enable aggregation of their production and to link them with markets.
The second most important challenge is to address the vulnerability of Indian agricultural production. Currently, two-thirds of agricultural lands are rain-fed and subject to the vagaries of weather and other vulnerabilities. This vulnerabil-ity is further accentuated by the degradation and depletion of natural resources, which are also seen in irrigated production environments (NAAS 2009 ). A two-pronged strategy is needed. First, the severity and long-term implications of these challenges are not well understood by farmers. Therefore, a national program should be created to educate farmers about long-term sustainability issues. Sec-ond, farmers should be empowered with the appropriate technologies to address sustainability and vulnerability concerns. This should be backed with policy in-terventions to manage risk and strengthen social safety nets.
Climate change is a recent challenge, and its likely impacts are becoming better understood and local responses are evolving. Responses include a contin-ued partnership with the international community to assess the challenge as the events unfold and further work on adaptation and mitigation strategies consis-tent with local realities. A considerable amount of resources will be needed for technological solutions and their adaptation by farmers and other stakeholders.

THE CHANGING PATTERN AND SOURCES OF AGRICULTURAL GROWTH IN INDIA 339
Finally, development of human capital is the key to innovation and accel-eration of agricultural growth. The government should invest more in building this capacity within various government departments, development agencies, and with farmers. Efforts to accelerate the fl ow of technologies to farmers and improve their skills and ability to innovate will go a long way toward strengthen-ing the long-term productive capacity of Indian agriculture. But this requires the mobilization of resources in the public and private sector, ensuring the participa-tion of farmers, and encouraging technology-led solutions.
6. CONCLUSIONDespite the impressive performance of Indian agriculture during the period
of the green revolution supported by signifi cant public investments and associ-ated institutional developments, agriculture has failed to meet its growth target over the last decade. However, if we exclude some years of abnormally adverse weather (specifi cally the years 2002-03 and 2004-05), an adjusted annual growth rate of more than 3% per year was sustained over the period 1997-98 to 2008-09. This is a notable achievement, especially considering India’s severe re-source and production environment constraints. The trend toward commercial-ization and diversifi cation of agriculture is increasing, and most of the growth in output in recent years was realized through productivity growth. Given the increasing demand for high-value commodities, as well as the need to produce more food grains to feed a still growing population, the goals of food security and diversifi cation for high-value agriculture should be pursued through tech-nological interventions. An increase in the productivity of food grains would en-able land to be used to grow high-value crops like fruits and vegetables without compromising domestic food production. Continued government support for agricultural R&D and higher public investment in infrastructure are welcome steps in increasing productivity. Encouraging business interests in food and ag-riculture and fostering institutional innovations to improve smallholders’ access to technology are current policy thrusts. A supportive policy environment with well-structured incentives can be a major driving force to promote innovation in agriculture, and lessons from any localized successes in this regard also need to be well understood and replicated. Enhanced efforts to sustain India’s natural resources, provide productive infrastructure through better technological and in-stitutional solutions, and develop human capital capacity will help accelerate the country’s agricultural growth.

340 SINGH AND PAL
REFERENCESAcharya, S.S. 1997. “Agricultural Price Policy and Development: Some Facts and Emerging Is-
sues.” Indian Journal of Agricultural Economics 52(1): 1-47.Birthal, P.S., A. Kumar, A. Ravishankar, and U.K. Pandey. 1999. “Sources of Growth in Livestock
Sector.” NCAP Policy Paper No. 9, National Centre for Agricultural Economics and Policy Research, New Delhi.
Chand, R. 2003. “Government Intervention in Foodgrain Markets in the New Context.” NCAP Policy Brief No. 19, National Centre for Agricultural Economics and Policy Research, New Delhi.
Chand, R., and S.S. Raju. 2008. “Livestock Sector Composition and Factors Affecting Its Growth.” Indian Journal of Agricultural Economics 63(2): 198-208.
Coelli, T.J., and D.S.P. Rao. 2003. “Total Factor Productivity Growth in Agriculture: A Malmquist Index Analysis of 93 Countries, 1980-2000.” Paper presented at the International Associa-tion of Agricultural Economics Conference in Durban, August.
CSO (Central Statistical Organization, Government of India). Various. National Accounts Statistics. New Delhi: Author.
Evenson, R.E., C. Pray, and M.W. Rosegrant. 1999. “Agricultural Research and Productivity Growth in India.” Research Report No. 109, International Food Policy Research Institute, Washington, D.C.
Fan, S., P.B.R. Hazell, and S. Thorat. 1999. “Linkages between Government Spending, Growth and Poverty in Rural India.” Research Report No. 110, International Food Policy Research Institute, Washington, D.C.
Gandhi, V.P., and N.V Namboodiri. 2006. “The Adoption and Economics of Bt Cotton in India: Preliminary Results of the Study.” Working Paper No. 2006-09-04, Indian Institute of Man-agement, Ahemedabad, India.
Gulati, A., T. Shah, and G. Shreedhar. 2009. “Agriculture Performance in Gujarat Since 2000: Can Gujarat Be a Divadandi (lighthouse) for Other States? International Water Management Institute and International Food Policy Research Institute, New Delhi.
Joshi, P.K., A. Gulati, and R.W. Cummings. 2007. Agricultural Diversifi cation and Small Holders in South Asia. New Delhi: Academic Foundation.
Joshi, P.K., L. Joshi, R.K. Singh, J. Thakur, K. Singh, and A.K. Giri. 2003. “Analysis of Productiv-ity Changes and Future Sources of Growth for Sustaining Rice-Wheat Cropping System.” National Agricultural Technology Project, National Centre for Agricultural Economics and Policy Research, New Delhi.
Kalirajan, K.P., and R.T. Shand. 1997. “Sources of Output Growth in Indian Agriculture.” Indian Journal of Agricultural Economics 52(4): 693-706.
Kumar, P., A. Kumar, and S. Mittal. 2004. “Total Factor Productivity of Crop Sector in the Indo-Gangetic Plain of India: Sustainability Issues Revisited.” Indian Economic Review 39(1): 169-201.
Kumar, P., A. Kumar, and C.P. Shiji. 2004. “Total Factor Productivity and Socio-economic Impact of Fisheries Technology in India.” Agricultural Economics Research Review 17(conference is-sue): 131-144.
Laxmi, V., O. Erenstein, and R.K. Gupta. 2007. “Assessing the Impact of Resource Management Research: The Case of Zero-Tillage in the Rice-Wheat System.” In International Research on

THE CHANGING PATTERN AND SOURCES OF AGRICULTURAL GROWTH IN INDIA 341
Natural Resource Management: Advances in Impact Assessment, H. Waibel and D. Zilberman, eds. Wallingford, UK: CAB International.
MoA (Ministry of Agriculture, Government of India). 2008. Agricultural Statistics at a Glance. Directorate of Economics and Statistics, Department of Agriculture and Cooperation. New Delhi: Author.
MoF (Ministry of Finance, Government of India). 2007. Economic Survey 2007-08. Economics Di-vision. New Delhi: Author.
NAAS (National Academy of Agricultural Sciences). 2009. State of Indian Agriculture. New Delhi: Author.
Pal, S., and D. Byerlee. 2003. “The Funding and Organization of Agricultural Research in India: Evolution and Emerging Policy Issues.” NCAP Policy Paper No. 16, National Centre for Agri-cultural Economics and Policy Research, New Delhi.
Planning Commission, Government of India. 2008. Eleventh Five Year Plan 2007-2012. Agricul-ture, Rural Development, Industry, Services and Physical Infrastructure, Vol. 3. New Delhi: Author.
Qaim, M., A. Subramanian, G. Naik, and D. Zilberman. 2006. “Adoption of Bt Cotton and Impact Variability: Insights from India.” Review of Agricultural Economics 28(1): 48-58.
Roy, B.C., and S. Pal. 2002. “Investment, Agricultural Productivity and Rural Poverty in India: A State Level Analysis.” Indian Journal of Agricultural Economics 57(4): 653-678.