Embed Size (px)
Citation preview
DISCUSSION PAPERS Department of Economics University of Copenhagen
Trust oA Natural F
Newspap
Gerald Pruckner
Studiestræde 6, DK-Tel. +45 35 32 3
http:/
06-01
n the Streets: ield Experiment on er Purchasing
and Rupert Sausgruber
1455 Copenhagen K., Denmark 0 82 - Fax +45 35 32 30 00
/www.econ.ku.dk
Trust on the Streets
A Natural Field Experiment on Newspaper Purchasing
Gerald Pruckner and Rupert Sausgruber*
February 2006
Abstract A publisher uses an honor-system for selling a newspaper in the street. The customers make payments into a cash-box, but can also just take the paper without paying. Payments are not monitored and highly anonymous; hence customers exhibit trustworthiness if they pay for the paper. We run a natural field experiment to identify motives behind payments. The experiment reveals that trustworthiness is based on a social rather than a legal norm. Additional survey questions serve to identify individual-specific components of trustworthiness. We find effects of gender, age, family status, church attendance, measures of reciprocity, social connectedness, and social risk.
Keywords: trust, trustworthiness, natural field experiment, survey
JEL-codes: C93, K42
* University of Innsbruck, Department of Economics and Statistics, Universitätsstr. 15, A-6020
Innsbruck, Austria. [email protected]; [email protected]. We thank Ralph Bayer, David Laibson, Werner Güth, Stephan Meier, Jean-Robert Tyran, Hannes Winner, as well as seminar participants at the Universities of Adelaide, Amsterdam, Copenhagen, Linz, and Lund for helpful comments. We are grateful for financial support by the Austrian National Bank (Jubiläumsfonds) under Project No. 9134 and the Austrian Science Foundation (FWF), under Project No. P17029. We thank the “Vorarlberger Medienhaus” for supporting this research.
1 Introduction
“In the rural areas around Ithaca it is common for farmers to put some fresh produce on a table by the road. There is a cash box on the table, and customers are expected to put money in the box in return for vegetables they take. The box has a slit, so money can only be put in, not taken out. Also, the box is attached to the table, so no one can (easily) make off with the money. We think that farmers who use the system have just about the right model of human nature. They feel that enough people will volunteer to pay for fresh corn to make it worthwhile to put it out there. The farmers also know that if it were easy to take the money, someone would do so.”
Robyn DAWES und Richard THALER (1988: p. 195)
In this paper we empirically analyze customers’ payment behavior in a market as
the one described by Dawes and Thaler (1988). Instead of farm produce, the market
trades a tabloid. Every weekend, a publisher positions hundreds of sales booths in the
streets of an Austrian province. A booth consists of a plastic board of 25×15 inches in
size, a moisture-proof plastic bag from which the customers take the paper, and a
cashbox. The cashbox is padlocked to the board. The paper has a price indicated on
the cashbox (see Appendix 1 for pictures).
Payments in this market are difficult to reconcile with standard assumptions in
economics. First, the customers face no threat of punishment. Stealing the paper is
illegal, but in our case the publisher abstains from legal sanctions against paper
filchers.1 Second, payments are highly anonymous and reputation is of limited
concern. The reason for this is that one cannot easily observe a payment. One would
have to stand very close to the customer or alternatively unlock the box in order to
record payments. Neither case is typical. Finally, the customers are experienced with
the market and know about this.
Recently, behavioral economists became interested in explaining why not
everyone free rides all the time. There are two broad lines of research exploring this
question. The first one is experimental. The laboratory “trust game” was designed to
mimic exchange situations that are prone to a free-rider problem (McCabe et al. 1995;
for an empirical survey, see Camerer 2003). In the standard, two-player version of this
1 The publisher introduced the honor system in the 1970’s. He does not monitor payments since the
early 1980’s. Nobody has been fined for taking a paper without paying since then. Other publishers apply a different strategy. The German publisher of the “Süddeutsche Zeitung” employs monitors who announce thefts to the police. The resulting fine is € 30 (approx. 25 times the price of the paper). Swiss publishers have replaced the honor system by permanent vending machines, which are not prone to free rider problems.
- 1 -
game, the first mover can keep or invest. The investment yields some return. Then the
second mover decides how to share the investment plus the return between himself
and the first mover.
The second line of research has emerged from observing that social variables are
empirically associated with measures of economic success. Although loosely defined
and multifaceted, the concept of “social capital” suggests that there are identifiable
behavioral traits which mitigate incentive problems when contracts are incomplete
(see Sobel 2002 for a survey). This research has triggered several investigations on
how to measure social capital. In a seminal paper, Glaeser et al. (2000) analyze
students’ behavior in the laboratory trust game to identify individual-specific
correlates of trust and trustworthiness. Fehr et al. (2002), Barr (2003), Bellmare and
Kröger (2004), Johansson-Stenman et al. (2005) and Schechter (2005) have extended
this approach to non-student participants.2 Recently, Karlan (2005) found that the
second movers’ behavior in the experimental trust game is associated with field
behavior of borrowers in a Peruvian microcredit program.
Our paper extends this previous research in two important dimensions. First, we
run a natural field experiment with customers in the newspaper market. According to
Harrison and List (2004: p. 1010) a field experiment is “what might be better called
an ideal experiment, in the sense that one is able to observe a subject in a controlled
setting but where the subject does not perceive any of the controls as being unnatural
and there is no deception being practiced”. In contrast to previous studies, we do not
employ students as participants in the experiment. We also do not run an “artefactual
field experiment”, which uses non-student participants in the laboratory trust game.
Instead, we observe natural subjects in their roles as customers for newspapers in
conditions that are controlled by us. Our subjects do not know that they are
participating in an experiment.
The second difference from previous research is that we combine individual-level
background variables with payment data from a field market. The publisher has
provided us with the extraordinary opportunity to monitor customers’ choices and
survey the same customers thereafter. We check the cash box, gather the survey data
and record individual payments along with the survey responses. The customers do
2 Gächter et al (2004) and Anderson et al. (2004) apply the same approach but use behavior from the
experimental public good game.
- 2 -
not know that we verify their payments, nor do they know that we will combine their
responses in the survey with their payments. With this approach we can identify
individual-specific components of trustworthiness in a natural context.
To summarize, we conduct two independent studies on the behavior of customers
in a market for newspapers in which payments are not enforced. The field experiment
applies treatment variations to learn about customers’ motivations and contains no
survey. The survey study asks questions of customers in a natural non-experimental
condition and has no variation of treatments. Our procedures did not aim at making
the experiment and the survey comparable. Rather, we took care that the survey does
not spoil the results from the field experiment and vice versa.
In the field experiment our interest is to see whether and how the publisher can
promote trustworthiness on behalf of the customers. There are two treatments and a
control. In the first treatment “LEGAL”, we give a “reminder” about the existing legal
norm by displaying the message “Stealing a paper is illegal” on the sales booth. We
expect an effect of this treatment if customers pay because they comply with the legal
norm. In the second treatment “SOCIAL”, the message shows “Thank you for being
honest”. The intention behind this treatment is to test whether trustworthiness in this
market rests on a social norm.
The field experiment produces two substantial results. First, the message in
SOCIAL has a strong positive effect on payments as compared to the control. There is
no effect of treatment LEGAL. Second, we observe that the number of free riders is
the same across all three treatments. This observation implies that the message in
SOCIAL has an effect only on those who do not free ride. We regard this observation
as indication that payments in the newspaper market are motivated by a social norm.
From the survey of customers we find that males pay less than females and that
older people pay less than younger ones. Family status matters in the sense that
customers with partners and children pay more than singles without children. Social
connectedness measured by volunteering activities is positively associated with
payments. Customers who frequently attend the service at the (catholic) church pay
significantly less than others. Customers who trust in the legal system and those who
are willing to return a favor pay more for the paper. People who care about what
- 3 -
others think of them pay more than others. Customers who state in the survey that
they would evade taxes if they had the opportunity to do so pay less.
In the next section we present the details about the sales-booth system. Section 3
explains the procedures of the field experiment and the survey study. Section 4 reports
the results. Section 5 concludes.
2 The sales booths system for Sunday newspapers
The sales-booth system is common among Austrian publishers. It is particularly
popular on weekends. Labor market regulation makes it expensive to hire work on
weekends. Shop-hours are restricted, too. As a consequence of such regulation, on
Sundays Austrians can only shop in a few places at railway stations, airports, gas
stations, and tourist centers. In the newspaper market, some publishers provide a
weekend house-delivery service for their customers. Apart from that, the delivery of
Sunday papers via the sales-booth system is common mostly for tabloids but also for
several serious papers. The customers know the streets and corners where they can
find the sales booths for papers.
The paper we consider is a daily tabloid. It is distributed in Vorarlberg, a province
in the west of Austria with 350 thousand inhabitants. The publisher is a large
company that combines business from selling electric power, telecommunication,
broadcasting, printing and distributing magazines and newspapers. Apart from the
tabloid, the company edits several magazines and a serious newspaper. It also prints
and distributes magazines and newspapers for other publishing houses.
At the time of the study in 2004, the Sunday print run of the tabloid was 33
thousand; on weekdays it was 25 thousand. In the same year, the estimated number of
readers was 64 thousands, representing 23.7 percent of all potential readers above 14
years of age in the province. On weekends, part of the run is distributed directly to the
homes of readers, who hold a subscription of the Sunday edition. Another part goes to
the above mentioned shops that open on Sundays. About 42 percent of the Sunday
edition, i.e., 14 thousand copies are distributed via the sales-booths system.
A question of immediate interest is what motivates the publisher to use the sales-
booth system for distribution. The most likely answer is that it is optimal. The lion’s
share of the publisher’s revenue comes from printing advertisements. A typical issue
- 4 -
of the tabloid has 20-30 double pages. The editorial text makes up less than one third
of the total available print space. The remaining space is sold for advertisements. The
selling price of advertisements increases with the number of readers of the paper. The
sales booth system not only enables the publisher to distribute the paper to a large
number of readers; the system is also cheap. In 2004, the year of our experiment, the
paper had a price of € 0.60. The publisher informed us that the average payment at the
sales booths on a Sunday is approximately one third of the full price (Figure 2 in
section 4 will confirm this statement). So the system generates approximately € 2,800
(= 14,000 × € 0.20) revenues every Sunday. Subtracting the cost of hiring a number of
employees who mount the sales booth and collect the money, the system is cheaper
than the next best alternative of having direct house delivery.
3 Procedures
The natural field experiment and the survey study are independent from each
other. The procedures of these two approaches differ in several respects. We will
describe them separately in the next two subsections.
3.1 Procedures of the field experiment
The experiment has two treatments and a control. The treatments differ
exclusively in a message prompted to the customers at the sales booth. This message
is printed on the cover of the bag containing the papers (see Appendix 1 for pictures).
A customer has to lift the cover in order to take out the paper from the bag. Therefore,
customers can hardly take the paper without taking notice of the experimental
message. Table 1 shows the exact wording we apply in the treatments.
The publisher provided us with 10 sales booths that we could use for the purpose
of conducting the experiment. We ran the experiment during the week, for the first
time on 3 subsequent days in June 2004 in a town with 44,000 inhabitants, and for the
second time on 3 subsequent days in October 2004 in another town with 28,000
inhabitants.3 In both towns we chose a set of potential locations. These sets contained
20 locations in the first and 15 locations in the second town. On each day of the 3 We ran the experiment during the week because we did not want to interfere with the survey study,
which was conducted on Sundays in May and June 2004 (see next section). Surveying customers required the help of many people who were physically present in the streets on Sundays. Our procedures aimed to assure that the samples of the field experiment and the survey do not overlap.
- 5 -
experiment, we randomly selected 10 locations from the set of potential locations. At
these locations we mounted a sales booth. All locations in the experiment are
frequently in use by the system. Customers know that they find sales booths for the
paper at these locations. We also randomly assigned the treatments to the locations.
At day 1 of the experiment, for instance, there were 3 locations each in treatment
CONTROL and LEGAL, plus 4 locations in treatment SOCIAL. On day 2, we had 3
locations each in treatment SOCIAL and CONTROL, plus 4 locations in treatment
LEGAL, etc. By this means we controlled for idiosyncratic location effects.
Table 1: Treatments of the field experiment
Treatment Message
CONTROL “The paper costs 60 Cents.”
LEGAL “The paper costs 60 Cents. Stealing a paper is illegal.”
SOCIAL “The paper costs 60 Cents. Thank you for being honest.”
We were very cautious to ensure that the experimenters’ presence did not affect
the customers’ anonymity. For this reason, the experimenter put just a single paper
into the bag of a sales booth and checked for payments in intervals of 40 to 60
minutes. If the paper has been taken out of the bag, the experimenter opened the
padlock, emptied the cashbox, and recorded the payment. After that, the experimenter
refilled the bag again with just one single paper and moved on to the next
experimental location. This reduced the probability to a minimum that the customers
observed the experimenter recording a payment or that they felt being observed when
they took the paper.
In total, in 6 days and two towns, we gathered data from 40 different locations.
Every treatment was implemented 20 times. We selected 21 locations once for the
experiment and 18 locations twice. Only one location was selected three times for the
experiment. The experimenter checked the sales booths at the 40 locations a total of
- 6 -
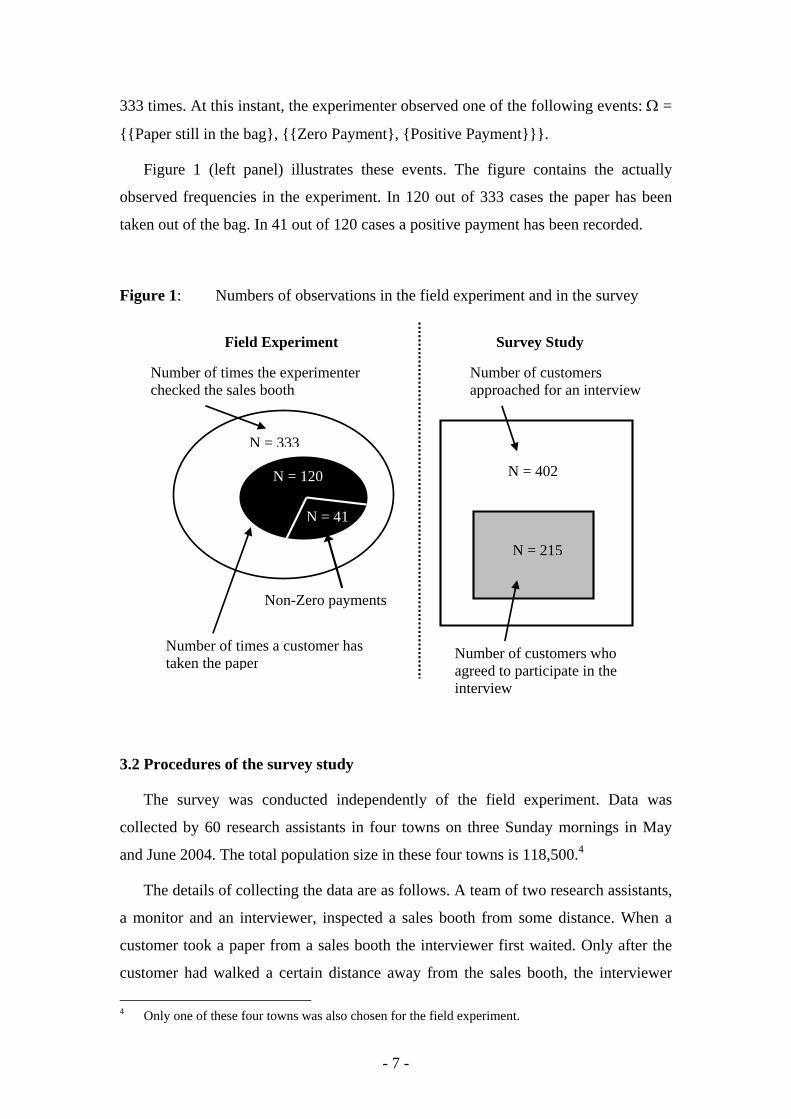
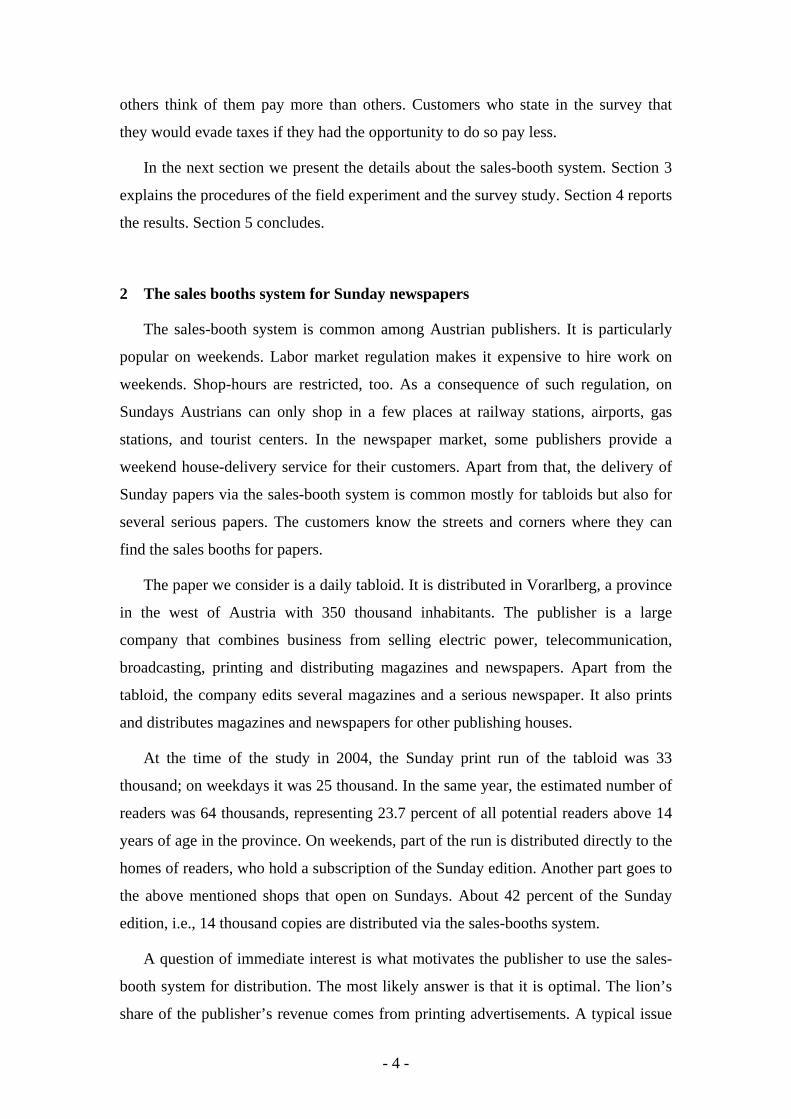
333 times. At this instant, the experimenter observed one of the following events: Ω =
Paper still in the bag, Zero Payment, Positive Payment.
Figure 1 (left panel) illustrates these events. The figure contains the actually
observed frequencies in the experiment. In 120 out of 333 cases the paper has been
taken out of the bag. In 41 out of 120 cases a positive payment has been recorded.
Figure 1: Numbers of observations in the field experiment and in the survey
Number of times the experimenter checked the sales booth
Number of times a customer has taken the paper
Non-Zero payments
Field Experiment Survey Study
Number of customers approached for an interview
N = 215
N = 402
N = 333
N = 120
N = 41
Number of customers who agreed to participate in the interview
3.2 Procedures of the survey study
The survey was conducted independently of the field experiment. Data was
collected by 60 research assistants in four towns on three Sunday mornings in May
and June 2004. The total population size in these four towns is 118,500.4
The details of collecting the data are as follows. A team of two research assistants,
a monitor and an interviewer, inspected a sales booth from some distance. When a
customer took a paper from a sales booth the interviewer first waited. Only after the
customer had walked a certain distance away from the sales booth, the interviewer
4 Only one of these four towns was also chosen for the field experiment.
- 7 -
approached the customer for an interview. A customer was told that the interview
would last for 20 minutes. To guarantee a high rate of response a customer was
promised € 20 for agreeing to the interview. On request, a customer was shown an
official letter from the University stating that this study is funded by the Austrian
Science Foundation for the purpose of basic research. Inquiring customers were
informed that the study served to explore “social behavior in the society”. All
interviews were run face-to-face and took approximately 15 minutes. The questions
were read aloud to buyers who could also follow reading the questions themselves.
The task of the monitor was to record individual payment for the paper. This
required removing, opening, and reattaching the cashbox at the sales booth. Monitors
were instructed to act such that the customers did not notice the verification of their
payments. This was possible without much effort because the actual sales frequency
at a location was quite low. Until noon, on average between 2 and 3 papers were taken
from a sales booth.5 It rarely happened that another customer had taken a paper before
the monitor verified the payment of the previous customer. In these cases, the
decisions of both customers were not coded and therefore not considered in the data
set.
We were careful to avoid that the customers would relate the interview with their
payment decision at the sales booth. Interviewers were instructed not to mention to
the customers the tabloid and anything related to it. Furthermore, we did not ask any
question related to the newspaper in the questionnaire. A first reason for this was the
publisher‘s concern that our study might alienate the customers. The publisher was
supportive to our research; however, he was worried about the reputation of his
company. As it showed, not a single person complained about the interviews to the
publisher, indicating that our precautions have been effective. The second reason is
methodological: if customers had known that their payments were linked to the
interview, the survey might have produced biased responses.
Figure 1 (right panel) shows that we recorded the payments of 402 customers in
total. These payments were collected at 43 different locations in 4 towns. Out of 402
customers 215 (= 53 %) agreed to participate in the interview.
5 This explains the large number of helpers needed to gather this data.
- 8 -
4 Results
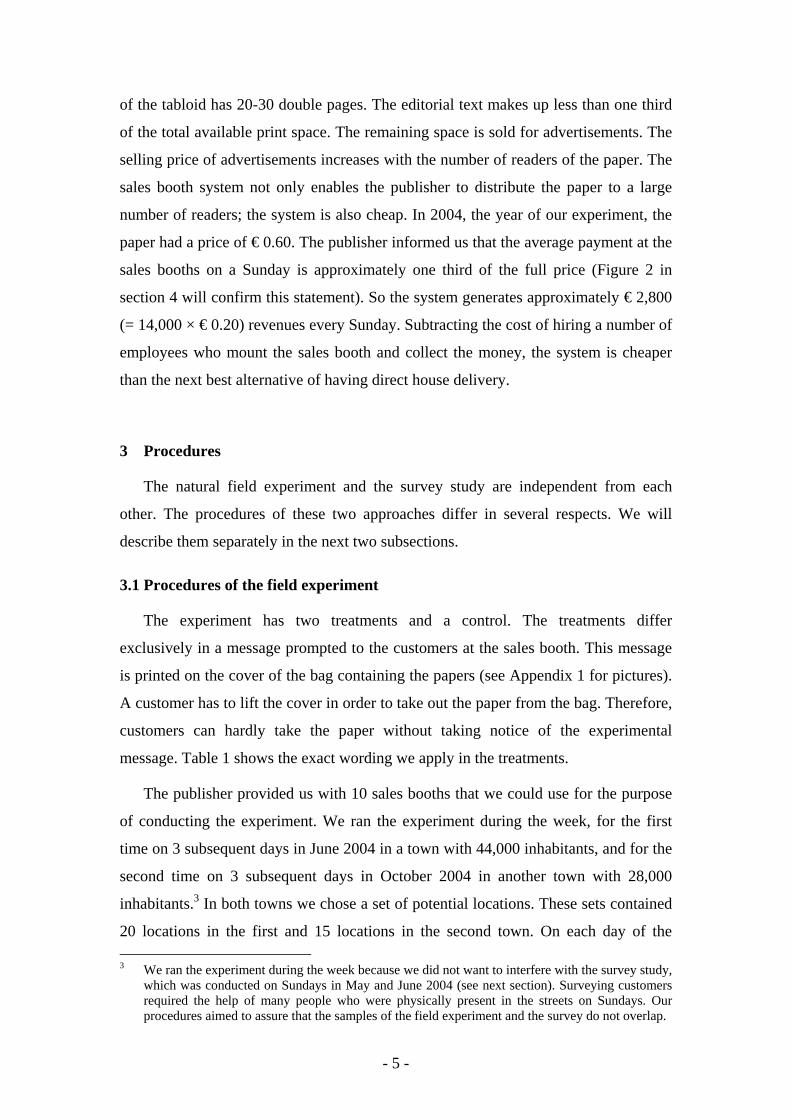
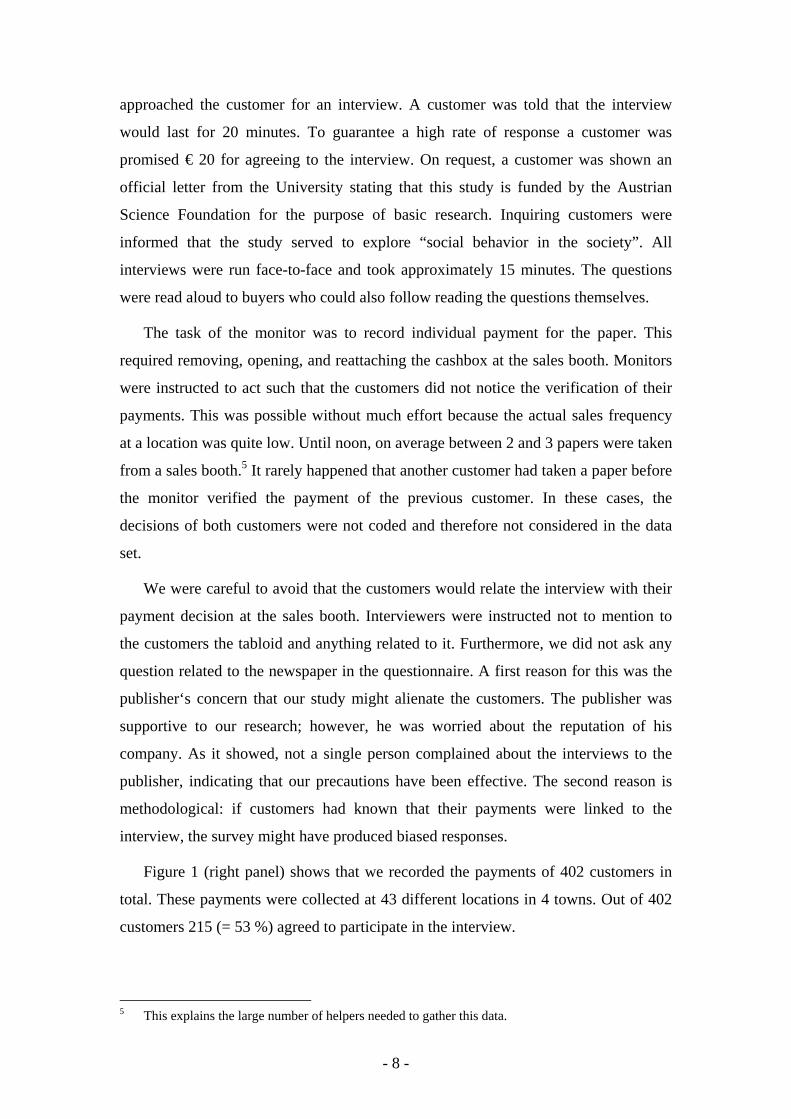
We first provide the results about the extent of trustworthiness in the market.
Figure 2 shows the relative frequency of payments of customers in the survey and the
experimental study. In the survey, 39 percent of customers pay zero. 61 percent make
at least some positive payment. 19 percent of all customers in this sample pay the full
price or even overpay. The average payment is 22 Eurocents. Those 7 percent of
customers who overpay do so, most likely, because they lack the change to pay the
exact price.
Payments in the field experiment are quite different. Here, 66 percent of
customers pay zero. Only 34 percent make at least some payment, and only 6 percent
of all customers within this sample pay the full price or overpay. The average
payment is only 8 Eurocents. This figure is significantly lower than the average
payment in the survey sample (p = 0.000).
Figure 2: Relative frequency of payments
0.00
0.10
0.20
0.30
0.40
0.50
0.60
0.70
0.80
Euro
Survey (N = 402): Av. = 0.22
Field Experiment (N = 120): Av. = 0.08
0 ≤ 0.2 ≤ 0.4 < 0.6 0.6 > 0.6
- 9 -
There are several explanations for the differences in payments between the two
samples. First and most importantly, we conducted the survey on Sundays while the
experiment was run during the week. The paper is thicker and contains more
information on Sundays than during the week. Moreover, on weekdays subscribers to
the paper get the paper delivered via postal service. On Sundays only a few customers
with an extra subscription get delivered the paper to their homes. Therefore, Sunday
customers may value the paper higher than weekday customers. Second, only one
paper was in the bag under the conditions of the field experiment. In the survey study,
the natural condition applies, and a bag has been filled with 5 to 10 papers.
Differences in the anonymity of the customers may be a third reason for the observed
difference in payments. In particular, because the interviewer had to observe the sales
boot from some distance we cannot exclude the possibility that some customers
actually felt being observed. Finally, all experimental conditions prompted a message
to the customers. There was no such message in the natural condition which applied
to the survey.
4.1 Results from the field experiment
Figure 1 has revealed that the paper has been taken in 120 out of 333 cases. Table
2 shows how many of these sales resulted in a zero payment and decomposes the data
per treatment. We make two observations from this table. First, the sales do not differ
between treatments.6 We did not expect that one of our treatments would attract new
customers and this result does not come as a surprise.
The second observation is more informative and regards the number of free-riders
across treatments. If trustworthiness was driven by a legal norm, one would expect
that the number of free-riders decreases in response to a message that recalls to
customers that stealing the paper is illegal. However, Table 2 reveals that this
message is ineffective on free riders: in LEGAL, 66.7 percent of customers were free
riders; in CONTROL, 67.5 percent did not pay for the paper. In treatment SOCIAL
we identify 63.4 percent of customers as free riders. These numbers are not
significantly different from that in the treatment CONTROL. Before we provide an
6 For instance, testing for a difference in sales between SOCIAL and LEGAL gives a p-value of p =
0.468 according to a one-sided χ2-test.
- 10 -
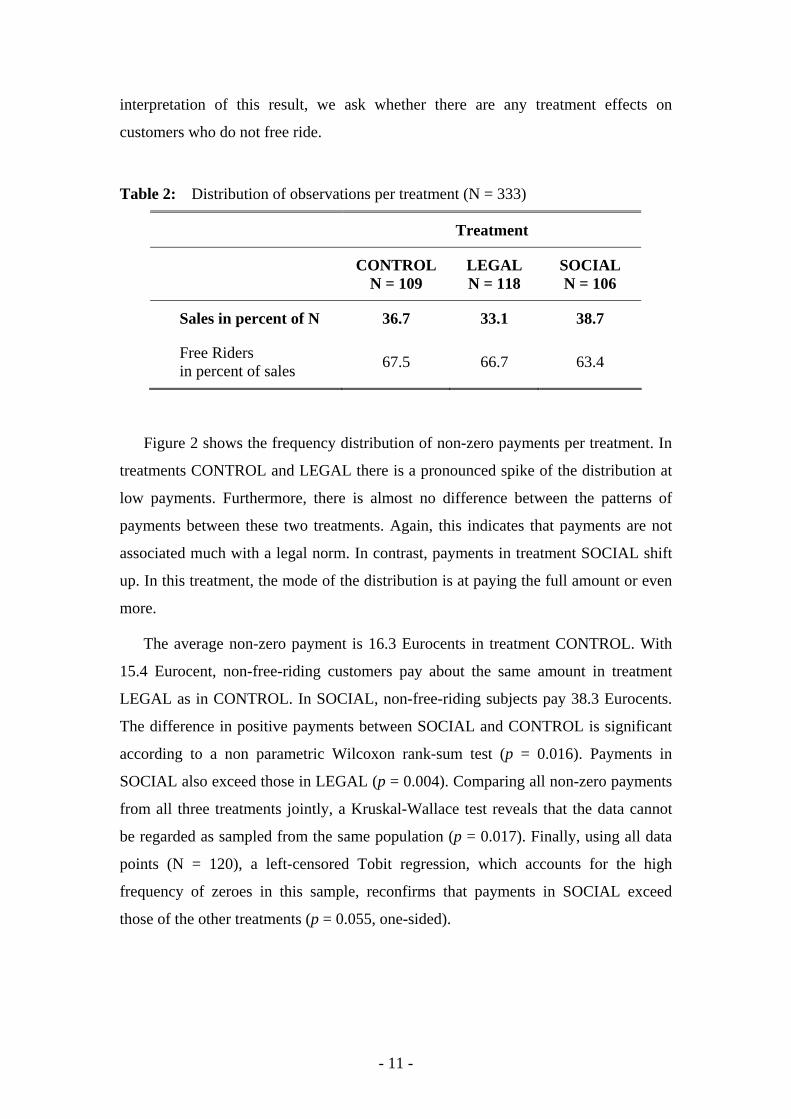
interpretation of this result, we ask whether there are any treatment effects on
customers who do not free ride.
Table 2: Distribution of observations per treatment (N = 333)
Treatment
CONTROL N = 109
LEGAL N = 118
SOCIAL N = 106
Sales in percent of N 36.7 33.1 38.7
Free Riders in percent of sales 67.5 66.7 63.4
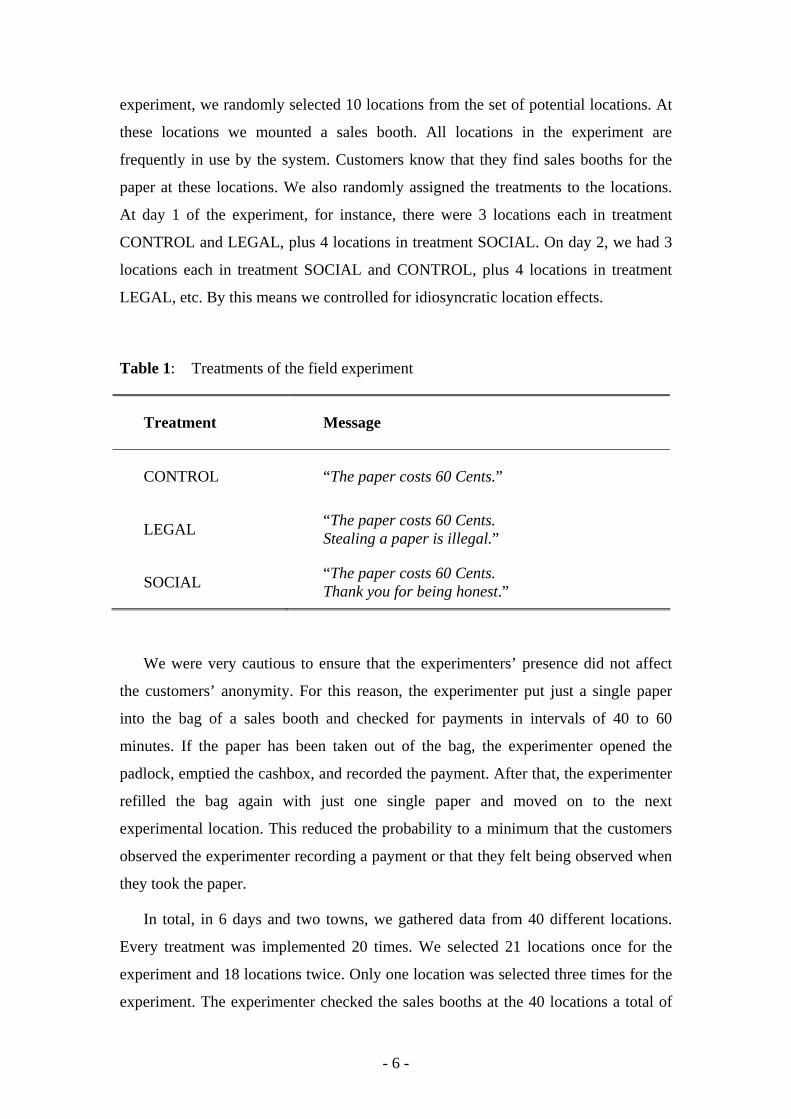
Figure 2 shows the frequency distribution of non-zero payments per treatment. In
treatments CONTROL and LEGAL there is a pronounced spike of the distribution at
low payments. Furthermore, there is almost no difference between the patterns of
payments between these two treatments. Again, this indicates that payments are not
associated much with a legal norm. In contrast, payments in treatment SOCIAL shift
up. In this treatment, the mode of the distribution is at paying the full amount or even
more.
The average non-zero payment is 16.3 Eurocents in treatment CONTROL. With
15.4 Eurocent, non-free-riding customers pay about the same amount in treatment
LEGAL as in CONTROL. In SOCIAL, non-free-riding subjects pay 38.3 Eurocents.
The difference in positive payments between SOCIAL and CONTROL is significant
according to a non parametric Wilcoxon rank-sum test (p = 0.016). Payments in
SOCIAL also exceed those in LEGAL (p = 0.004). Comparing all non-zero payments
from all three treatments jointly, a Kruskal-Wallace test reveals that the data cannot
be regarded as sampled from the same population (p = 0.017). Finally, using all data
points (N = 120), a left-censored Tobit regression, which accounts for the high
frequency of zeroes in this sample, reconfirms that payments in SOCIAL exceed
those of the other treatments (p = 0.055, one-sided).
- 11 -
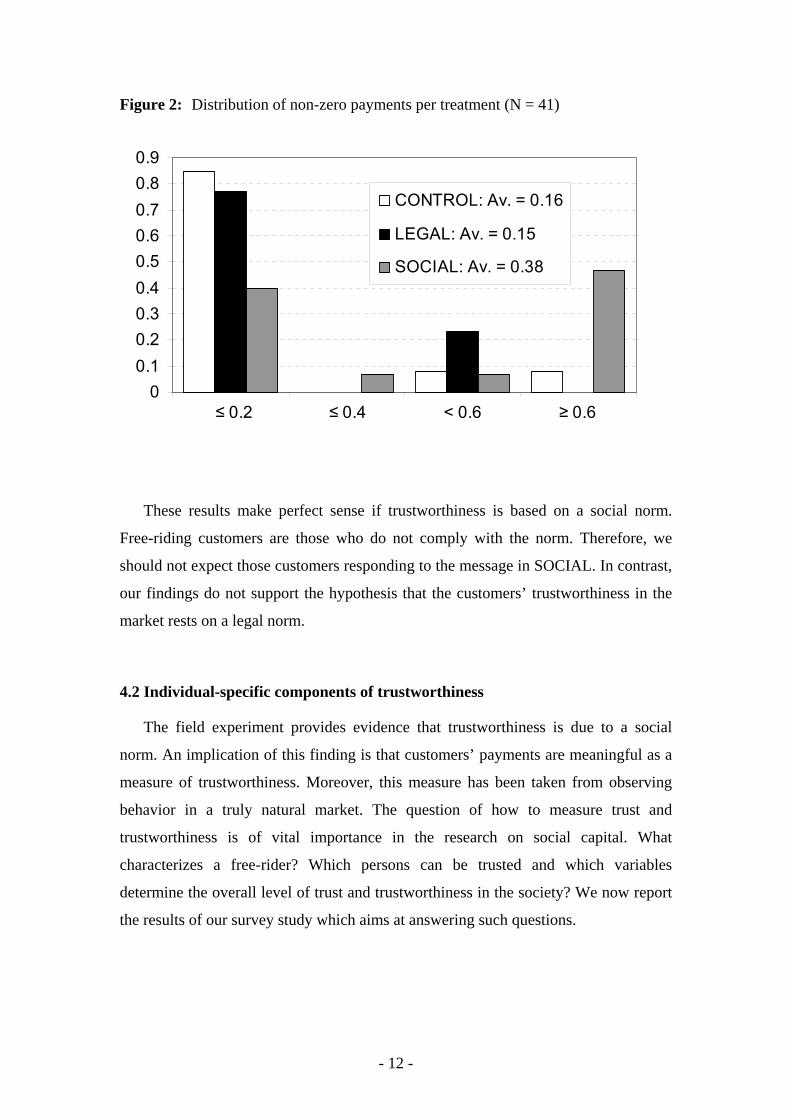
Figure 2: Distribution of non-zero payments per treatment (N = 41)
00.10.20.30.40.50.60.70.80.9
CONTROL: Av. = 0.16
LEGAL: Av. = 0.15
SOCIAL: Av. = 0.38
≤ 0.2 ≤ 0.4 < 0.6 ≥ 0.6
These results make perfect sense if trustworthiness is based on a social norm.
Free-riding customers are those who do not comply with the norm. Therefore, we
should not expect those customers responding to the message in SOCIAL. In contrast,
our findings do not support the hypothesis that the customers’ trustworthiness in the
market rests on a legal norm.
4.2 Individual-specific components of trustworthiness
The field experiment provides evidence that trustworthiness is due to a social
norm. An implication of this finding is that customers’ payments are meaningful as a
measure of trustworthiness. Moreover, this measure has been taken from observing
behavior in a truly natural market. The question of how to measure trust and
trustworthiness is of vital importance in the research on social capital. What
characterizes a free-rider? Which persons can be trusted and which variables
determine the overall level of trust and trustworthiness in the society? We now report
the results of our survey study which aims at answering such questions.
- 12 -
The rate of participation in the survey was 53 percent, i.e., 215 customers out of
402 in total agreed to participate in the interview (see Figure 1).7 Table 3 shows the
results from a regression between payments and various background variables. The
table also provides a summary of our results. A description of the variables in this
table is given in the Appendix 2. We use a left-censored Tobit model with zero as the
cutoff point to account for the fact that payments cannot be negative. To account for
idiosyncratic location effects the regression includes dummies for each location. The
number of observations in the regression is reduces from 215 to 197 because we lack
the income data of some customers.
The results show that male customers pay less than female ones (Male) and those
with an age above 50 years pay more than younger respondents (Age > 50).
Customers with children and those living in a partnership (including marriage) make
higher payments than singles without children (Kids&NoPartner, NoKids&Partner,
and Kids&Partner). Only children do not behave differently from customers with
siblings (OnlyChild). Personal income (Income) and a degree of higher education
(High_Education) do not affect payments.
Reciprocity_Pos indicates whether a customer is willing to return a favor for
beneficial behavior. This variable has a positive effect on payments. Reciprocity_Neg
captures a customer’s willingness to retaliate hostile behavior. There is no effect of
this variable. The variable Church indicates whether or not a customer regularly
attends the service at the church.8 It has a strong negative impact on payments.
Customers who regularly donate to social charity do not pay more for the paper
(Donate_Charity). Customers who spend time on volunteer work pay significantly
more for the paper (Volunteer).
Customers who care about what others think of them pay significantly more for
the Sunday paper (Esteem). Cheat_Tax indicates a customer’s willingness to evade
taxes if he or she had a chance to do so. The estimated effect of this variable on
payments is strongly negative. Gambling indicates the willingness to bet a days 7 There is a selection effect with respect to participation: the customers who participate in the
interview pay more for the paper than the rest (25.8 vs. 17.9 Eurocents, p = 0.004). Several arguments can explain this effect. For instance, paying customers with social concerns may coincide with those willing to take the interview. Moreover, who likes to be discovered being a free-rider? It is not surprising that free-riders are less willing to get stopped and talk to an interviewer right after they have stolen a newspaper from the booth.
8 We did not ask for the confession because a vast majority of people living in the western provinces of Austria are Roman Catholic.
- 13 -
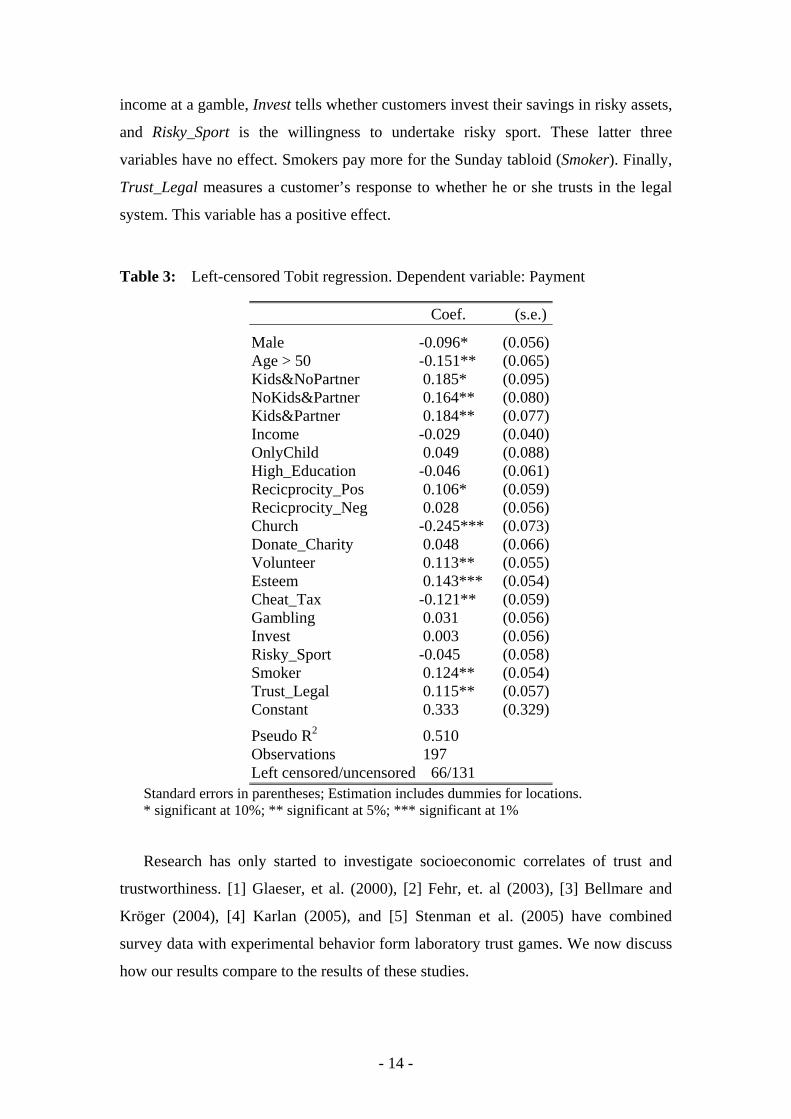
income at a gamble, Invest tells whether customers invest their savings in risky assets,
and Risky_Sport is the willingness to undertake risky sport. These latter three
variables have no effect. Smokers pay more for the Sunday tabloid (Smoker). Finally,
Trust_Legal measures a customer’s response to whether he or she trusts in the legal
system. This variable has a positive effect.
Table 3: Left-censored Tobit regression. Dependent variable: Payment
Coef. (s.e.)
Male -0.096* (0.056) Age > 50 -0.151** (0.065) Kids&NoPartner 0.185* (0.095) NoKids&Partner 0.164** (0.080) Kids&Partner 0.184** (0.077) Income -0.029 (0.040) OnlyChild 0.049 (0.088) High_Education -0.046 (0.061) Recicprocity_Pos 0.106* (0.059) Recicprocity_Neg 0.028 (0.056) Church -0.245*** (0.073) Donate_Charity 0.048 (0.066) Volunteer 0.113** (0.055) Esteem 0.143*** (0.054) Cheat_Tax -0.121** (0.059) Gambling 0.031 (0.056) Invest 0.003 (0.056) Risky_Sport -0.045 (0.058) Smoker 0.124** (0.054) Trust_Legal 0.115** (0.057) Constant 0.333 (0.329)
Pseudo R2 0.510 Observations 197 Left censored/uncensored 66/131
Standard errors in parentheses; Estimation includes dummies for locations. * significant at 10%; ** significant at 5%; *** significant at 1%
Research has only started to investigate socioeconomic correlates of trust and
trustworthiness. [1] Glaeser, et al. (2000), [2] Fehr, et. al (2003), [3] Bellmare and
Kröger (2004), [4] Karlan (2005), and [5] Stenman et al. (2005) have combined
survey data with experimental behavior form laboratory trust games. We now discuss
how our results compare to the results of these studies.
- 14 -
Our finding that males pay less than females is consistent with [3]. That age
depresses trustworthiness is also found by [2], [3], and [4]. [2] and [4] find no impact
of higher education on trustworthiness. However, [3] find that education is negatively
associated with trustworthiness in the Netherlands, whereas [5] find the reverse for
Bangladesh. The finding that there is no impact of income on trustworthiness is in line
with [2], [3], and [5]. [1] find that only children are less likely to return trust. In line
with our results, [2] do not observe any effect of having siblings. Our finding that
customers who frequently attend the service at church pay less for the Sunday paper is
consistent with [2], who find a negative effect of being catholic on being trustworthy.
Negative effects of church attendance are also reported in [4].9
Volunteer work is a measure of social connectedness. Our finding that members
of volunteer organizations pay more for the newspaper is in line with [1] and other
studies cited by these authors who identify social connectedness as determinant of
social capital. Similarly, “Do you trust in the legal system?” is one of several
questions related to trust in the General Social Survey. [1], [2], [3], and [4] find that
such attitudinal measures of trust are associated with trustworthy behavior.10
Regarding Reciprocity_Pos, this variable takes the value of one for 74 percent of
customers (159/215) who responded that they would certainly return a favor for
beneficial behavior in the interview, and zero else.11 As it shows, customers with a
tendency to reward kind behavior are also those who make higher payments for the
newspaper. This finding is consistent with a large body of theoretical and empirical
research on social preferences (for a survey see, Camerer 2003).
In contrast to laboratory studies on trust, we cannot exclude that the behavior
observed in the field is motivated by considerations of risk. From a psychological
perspective risk can have many different domains (e.g., Weber et al. 2002). To
account for this fact, we have asked questions regarding social risk (Esteem), ethical
risk (Cheat_Tax), statistical risk (Gambling), financial risk (Invest), recreational risk
(Risky_Sport), and health risk (Smoker). We find that newspaper customers at Sunday 9 We wish to note that the negative coefficient of church attendance may be driven by variables
other than confession or religion. People who have just attended the service at the church may lack the coin money to pay for the newspaper if they have donated this money at the gatherings of the church.
10 In contrast, first movers’ behavior in the trust game is poorly associated with measures of trust. See, Karlan (2005).
11 The exact wording of the question is given in appendix 2. This question has been used by Leuven et al. (2005) to measure attitudes towards reciprocation.
- 15 -
sales booths are concerned about what others think of them and care about ethical
behavior. Customers who smoke pay more for the Sunday paper. One interpretation of
this last result is that smokers are more risk seeking.12 A plausible alternative
explanation is that smokers simply have a higher willingness to pay for the paper.
5 Summary and conclusion
This study extends existing research on trust in two important dimensions. First,
we conduct a natural field experiment to determine the motives behind
trustworthiness in a natural market with anonymous customers. The experiment varies
messages that are shown to customers. The first treatment reminds customers of the
existing legal norm. The second treatments appeals to a social norm.
The outcome of the field experiment is that customers increase their payments in
response to a message that appeals a social norm. The important observation is that
free riders do not react to this treatment, i.e., this result is exclusively driven by non-
free riding customers. This finding supports the view that social norms explain
trustworthiness in the field. Furthermore, in the market for newspapers it is unlikely
that the customers exhibit trustworthiness because of simple altruism towards the
publisher. Rather, the social norm is reciprocal in the sense that the customers feel
obliged to repay the publisher for his service.
Our second contribution to existing research is that we ask survey questions of
customers whose behavior we observe in a field market. The survey enables us to
identify individual-specific correlates of trustworthiness in a fully natural context. We
identify a number of significant variables. For instance, males pay less than females,
older people pay less than younger ones, and customers who spend time on volunteer
work pay more for the Sunday paper. We find that people at the sales booths are
concerned about aspects of ethical and social risk. On the other hand, measures of
financial risk do not contribute to explain payments. Finally, in line with what we
have found in the field experiment, measures of reciprocity are capable of explaining
payments. These results are potentially important for research on social capital.
12 This finding is robust with respect to another variable in our survey asking about how many times
a customer has preventative medical checkups.
- 16 -
- 17 -
References
Anderson, L. R, J.M. Mellor, and J. Milyo (2004): Social Capital and Contributions in a Public Good Experiment. American Economic Review. Papers and Proceedings 94(2): 373-6.
Barr, A. (2003): Trust and Expected Trustworthiness: Experimental Evidence from Zimbabwean Villages. Economic Journal 113: 614-30.
Bellmare, C. and S. Kröger (2004): On Representative Social Capital. IZA Discussion Paper No 1145.
Berg, J., Dickhaut, J., and McCabe, K. (1995): Trust, Reciprocity and Social History. Games and Economic Behavior 10: 122-42.
Camerer, C.F. (2003): Behavioral Game Theory – Experiments in Strategic Interaction. Princeton: Princeton University Press.
Dawes, R. and R. Thaler (1988): Anomalies: Cooperation. Journal of Economic Perspectives 2(3): 187-97.
Fehr, E., U. Fischbacher, B. von Rosenbladt, J. Schupp, and G. Wagner (2003): A Nation-Wide Laboratory - Examining Trust and Trustworthiness by Integrating Experiments in Representative Surveys. IZA Discussion Paper no 175.
Gächter, S., B. Herrmann, and C. Thöni (2004): Trust, Voluntary Cooperation, and Socio-Economic Background: Survey and Experimental Evidence. Journal of Economic Behavior and Organization 55(4): 505-31.
Glaeser, E. L., D. Laibson, J.A. Scheinkman, and C.L. Soutter (2000): Measuring Trust. Quarterly Journal of Economics 65: 811-46.
Harrison, G. W. and J.A. List (2004): Field Experiments. Journal of Economic Literature 42(4): 1009-55.
Johansson-Stenman, O., M. Mahmud, and P. Martinsson (2005): Trust, Trust Games and Stated Trust: Evidence from Rural Bangladesh. Working Papers in Economics No 166. Göteborg University, Department of Economics.
Karlan, D. S. (2005): Using Experimental Economics to Measure Social Capital and Predict Financial Decisions. American Economic Review 95(5): 1688-99.
Leuven, E., H. Oosterbeek, R. Sloof, and C. van Klaveren (2005): Worker Reciprocity and Employer Investment in Training. Economica 72: 137-49.
Schechter, L. (2006): Theft, Gift-Giving, and Trustworthiness: Honesty is Its Own Reward in Rural Paraguay. Working Paper. University of Wisconsin-Madison.
Sobel, J. (2002): Can we Trust Social Capital? Journal of Economic Literature 40(1): 139-54.
Weber, E. U., A.-R. Blais, and N.C. Betz (2002): A Domain-Specific Risk-Attitude Scale: Measuring Risk Perceptions and Risk Behaviors. Journal of Behavioral Decision Making 15: 263-90.
.
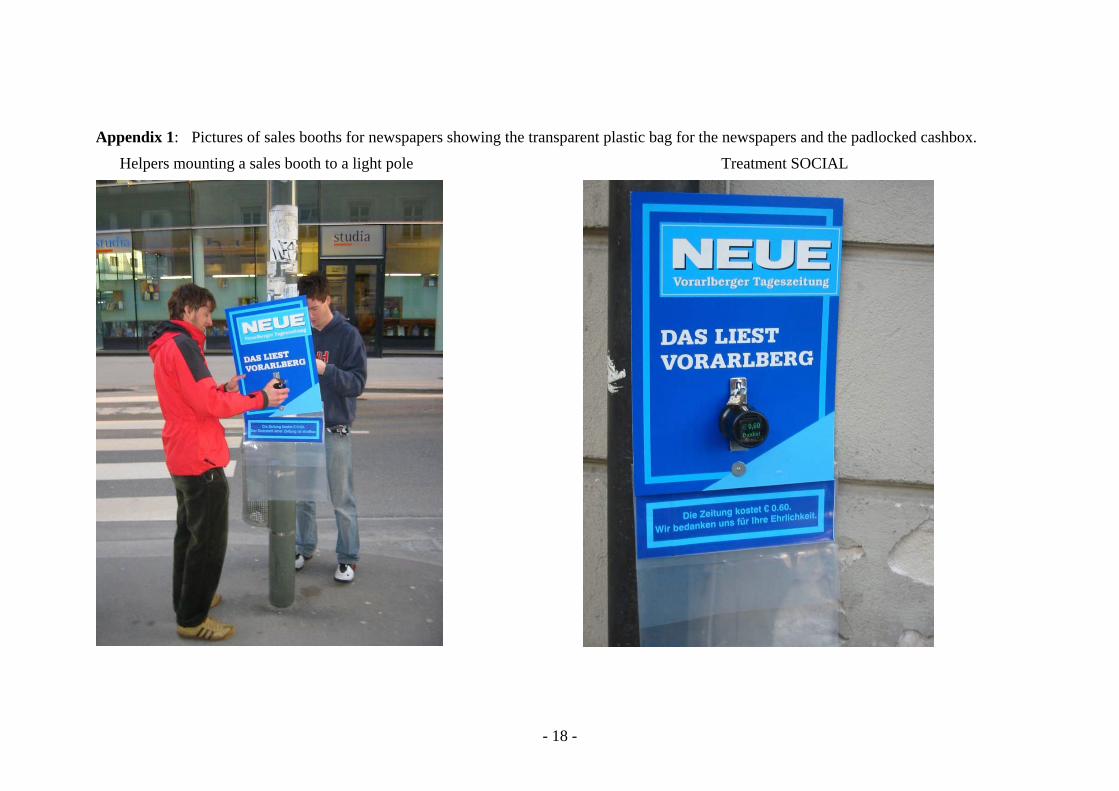
Appendix 1: Pictures of sales booths for newspapers showing the transparent plastic bag for the newspapers and the padlocked cashbox.
Helpers mounting a sales booth to a light pole
Treatment SOCIAL
- 18 -
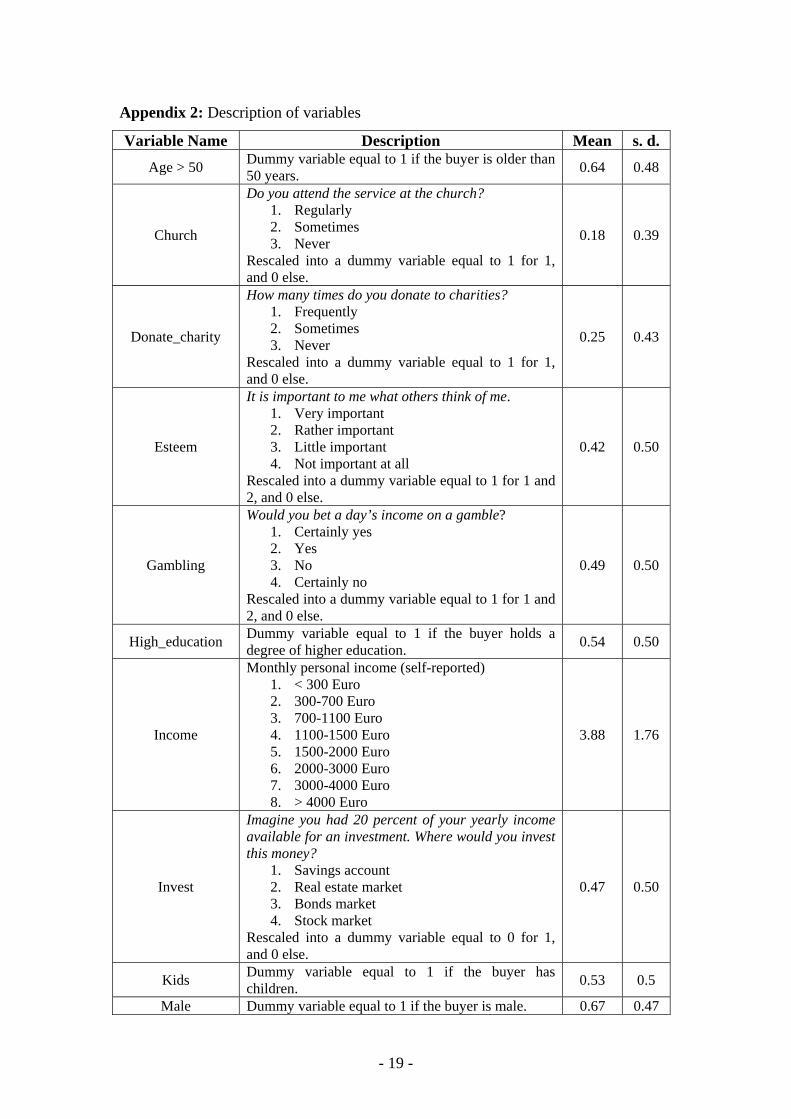
Appendix 2: Description of variables
Variable Name Description Mean s. d. Age > 50 Dummy variable equal to 1 if the buyer is older than
50 years. 0.64 0.48
Church
Do you attend the service at the church? 1. Regularly 2. Sometimes 3. Never
Rescaled into a dummy variable equal to 1 for 1, and 0 else.
0.18 0.39
Donate_charity
How many times do you donate to charities? 1. Frequently 2. Sometimes 3. Never
Rescaled into a dummy variable equal to 1 for 1, and 0 else.
0.25 0.43
Esteem
It is important to me what others think of me. 1. Very important 2. Rather important 3. Little important 4. Not important at all
Rescaled into a dummy variable equal to 1 for 1 and 2, and 0 else.
0.42 0.50
Gambling
Would you bet a day’s income on a gamble? 1. Certainly yes 2. Yes 3. No 4. Certainly no
Rescaled into a dummy variable equal to 1 for 1 and 2, and 0 else.
0.49 0.50
High_education Dummy variable equal to 1 if the buyer holds a degree of higher education. 0.54 0.50
Income
Monthly personal income (self-reported) 1. < 300 Euro 2. 300-700 Euro 3. 700-1100 Euro 4. 1100-1500 Euro 5. 1500-2000 Euro 6. 2000-3000 Euro 7. 3000-4000 Euro 8. > 4000 Euro
3.88 1.76
Invest
Imagine you had 20 percent of your yearly income available for an investment. Where would you invest this money?
1. Savings account 2. Real estate market 3. Bonds market 4. Stock market
Rescaled into a dummy variable equal to 0 for 1, and 0 else.
0.47 0.50
Kids Dummy variable equal to 1 if the buyer has children. 0.53 0.5
Male Dummy variable equal to 1 if the buyer is male. 0.67 0.47
- 19 -
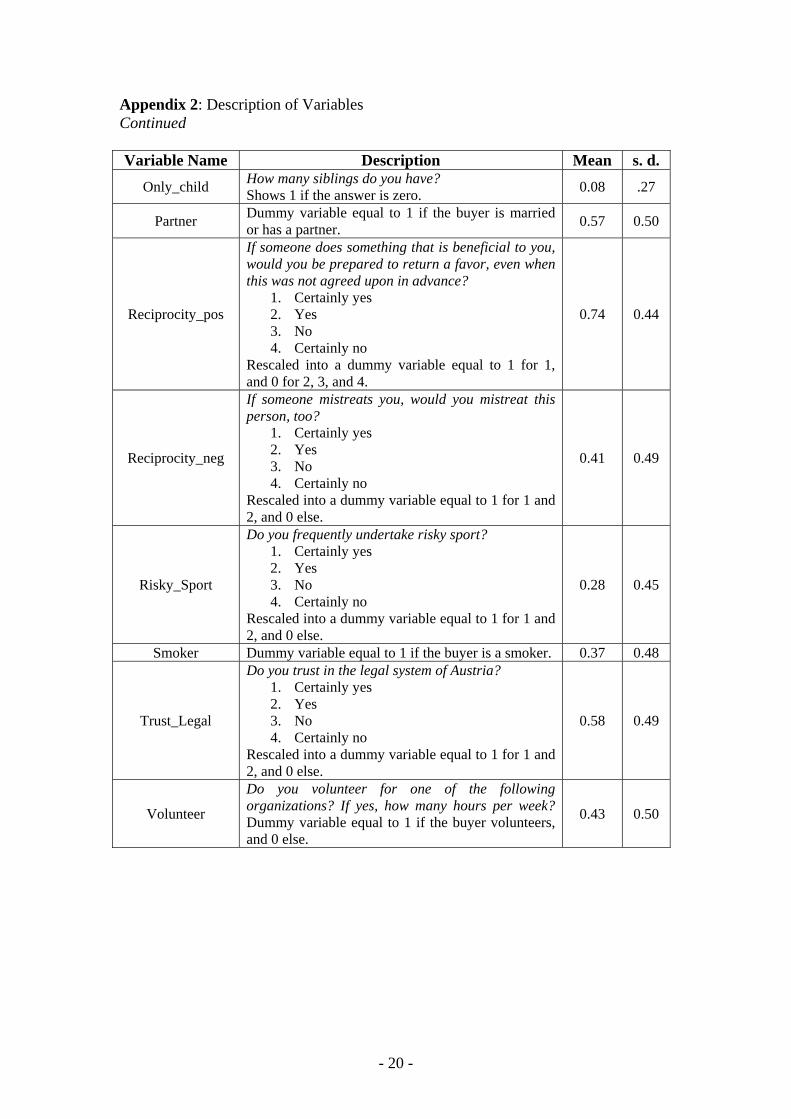
Appendix 2: Description of Variables Continued Variable Name Description Mean s. d.
Only_child How many siblings do you have? Shows 1 if the answer is zero. 0.08 .27
Partner Dummy variable equal to 1 if the buyer is married or has a partner. 0.57 0.50
Reciprocity_pos
If someone does something that is beneficial to you, would you be prepared to return a favor, even when this was not agreed upon in advance?
1. Certainly yes 2. Yes 3. No 4. Certainly no
Rescaled into a dummy variable equal to 1 for 1, and 0 for 2, 3, and 4.
0.74 0.44
Reciprocity_neg
If someone mistreats you, would you mistreat this person, too?
1. Certainly yes 2. Yes 3. No 4. Certainly no
Rescaled into a dummy variable equal to 1 for 1 and 2, and 0 else.
0.41 0.49
Risky_Sport
Do you frequently undertake risky sport? 1. Certainly yes 2. Yes 3. No 4. Certainly no
Rescaled into a dummy variable equal to 1 for 1 and 2, and 0 else.
0.28 0.45
Smoker Dummy variable equal to 1 if the buyer is a smoker. 0.37 0.48
Trust_Legal
Do you trust in the legal system of Austria? 1. Certainly yes 2. Yes 3. No 4. Certainly no
Rescaled into a dummy variable equal to 1 for 1 and 2, and 0 else.
0.58 0.49
Volunteer
Do you volunteer for one of the following organizations? If yes, how many hours per week? Dummy variable equal to 1 if the buyer volunteers, and 0 else.
0.43 0.50
- 20 -