Embed Size (px)
Citation preview
S t r e e t s , T r a n s p o r t a t i o n & S a n i t a t i o n • C a b i n e t 2 4 7
Streets, Transportation & Sanitation
Streets, Transportation & Sanitation Cabinet
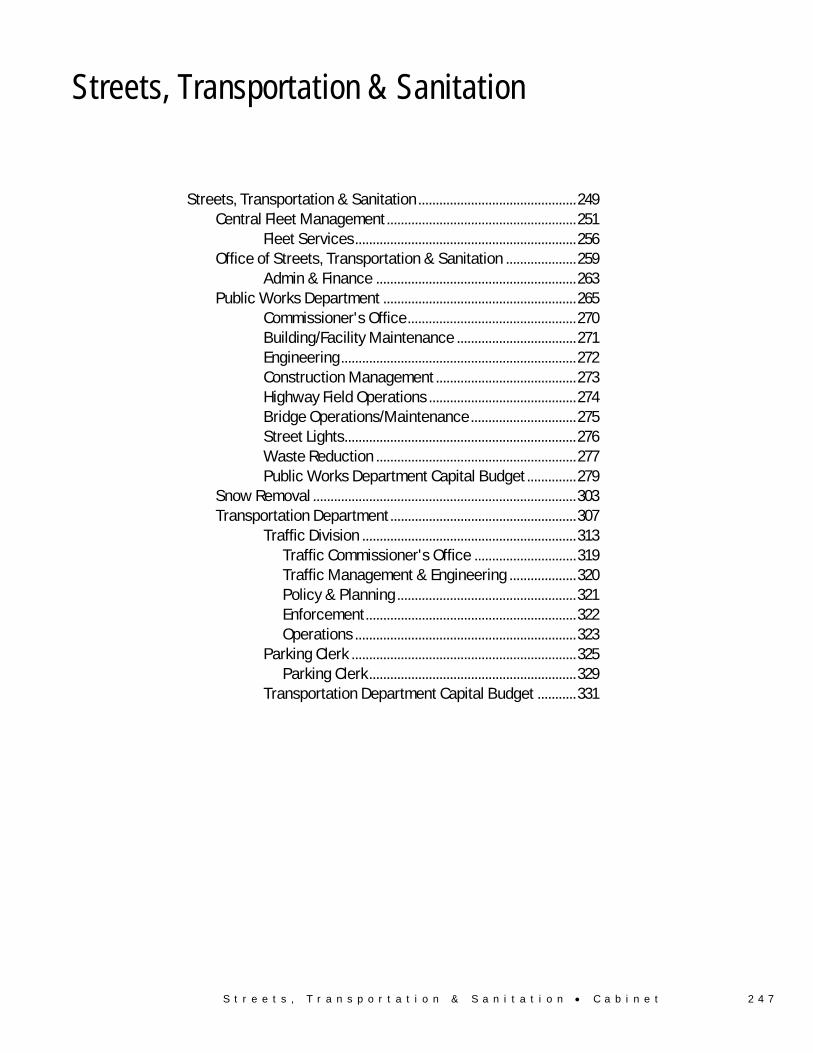
Streets, Transportation & Sanitation ............................................. 249 Central Fleet Management ...................................................... 251
Fleet Services ............................................................... 256 Office of Streets, Transportation & Sanitation .................... 259
Admin & Finance ......................................................... 263 Public Works Department ....................................................... 265
Commissioner's Office ................................................ 270 Building/Facility Maintenance .................................. 271 Engineering ................................................................... 272 Construction Management ........................................ 273 Highway Field Operations .......................................... 274 Bridge Operations/Maintenance .............................. 275 Street Lights .................................................................. 276 Waste Reduction ......................................................... 277 Public Works Department Capital Budget .............. 279
Snow Removal ........................................................................... 303 Transportation Department ..................................................... 307
Traffic Division ............................................................. 313 Traffic Commissioner's Office ............................. 319 Traffic Management & Engineering ................... 320 Policy & Planning ................................................... 321 Enforcement ............................................................ 322 Operations ............................................................... 323
Parking Clerk ................................................................ 325 Parking Clerk ........................................................... 329
Transportation Department Capital Budget ........... 331

2 4 8 S t r e e t s , T r a n s p o r t a t i o n & S a n i t a t i o n • C a b i n e t
S t r e e t s , T r a n s p o r t a t i o n & S a n i t a t i o n • C a b i n e t 2 4 9
Streets, Transportation & Sanitation
Streets, Transportation & Sanitation
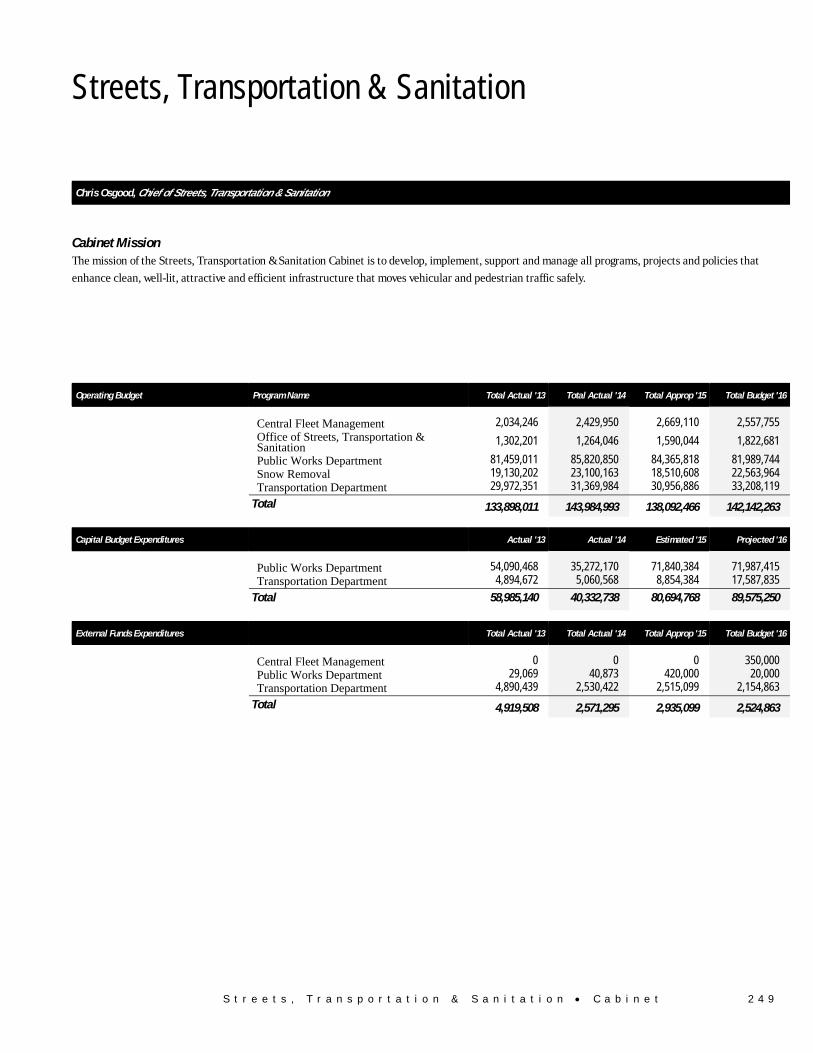
Chris Osgood, Chief of Streets, Transportation & Sanitation
Cabinet Mission The mission of the Streets, Transportation & Sanitation Cabinet is to develop, implement, support and manage all programs, projects and policies that
enhance clean, well-lit, attractive and efficient infrastructure that moves vehicular and pedestrian traffic safely.
Operating Budget Program Name Total Actual '13 Total Actual '14 Total Approp '15 Total Budget '16
Central Fleet Management 2,034,246 2,429,950 2,669,110 2,557,755
Office of Streets, Transportation & Sanitation 1,302,201 1,264,046 1,590,044 1,822,681
Public Works Department 81,459,011 85,820,850 84,365,818 81,989,744Snow Removal 19,130,202 23,100,163 18,510,608 22,563,964Transportation Department 29,972,351 31,369,984 30,956,886 33,208,119
Total 133,898,011 143,984,993 138,092,466 142,142,263
Capital Budget Expenditures Actual '13 Actual '14 Estimated '15 Projected '16
Public Works Department 54,090,468 35,272,170 71,840,384 71,987,415 Transportation Department 4,894,672 5,060,568 8,854,384 17,587,835
Total 58,985,140 40,332,738 80,694,768 89,575,250
External Funds Expenditures Total Actual '13 Total Actual '14 Total Approp '15 Total Budget '16
Central Fleet Management 0 0 0 350,000 Public Works Department 29,069 40,873 420,000 20,000 Transportation Department 4,890,439 2,530,422 2,515,099 2,154,863
Total 4,919,508 2,571,295 2,935,099 2,524,863

S t r e e t s , T r a n s p o r t a t i o n & S a n i t a t i o n • C e n t r a l F l e e t M a n a g e m e n t 2 5 1
Central Fleet Management Operating Budget
Streets, Transportation & Sanitation Central Fleet Management
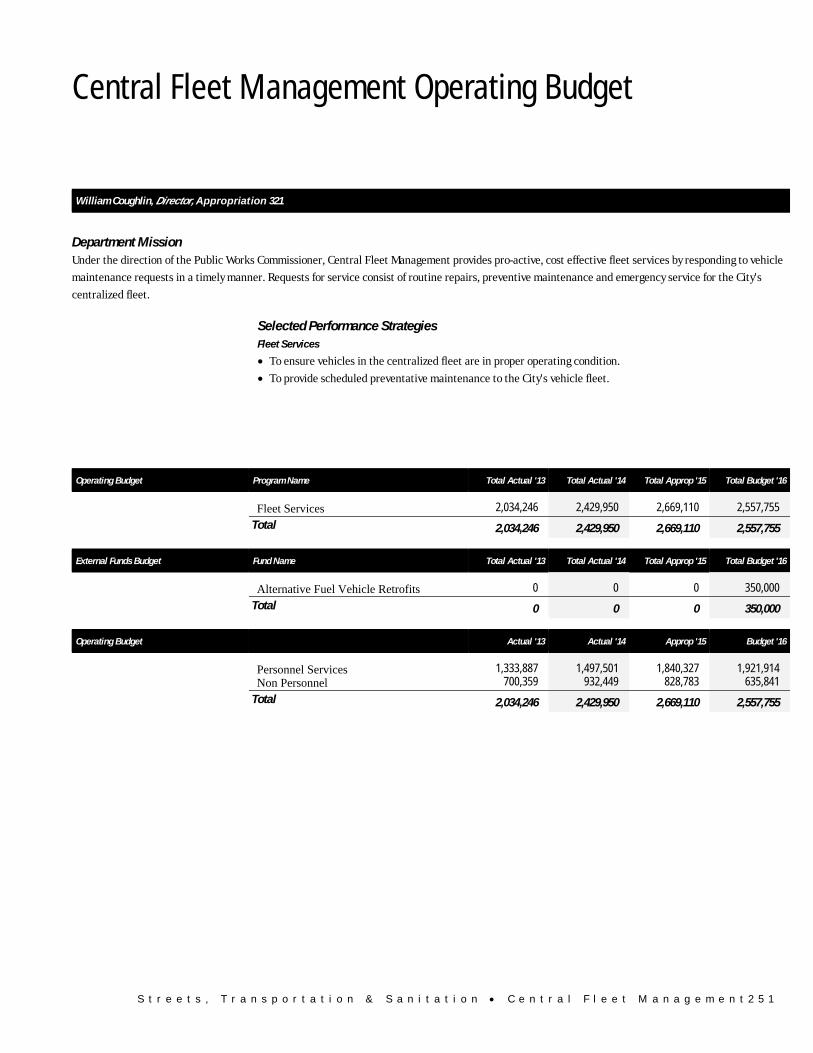
William Coughlin, Director, Appropriation 321
Department Mission Under the direction of the Public Works Commissioner, Central Fleet Management provides pro-active, cost effective fleet services by responding to vehicle
maintenance requests in a timely manner. Requests for service consist of routine repairs, preventive maintenance and emergency service for the City's
centralized fleet.
Selected Performance Strategies Fleet Services
• To ensure vehicles in the centralized fleet are in proper operating condition.
• To provide scheduled preventative maintenance to the City's vehicle fleet.
Operating Budget Program Name Total Actual '13 Total Actual '14 Total Approp '15 Total Budget '16
Fleet Services 2,034,246 2,429,950 2,669,110 2,557,755
Total 2,034,246 2,429,950 2,669,110 2,557,755
External Funds Budget Fund Name Total Actual '13 Total Actual '14 Total Approp '15 Total Budget '16
Alternative Fuel Vehicle Retrofits 0 0 0 350,000
Total 0 0 0 350,000
Operating Budget Actual '13 Actual '14 Approp '15 Budget '16
Personnel Services 1,333,887 1,497,501 1,840,327 1,921,914 Non Personnel 700,359 932,449 828,783 635,841
Total 2,034,246 2,429,950 2,669,110 2,557,755
2 5 2 S t r e e t s , T r a n s p o r t a t i o n & S a n i t a t i o n • C e n t r a l F l e e t M a n a g e m e n t
Central Fleet Management Operating Budget
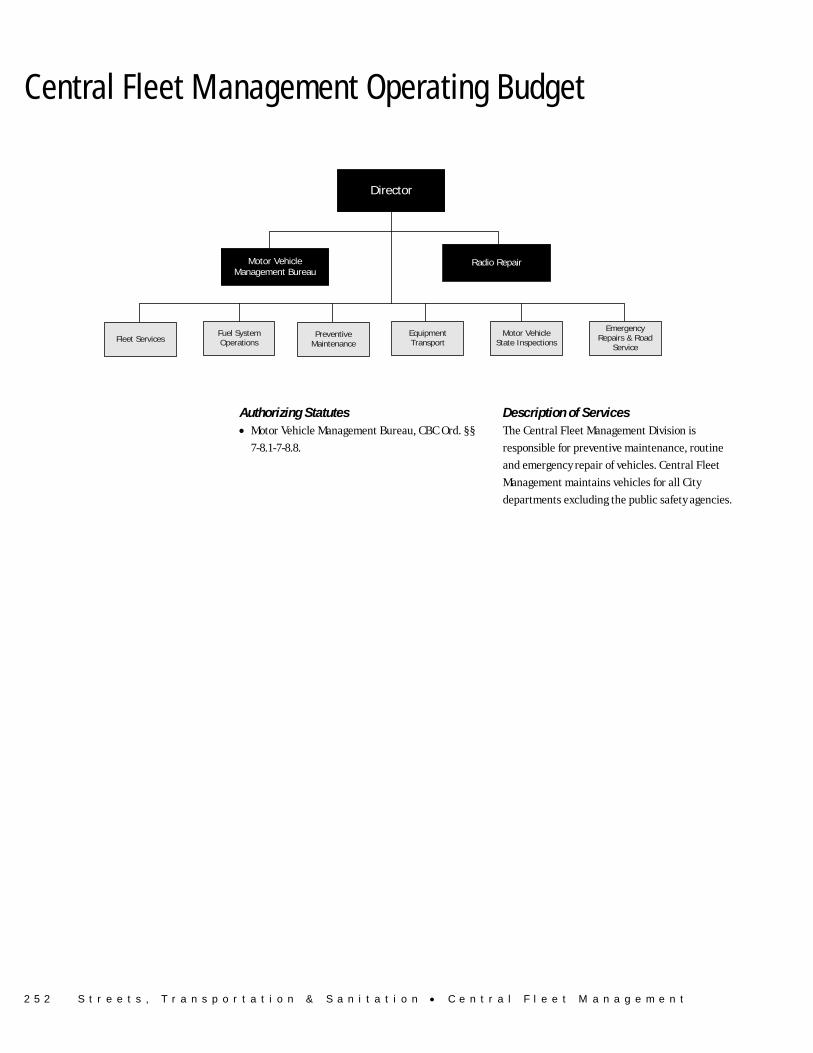
Director
Radio Repair
Fleet Services
Motor VehicleManagement Bureau
Fuel SystemOperations
PreventiveMaintenance
EquipmentTransport
Motor VehicleState Inspections
EmergencyRepairs & Road
Service
Authorizing Statutes • Motor Vehicle Management Bureau, CBC Ord. §§
7-8.1-7-8.8.
Description of Services The Central Fleet Management Division is
responsible for preventive maintenance, routine
and emergency repair of vehicles. Central Fleet
Management maintains vehicles for all City
departments excluding the public safety agencies.

S t r e e t s , T r a n s p o r t a t i o n & S a n i t a t i o n • C e n t r a l F l e e t M a n a g e m e n t 2 5 3
Department History
Personnel Services FY13 Expenditure FY14 Expenditure FY15 Appropriation FY16 Adopted Inc/Dec 15 vs 16
51000 Permanent Employees 1,274,723 1,433,118 1,799,827 1,870,414 70,587 51100 Emergency Employees 0 0 0 0 0 51200 Overtime 59,164 64,383 40,500 51,500 11,000 51600 Unemployment Compensation 0 0 0 0 0 51700 Workers' Compensation 0 0 0 0 0 Total Personnel Services 1,333,887 1,497,501 1,840,327 1,921,914 81,587
Contractual Services FY13 Expenditure FY14 Expenditure FY15 Appropriation FY16 Adopted Inc/Dec 15 vs 16
52100 Communications 0 3,811 5,600 6,900 1,300 52200 Utilities 0 0 0 0 0 52400 Snow Removal 0 0 0 0 0 52500 Garbage/Waste Removal 11,445 550 10,000 5,000 -5,000 52600 Repairs Buildings & Structures 0 0 0 0 0 52700 Repairs & Service of Equipment 35,650 421,979 146,700 135,529 -11,171 52800 Transportation of Persons 3,505 1,846 3,500 3,500 0 52900 Contracted Services 29,365 50,089 53,390 55,322 1,932 Total Contractual Services 79,965 478,275 219,190 206,251 -12,939
Supplies & Materials FY13 Expenditure FY14 Expenditure FY15 Appropriation FY16 Adopted Inc/Dec 15 vs 16
53000 Auto Energy Supplies 393,810 158,107 117,702 87,380 -30,322 53200 Food Supplies 0 0 0 0 0 53400 Custodial Supplies 0 0 0 0 0 53500 Med, Dental, & Hosp Supply 0 0 0 0 0 53600 Office Supplies and Materials 1,801 3,148 3,200 3,200 0 53700 Clothing Allowance 0 0 0 0 0 53800 Educational Supplies & Mat 0 0 0 0 0 53900 Misc Supplies & Materials 24,301 0 80,000 58,800 -21,200 Total Supplies & Materials 419,912 161,255 200,902 149,380 -51,522
Current Chgs & Oblig FY13 Expenditure FY14 Expenditure FY15 Appropriation FY16 Adopted Inc/Dec 15 vs 16
54300 Workers' Comp Medical 0 0 0 0 0 54400 Legal Liabilities 0 0 0 0 0 54500 Aid To Veterans 0 0 0 0 0 54600 Current Charges H&I 0 0 0 0 0 54700 Indemnification 0 0 0 0 0 54900 Other Current Charges 52,085 45,522 51,345 7,850 -43,495 Total Current Chgs & Oblig 52,085 45,522 51,345 7,850 -43,495
Equipment FY13 Expenditure FY14 Expenditure FY15 Appropriation FY16 Adopted Inc/Dec 15 vs 16
55000 Automotive Equipment 0 0 0 0 0 55400 Lease/Purchase 130,166 230,277 339,371 261,510 -77,861 55600 Office Furniture & Equipment 0 0 0 0 0 55900 Misc Equipment 18,231 17,120 17,975 10,850 -7,125 Total Equipment 148,397 247,397 357,346 272,360 -84,986
Other FY13 Expenditure FY14 Expenditure FY15 Appropriation FY16 Adopted Inc/Dec 15 vs 16
56200 Special Appropriation 0 0 0 0 0 57200 Structures & Improvements 0 0 0 0 0 58000 Land & Non-Structure 0 0 0 0 0 Total Other 0 0 0 0 0
Grand Total 2,034,246 2,429,950 2,669,110 2,557,755 -111,355
2 5 4 S t r e e t s , T r a n s p o r t a t i o n & S a n i t a t i o n • C e n t r a l F l e e t M a n a g e m e n t
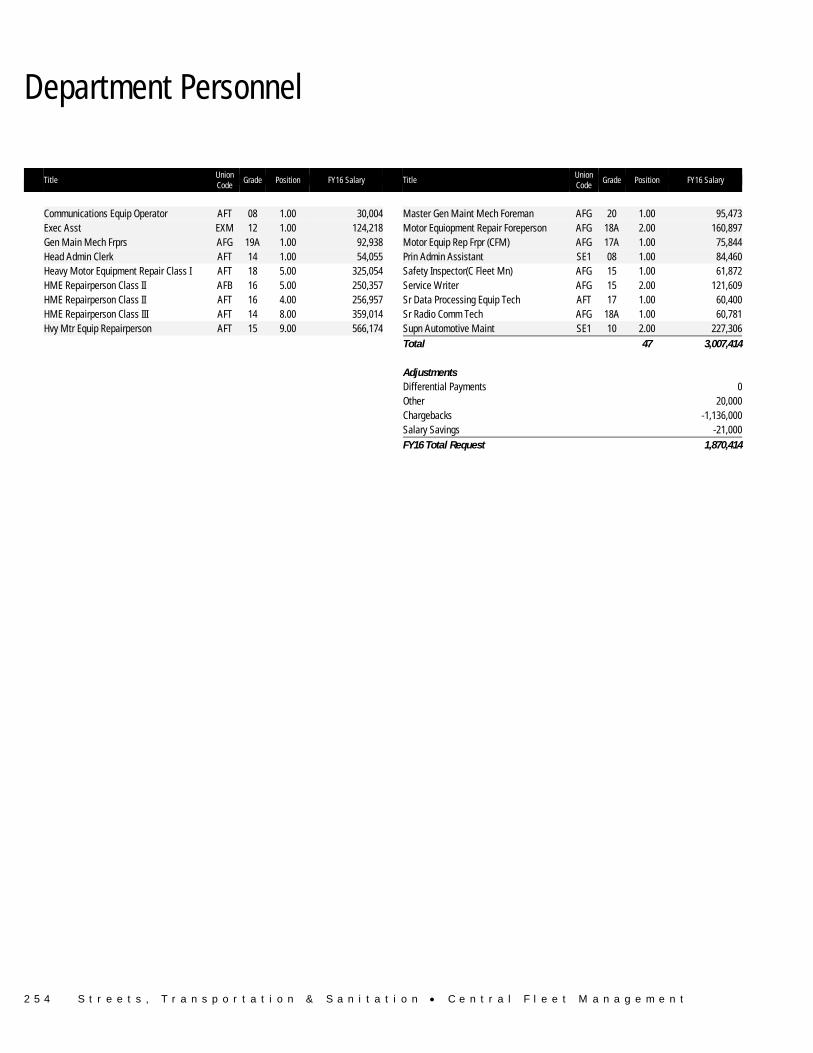
Department Personnel
Title Union Code
Grade Position FY16 Salary Title Union Code
Grade Position FY16 Salary
Communications Equip Operator AFT 08 1.00 30,004 Master Gen Maint Mech Foreman AFG 20 1.00 95,473 Exec Asst EXM 12 1.00 124,218 Motor Equiopment Repair Foreperson AFG 18A 2.00 160,897 Gen Main Mech Frprs AFG 19A 1.00 92,938 Motor Equip Rep Frpr (CFM) AFG 17A 1.00 75,844 Head Admin Clerk AFT 14 1.00 54,055 Prin Admin Assistant SE1 08 1.00 84,460 Heavy Motor Equipment Repair Class I AFT 18 5.00 325,054 Safety Inspector(C Fleet Mn) AFG 15 1.00 61,872 HME Repairperson Class II AFB 16 5.00 250,357 Service Writer AFG 15 2.00 121,609 HME Repairperson Class II AFT 16 4.00 256,957 Sr Data Processing Equip Tech AFT 17 1.00 60,400 HME Repairperson Class III AFT 14 8.00 359,014 Sr Radio Comm Tech AFG 18A 1.00 60,781 Hvy Mtr Equip Repairperson AFT 15 9.00 566,174 Supn Automotive Maint SE1 10 2.00 227,306 Total 47 3,007,414 Adjustments Differential Payments 0 Other 20,000 Chargebacks -1,136,000 Salary Savings -21,000 FY16 Total Request 1,870,414

S t r e e t s , T r a n s p o r t a t i o n & S a n i t a t i o n • C e n t r a l F l e e t M a n a g e m e n t 2 5 5
External Funds History
Personnel Services FY13 Expenditure FY14 Expenditure FY15 Appropriation FY16 Adopted Inc/Dec 15 vs 16
51000 Permanent Employees 0 0 0 0 0 51100 Emergency Employees 0 0 0 0 0 51200 Overtime 0 0 0 0 0 51300 Part Time Employees 0 0 0 0 0 51400 Health Insurance 0 0 0 0 0 51500 Pension & Annunity 0 0 0 0 0 51600 Unemployment Compensation 0 0 0 0 0 51700 Workers' Compensation 0 0 0 0 0 51800 Indirect Costs 0 0 0 0 0 51900 Medicare 0 0 0 0 0 Total Personnel Services 0 0 0 0 0
Contractual Services FY13 Expenditure FY14 Expenditure FY15 Appropriation FY16 Adopted Inc/Dec 15 vs 16
52100 Communications 0 0 0 0 0 52200 Utilities 0 0 0 0 0 52400 Snow Removal 0 0 0 0 0 52500 Garbage/Waste Removal 0 0 0 0 0 52600 Repairs Buildings & Structures 0 0 0 0 0 52700 Repairs & Service of Equipment 0 0 0 350,000 350,000 52800 Transportation of Persons 0 0 0 0 0 52900 Contracted Services 0 0 0 0 0 Total Contractual Services 0 0 0 350,000 350,000
Supplies & Materials FY13 Expenditure FY14 Expenditure FY15 Appropriation FY16 Adopted Inc/Dec 15 vs 16
53000 Auto Energy Supplies 0 0 0 0 0 53200 Food Supplies 0 0 0 0 0 53400 Custodial Supplies 0 0 0 0 0 53500 Med, Dental, & Hosp Supply 0 0 0 0 0 53600 Office Supplies and Materials 0 0 0 0 0 53700 Clothing Allowance 0 0 0 0 0 53800 Educational Supplies & Mat 0 0 0 0 0 53900 Misc Supplies & Materials 0 0 0 0 0 Total Supplies & Materials 0 0 0 0 0
Current Chgs & Oblig FY13 Expenditure FY14 Expenditure FY15 Appropriation FY16 Adopted Inc/Dec 15 vs 16
54300 Workers' Comp Medical 0 0 0 0 0 54400 Legal Liabilities 0 0 0 0 0 54600 Current Charges H&I 0 0 0 0 0 54700 Indemnification 0 0 0 0 0 54900 Other Current Charges 0 0 0 0 0 Total Current Chgs & Oblig 0 0 0 0 0
Equipment FY13 Expenditure FY14 Expenditure FY15 Appropriation FY16 Adopted Inc/Dec 15 vs 16
55000 Automotive Equipment 0 0 0 0 0 55400 Lease/Purchase 0 0 0 0 0 55600 Office Furniture & Equipment 0 0 0 0 0 55900 Misc Equipment 0 0 0 0 0 Total Equipment 0 0 0 0 0
Other FY13 Expenditure FY14 Expenditure FY15 Appropriation FY16 Adopted Inc/Dec 15 vs 16
56200 Special Appropriation 0 0 0 0 0 57200 Structures & Improvements 0 0 0 0 0 58000 Land & Non-Structure 0 0 0 0 0 Total Other 0 0 0 0 0
Grand Total 0 0 0 350,000 350,000
2 5 6 S t r e e t s , T r a n s p o r t a t i o n & S a n i t a t i o n • C e n t r a l F l e e t M a n a g e m e n t
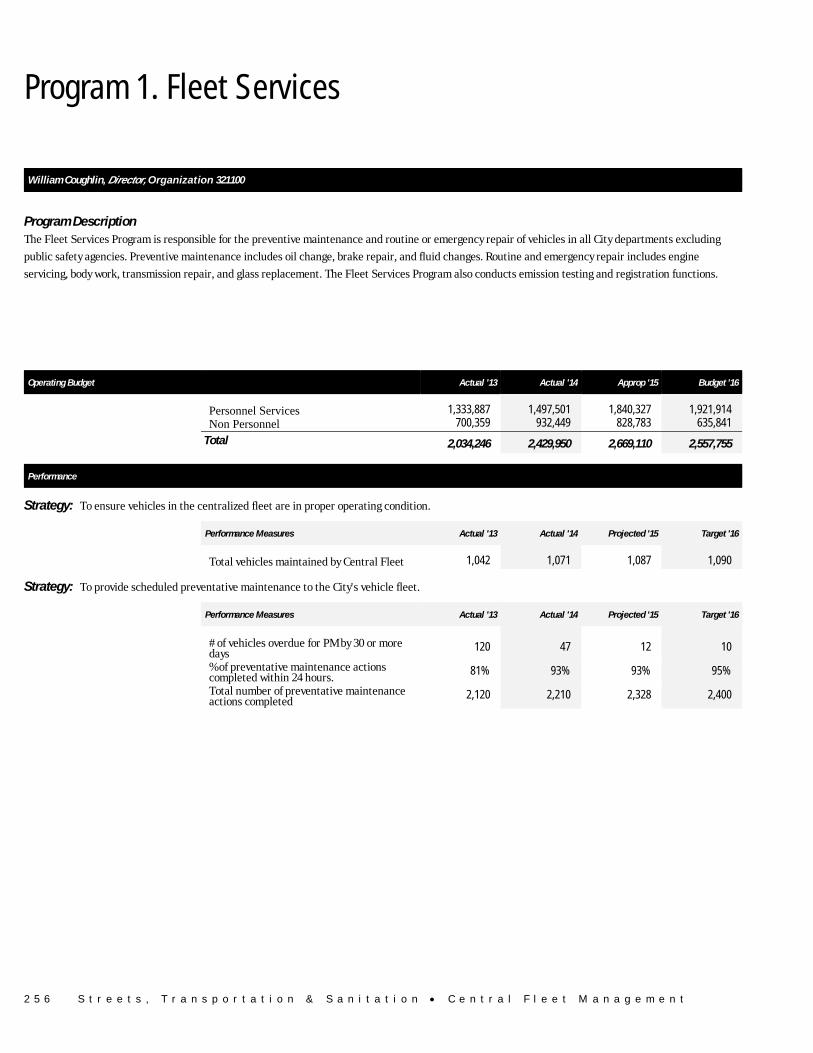
Program 1. Fleet Services
William Coughlin, Director, Organization 321100
Program Description The Fleet Services Program is responsible for the preventive maintenance and routine or emergency repair of vehicles in all City departments excluding
public safety agencies. Preventive maintenance includes oil change, brake repair, and fluid changes. Routine and emergency repair includes engine
servicing, body work, transmission repair, and glass replacement. The Fleet Services Program also conducts emission testing and registration functions.
Operating Budget Actual '13 Actual '14 Approp '15 Budget '16
Personnel Services 1,333,887 1,497,501 1,840,327 1,921,914 Non Personnel 700,359 932,449 828,783 635,841
Total 2,034,246 2,429,950 2,669,110 2,557,755
Performance
Strategy: To ensure vehicles in the centralized fleet are in proper operating condition.
Performance Measures Actual '13 Actual '14 Projected '15 Target '16
Total vehicles maintained by Central Fleet 1,042 1,071 1,087 1,090
Strategy: To provide scheduled preventative maintenance to the City's vehicle fleet.
Performance Measures Actual '13 Actual '14 Projected '15 Target '16
# of vehicles overdue for PM by 30 or more days 120 47 12 10
% of preventative maintenance actions completed within 24 hours. 81% 93% 93% 95%
Total number of preventative maintenance actions completed 2,120 2,210 2,328 2,400
S t r e e t s , T r a n s p o r t a t i o n & S a n i t a t i o n • C e n t r a l F l e e t M a n a g e m e n t 2 5 7
External Funds Projects
Alternative Fuel Vehicle Retrofits
Project Mission The Alternative Fuel Vehicle Retrofit grant is provided by the Commonwealth Massachusetts Department of Energy Resources from the Department of Energy Clean Cities Alternative Fuels and Technology grant to retrofit city vehicles to operate on alternative fuels. The award is $350,000 and will be complete in FY16.

S t r e e t s , T r a n s p o r t a t i o n & S a n i t a t i o n • O f f i c e o f S t r e e t s , T r a n s p o r t a t i o n & S a n i t a t i o n 2 5 9
Office of Streets, Transportation & Sanitation Operating Budget
Streets, Transportation & Sanitation Office of Streets, Transportation & Sanitation
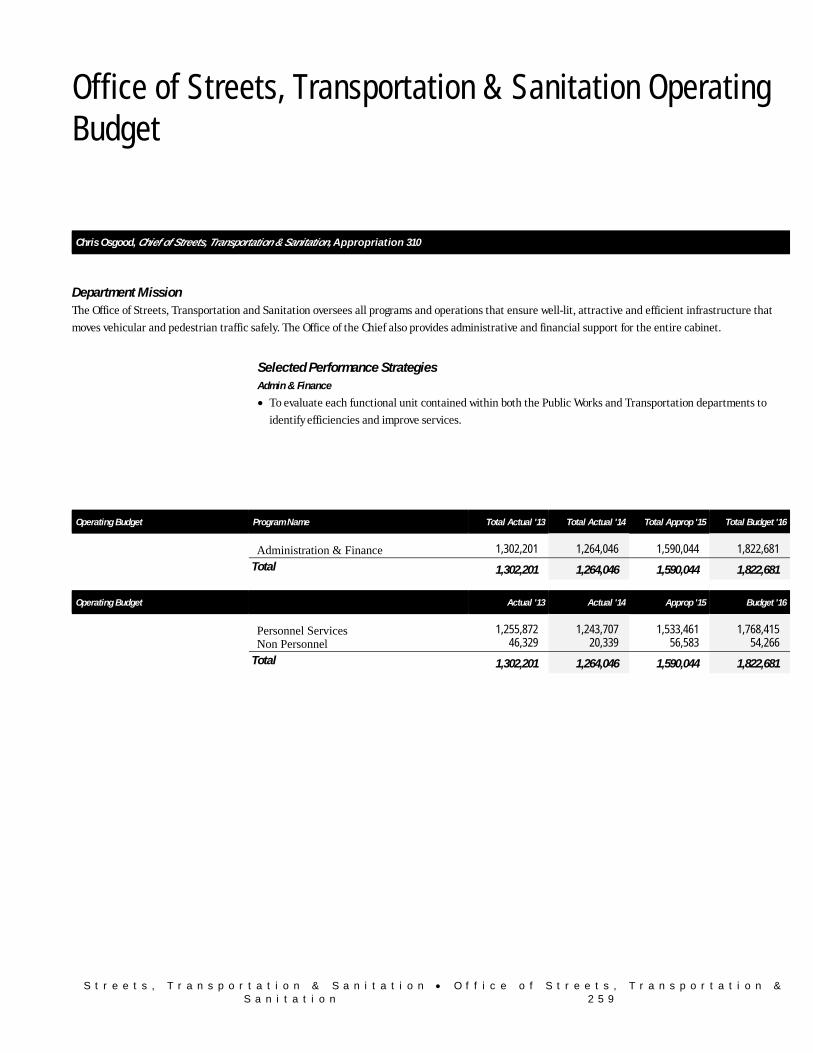
Chris Osgood, Chief of Streets, Transportation & Sanitation, Appropriation 310
Department Mission The Office of Streets, Transportation and Sanitation oversees all programs and operations that ensure well-lit, attractive and efficient infrastructure that
moves vehicular and pedestrian traffic safely. The Office of the Chief also provides administrative and financial support for the entire cabinet.
Selected Performance Strategies Admin & Finance
• To evaluate each functional unit contained within both the Public Works and Transportation departments to
identify efficiencies and improve services.
Operating Budget Program Name Total Actual '13 Total Actual '14 Total Approp '15 Total Budget '16
Administration & Finance 1,302,201 1,264,046 1,590,044 1,822,681
Total 1,302,201 1,264,046 1,590,044 1,822,681
Operating Budget Actual '13 Actual '14 Approp '15 Budget '16
Personnel Services 1,255,872 1,243,707 1,533,461 1,768,415 Non Personnel 46,329 20,339 56,583 54,266
Total 1,302,201 1,264,046 1,590,044 1,822,681
2 6 0 S t r e e t s , T r a n s p o r t a t i o n & S a n i t a t i o n • O f f i c e o f S t r e e t s , T r a n s p o r t a t i o n & S a n i t a t i o n
Office of Streets, Transportation & Sanitation Operating Budget
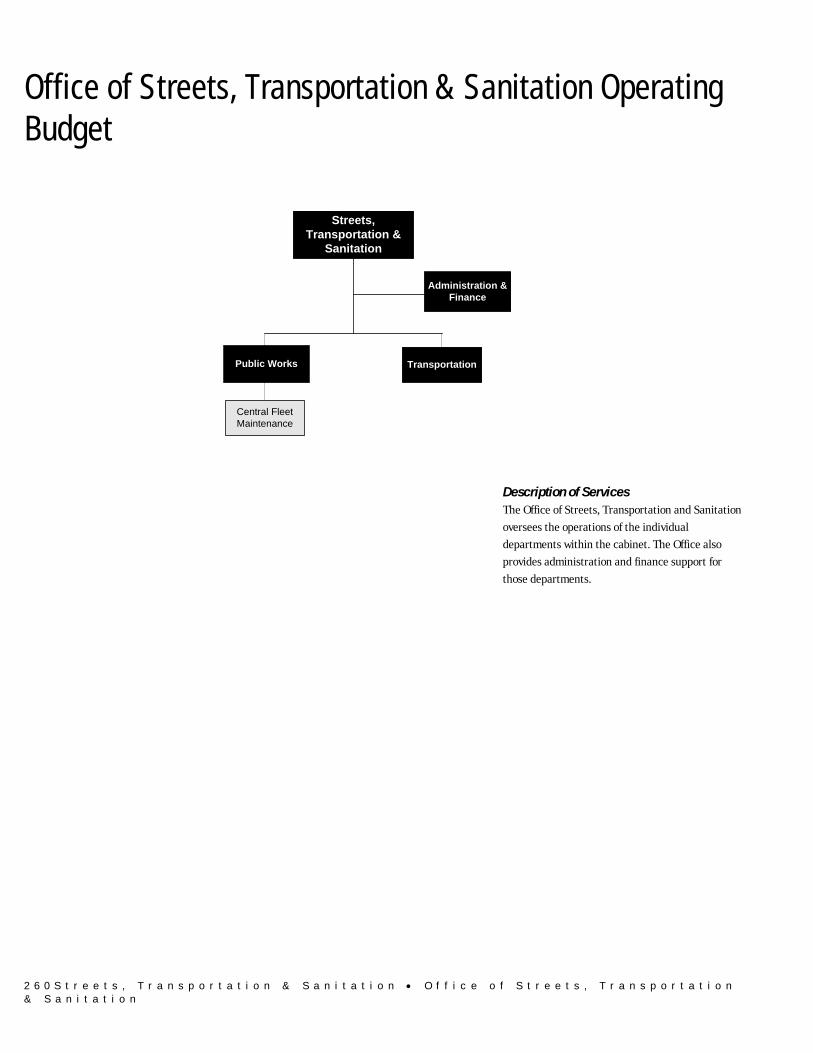
Streets, Transportation &
Sanitation
TransportationPublic Works
Administration & Finance
Central Fleet Maintenance
Description of Services The Office of Streets, Transportation and Sanitation
oversees the operations of the individual
departments within the cabinet. The Office also
provides administration and finance support for
those departments.
S t r e e t s , T r a n s p o r t a t i o n & S a n i t a t i o n • O f f i c e o f S t r e e t s , T r a n s p o r t a t i o n & S a n i t a t i o n 2 6 1
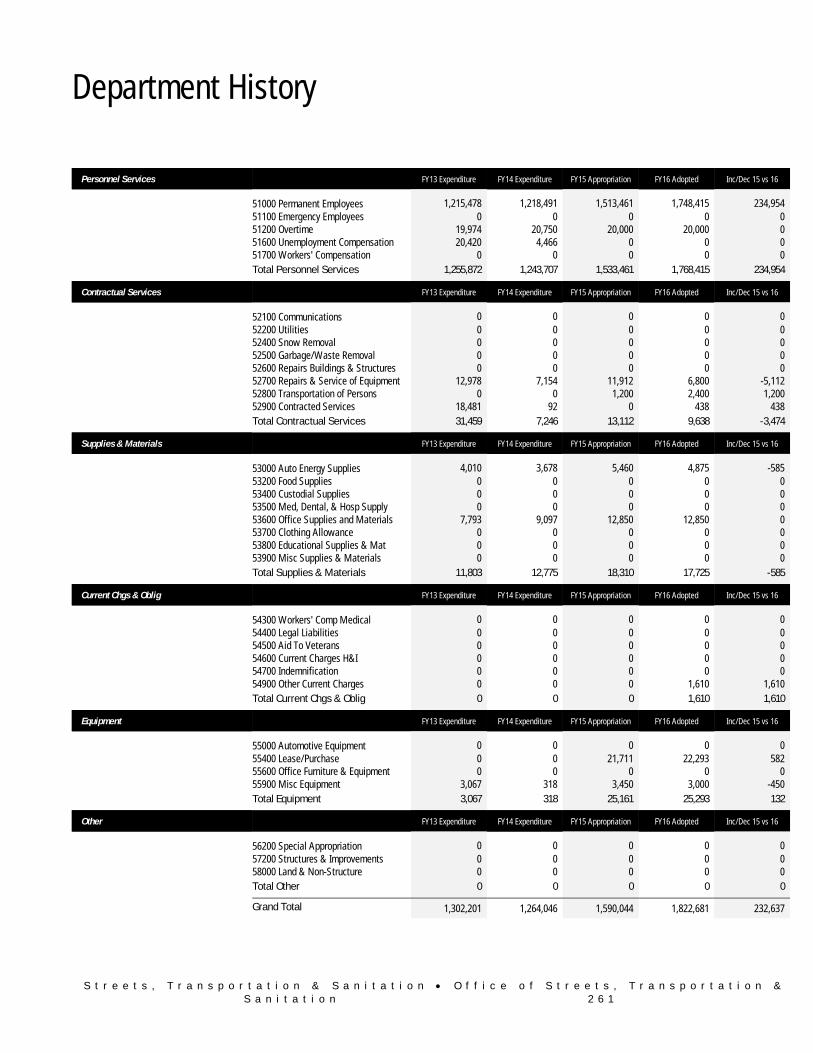
Department History
Personnel Services FY13 Expenditure FY14 Expenditure FY15 Appropriation FY16 Adopted Inc/Dec 15 vs 16
51000 Permanent Employees 1,215,478 1,218,491 1,513,461 1,748,415 234,954 51100 Emergency Employees 0 0 0 0 0 51200 Overtime 19,974 20,750 20,000 20,000 0 51600 Unemployment Compensation 20,420 4,466 0 0 0 51700 Workers' Compensation 0 0 0 0 0 Total Personnel Services 1,255,872 1,243,707 1,533,461 1,768,415 234,954
Contractual Services FY13 Expenditure FY14 Expenditure FY15 Appropriation FY16 Adopted Inc/Dec 15 vs 16
52100 Communications 0 0 0 0 0 52200 Utilities 0 0 0 0 0 52400 Snow Removal 0 0 0 0 0 52500 Garbage/Waste Removal 0 0 0 0 0 52600 Repairs Buildings & Structures 0 0 0 0 0 52700 Repairs & Service of Equipment 12,978 7,154 11,912 6,800 -5,112 52800 Transportation of Persons 0 0 1,200 2,400 1,200 52900 Contracted Services 18,481 92 0 438 438 Total Contractual Services 31,459 7,246 13,112 9,638 -3,474
Supplies & Materials FY13 Expenditure FY14 Expenditure FY15 Appropriation FY16 Adopted Inc/Dec 15 vs 16
53000 Auto Energy Supplies 4,010 3,678 5,460 4,875 -585 53200 Food Supplies 0 0 0 0 0 53400 Custodial Supplies 0 0 0 0 0 53500 Med, Dental, & Hosp Supply 0 0 0 0 0 53600 Office Supplies and Materials 7,793 9,097 12,850 12,850 0 53700 Clothing Allowance 0 0 0 0 0 53800 Educational Supplies & Mat 0 0 0 0 0 53900 Misc Supplies & Materials 0 0 0 0 0 Total Supplies & Materials 11,803 12,775 18,310 17,725 -585
Current Chgs & Oblig FY13 Expenditure FY14 Expenditure FY15 Appropriation FY16 Adopted Inc/Dec 15 vs 16
54300 Workers' Comp Medical 0 0 0 0 0 54400 Legal Liabilities 0 0 0 0 0 54500 Aid To Veterans 0 0 0 0 0 54600 Current Charges H&I 0 0 0 0 0 54700 Indemnification 0 0 0 0 0 54900 Other Current Charges 0 0 0 1,610 1,610 Total Current Chgs & Oblig 0 0 0 1,610 1,610
Equipment FY13 Expenditure FY14 Expenditure FY15 Appropriation FY16 Adopted Inc/Dec 15 vs 16
55000 Automotive Equipment 0 0 0 0 0 55400 Lease/Purchase 0 0 21,711 22,293 582 55600 Office Furniture & Equipment 0 0 0 0 0 55900 Misc Equipment 3,067 318 3,450 3,000 -450 Total Equipment 3,067 318 25,161 25,293 132
Other FY13 Expenditure FY14 Expenditure FY15 Appropriation FY16 Adopted Inc/Dec 15 vs 16
56200 Special Appropriation 0 0 0 0 0 57200 Structures & Improvements 0 0 0 0 0 58000 Land & Non-Structure 0 0 0 0 0 Total Other 0 0 0 0 0
Grand Total 1,302,201 1,264,046 1,590,044 1,822,681 232,637
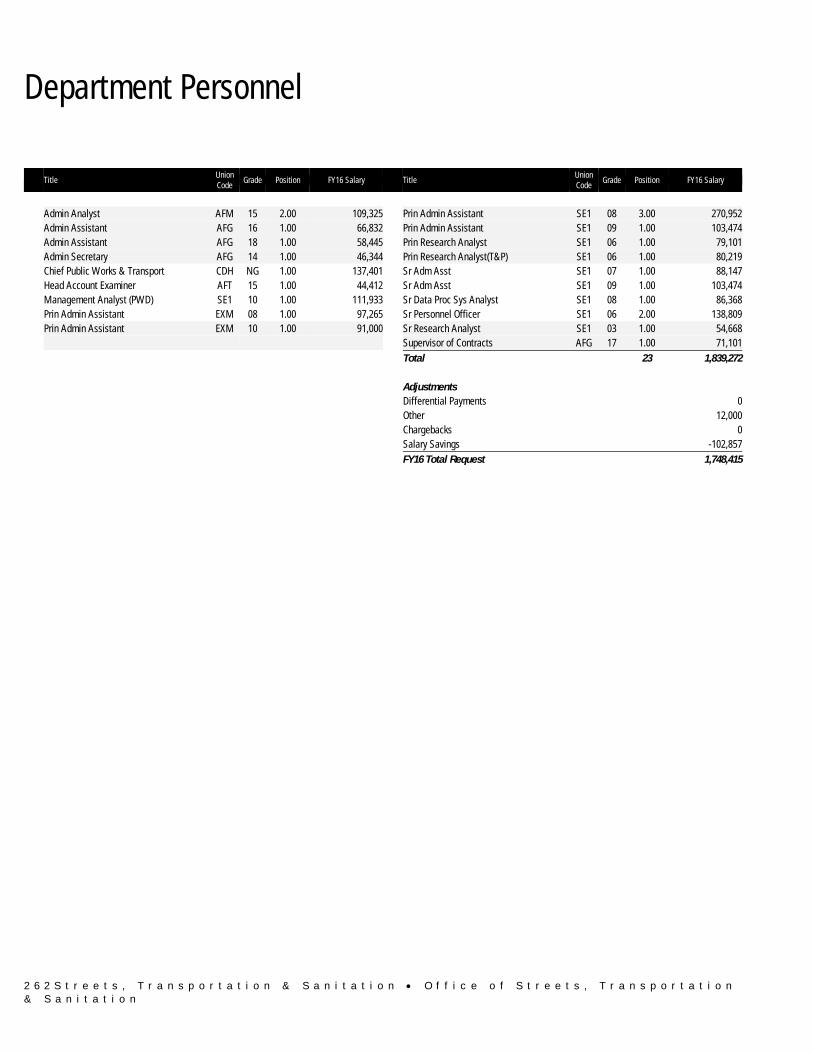
2 6 2 S t r e e t s , T r a n s p o r t a t i o n & S a n i t a t i o n • O f f i c e o f S t r e e t s , T r a n s p o r t a t i o n & S a n i t a t i o n
Department Personnel
Title Union Code
Grade Position FY16 Salary Title Union Code
Grade Position FY16 Salary
Admin Analyst AFM 15 2.00 109,325 Prin Admin Assistant SE1 08 3.00 270,952 Admin Assistant AFG 16 1.00 66,832 Prin Admin Assistant SE1 09 1.00 103,474 Admin Assistant AFG 18 1.00 58,445 Prin Research Analyst SE1 06 1.00 79,101 Admin Secretary AFG 14 1.00 46,344 Prin Research Analyst(T&P) SE1 06 1.00 80,219 Chief Public Works & Transport CDH NG 1.00 137,401 Sr Adm Asst SE1 07 1.00 88,147 Head Account Examiner AFT 15 1.00 44,412 Sr Adm Asst SE1 09 1.00 103,474 Management Analyst (PWD) SE1 10 1.00 111,933 Sr Data Proc Sys Analyst SE1 08 1.00 86,368 Prin Admin Assistant EXM 08 1.00 97,265 Sr Personnel Officer SE1 06 2.00 138,809 Prin Admin Assistant EXM 10 1.00 91,000 Sr Research Analyst SE1 03 1.00 54,668 Supervisor of Contracts AFG 17 1.00 71,101 Total 23 1,839,272 Adjustments Differential Payments 0 Other 12,000 Chargebacks 0 Salary Savings -102,857 FY16 Total Request 1,748,415
S t r e e t s , T r a n s p o r t a t i o n & S a n i t a t i o n • O f f i c e o f S t r e e t s , T r a n s p o r t a t i o n & S a n i t a t i o n 2 6 3
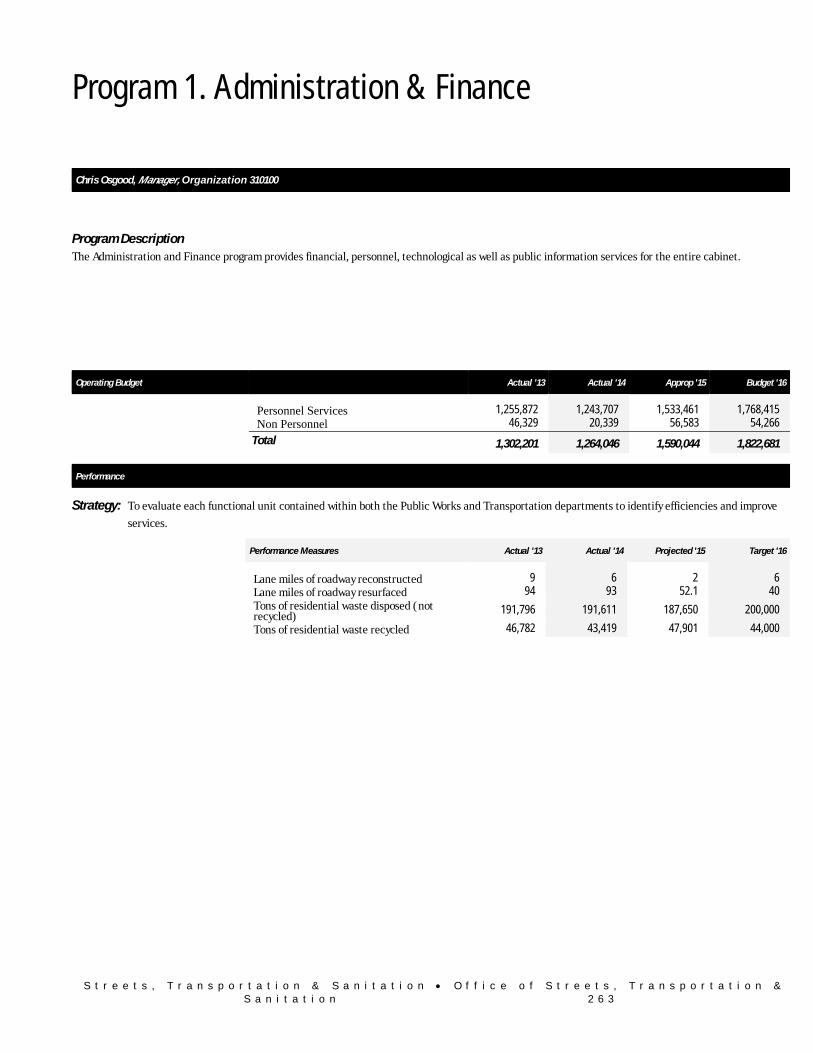
Program 1. Administration & Finance
Chris Osgood, Manager, Organization 310100
Program Description The Administration and Finance program provides financial, personnel, technological as well as public information services for the entire cabinet.
Operating Budget Actual '13 Actual '14 Approp '15 Budget '16
Personnel Services 1,255,872 1,243,707 1,533,461 1,768,415 Non Personnel 46,329 20,339 56,583 54,266
Total 1,302,201 1,264,046 1,590,044 1,822,681
Performance
Strategy: To evaluate each functional unit contained within both the Public Works and Transportation departments to identify efficiencies and improve
services.
Performance Measures Actual '13 Actual '14 Projected '15 Target '16
Lane miles of roadway reconstructed 9 6 2 6Lane miles of roadway resurfaced 94 93 52.1 40Tons of residential waste disposed (not recycled) 191,796 191,611 187,650 200,000
Tons of residential waste recycled 46,782 43,419 47,901 44,000

S t r e e t s , T r a n s p o r t a t i o n & S a n i t a t i o n • P u b l i c W o r k s D e p a r t m e n t 2 6 5
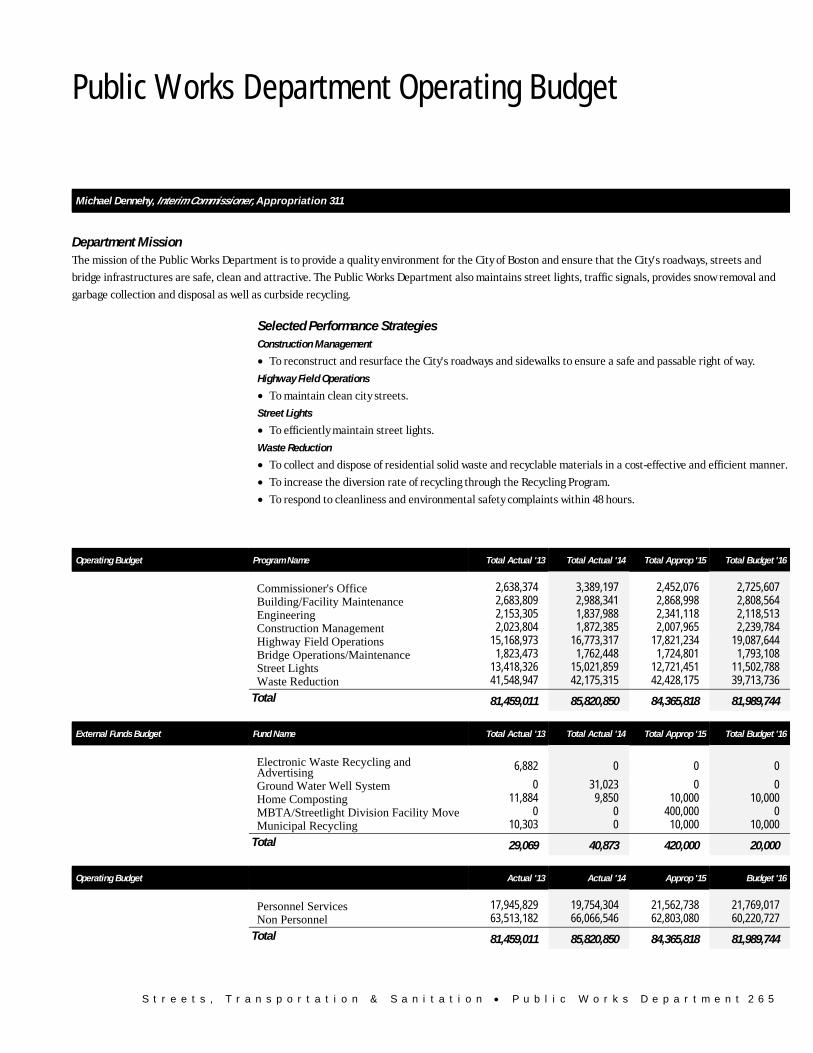
Public Works Department Operating Budget
Streets, Transportation & Sanitation Public Works Department
Michael Dennehy, Interim Commissioner, Appropriation 311
Department Mission The mission of the Public Works Department is to provide a quality environment for the City of Boston and ensure that the City's roadways, streets and
bridge infrastructures are safe, clean and attractive. The Public Works Department also maintains street lights, traffic signals, provides snow removal and
garbage collection and disposal as well as curbside recycling.
Selected Performance Strategies Construction Management
• To reconstruct and resurface the City's roadways and sidewalks to ensure a safe and passable right of way.
Highway Field Operations
• To maintain clean city streets.
Street Lights
• To efficiently maintain street lights.
Waste Reduction
• To collect and dispose of residential solid waste and recyclable materials in a cost-effective and efficient manner.
• To increase the diversion rate of recycling through the Recycling Program.
• To respond to cleanliness and environmental safety complaints within 48 hours.
Operating Budget Program Name Total Actual '13 Total Actual '14 Total Approp '15 Total Budget '16
Commissioner's Office 2,638,374 3,389,197 2,452,076 2,725,607Building/Facility Maintenance 2,683,809 2,988,341 2,868,998 2,808,564Engineering 2,153,305 1,837,988 2,341,118 2,118,513Construction Management 2,023,804 1,872,385 2,007,965 2,239,784Highway Field Operations 15,168,973 16,773,317 17,821,234 19,087,644Bridge Operations/Maintenance 1,823,473 1,762,448 1,724,801 1,793,108Street Lights 13,418,326 15,021,859 12,721,451 11,502,788Waste Reduction 41,548,947 42,175,315 42,428,175 39,713,736
Total 81,459,011 85,820,850 84,365,818 81,989,744
External Funds Budget Fund Name Total Actual '13 Total Actual '14 Total Approp '15 Total Budget '16
Electronic Waste Recycling and Advertising 6,882 0 0 0
Ground Water Well System 0 31,023 0 0Home Composting 11,884 9,850 10,000 10,000MBTA/Streetlight Division Facility Move 0 0 400,000 0Municipal Recycling 10,303 0 10,000 10,000
Total 29,069 40,873 420,000 20,000
Operating Budget Actual '13 Actual '14 Approp '15 Budget '16
Personnel Services 17,945,829 19,754,304 21,562,738 21,769,017 Non Personnel 63,513,182 66,066,546 62,803,080 60,220,727
Total 81,459,011 85,820,850 84,365,818 81,989,744
2 6 6 S t r e e t s , T r a n s p o r t a t i o n & S a n i t a t i o n • P u b l i c W o r k s D e p a r t m e n t
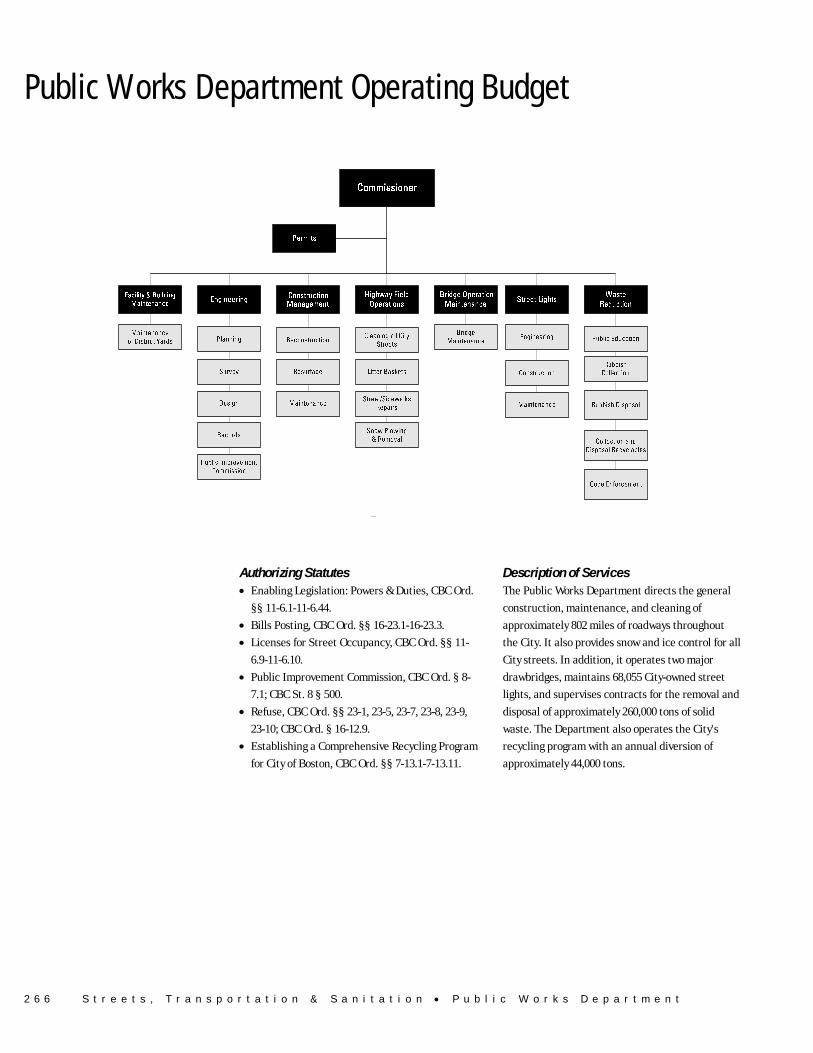
Public Works Department Operating Budget
Authorizing Statutes • Enabling Legislation: Powers & Duties, CBC Ord.
§§ 11-6.1-11-6.44.
• Bills Posting, CBC Ord. §§ 16-23.1-16-23.3.
• Licenses for Street Occupancy, CBC Ord. §§ 11-
6.9-11-6.10.
• Public Improvement Commission, CBC Ord. § 8-
7.1; CBC St. 8 § 500.
• Refuse, CBC Ord. §§ 23-1, 23-5, 23-7, 23-8, 23-9,
23-10; CBC Ord. § 16-12.9.
• Establishing a Comprehensive Recycling Program
for City of Boston, CBC Ord. §§ 7-13.1-7-13.11.
Description of Services The Public Works Department directs the general
construction, maintenance, and cleaning of
approximately 802 miles of roadways throughout
the City. It also provides snow and ice control for all
City streets. In addition, it operates two major
drawbridges, maintains 68,055 City-owned street
lights, and supervises contracts for the removal and
disposal of approximately 260,000 tons of solid
waste. The Department also operates the City's
recycling program with an annual diversion of
approximately 44,000 tons.
S t r e e t s , T r a n s p o r t a t i o n & S a n i t a t i o n • P u b l i c W o r k s D e p a r t m e n t 2 6 7
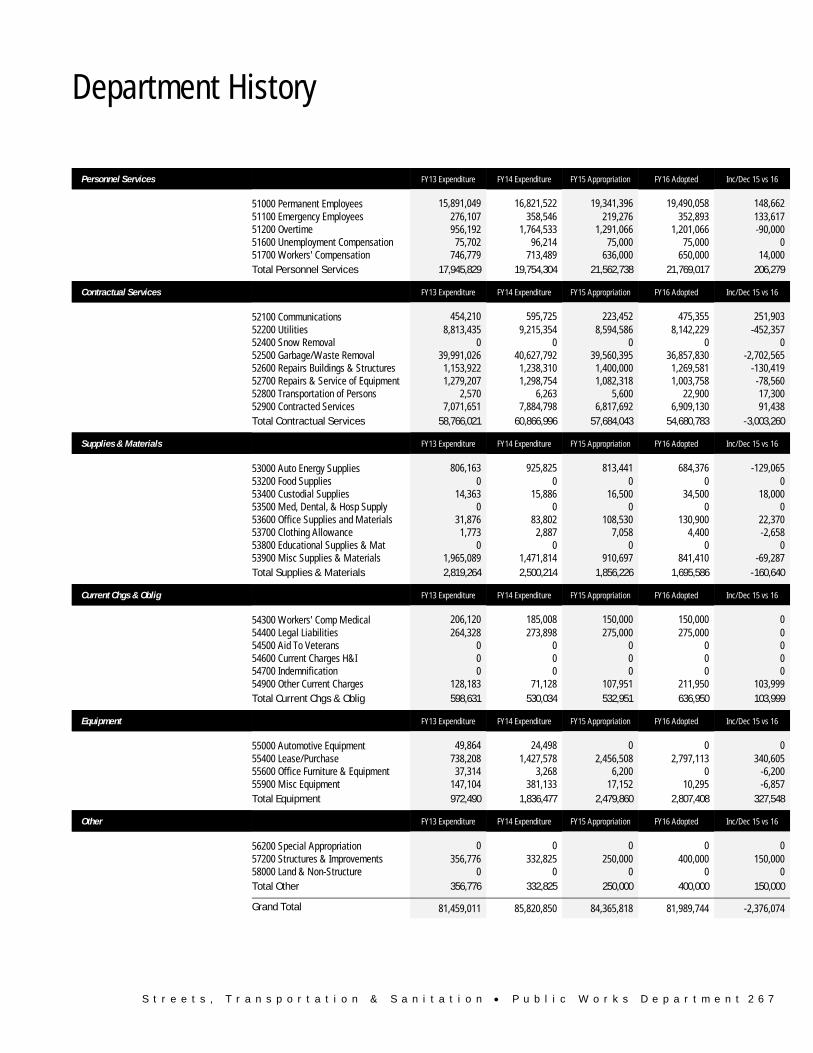
Department History
Personnel Services FY13 Expenditure FY14 Expenditure FY15 Appropriation FY16 Adopted Inc/Dec 15 vs 16
51000 Permanent Employees 15,891,049 16,821,522 19,341,396 19,490,058 148,662 51100 Emergency Employees 276,107 358,546 219,276 352,893 133,617 51200 Overtime 956,192 1,764,533 1,291,066 1,201,066 -90,000 51600 Unemployment Compensation 75,702 96,214 75,000 75,000 0 51700 Workers' Compensation 746,779 713,489 636,000 650,000 14,000 Total Personnel Services 17,945,829 19,754,304 21,562,738 21,769,017 206,279
Contractual Services FY13 Expenditure FY14 Expenditure FY15 Appropriation FY16 Adopted Inc/Dec 15 vs 16
52100 Communications 454,210 595,725 223,452 475,355 251,903 52200 Utilities 8,813,435 9,215,354 8,594,586 8,142,229 -452,357 52400 Snow Removal 0 0 0 0 0 52500 Garbage/Waste Removal 39,991,026 40,627,792 39,560,395 36,857,830 -2,702,565 52600 Repairs Buildings & Structures 1,153,922 1,238,310 1,400,000 1,269,581 -130,419 52700 Repairs & Service of Equipment 1,279,207 1,298,754 1,082,318 1,003,758 -78,560 52800 Transportation of Persons 2,570 6,263 5,600 22,900 17,300 52900 Contracted Services 7,071,651 7,884,798 6,817,692 6,909,130 91,438 Total Contractual Services 58,766,021 60,866,996 57,684,043 54,680,783 -3,003,260
Supplies & Materials FY13 Expenditure FY14 Expenditure FY15 Appropriation FY16 Adopted Inc/Dec 15 vs 16
53000 Auto Energy Supplies 806,163 925,825 813,441 684,376 -129,065 53200 Food Supplies 0 0 0 0 0 53400 Custodial Supplies 14,363 15,886 16,500 34,500 18,000 53500 Med, Dental, & Hosp Supply 0 0 0 0 0 53600 Office Supplies and Materials 31,876 83,802 108,530 130,900 22,370 53700 Clothing Allowance 1,773 2,887 7,058 4,400 -2,658 53800 Educational Supplies & Mat 0 0 0 0 0 53900 Misc Supplies & Materials 1,965,089 1,471,814 910,697 841,410 -69,287 Total Supplies & Materials 2,819,264 2,500,214 1,856,226 1,695,586 -160,640
Current Chgs & Oblig FY13 Expenditure FY14 Expenditure FY15 Appropriation FY16 Adopted Inc/Dec 15 vs 16
54300 Workers' Comp Medical 206,120 185,008 150,000 150,000 0 54400 Legal Liabilities 264,328 273,898 275,000 275,000 0 54500 Aid To Veterans 0 0 0 0 0 54600 Current Charges H&I 0 0 0 0 0 54700 Indemnification 0 0 0 0 0 54900 Other Current Charges 128,183 71,128 107,951 211,950 103,999 Total Current Chgs & Oblig 598,631 530,034 532,951 636,950 103,999
Equipment FY13 Expenditure FY14 Expenditure FY15 Appropriation FY16 Adopted Inc/Dec 15 vs 16
55000 Automotive Equipment 49,864 24,498 0 0 0 55400 Lease/Purchase 738,208 1,427,578 2,456,508 2,797,113 340,605 55600 Office Furniture & Equipment 37,314 3,268 6,200 0 -6,200 55900 Misc Equipment 147,104 381,133 17,152 10,295 -6,857 Total Equipment 972,490 1,836,477 2,479,860 2,807,408 327,548
Other FY13 Expenditure FY14 Expenditure FY15 Appropriation FY16 Adopted Inc/Dec 15 vs 16
56200 Special Appropriation 0 0 0 0 0 57200 Structures & Improvements 356,776 332,825 250,000 400,000 150,000 58000 Land & Non-Structure 0 0 0 0 0 Total Other 356,776 332,825 250,000 400,000 150,000
Grand Total 81,459,011 85,820,850 84,365,818 81,989,744 -2,376,074
2 6 8 S t r e e t s , T r a n s p o r t a t i o n & S a n i t a t i o n • P u b l i c W o r k s D e p a r t m e n t
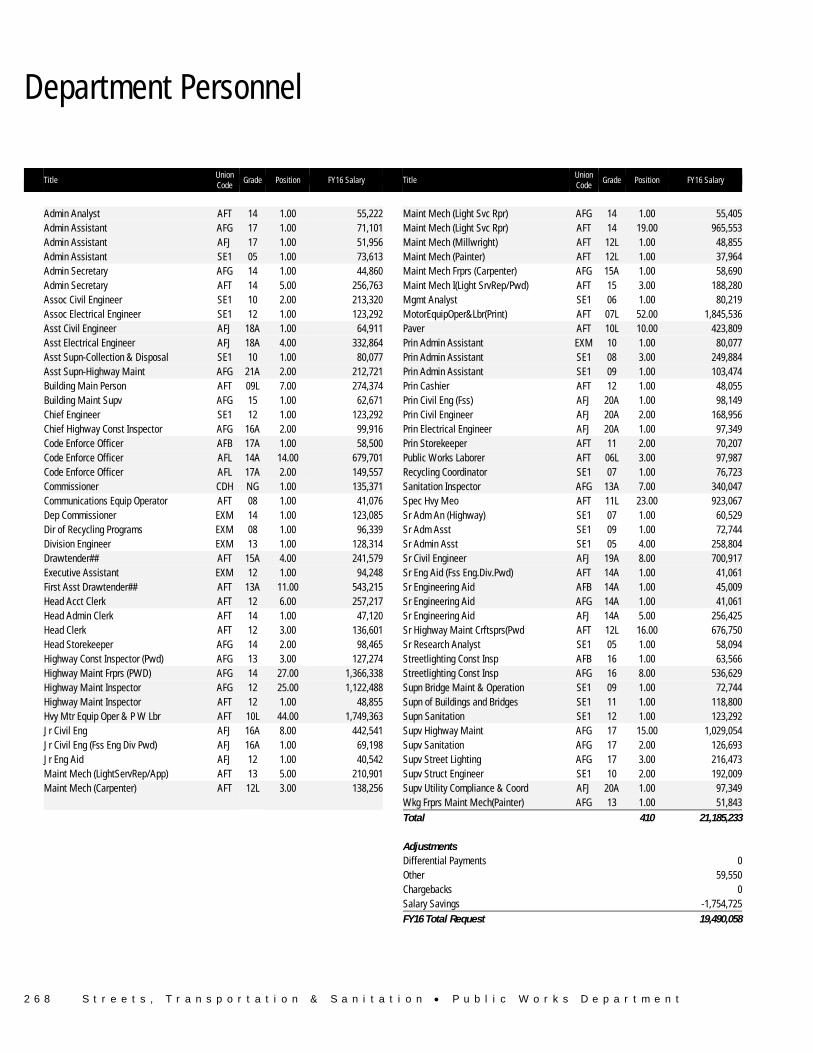
Department Personnel
Title Union Code
Grade Position FY16 Salary Title Union Code
Grade Position FY16 Salary
Admin Analyst AFT 14 1.00 55,222 Maint Mech (Light Svc Rpr) AFG 14 1.00 55,405 Admin Assistant AFG 17 1.00 71,101 Maint Mech (Light Svc Rpr) AFT 14 19.00 965,553 Admin Assistant AFJ 17 1.00 51,956 Maint Mech (Millwright) AFT 12L 1.00 48,855 Admin Assistant SE1 05 1.00 73,613 Maint Mech (Painter) AFT 12L 1.00 37,964 Admin Secretary AFG 14 1.00 44,860 Maint Mech Frprs (Carpenter) AFG 15A 1.00 58,690 Admin Secretary AFT 14 5.00 256,763 Maint Mech I(Light SrvRep/Pwd) AFT 15 3.00 188,280 Assoc Civil Engineer SE1 10 2.00 213,320 Mgmt Analyst SE1 06 1.00 80,219 Assoc Electrical Engineer SE1 12 1.00 123,292 MotorEquipOper&Lbr(Print) AFT 07L 52.00 1,845,536 Asst Civil Engineer AFJ 18A 1.00 64,911 Paver AFT 10L 10.00 423,809 Asst Electrical Engineer AFJ 18A 4.00 332,864 Prin Admin Assistant EXM 10 1.00 80,077 Asst Supn-Collection & Disposal SE1 10 1.00 80,077 Prin Admin Assistant SE1 08 3.00 249,884 Asst Supn-Highway Maint AFG 21A 2.00 212,721 Prin Admin Assistant SE1 09 1.00 103,474 Building Main Person AFT 09L 7.00 274,374 Prin Cashier AFT 12 1.00 48,055 Building Maint Supv AFG 15 1.00 62,671 Prin Civil Eng (Fss) AFJ 20A 1.00 98,149 Chief Engineer SE1 12 1.00 123,292 Prin Civil Engineer AFJ 20A 2.00 168,956 Chief Highway Const Inspector AFG 16A 2.00 99,916 Prin Electrical Engineer AFJ 20A 1.00 97,349 Code Enforce Officer AFB 17A 1.00 58,500 Prin Storekeeper AFT 11 2.00 70,207 Code Enforce Officer AFL 14A 14.00 679,701 Public Works Laborer AFT 06L 3.00 97,987 Code Enforce Officer AFL 17A 2.00 149,557 Recycling Coordinator SE1 07 1.00 76,723 Commissioner CDH NG 1.00 135,371 Sanitation Inspector AFG 13A 7.00 340,047 Communications Equip Operator AFT 08 1.00 41,076 Spec Hvy Meo AFT 11L 23.00 923,067 Dep Commissioner EXM 14 1.00 123,085 Sr Adm An (Highway) SE1 07 1.00 60,529 Dir of Recycling Programs EXM 08 1.00 96,339 Sr Adm Asst SE1 09 1.00 72,744 Division Engineer EXM 13 1.00 128,314 Sr Admin Asst SE1 05 4.00 258,804 Drawtender## AFT 15A 4.00 241,579 Sr Civil Engineer AFJ 19A 8.00 700,917 Executive Assistant EXM 12 1.00 94,248 Sr Eng Aid (Fss Eng.Div.Pwd) AFT 14A 1.00 41,061 First Asst Drawtender## AFT 13A 11.00 543,215 Sr Engineering Aid AFB 14A 1.00 45,009 Head Acct Clerk AFT 12 6.00 257,217 Sr Engineering Aid AFG 14A 1.00 41,061 Head Admin Clerk AFT 14 1.00 47,120 Sr Engineering Aid AFJ 14A 5.00 256,425 Head Clerk AFT 12 3.00 136,601 Sr Highway Maint Crftsprs(Pwd AFT 12L 16.00 676,750 Head Storekeeper AFG 14 2.00 98,465 Sr Research Analyst SE1 05 1.00 58,094 Highway Const Inspector (Pwd) AFG 13 3.00 127,274 Streetlighting Const Insp AFB 16 1.00 63,566 Highway Maint Frprs (PWD) AFG 14 27.00 1,366,338 Streetlighting Const Insp AFG 16 8.00 536,629 Highway Maint Inspector AFG 12 25.00 1,122,488 Supn Bridge Maint & Operation SE1 09 1.00 72,744 Highway Maint Inspector AFT 12 1.00 48,855 Supn of Buildings and Bridges SE1 11 1.00 118,800 Hvy Mtr Equip Oper & P W Lbr AFT 10L 44.00 1,749,363 Supn Sanitation SE1 12 1.00 123,292 Jr Civil Eng AFJ 16A 8.00 442,541 Supv Highway Maint AFG 17 15.00 1,029,054 Jr Civil Eng (Fss Eng Div Pwd) AFJ 16A 1.00 69,198 Supv Sanitation AFG 17 2.00 126,693 Jr Eng Aid AFJ 12 1.00 40,542 Supv Street Lighting AFG 17 3.00 216,473 Maint Mech (LightServRep/App) AFT 13 5.00 210,901 Supv Struct Engineer SE1 10 2.00 192,009 Maint Mech (Carpenter) AFT 12L 3.00 138,256 Supv Utility Compliance & Coord AFJ 20A 1.00 97,349 Wkg Frprs Maint Mech(Painter) AFG 13 1.00 51,843 Total 410 21,185,233 Adjustments Differential Payments 0 Other 59,550 Chargebacks 0 Salary Savings -1,754,725 FY16 Total Request 19,490,058
S t r e e t s , T r a n s p o r t a t i o n & S a n i t a t i o n • P u b l i c W o r k s D e p a r t m e n t 2 6 9
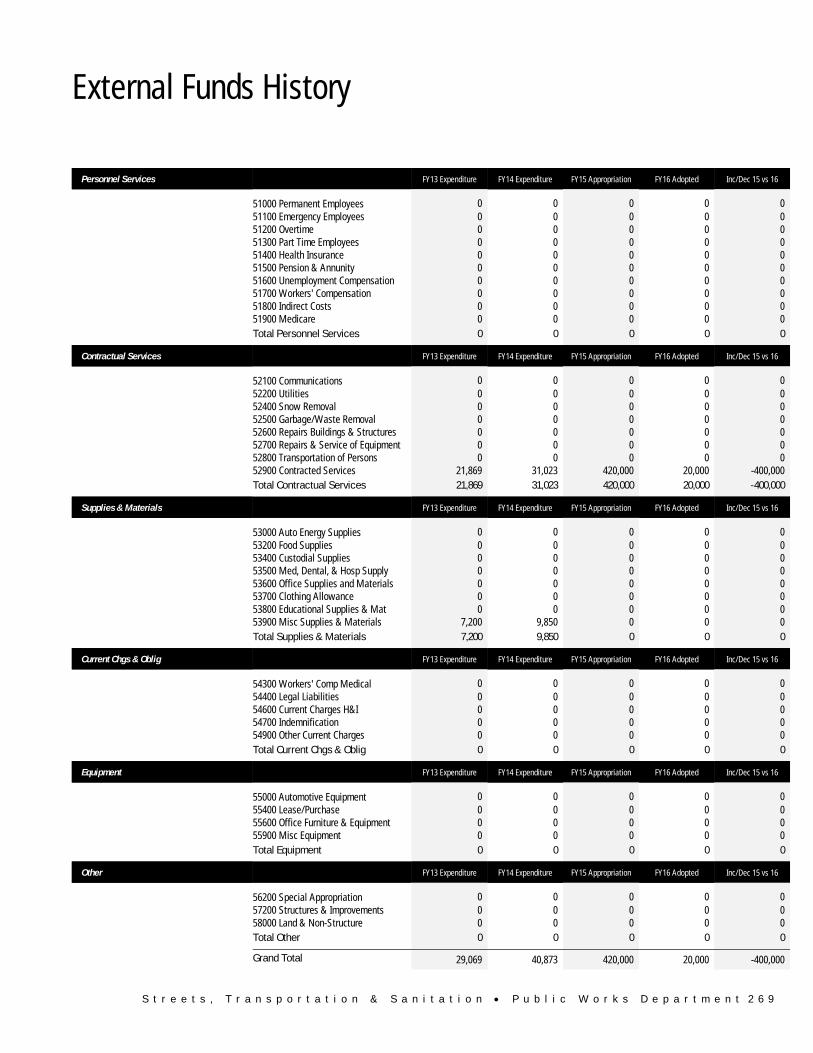
External Funds History
Personnel Services FY13 Expenditure FY14 Expenditure FY15 Appropriation FY16 Adopted Inc/Dec 15 vs 16
51000 Permanent Employees 0 0 0 0 0 51100 Emergency Employees 0 0 0 0 0 51200 Overtime 0 0 0 0 0 51300 Part Time Employees 0 0 0 0 0 51400 Health Insurance 0 0 0 0 0 51500 Pension & Annunity 0 0 0 0 0 51600 Unemployment Compensation 0 0 0 0 0 51700 Workers' Compensation 0 0 0 0 0 51800 Indirect Costs 0 0 0 0 0 51900 Medicare 0 0 0 0 0 Total Personnel Services 0 0 0 0 0
Contractual Services FY13 Expenditure FY14 Expenditure FY15 Appropriation FY16 Adopted Inc/Dec 15 vs 16
52100 Communications 0 0 0 0 0 52200 Utilities 0 0 0 0 0 52400 Snow Removal 0 0 0 0 0 52500 Garbage/Waste Removal 0 0 0 0 0 52600 Repairs Buildings & Structures 0 0 0 0 0 52700 Repairs & Service of Equipment 0 0 0 0 0 52800 Transportation of Persons 0 0 0 0 0 52900 Contracted Services 21,869 31,023 420,000 20,000 -400,000 Total Contractual Services 21,869 31,023 420,000 20,000 -400,000
Supplies & Materials FY13 Expenditure FY14 Expenditure FY15 Appropriation FY16 Adopted Inc/Dec 15 vs 16
53000 Auto Energy Supplies 0 0 0 0 0 53200 Food Supplies 0 0 0 0 0 53400 Custodial Supplies 0 0 0 0 0 53500 Med, Dental, & Hosp Supply 0 0 0 0 0 53600 Office Supplies and Materials 0 0 0 0 0 53700 Clothing Allowance 0 0 0 0 0 53800 Educational Supplies & Mat 0 0 0 0 0 53900 Misc Supplies & Materials 7,200 9,850 0 0 0 Total Supplies & Materials 7,200 9,850 0 0 0
Current Chgs & Oblig FY13 Expenditure FY14 Expenditure FY15 Appropriation FY16 Adopted Inc/Dec 15 vs 16
54300 Workers' Comp Medical 0 0 0 0 0 54400 Legal Liabilities 0 0 0 0 0 54600 Current Charges H&I 0 0 0 0 0 54700 Indemnification 0 0 0 0 0 54900 Other Current Charges 0 0 0 0 0 Total Current Chgs & Oblig 0 0 0 0 0
Equipment FY13 Expenditure FY14 Expenditure FY15 Appropriation FY16 Adopted Inc/Dec 15 vs 16
55000 Automotive Equipment 0 0 0 0 0 55400 Lease/Purchase 0 0 0 0 0 55600 Office Furniture & Equipment 0 0 0 0 0 55900 Misc Equipment 0 0 0 0 0 Total Equipment 0 0 0 0 0
Other FY13 Expenditure FY14 Expenditure FY15 Appropriation FY16 Adopted Inc/Dec 15 vs 16
56200 Special Appropriation 0 0 0 0 0 57200 Structures & Improvements 0 0 0 0 0 58000 Land & Non-Structure 0 0 0 0 0 Total Other 0 0 0 0 0
Grand Total 29,069 40,873 420,000 20,000 -400,000
2 7 0 S t r e e t s , T r a n s p o r t a t i o n & S a n i t a t i o n • P u b l i c W o r k s D e p a r t m e n t
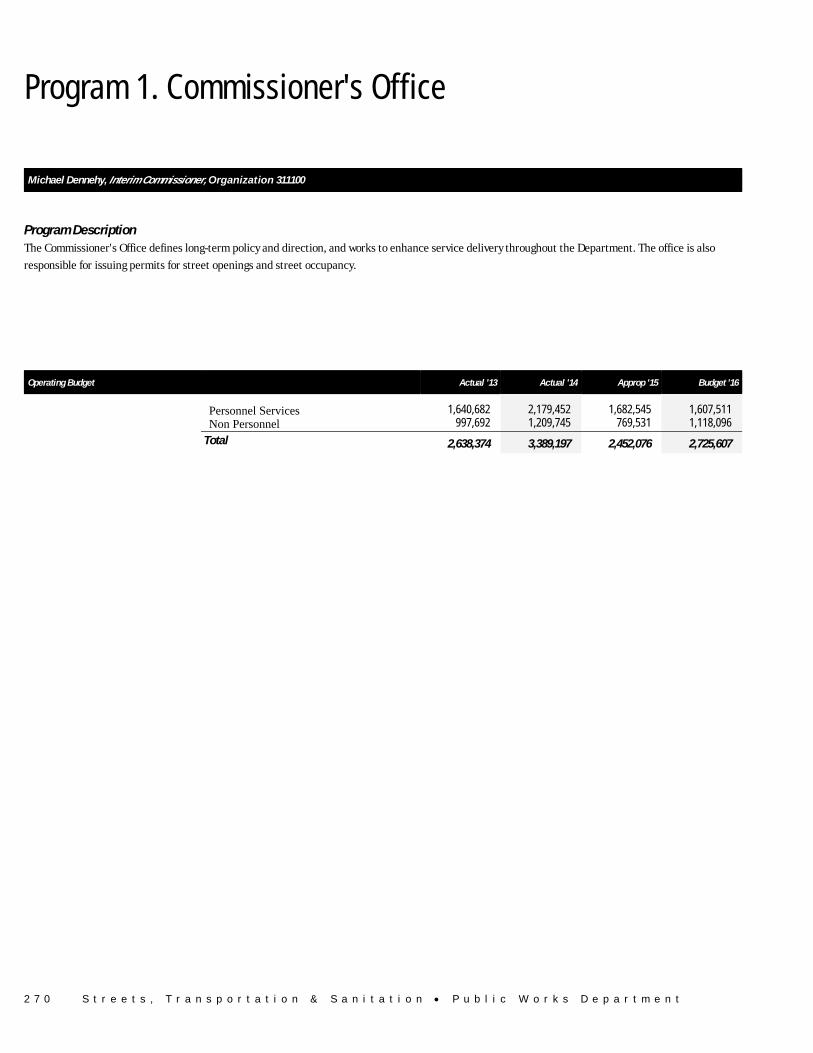
Program 1. Commissioner's Office
Michael Dennehy, Interim Commissioner, Organization 311100
Program Description The Commissioner's Office defines long-term policy and direction, and works to enhance service delivery throughout the Department. The office is also
responsible for issuing permits for street openings and street occupancy.
Operating Budget Actual '13 Actual '14 Approp '15 Budget '16
Personnel Services 1,640,682 2,179,452 1,682,545 1,607,511 Non Personnel 997,692 1,209,745 769,531 1,118,096
Total 2,638,374 3,389,197 2,452,076 2,725,607
S t r e e t s , T r a n s p o r t a t i o n & S a n i t a t i o n • P u b l i c W o r k s D e p a r t m e n t 2 7 1
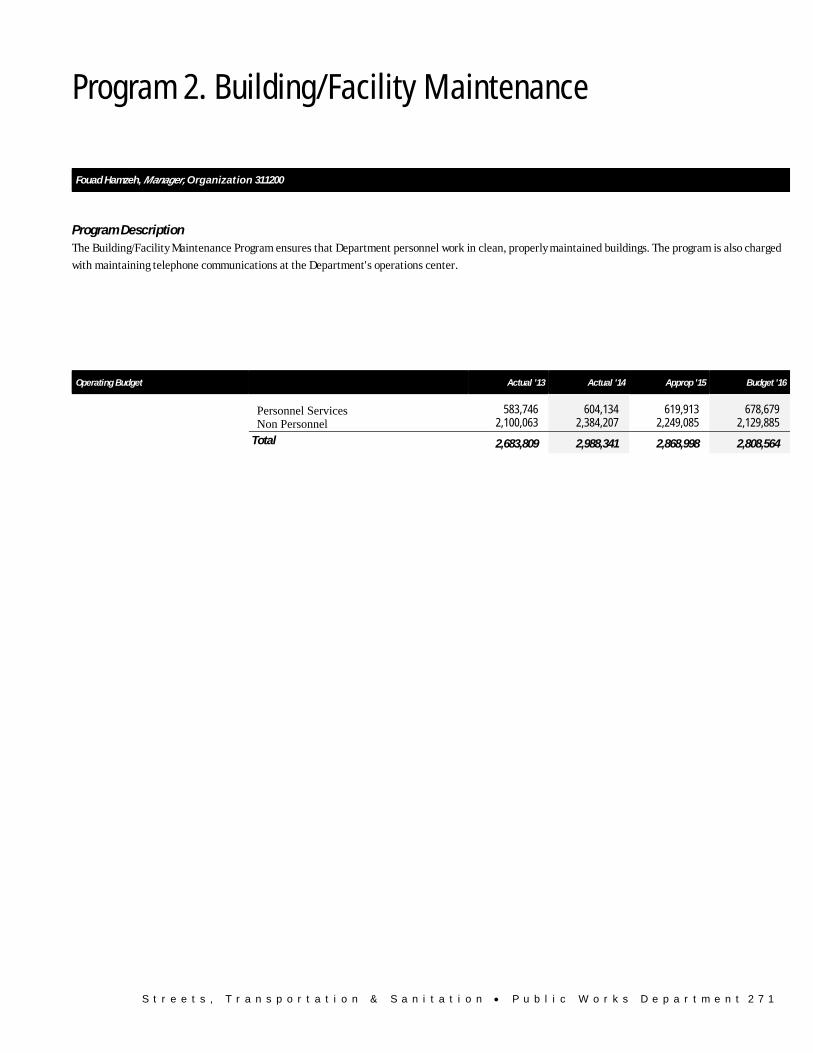
Program 2. Building/Facility Maintenance
Fouad Hamzeh, Manager, Organization 311200
Program Description The Building/Facility Maintenance Program ensures that Department personnel work in clean, properly maintained buildings. The program is also charged
with maintaining telephone communications at the Department's operations center.
Operating Budget Actual '13 Actual '14 Approp '15 Budget '16
Personnel Services 583,746 604,134 619,913 678,679 Non Personnel 2,100,063 2,384,207 2,249,085 2,129,885
Total 2,683,809 2,988,341 2,868,998 2,808,564
2 7 2 S t r e e t s , T r a n s p o r t a t i o n & S a n i t a t i o n • P u b l i c W o r k s D e p a r t m e n t
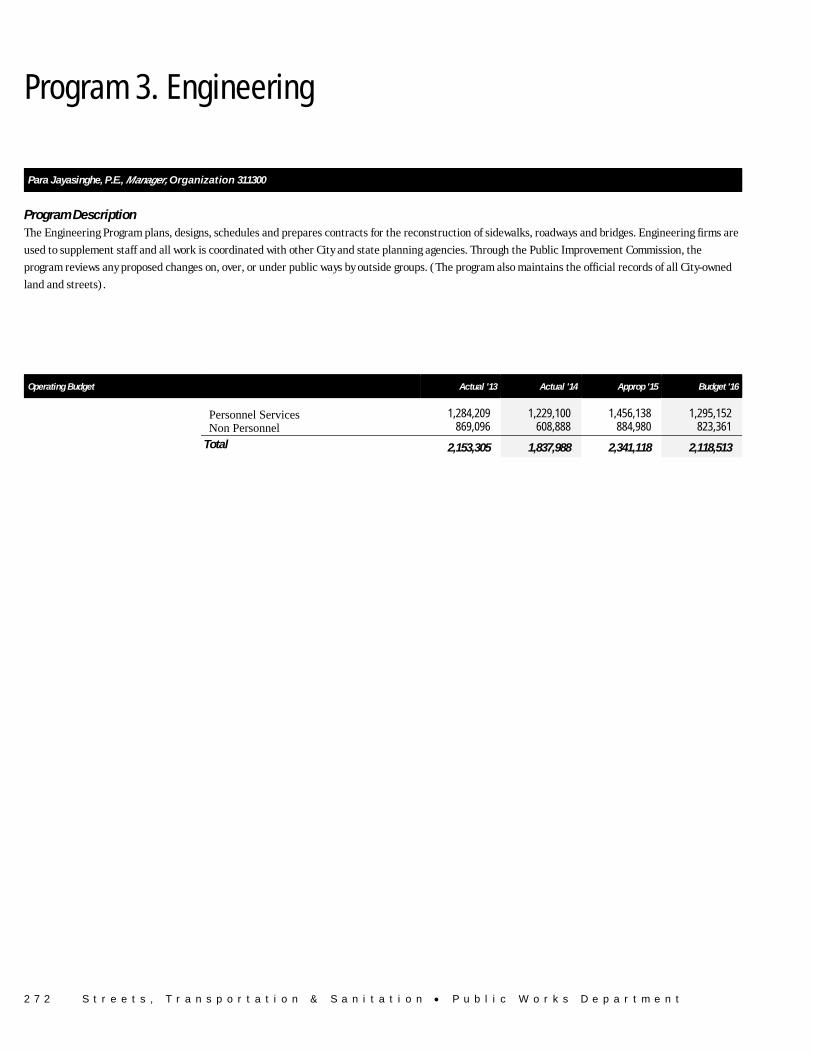
Program 3. Engineering
Para Jayasinghe, P.E., Manager, Organization 311300
Program Description The Engineering Program plans, designs, schedules and prepares contracts for the reconstruction of sidewalks, roadways and bridges. Engineering firms are
used to supplement staff and all work is coordinated with other City and state planning agencies. Through the Public Improvement Commission, the
program reviews any proposed changes on, over, or under public ways by outside groups. (The program also maintains the official records of all City-owned
land and streets).
Operating Budget Actual '13 Actual '14 Approp '15 Budget '16
Personnel Services 1,284,209 1,229,100 1,456,138 1,295,152 Non Personnel 869,096 608,888 884,980 823,361
Total 2,153,305 1,837,988 2,341,118 2,118,513
S t r e e t s , T r a n s p o r t a t i o n & S a n i t a t i o n • P u b l i c W o r k s D e p a r t m e n t 2 7 3
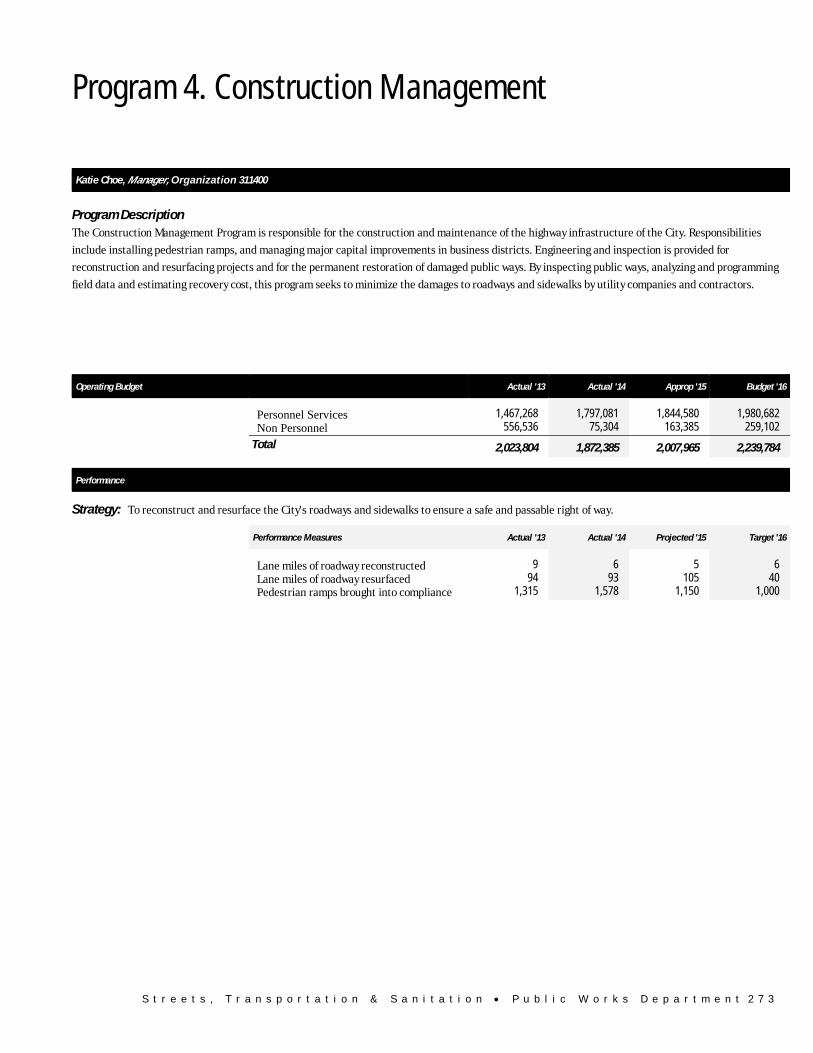
Program 4. Construction Management
Katie Choe, Manager, Organization 311400
Program Description The Construction Management Program is responsible for the construction and maintenance of the highway infrastructure of the City. Responsibilities
include installing pedestrian ramps, and managing major capital improvements in business districts. Engineering and inspection is provided for
reconstruction and resurfacing projects and for the permanent restoration of damaged public ways. By inspecting public ways, analyzing and programming
field data and estimating recovery cost, this program seeks to minimize the damages to roadways and sidewalks by utility companies and contractors.
Operating Budget Actual '13 Actual '14 Approp '15 Budget '16
Personnel Services 1,467,268 1,797,081 1,844,580 1,980,682 Non Personnel 556,536 75,304 163,385 259,102
Total 2,023,804 1,872,385 2,007,965 2,239,784
Performance
Strategy: To reconstruct and resurface the City's roadways and sidewalks to ensure a safe and passable right of way.
Performance Measures Actual '13 Actual '14 Projected '15 Target '16
Lane miles of roadway reconstructed 9 6 5 6Lane miles of roadway resurfaced 94 93 105 40Pedestrian ramps brought into compliance 1,315 1,578 1,150 1,000
2 7 4 S t r e e t s , T r a n s p o r t a t i o n & S a n i t a t i o n • P u b l i c W o r k s D e p a r t m e n t
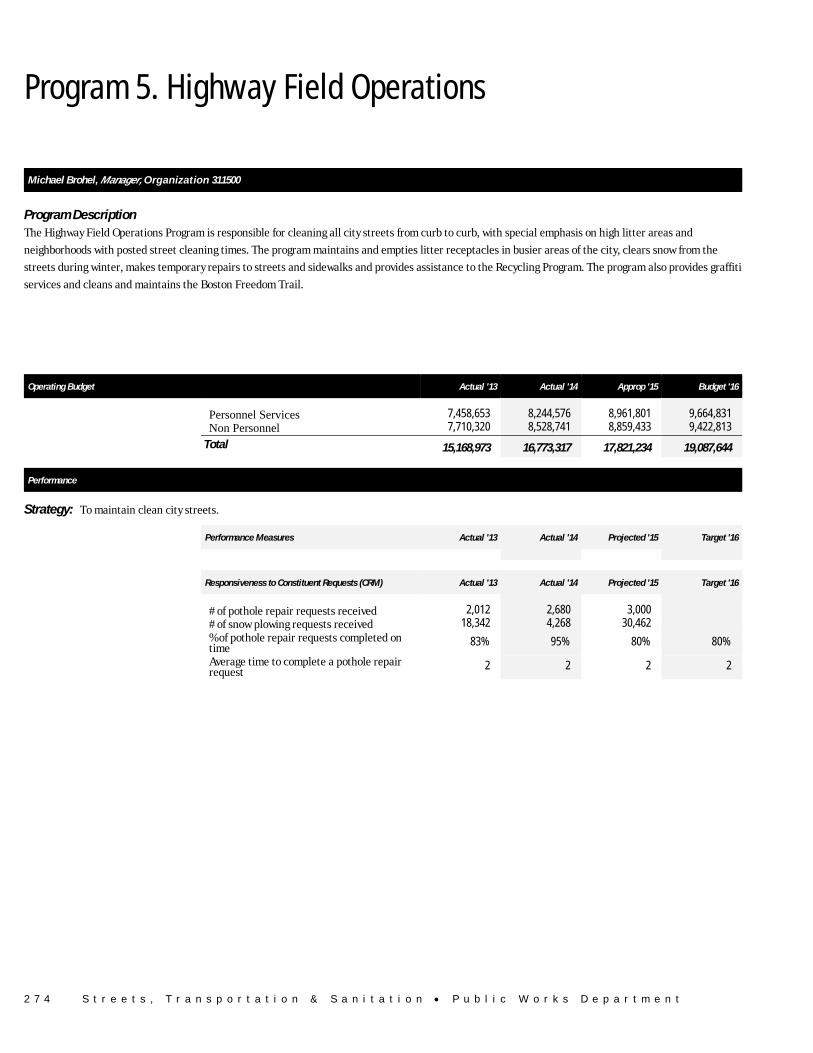
Program 5. Highway Field Operations
Michael Brohel, Manager, Organization 311500
Program Description The Highway Field Operations Program is responsible for cleaning all city streets from curb to curb, with special emphasis on high litter areas and
neighborhoods with posted street cleaning times. The program maintains and empties litter receptacles in busier areas of the city, clears snow from the
streets during winter, makes temporary repairs to streets and sidewalks and provides assistance to the Recycling Program. The program also provides graffiti
services and cleans and maintains the Boston Freedom Trail.
Operating Budget Actual '13 Actual '14 Approp '15 Budget '16
Personnel Services 7,458,653 8,244,576 8,961,801 9,664,831 Non Personnel 7,710,320 8,528,741 8,859,433 9,422,813
Total 15,168,973 16,773,317 17,821,234 19,087,644
Performance
Strategy: To maintain clean city streets.
Performance Measures Actual '13 Actual '14 Projected '15 Target '16
Responsiveness to Constituent Requests (CRM) Actual '13 Actual '14 Projected '15 Target '16
# of pothole repair requests received 2,012 2,680 3,000 # of snow plowing requests received 18,342 4,268 30,462 % of pothole repair requests completed on time 83% 95% 80% 80%
Average time to complete a pothole repair request 2 2 2 2
S t r e e t s , T r a n s p o r t a t i o n & S a n i t a t i o n • P u b l i c W o r k s D e p a r t m e n t 2 7 5
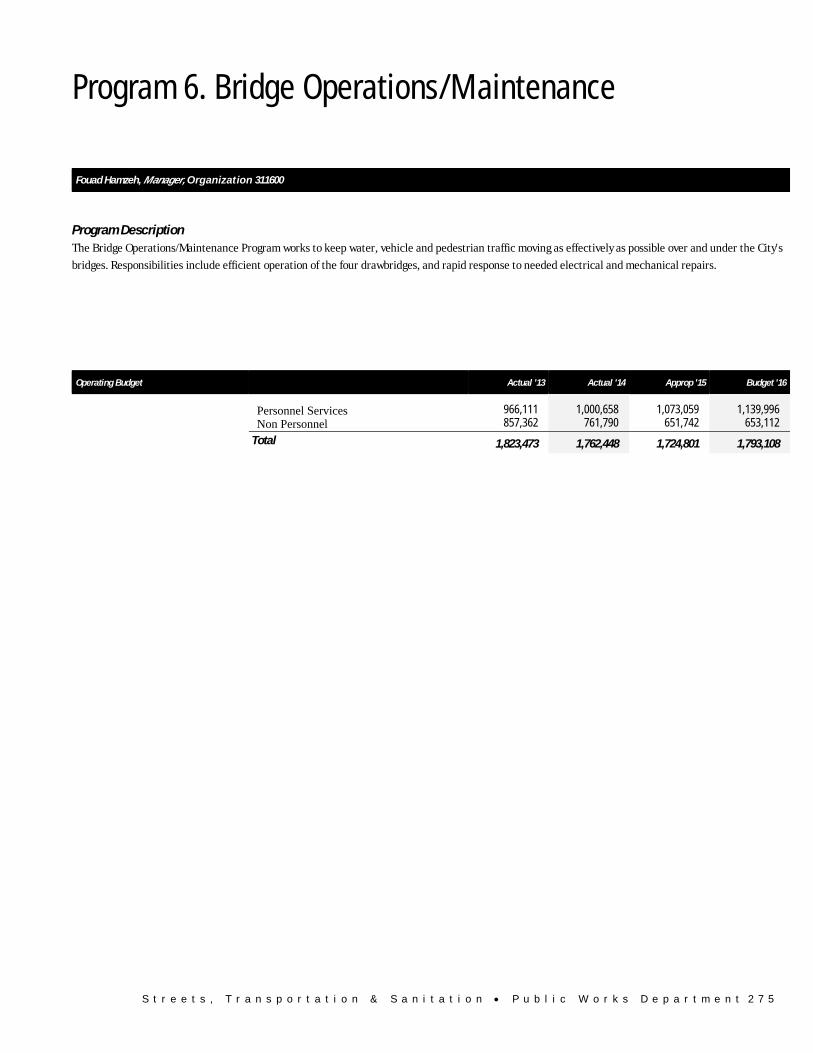
Program 6. Bridge Operations/Maintenance
Fouad Hamzeh, Manager, Organization 311600
Program Description The Bridge Operations/Maintenance Program works to keep water, vehicle and pedestrian traffic moving as effectively as possible over and under the City's
bridges. Responsibilities include efficient operation of the four drawbridges, and rapid response to needed electrical and mechanical repairs.
Operating Budget Actual '13 Actual '14 Approp '15 Budget '16
Personnel Services 966,111 1,000,658 1,073,059 1,139,996 Non Personnel 857,362 761,790 651,742 653,112
Total 1,823,473 1,762,448 1,724,801 1,793,108
2 7 6 S t r e e t s , T r a n s p o r t a t i o n & S a n i t a t i o n • P u b l i c W o r k s D e p a r t m e n t
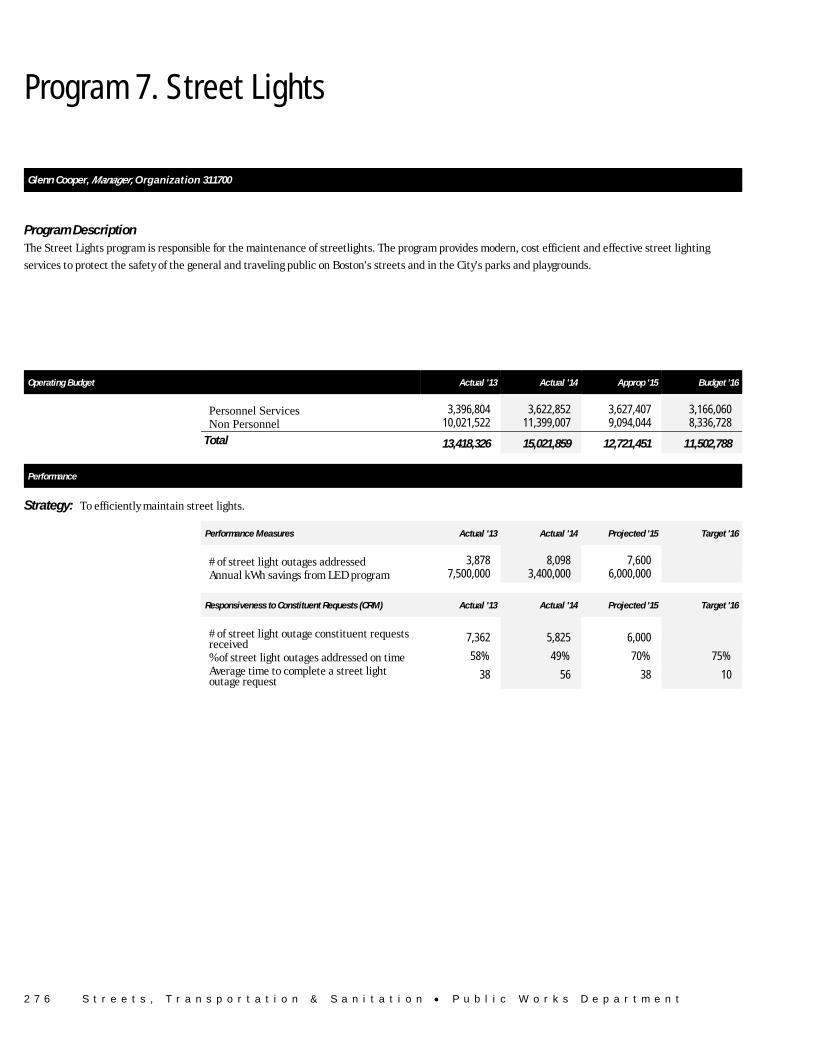
Program 7. Street Lights
Glenn Cooper, Manager, Organization 311700
Program Description The Street Lights program is responsible for the maintenance of streetlights. The program provides modern, cost efficient and effective street lighting
services to protect the safety of the general and traveling public on Boston's streets and in the City's parks and playgrounds.
Operating Budget Actual '13 Actual '14 Approp '15 Budget '16
Personnel Services 3,396,804 3,622,852 3,627,407 3,166,060 Non Personnel 10,021,522 11,399,007 9,094,044 8,336,728
Total 13,418,326 15,021,859 12,721,451 11,502,788
Performance
Strategy: To efficiently maintain street lights.
Performance Measures Actual '13 Actual '14 Projected '15 Target '16
# of street light outages addressed 3,878 8,098 7,600 Annual kWh savings from LED program 7,500,000 3,400,000 6,000,000
Responsiveness to Constituent Requests (CRM) Actual '13 Actual '14 Projected '15 Target '16
# of street light outage constituent requests received 7,362 5,825 6,000
% of street light outages addressed on time 58% 49% 70% 75%Average time to complete a street light outage request 38 56 38 10
S t r e e t s , T r a n s p o r t a t i o n & S a n i t a t i o n • P u b l i c W o r k s D e p a r t m e n t 2 7 7
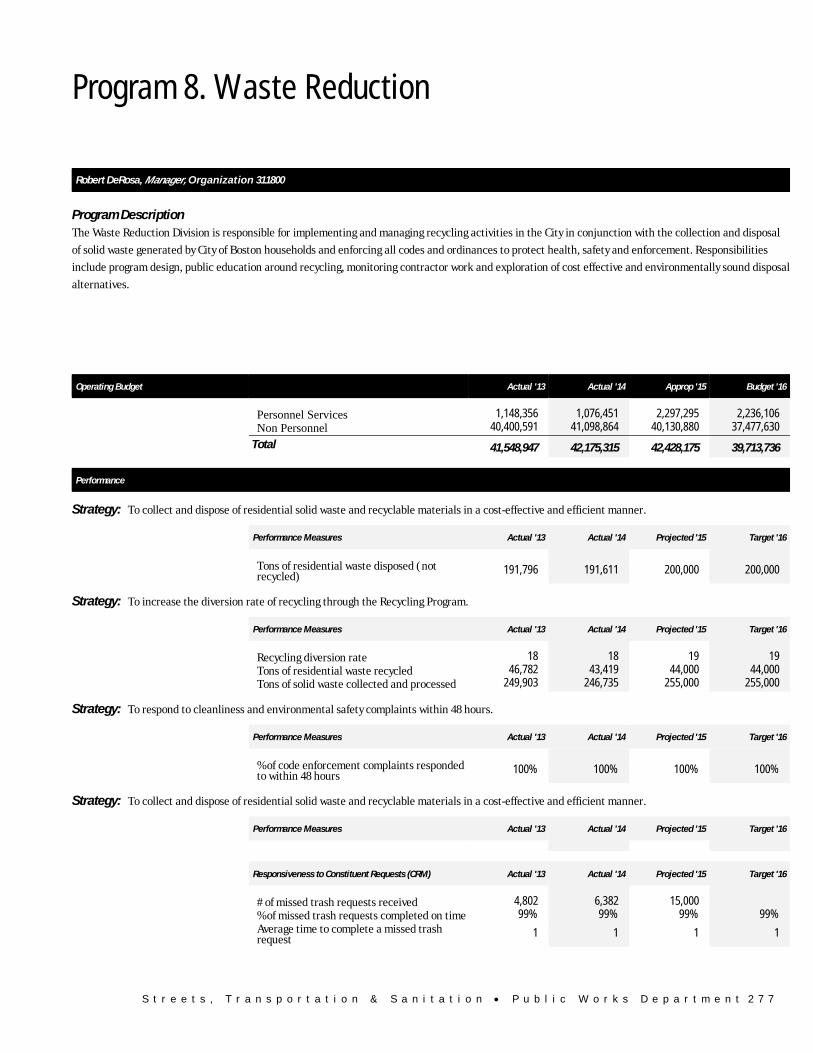
Program 8. Waste Reduction
Robert DeRosa, Manager, Organization 311800
Program Description The Waste Reduction Division is responsible for implementing and managing recycling activities in the City in conjunction with the collection and disposal
of solid waste generated by City of Boston households and enforcing all codes and ordinances to protect health, safety and enforcement. Responsibilities
include program design, public education around recycling, monitoring contractor work and exploration of cost effective and environmentally sound disposal
alternatives.
Operating Budget Actual '13 Actual '14 Approp '15 Budget '16
Personnel Services 1,148,356 1,076,451 2,297,295 2,236,106 Non Personnel 40,400,591 41,098,864 40,130,880 37,477,630
Total 41,548,947 42,175,315 42,428,175 39,713,736
Performance
Strategy: To collect and dispose of residential solid waste and recyclable materials in a cost-effective and efficient manner.
Performance Measures Actual '13 Actual '14 Projected '15 Target '16
Tons of residential waste disposed (not recycled) 191,796 191,611 200,000 200,000
Strategy: To increase the diversion rate of recycling through the Recycling Program.
Performance Measures Actual '13 Actual '14 Projected '15 Target '16
Recycling diversion rate 18 18 19 19Tons of residential waste recycled 46,782 43,419 44,000 44,000Tons of solid waste collected and processed 249,903 246,735 255,000 255,000
Strategy: To respond to cleanliness and environmental safety complaints within 48 hours.
Performance Measures Actual '13 Actual '14 Projected '15 Target '16
% of code enforcement complaints responded to within 48 hours 100% 100% 100% 100%
Strategy: To collect and dispose of residential solid waste and recyclable materials in a cost-effective and efficient manner.
Performance Measures Actual '13 Actual '14 Projected '15 Target '16
Responsiveness to Constituent Requests (CRM) Actual '13 Actual '14 Projected '15 Target '16
# of missed trash requests received 4,802 6,382 15,000% of missed trash requests completed on time 99% 99% 99% 99%Average time to complete a missed trash request 1 1 1 1
2 7 8 S t r e e t s , T r a n s p o r t a t i o n & S a n i t a t i o n • P u b l i c W o r k s D e p a r t m e n t
External Funds Projects
Electronic Waste Recycling and Advertising
Project Mission Apple Computer Co. donated $30,000 over three years thru FY13 to support electronic waste recycling and advertising services. This grant supports the municipal electronic waste recycling days.
Home Composting
Project Mission This revolving account was started with a grant from the State Department of Environmental Protection and uses yard waste materials from community gardens to create compost. The compost is sold and the proceeds were used to buy compost bins, which are also sold to residential gardeners, along with compost.
MBTA/Streetlight Division Facility Move
Project Mission This is a onetime cost sharing agreement in FY15 between the City of Boston and the MBTA to share the cost of moving the Street Light Division Maintenance Facility off of MBTA property. Funds will be used for moving the Division to a temporary location while a permanent location is constructed.
MRIP (Municipal Recycling Incentive Program)
Project Mission MRIP is a program of the DEP. The goal of the program is to increase municipal recycling, safely dispose of universal wastes (such as CRT's, mercury, paint and auto supplies) and develop a way to recover and reuse materials such as paper, cardboard and leaf and yard waste.
S t r e e t s , T r a n s p o r t a t i o n & S a n i t a t i o n • P u b l i c W o r k s D e p a r t m e n t 2 7 9
Public Works Department Capital Budget
Streets, Transportation & Sanitation Public Works Department
Overview Public Works is committed to implementing capital projects that will result in safe, well -functioning and attractive roadways, sidewalks, bridges and street
lights.
FY16 Major Initiatives • Public Works will begin construction on the Connect Historic Boston project, leveraging a $15.5m Transportation
Infrastructure Generating Economic Recovery (TIGER) grant from the Federal Department of Transportation.
• Construction will finish on capping the final section of the Gardner Street Landfill which will also include the
restoration of playing fields at the West Roxbury Education Complex.
• The City will continue to convert mercury and sodium vapor streetlights to LEDs, leveraging outside funds from
Eversource Energy to complete the project.
• The reconstruction and installation of pedestrian ramps on sidewalks will continue throughout the City, to
improve accessibility.
• Walkable Streets, a new project, will focus on longer, contiguous sections of sidewalks to improve overall
mobility.
• The City will begin construction on a new Street Lighting Division facility.
• Design processes with community input for major neighborhood improvements at North Square in the North End,
and Commonwealth Avenue Phase 3 & 4 in Brighton will continue.
Capital Budget Expenditures Total Actual '13 Total Actual '14 Estimated '15 Total Projected '16
Total Department 54,090,468 35,272,170 71,840,384 71,987,415
2 8 0 S t r e e t s , T r a n s p o r t a t i o n & S a n i t a t i o n • P u b l i c W o r k s D e p a r t m e n t
Public Works Department Project Profiles
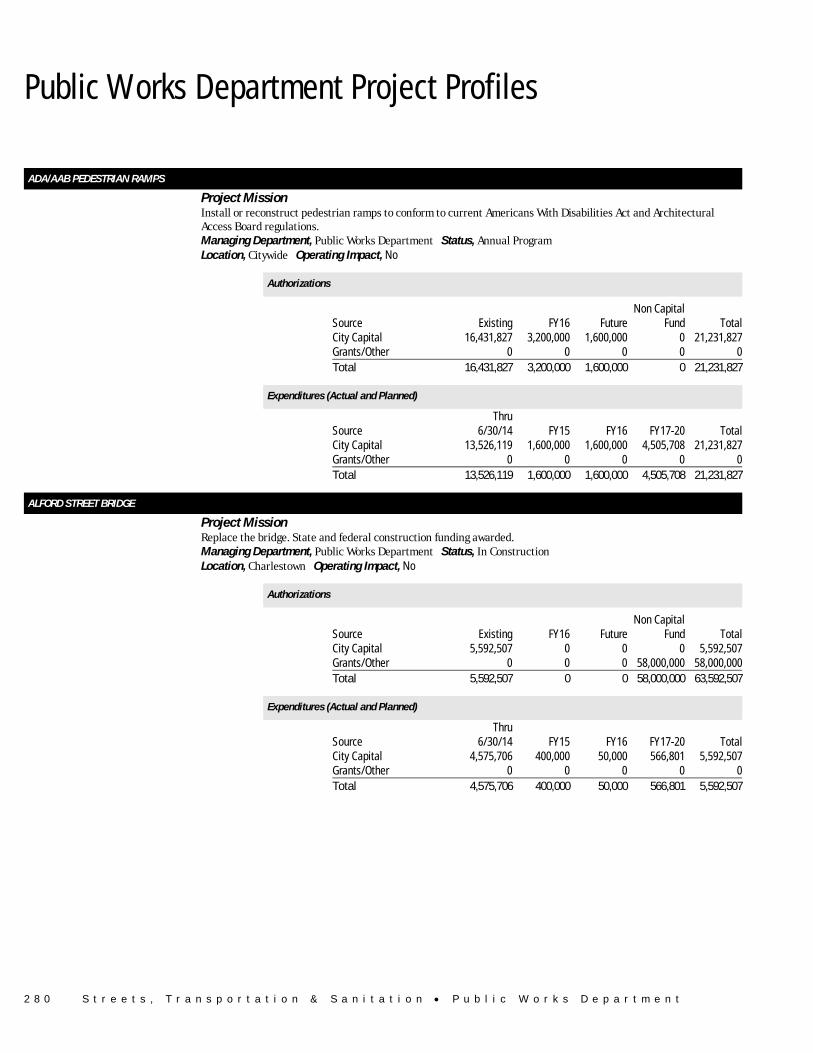
ADA/AAB PEDESTRIAN RAMPS Project Mission Install or reconstruct pedestrian ramps to conform to current Americans With Disabilities Act and Architectural
Access Board regulations. Managing Department, Public Works Department Status, Annual Program Location, Citywide Operating Impact, No
Authorizations
Source Existing FY16 FutureNon Capital
Fund Total City Capital 16,431,827 3,200,000 1,600,000 0 21,231,827 Grants/Other 0 0 0 0 0 Total 16,431,827 3,200,000 1,600,000 0 21,231,827
Expenditures (Actual and Planned)
Source Thru
6/30/14 FY15 FY16 FY17-20 Total City Capital 13,526,119 1,600,000 1,600,000 4,505,708 21,231,827 Grants/Other 0 0 0 0 0 Total 13,526,119 1,600,000 1,600,000 4,505,708 21,231,827
ALFORD STREET BRIDGE Project Mission Replace the bridge. State and federal construction funding awarded. Managing Department, Public Works Department Status, In Construction Location, Charlestown Operating Impact, No
Authorizations
Source Existing FY16 FutureNon Capital
Fund Total City Capital 5,592,507 0 0 0 5,592,507 Grants/Other 0 0 0 58,000,000 58,000,000 Total 5,592,507 0 0 58,000,000 63,592,507
Expenditures (Actual and Planned)
Source Thru
6/30/14 FY15 FY16 FY17-20 Total City Capital 4,575,706 400,000 50,000 566,801 5,592,507 Grants/Other 0 0 0 0 0 Total 4,575,706 400,000 50,000 566,801 5,592,507
S t r e e t s , T r a n s p o r t a t i o n & S a n i t a t i o n • P u b l i c W o r k s D e p a r t m e n t 2 8 1
Public Works Department Project Profiles
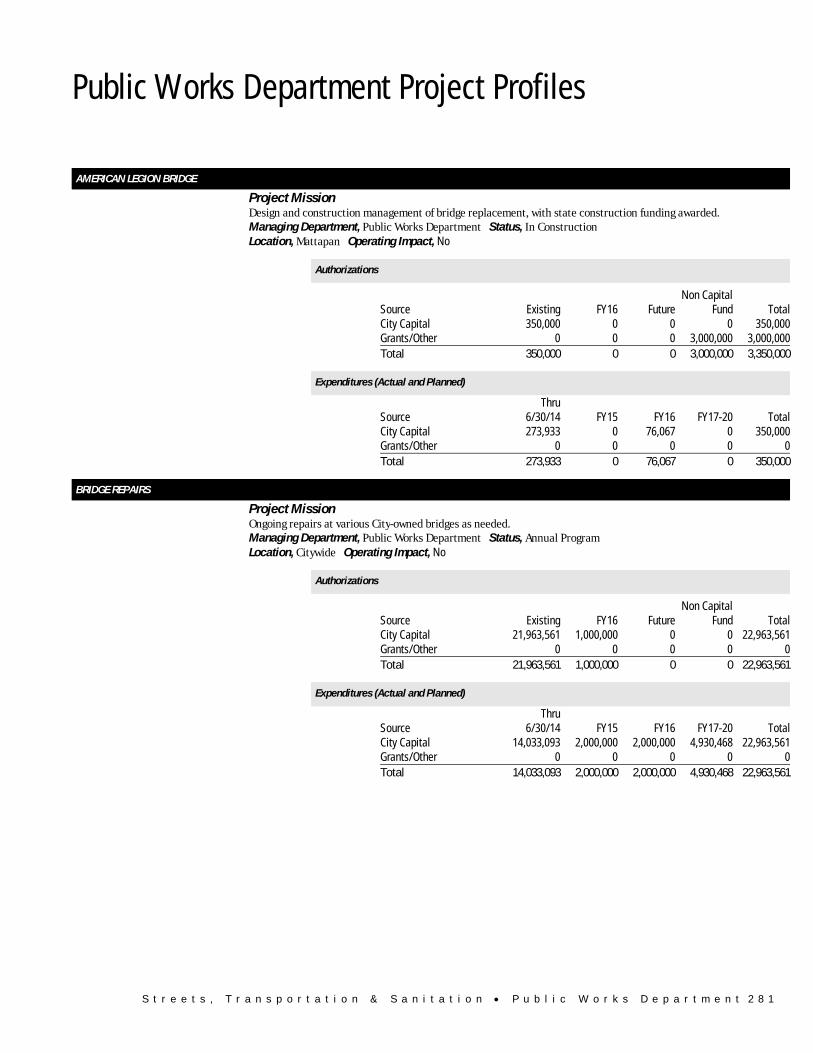
AMERICAN LEGION BRIDGE Project Mission Design and construction management of bridge replacement, with state construction funding awarded. Managing Department, Public Works Department Status, In Construction Location, Mattapan Operating Impact, No
Authorizations
Source Existing FY16 FutureNon Capital
Fund Total City Capital 350,000 0 0 0 350,000 Grants/Other 0 0 0 3,000,000 3,000,000 Total 350,000 0 0 3,000,000 3,350,000
Expenditures (Actual and Planned)
Source Thru
6/30/14 FY15 FY16 FY17-20 Total City Capital 273,933 0 76,067 0 350,000 Grants/Other 0 0 0 0 0 Total 273,933 0 76,067 0 350,000
BRIDGE REPAIRS Project Mission Ongoing repairs at various City-owned bridges as needed. Managing Department, Public Works Department Status, Annual Program Location, Citywide Operating Impact, No
Authorizations
Source Existing FY16 FutureNon Capital
Fund Total City Capital 21,963,561 1,000,000 0 0 22,963,561 Grants/Other 0 0 0 0 0 Total 21,963,561 1,000,000 0 0 22,963,561
Expenditures (Actual and Planned)
Source Thru
6/30/14 FY15 FY16 FY17-20 Total City Capital 14,033,093 2,000,000 2,000,000 4,930,468 22,963,561 Grants/Other 0 0 0 0 0 Total 14,033,093 2,000,000 2,000,000 4,930,468 22,963,561
2 8 2 S t r e e t s , T r a n s p o r t a t i o n & S a n i t a t i o n • P u b l i c W o r k s D e p a r t m e n t
Public Works Department Project Profiles
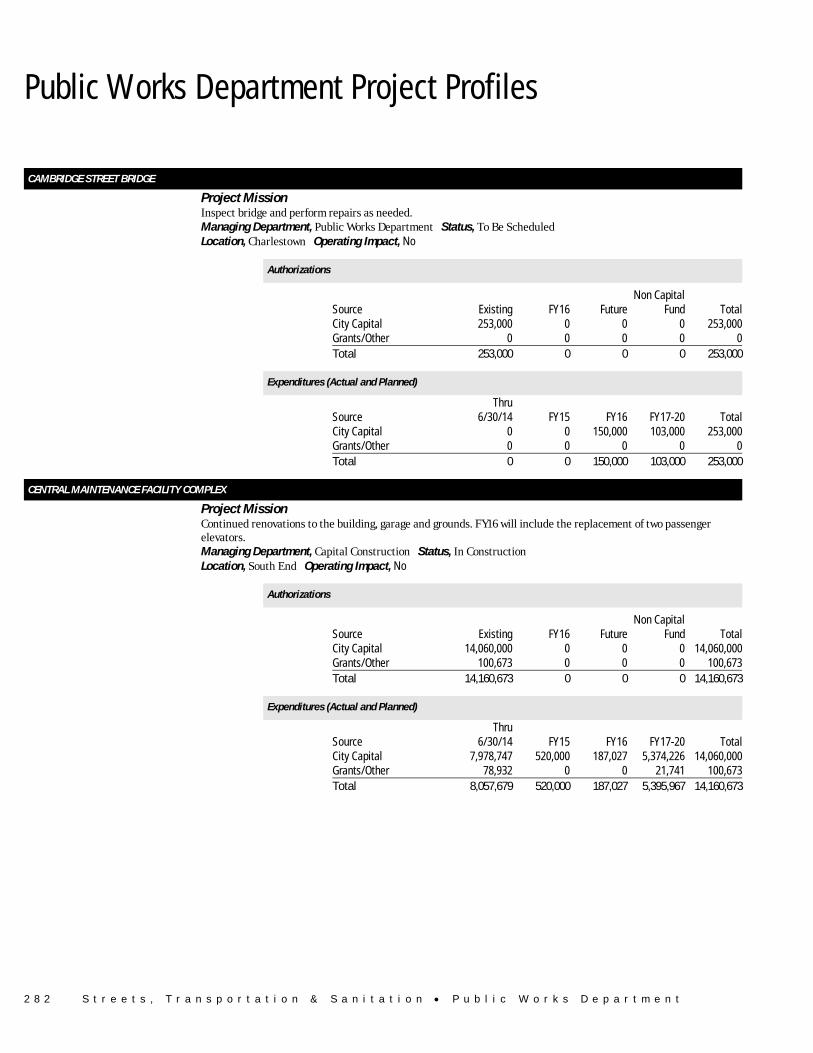
CAMBRIDGE STREET BRIDGE Project Mission Inspect bridge and perform repairs as needed. Managing Department, Public Works Department Status, To Be Scheduled Location, Charlestown Operating Impact, No
Authorizations
Source Existing FY16 FutureNon Capital
Fund Total City Capital 253,000 0 0 0 253,000 Grants/Other 0 0 0 0 0 Total 253,000 0 0 0 253,000
Expenditures (Actual and Planned)
Source Thru
6/30/14 FY15 FY16 FY17-20 Total City Capital 0 0 150,000 103,000 253,000 Grants/Other 0 0 0 0 0 Total 0 0 150,000 103,000 253,000
CENTRAL MAINTENANCE FACILITY COMPLEX Project Mission Continued renovations to the building, garage and grounds. FY16 will include the replacement of two passenger
elevators. Managing Department, Capital Construction Status, In Construction Location, South End Operating Impact, No
Authorizations
Source Existing FY16 FutureNon Capital
Fund Total City Capital 14,060,000 0 0 0 14,060,000 Grants/Other 100,673 0 0 0 100,673 Total 14,160,673 0 0 0 14,160,673
Expenditures (Actual and Planned)
Source Thru
6/30/14 FY15 FY16 FY17-20 Total City Capital 7,978,747 520,000 187,027 5,374,226 14,060,000 Grants/Other 78,932 0 0 21,741 100,673 Total 8,057,679 520,000 187,027 5,395,967 14,160,673
S t r e e t s , T r a n s p o r t a t i o n & S a n i t a t i o n • P u b l i c W o r k s D e p a r t m e n t 2 8 3
Public Works Department Project Profiles
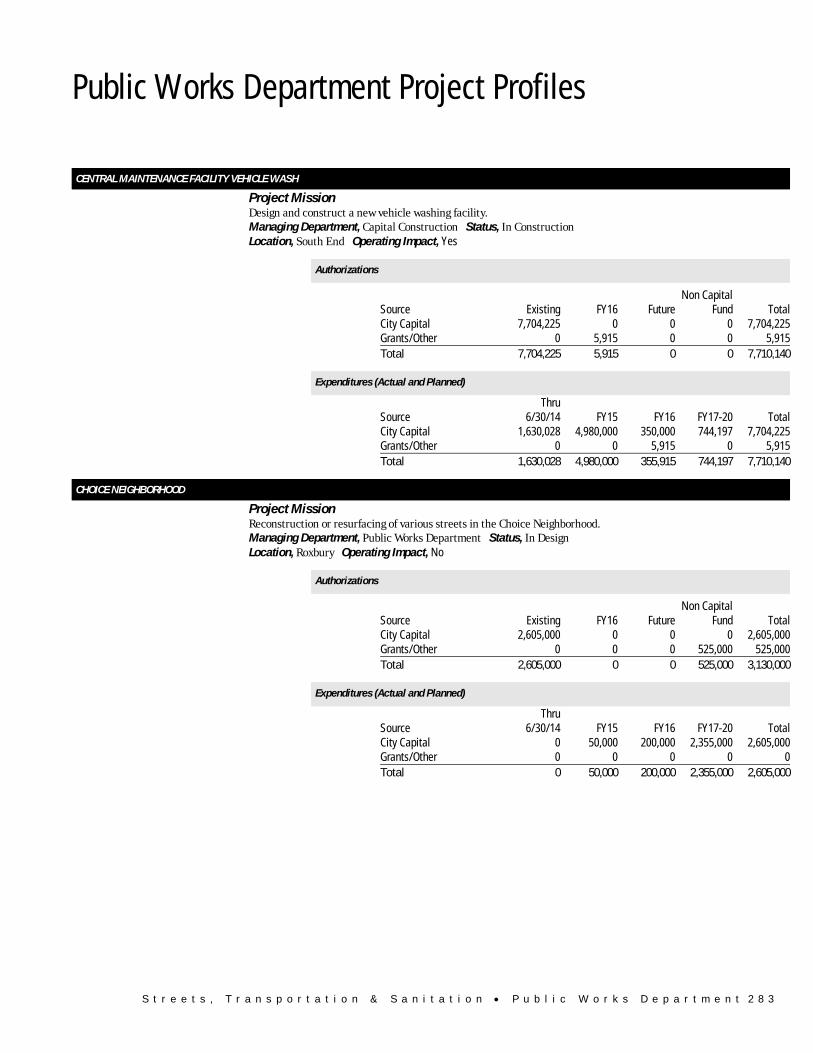
CENTRAL MAINTENANCE FACILITY VEHICLE WASH Project Mission Design and construct a new vehicle washing facility. Managing Department, Capital Construction Status, In Construction Location, South End Operating Impact, Yes
Authorizations
Source Existing FY16 FutureNon Capital
Fund Total City Capital 7,704,225 0 0 0 7,704,225 Grants/Other 0 5,915 0 0 5,915 Total 7,704,225 5,915 0 0 7,710,140
Expenditures (Actual and Planned)
Source Thru
6/30/14 FY15 FY16 FY17-20 Total City Capital 1,630,028 4,980,000 350,000 744,197 7,704,225 Grants/Other 0 0 5,915 0 5,915 Total 1,630,028 4,980,000 355,915 744,197 7,710,140
CHOICE NEIGHBORHOOD Project Mission Reconstruction or resurfacing of various streets in the Choice Neighborhood. Managing Department, Public Works Department Status, In Design Location, Roxbury Operating Impact, No
Authorizations
Source Existing FY16 FutureNon Capital
Fund Total City Capital 2,605,000 0 0 0 2,605,000 Grants/Other 0 0 0 525,000 525,000 Total 2,605,000 0 0 525,000 3,130,000
Expenditures (Actual and Planned)
Source Thru
6/30/14 FY15 FY16 FY17-20 Total City Capital 0 50,000 200,000 2,355,000 2,605,000 Grants/Other 0 0 0 0 0 Total 0 50,000 200,000 2,355,000 2,605,000
2 8 4 S t r e e t s , T r a n s p o r t a t i o n & S a n i t a t i o n • P u b l i c W o r k s D e p a r t m e n t
Public Works Department Project Profiles
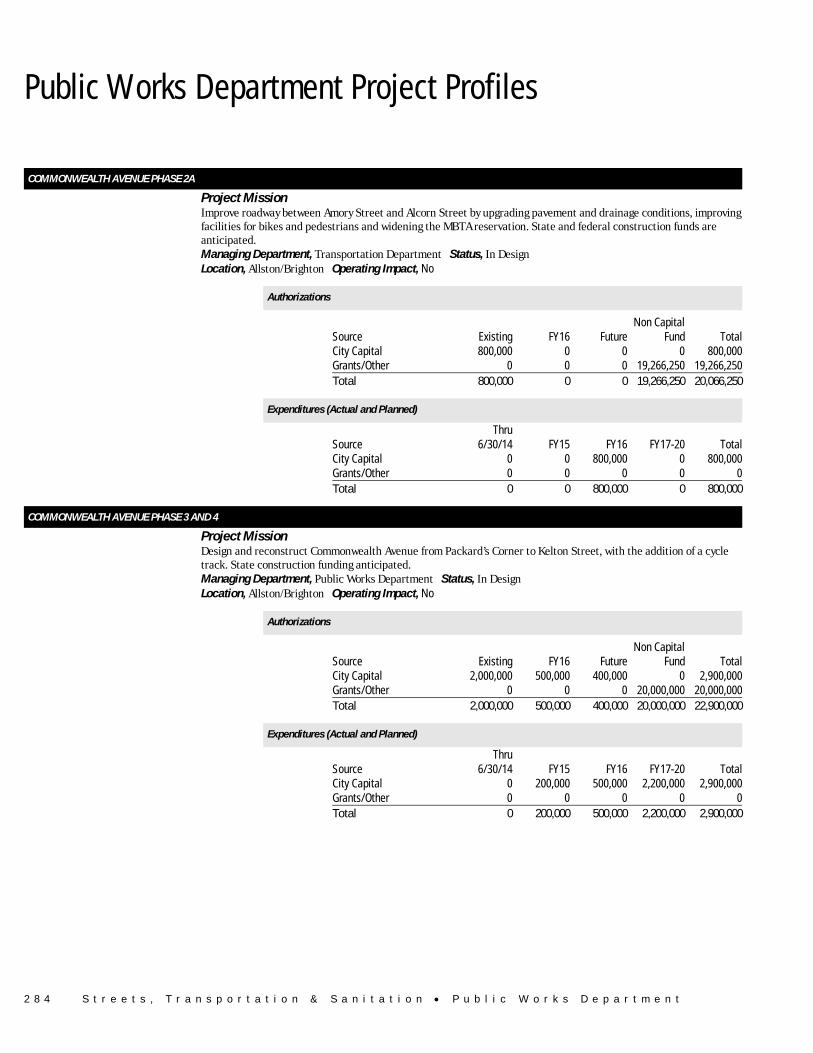
COMMONWEALTH AVENUE PHASE 2A Project Mission Improve roadway between Amory Street and Alcorn Street by upgrading pavement and drainage conditions, improving
facilities for bikes and pedestrians and widening the MBTA reservation. State and federal construction funds are anticipated.
Managing Department, Transportation Department Status, In Design Location, Allston/Brighton Operating Impact, No
Authorizations
Source Existing FY16 FutureNon Capital
Fund Total City Capital 800,000 0 0 0 800,000 Grants/Other 0 0 0 19,266,250 19,266,250 Total 800,000 0 0 19,266,250 20,066,250
Expenditures (Actual and Planned)
Source Thru
6/30/14 FY15 FY16 FY17-20 Total City Capital 0 0 800,000 0 800,000 Grants/Other 0 0 0 0 0 Total 0 0 800,000 0 800,000
COMMONWEALTH AVENUE PHASE 3 AND 4 Project Mission Design and reconstruct Commonwealth Avenue from Packard’s Corner to Kelton Street, with the addition of a cycle
track. State construction funding anticipated. Managing Department, Public Works Department Status, In Design Location, Allston/Brighton Operating Impact, No
Authorizations
Source Existing FY16 FutureNon Capital
Fund Total City Capital 2,000,000 500,000 400,000 0 2,900,000 Grants/Other 0 0 0 20,000,000 20,000,000 Total 2,000,000 500,000 400,000 20,000,000 22,900,000
Expenditures (Actual and Planned)
Source Thru
6/30/14 FY15 FY16 FY17-20 Total City Capital 0 200,000 500,000 2,200,000 2,900,000 Grants/Other 0 0 0 0 0 Total 0 200,000 500,000 2,200,000 2,900,000
S t r e e t s , T r a n s p o r t a t i o n & S a n i t a t i o n • P u b l i c W o r k s D e p a r t m e n t 2 8 5
Public Works Department Project Profiles
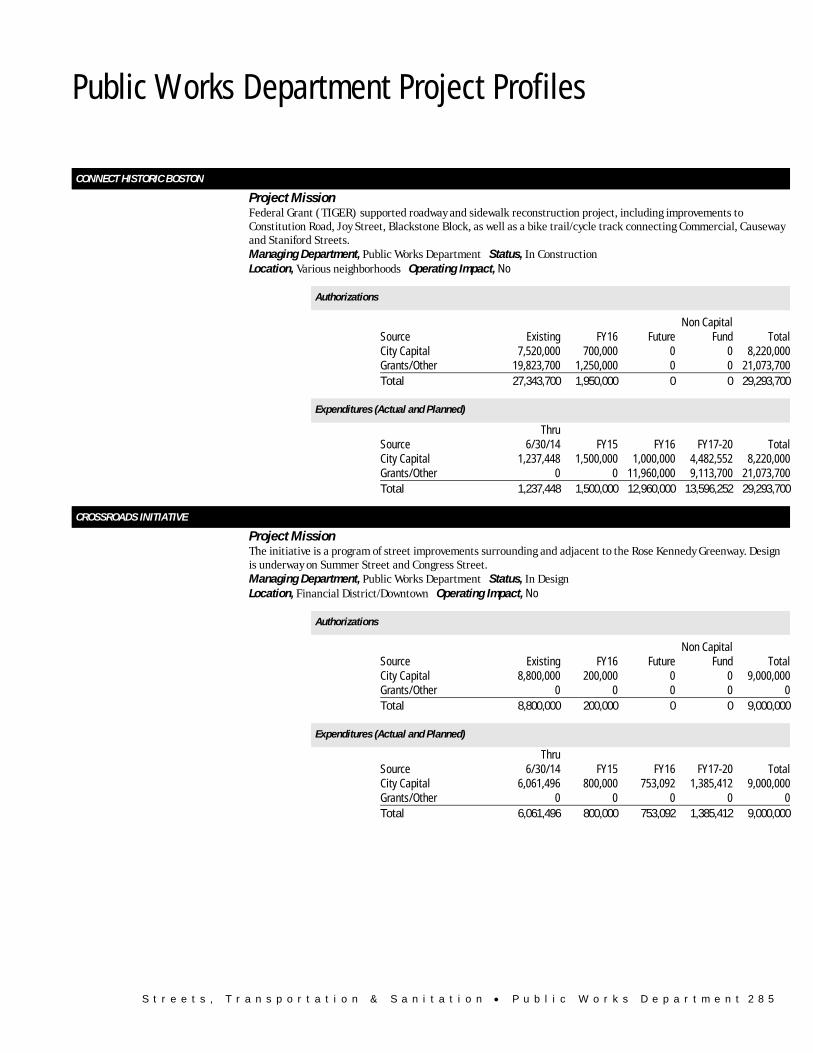
CONNECT HISTORIC BOSTON Project Mission Federal Grant (TIGER) supported roadway and sidewalk reconstruction project, including improvements to
Constitution Road, Joy Street, Blackstone Block, as well as a bike trail/cycle track connecting Commercial, Causeway and Staniford Streets.
Managing Department, Public Works Department Status, In Construction Location, Various neighborhoods Operating Impact, No
Authorizations
Source Existing FY16 FutureNon Capital
Fund Total City Capital 7,520,000 700,000 0 0 8,220,000 Grants/Other 19,823,700 1,250,000 0 0 21,073,700 Total 27,343,700 1,950,000 0 0 29,293,700
Expenditures (Actual and Planned)
Source Thru
6/30/14 FY15 FY16 FY17-20 Total City Capital 1,237,448 1,500,000 1,000,000 4,482,552 8,220,000 Grants/Other 0 0 11,960,000 9,113,700 21,073,700 Total 1,237,448 1,500,000 12,960,000 13,596,252 29,293,700
CROSSROADS INITIATIVE Project Mission The initiative is a program of street improvements surrounding and adjacent to the Rose Kennedy Greenway. Design
is underway on Summer Street and Congress Street. Managing Department, Public Works Department Status, In Design Location, Financial District/Downtown Operating Impact, No
Authorizations
Source Existing FY16 FutureNon Capital
Fund Total City Capital 8,800,000 200,000 0 0 9,000,000 Grants/Other 0 0 0 0 0 Total 8,800,000 200,000 0 0 9,000,000
Expenditures (Actual and Planned)
Source Thru
6/30/14 FY15 FY16 FY17-20 Total City Capital 6,061,496 800,000 753,092 1,385,412 9,000,000 Grants/Other 0 0 0 0 0 Total 6,061,496 800,000 753,092 1,385,412 9,000,000
2 8 6 S t r e e t s , T r a n s p o r t a t i o n & S a n i t a t i o n • P u b l i c W o r k s D e p a r t m e n t
Public Works Department Project Profiles
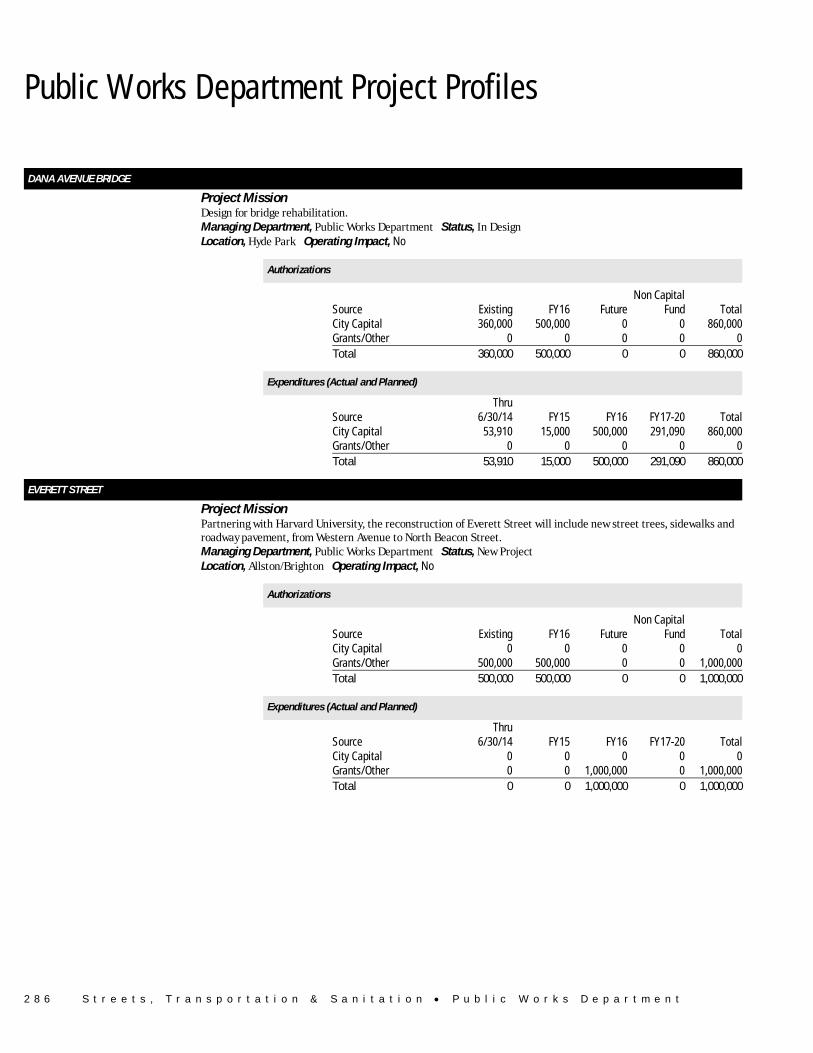
DANA AVENUE BRIDGE Project Mission Design for bridge rehabilitation. Managing Department, Public Works Department Status, In Design Location, Hyde Park Operating Impact, No
Authorizations
Source Existing FY16 FutureNon Capital
Fund Total City Capital 360,000 500,000 0 0 860,000 Grants/Other 0 0 0 0 0 Total 360,000 500,000 0 0 860,000
Expenditures (Actual and Planned)
Source Thru
6/30/14 FY15 FY16 FY17-20 Total City Capital 53,910 15,000 500,000 291,090 860,000 Grants/Other 0 0 0 0 0 Total 53,910 15,000 500,000 291,090 860,000
EVERETT STREET Project Mission Partnering with Harvard University, the reconstruction of Everett Street will include new street trees, sidewalks and
roadway pavement, from Western Avenue to North Beacon Street. Managing Department, Public Works Department Status, New Project Location, Allston/Brighton Operating Impact, No
Authorizations
Source Existing FY16 FutureNon Capital
Fund Total City Capital 0 0 0 0 0 Grants/Other 500,000 500,000 0 0 1,000,000 Total 500,000 500,000 0 0 1,000,000
Expenditures (Actual and Planned)
Source Thru
6/30/14 FY15 FY16 FY17-20 Total City Capital 0 0 0 0 0 Grants/Other 0 0 1,000,000 0 1,000,000 Total 0 0 1,000,000 0 1,000,000
S t r e e t s , T r a n s p o r t a t i o n & S a n i t a t i o n • P u b l i c W o r k s D e p a r t m e n t 2 8 7
Public Works Department Project Profiles
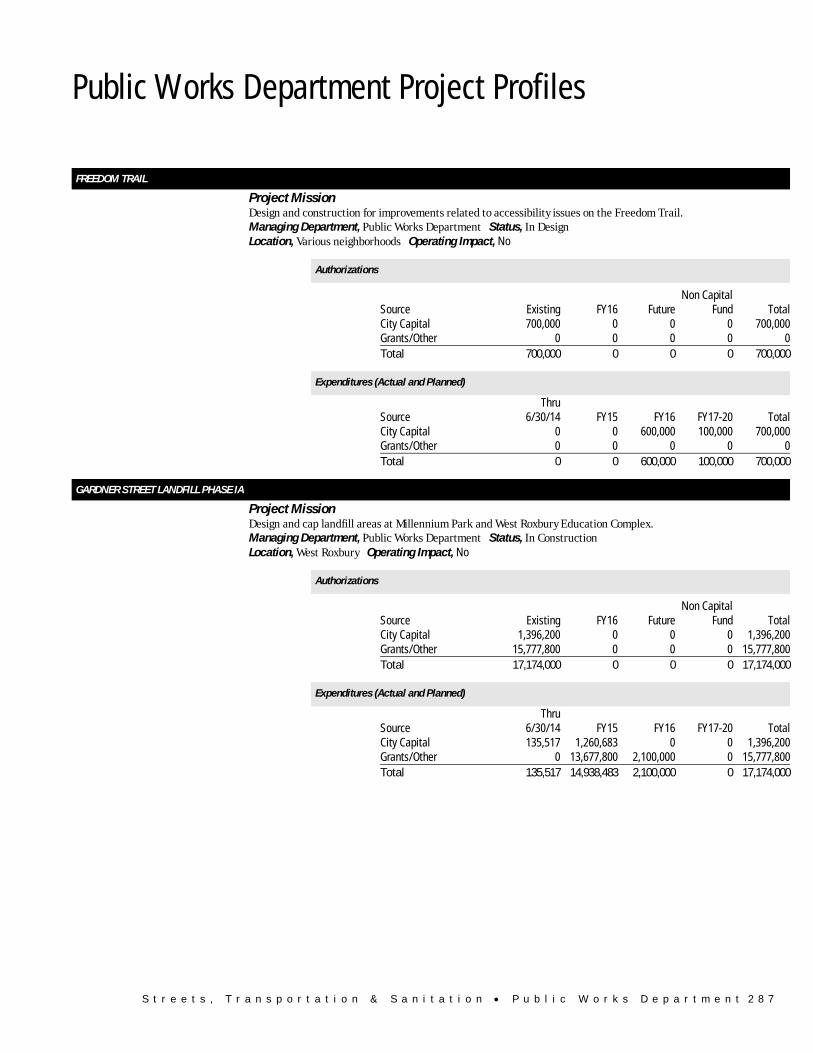
FREEDOM TRAIL Project Mission Design and construction for improvements related to accessibility issues on the Freedom Trail. Managing Department, Public Works Department Status, In Design Location, Various neighborhoods Operating Impact, No
Authorizations
Source Existing FY16 FutureNon Capital
Fund Total City Capital 700,000 0 0 0 700,000 Grants/Other 0 0 0 0 0 Total 700,000 0 0 0 700,000
Expenditures (Actual and Planned)
Source Thru
6/30/14 FY15 FY16 FY17-20 Total City Capital 0 0 600,000 100,000 700,000 Grants/Other 0 0 0 0 0 Total 0 0 600,000 100,000 700,000
GARDNER STREET LANDFILL PHASE IA Project Mission Design and cap landfill areas at Millennium Park and West Roxbury Education Complex. Managing Department, Public Works Department Status, In Construction Location, West Roxbury Operating Impact, No
Authorizations
Source Existing FY16 FutureNon Capital
Fund Total City Capital 1,396,200 0 0 0 1,396,200 Grants/Other 15,777,800 0 0 0 15,777,800 Total 17,174,000 0 0 0 17,174,000
Expenditures (Actual and Planned)
Source Thru
6/30/14 FY15 FY16 FY17-20 Total City Capital 135,517 1,260,683 0 0 1,396,200 Grants/Other 0 13,677,800 2,100,000 0 15,777,800 Total 135,517 14,938,483 2,100,000 0 17,174,000
2 8 8 S t r e e t s , T r a n s p o r t a t i o n & S a n i t a t i o n • P u b l i c W o r k s D e p a r t m e n t
Public Works Department Project Profiles
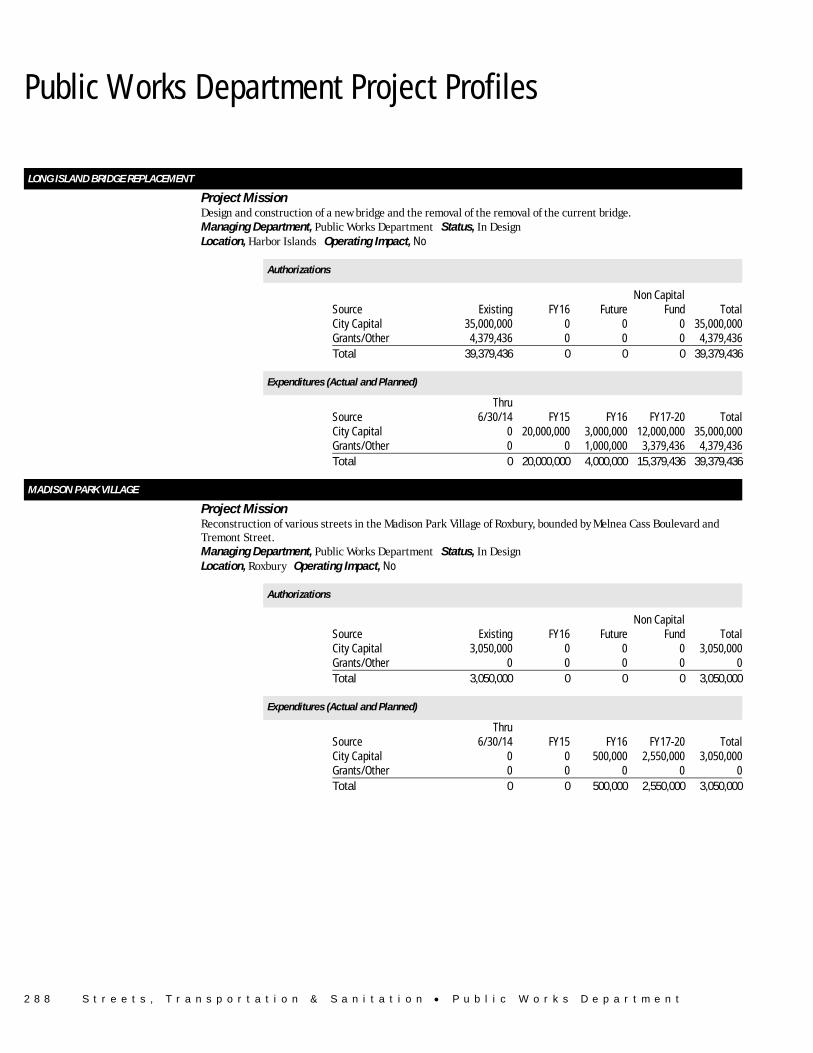
LONG ISLAND BRIDGE REPLACEMENT Project Mission Design and construction of a new bridge and the removal of the removal of the current bridge. Managing Department, Public Works Department Status, In Design Location, Harbor Islands Operating Impact, No
Authorizations
Source Existing FY16 FutureNon Capital
Fund Total City Capital 35,000,000 0 0 0 35,000,000 Grants/Other 4,379,436 0 0 0 4,379,436 Total 39,379,436 0 0 0 39,379,436
Expenditures (Actual and Planned)
Source Thru
6/30/14 FY15 FY16 FY17-20 Total City Capital 0 20,000,000 3,000,000 12,000,000 35,000,000 Grants/Other 0 0 1,000,000 3,379,436 4,379,436 Total 0 20,000,000 4,000,000 15,379,436 39,379,436
MADISON PARK VILLAGE Project Mission Reconstruction of various streets in the Madison Park Village of Roxbury, bounded by Melnea Cass Boulevard and
Tremont Street. Managing Department, Public Works Department Status, In Design Location, Roxbury Operating Impact, No
Authorizations
Source Existing FY16 FutureNon Capital
Fund Total City Capital 3,050,000 0 0 0 3,050,000 Grants/Other 0 0 0 0 0 Total 3,050,000 0 0 0 3,050,000
Expenditures (Actual and Planned)
Source Thru
6/30/14 FY15 FY16 FY17-20 Total City Capital 0 0 500,000 2,550,000 3,050,000 Grants/Other 0 0 0 0 0 Total 0 0 500,000 2,550,000 3,050,000

S t r e e t s , T r a n s p o r t a t i o n & S a n i t a t i o n • P u b l i c W o r k s D e p a r t m e n t 2 8 9
Public Works Department Project Profiles
MAIN STREET BUSINESS DISTRICT Project Mission Revitalization of Public Works assets in Main Streets business districts, including improvements to sidewalks,
pedestrian ramps, crosswalks and roadways. Managing Department, Public Works Department Status, Annual Program Location, Various neighborhoods Operating Impact, No
Authorizations
Source Existing FY16 FutureNon Capital
Fund Total City Capital 1,000,000 1,000,000 0 0 2,000,000 Grants/Other 0 0 0 0 0 Total 1,000,000 1,000,000 0 0 2,000,000
Expenditures (Actual and Planned)
Source Thru
6/30/14 FY15 FY16 FY17-20 Total City Capital 0 160,000 1,000,000 840,000 2,000,000 Grants/Other 0 0 0 0 0 Total 0 160,000 1,000,000 840,000 2,000,000
MASSACHUSETTS AVENUE BRIDGE AT COMMONWEALTH AVENUE Project Mission Design bridge repairs. State and federal construction funding anticipated. Managing Department, Public Works Department Status, In Design Location, Back Bay Operating Impact, No
Authorizations
Source Existing FY16 FutureNon Capital
Fund Total City Capital 1,538,974 200,000 0 0 1,738,974 Grants/Other 0 0 0 16,183,795 16,183,795 Total 1,538,974 200,000 0 16,183,795 17,922,769
Expenditures (Actual and Planned)
Source Thru
6/30/14 FY15 FY16 FY17-20 Total City Capital 825,854 400,000 513,120 0 1,738,974 Grants/Other 0 0 0 0 0 Total 825,854 400,000 513,120 0 1,738,974
2 9 0 S t r e e t s , T r a n s p o r t a t i o n & S a n i t a t i o n • P u b l i c W o r k s D e p a r t m e n t
Public Works Department Project Profiles
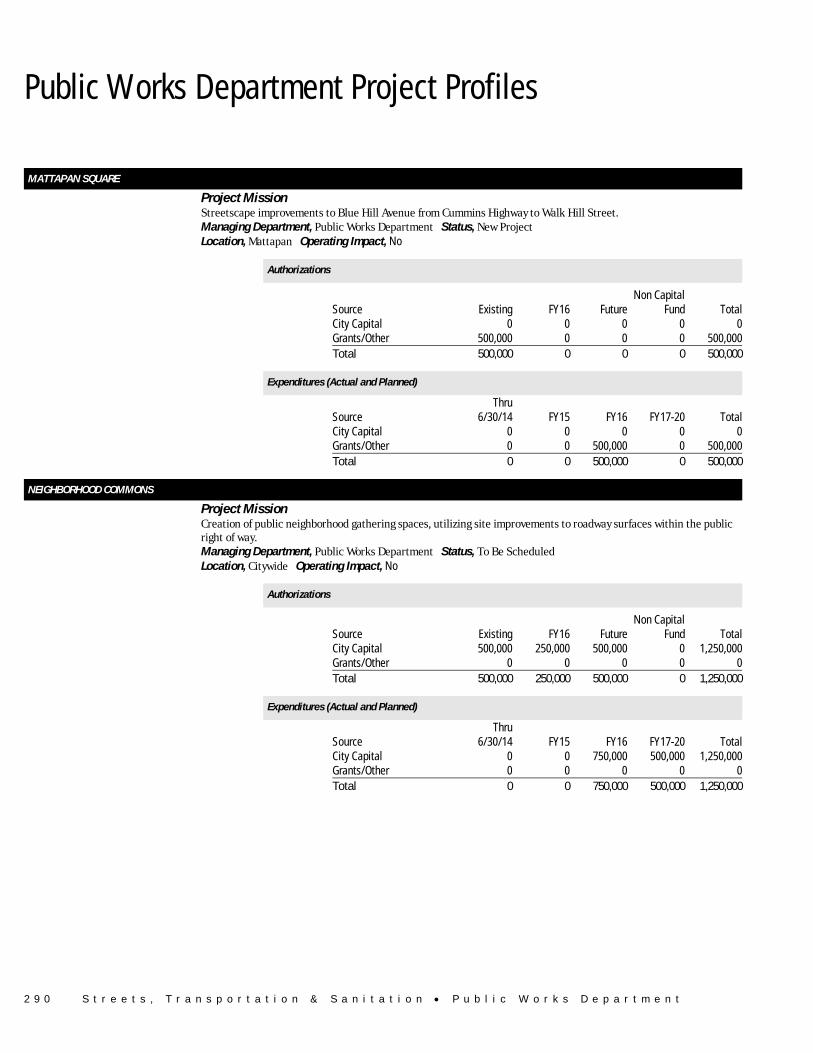
MATTAPAN SQUARE Project Mission Streetscape improvements to Blue Hill Avenue from Cummins Highway to Walk Hill Street. Managing Department, Public Works Department Status, New Project Location, Mattapan Operating Impact, No
Authorizations
Source Existing FY16 FutureNon Capital
Fund Total City Capital 0 0 0 0 0 Grants/Other 500,000 0 0 0 500,000 Total 500,000 0 0 0 500,000
Expenditures (Actual and Planned)
Source Thru
6/30/14 FY15 FY16 FY17-20 Total City Capital 0 0 0 0 0 Grants/Other 0 0 500,000 0 500,000 Total 0 0 500,000 0 500,000
NEIGHBORHOOD COMMONS Project Mission Creation of public neighborhood gathering spaces, utilizing site improvements to roadway surfaces within the public
right of way. Managing Department, Public Works Department Status, To Be Scheduled Location, Citywide Operating Impact, No
Authorizations
Source Existing FY16 FutureNon Capital
Fund Total City Capital 500,000 250,000 500,000 0 1,250,000 Grants/Other 0 0 0 0 0 Total 500,000 250,000 500,000 0 1,250,000
Expenditures (Actual and Planned)
Source Thru
6/30/14 FY15 FY16 FY17-20 Total City Capital 0 0 750,000 500,000 1,250,000 Grants/Other 0 0 0 0 0 Total 0 0 750,000 500,000 1,250,000
S t r e e t s , T r a n s p o r t a t i o n & S a n i t a t i o n • P u b l i c W o r k s D e p a r t m e n t 2 9 1
Public Works Department Project Profiles
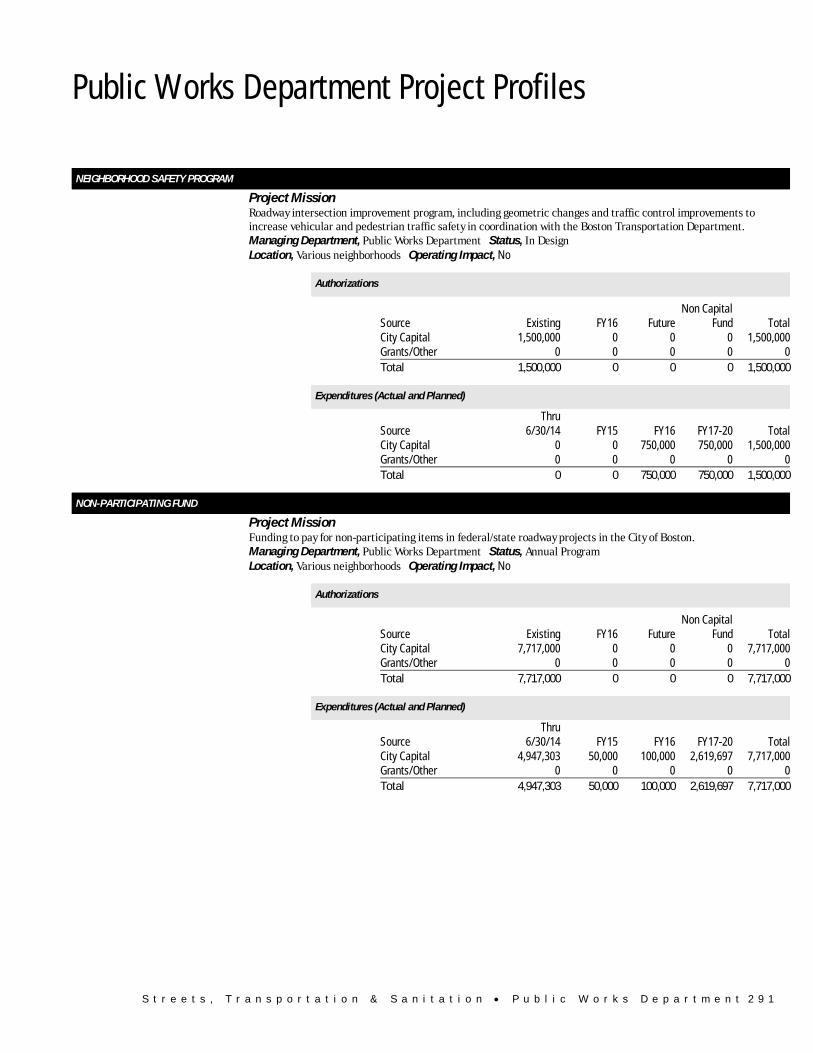
NEIGHBORHOOD SAFETY PROGRAM Project Mission Roadway intersection improvement program, including geometric changes and traffic control improvements to
increase vehicular and pedestrian traffic safety in coordination with the Boston Transportation Department. Managing Department, Public Works Department Status, In Design Location, Various neighborhoods Operating Impact, No
Authorizations
Source Existing FY16 FutureNon Capital
Fund Total City Capital 1,500,000 0 0 0 1,500,000 Grants/Other 0 0 0 0 0 Total 1,500,000 0 0 0 1,500,000
Expenditures (Actual and Planned)
Source Thru
6/30/14 FY15 FY16 FY17-20 Total City Capital 0 0 750,000 750,000 1,500,000 Grants/Other 0 0 0 0 0 Total 0 0 750,000 750,000 1,500,000
NON-PARTICIPATING FUND Project Mission Funding to pay for non-participating items in federal/state roadway projects in the City of Boston. Managing Department, Public Works Department Status, Annual Program Location, Various neighborhoods Operating Impact, No
Authorizations
Source Existing FY16 FutureNon Capital
Fund Total City Capital 7,717,000 0 0 0 7,717,000 Grants/Other 0 0 0 0 0 Total 7,717,000 0 0 0 7,717,000
Expenditures (Actual and Planned)
Source Thru
6/30/14 FY15 FY16 FY17-20 Total City Capital 4,947,303 50,000 100,000 2,619,697 7,717,000 Grants/Other 0 0 0 0 0 Total 4,947,303 50,000 100,000 2,619,697 7,717,000
2 9 2 S t r e e t s , T r a n s p o r t a t i o n & S a n i t a t i o n • P u b l i c W o r k s D e p a r t m e n t
Public Works Department Project Profiles
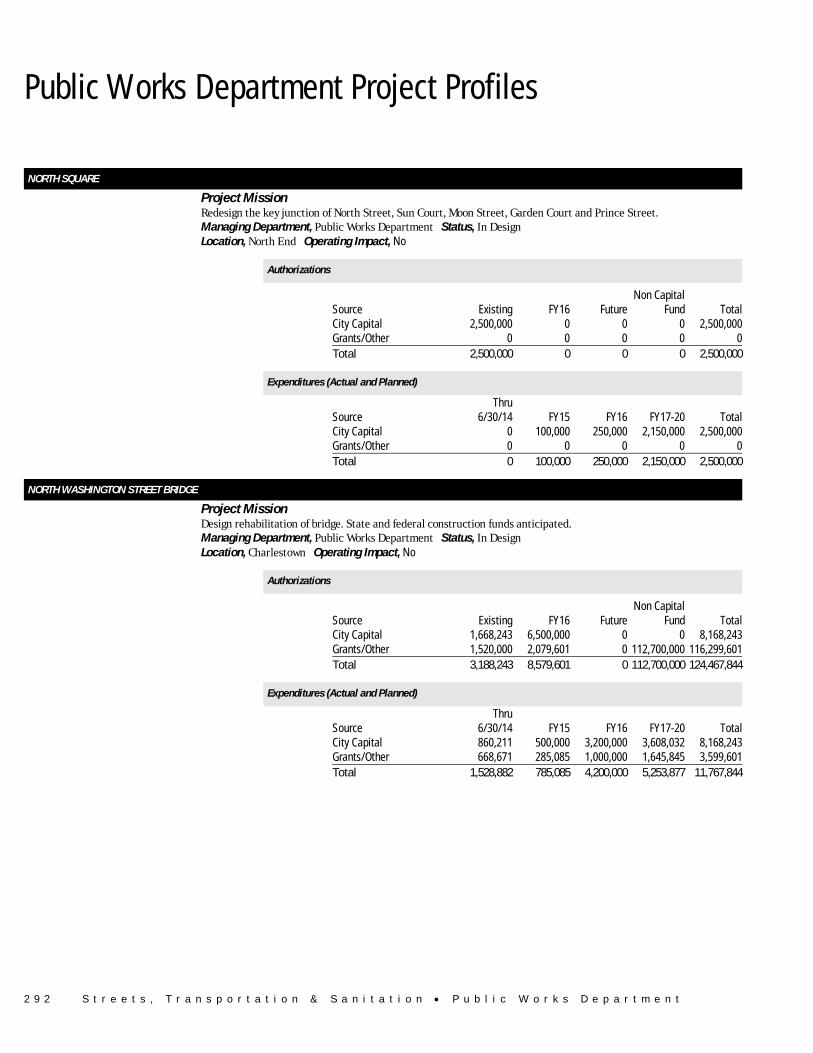
NORTH SQUARE Project Mission Redesign the key junction of North Street, Sun Court, Moon Street, Garden Court and Prince Street. Managing Department, Public Works Department Status, In Design Location, North End Operating Impact, No
Authorizations
Source Existing FY16 FutureNon Capital
Fund Total City Capital 2,500,000 0 0 0 2,500,000 Grants/Other 0 0 0 0 0 Total 2,500,000 0 0 0 2,500,000
Expenditures (Actual and Planned)
Source Thru
6/30/14 FY15 FY16 FY17-20 Total City Capital 0 100,000 250,000 2,150,000 2,500,000 Grants/Other 0 0 0 0 0 Total 0 100,000 250,000 2,150,000 2,500,000
NORTH WASHINGTON STREET BRIDGE Project Mission Design rehabilitation of bridge. State and federal construction funds anticipated. Managing Department, Public Works Department Status, In Design Location, Charlestown Operating Impact, No
Authorizations
Source Existing FY16 FutureNon Capital
Fund Total City Capital 1,668,243 6,500,000 0 0 8,168,243 Grants/Other 1,520,000 2,079,601 0 112,700,000 116,299,601 Total 3,188,243 8,579,601 0 112,700,000 124,467,844
Expenditures (Actual and Planned)
Source Thru
6/30/14 FY15 FY16 FY17-20 Total City Capital 860,211 500,000 3,200,000 3,608,032 8,168,243 Grants/Other 668,671 285,085 1,000,000 1,645,845 3,599,601 Total 1,528,882 785,085 4,200,000 5,253,877 11,767,844
S t r e e t s , T r a n s p o r t a t i o n & S a n i t a t i o n • P u b l i c W o r k s D e p a r t m e n t 2 9 3
Public Works Department Project Profiles
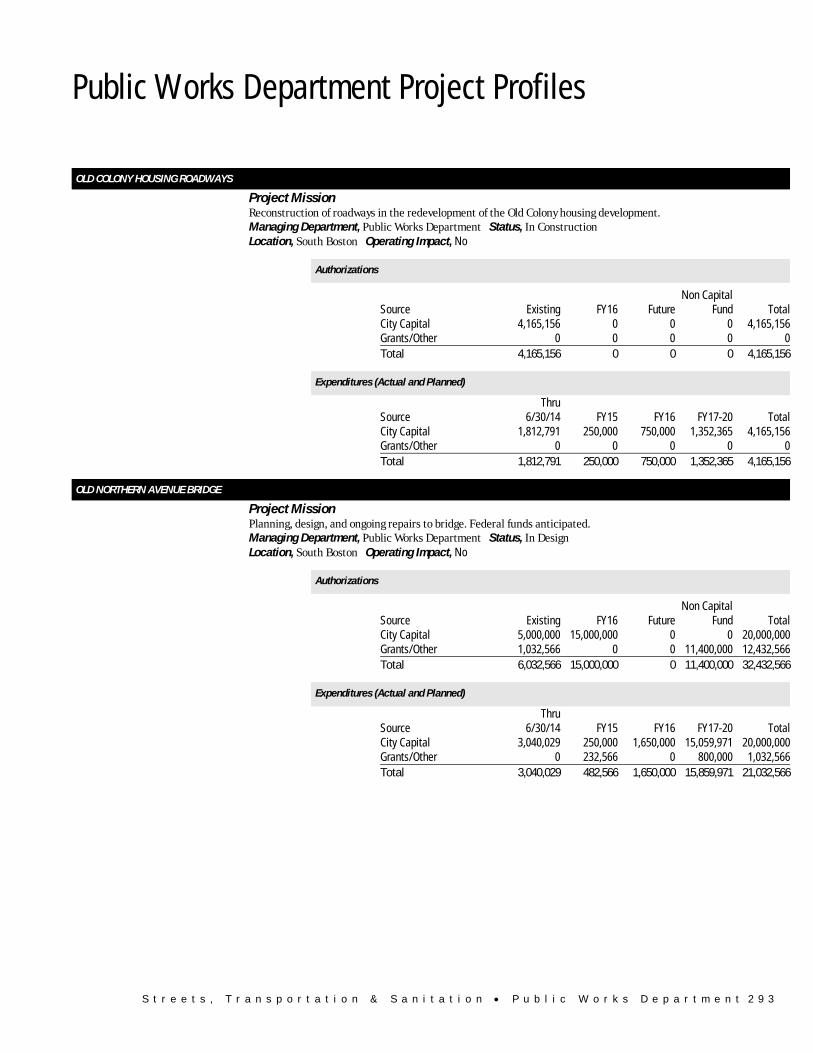
OLD COLONY HOUSING ROADWAYS Project Mission Reconstruction of roadways in the redevelopment of the Old Colony housing development. Managing Department, Public Works Department Status, In Construction Location, South Boston Operating Impact, No
Authorizations
Source Existing FY16 FutureNon Capital
Fund Total City Capital 4,165,156 0 0 0 4,165,156 Grants/Other 0 0 0 0 0 Total 4,165,156 0 0 0 4,165,156
Expenditures (Actual and Planned)
Source Thru
6/30/14 FY15 FY16 FY17-20 Total City Capital 1,812,791 250,000 750,000 1,352,365 4,165,156 Grants/Other 0 0 0 0 0 Total 1,812,791 250,000 750,000 1,352,365 4,165,156
OLD NORTHERN AVENUE BRIDGE Project Mission Planning, design, and ongoing repairs to bridge. Federal funds anticipated. Managing Department, Public Works Department Status, In Design Location, South Boston Operating Impact, No
Authorizations
Source Existing FY16 FutureNon Capital
Fund Total City Capital 5,000,000 15,000,000 0 0 20,000,000 Grants/Other 1,032,566 0 0 11,400,000 12,432,566 Total 6,032,566 15,000,000 0 11,400,000 32,432,566
Expenditures (Actual and Planned)
Source Thru
6/30/14 FY15 FY16 FY17-20 Total City Capital 3,040,029 250,000 1,650,000 15,059,971 20,000,000 Grants/Other 0 232,566 0 800,000 1,032,566 Total 3,040,029 482,566 1,650,000 15,859,971 21,032,566
2 9 4 S t r e e t s , T r a n s p o r t a t i o n & S a n i t a t i o n • P u b l i c W o r k s D e p a r t m e n t
Public Works Department Project Profiles
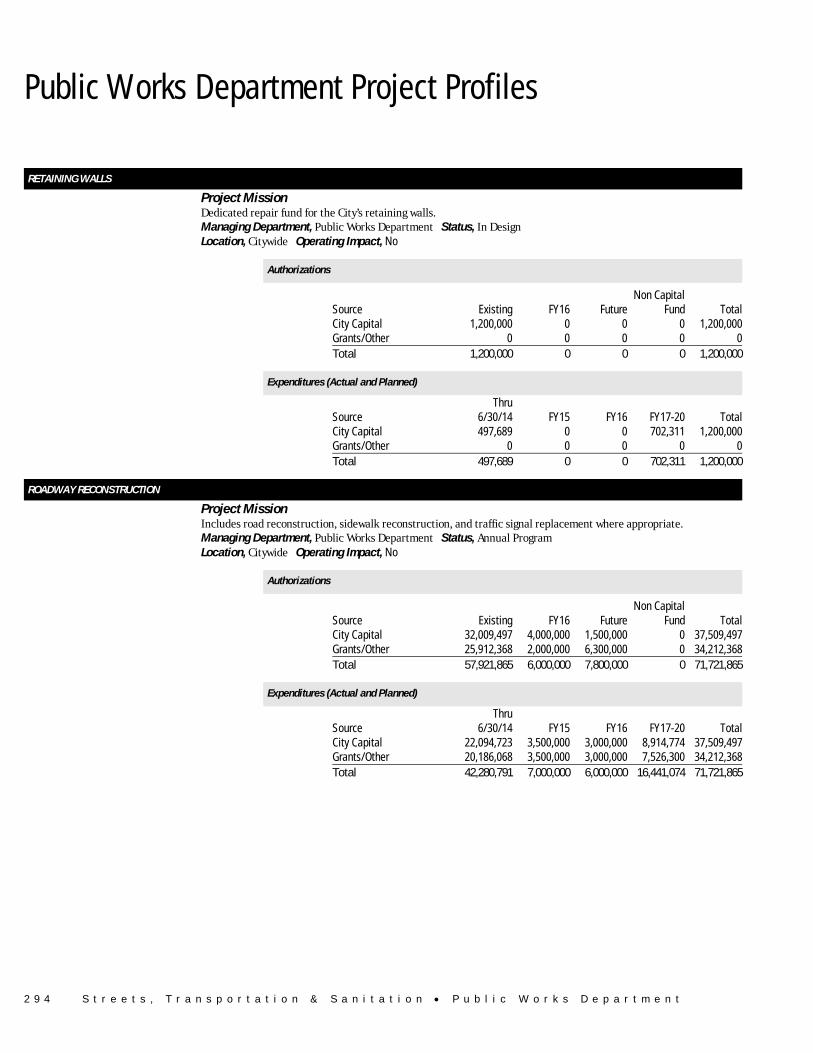
RETAINING WALLS Project Mission Dedicated repair fund for the City’s retaining walls. Managing Department, Public Works Department Status, In Design Location, Citywide Operating Impact, No
Authorizations
Source Existing FY16 FutureNon Capital
Fund Total City Capital 1,200,000 0 0 0 1,200,000 Grants/Other 0 0 0 0 0 Total 1,200,000 0 0 0 1,200,000
Expenditures (Actual and Planned)
Source Thru
6/30/14 FY15 FY16 FY17-20 Total City Capital 497,689 0 0 702,311 1,200,000 Grants/Other 0 0 0 0 0 Total 497,689 0 0 702,311 1,200,000
ROADWAY RECONSTRUCTION Project Mission Includes road reconstruction, sidewalk reconstruction, and traffic signal replacement where appropriate. Managing Department, Public Works Department Status, Annual Program Location, Citywide Operating Impact, No
Authorizations
Source Existing FY16 FutureNon Capital
Fund Total City Capital 32,009,497 4,000,000 1,500,000 0 37,509,497 Grants/Other 25,912,368 2,000,000 6,300,000 0 34,212,368 Total 57,921,865 6,000,000 7,800,000 0 71,721,865
Expenditures (Actual and Planned)
Source Thru
6/30/14 FY15 FY16 FY17-20 Total City Capital 22,094,723 3,500,000 3,000,000 8,914,774 37,509,497 Grants/Other 20,186,068 3,500,000 3,000,000 7,526,300 34,212,368 Total 42,280,791 7,000,000 6,000,000 16,441,074 71,721,865
S t r e e t s , T r a n s p o r t a t i o n & S a n i t a t i o n • P u b l i c W o r k s D e p a r t m e n t 2 9 5
Public Works Department Project Profiles
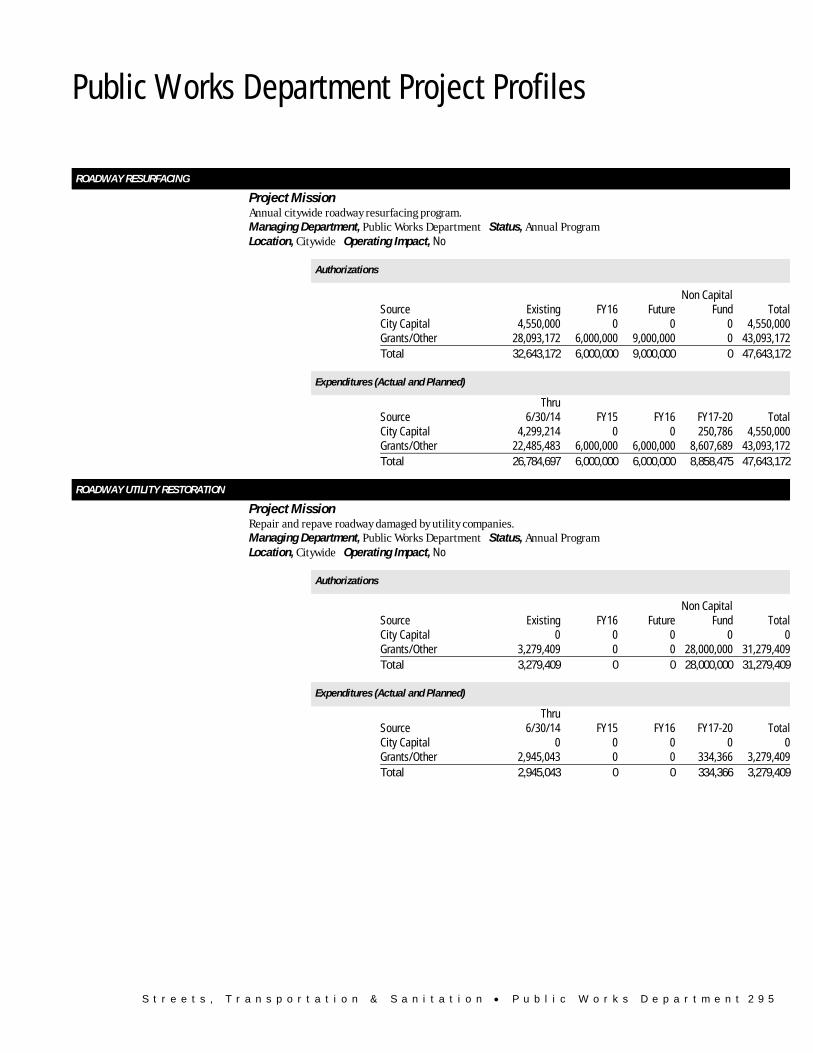
ROADWAY RESURFACING Project Mission Annual citywide roadway resurfacing program. Managing Department, Public Works Department Status, Annual Program Location, Citywide Operating Impact, No
Authorizations
Source Existing FY16 FutureNon Capital
Fund Total City Capital 4,550,000 0 0 0 4,550,000 Grants/Other 28,093,172 6,000,000 9,000,000 0 43,093,172 Total 32,643,172 6,000,000 9,000,000 0 47,643,172
Expenditures (Actual and Planned)
Source Thru
6/30/14 FY15 FY16 FY17-20 Total City Capital 4,299,214 0 0 250,786 4,550,000 Grants/Other 22,485,483 6,000,000 6,000,000 8,607,689 43,093,172 Total 26,784,697 6,000,000 6,000,000 8,858,475 47,643,172
ROADWAY UTILITY RESTORATION Project Mission Repair and repave roadway damaged by utility companies. Managing Department, Public Works Department Status, Annual Program Location, Citywide Operating Impact, No
Authorizations
Source Existing FY16 FutureNon Capital
Fund Total City Capital 0 0 0 0 0 Grants/Other 3,279,409 0 0 28,000,000 31,279,409 Total 3,279,409 0 0 28,000,000 31,279,409
Expenditures (Actual and Planned)
Source Thru
6/30/14 FY15 FY16 FY17-20 Total City Capital 0 0 0 0 0 Grants/Other 2,945,043 0 0 334,366 3,279,409 Total 2,945,043 0 0 334,366 3,279,409
2 9 6 S t r e e t s , T r a n s p o r t a t i o n & S a n i t a t i o n • P u b l i c W o r k s D e p a r t m e n t
Public Works Department Project Profiles
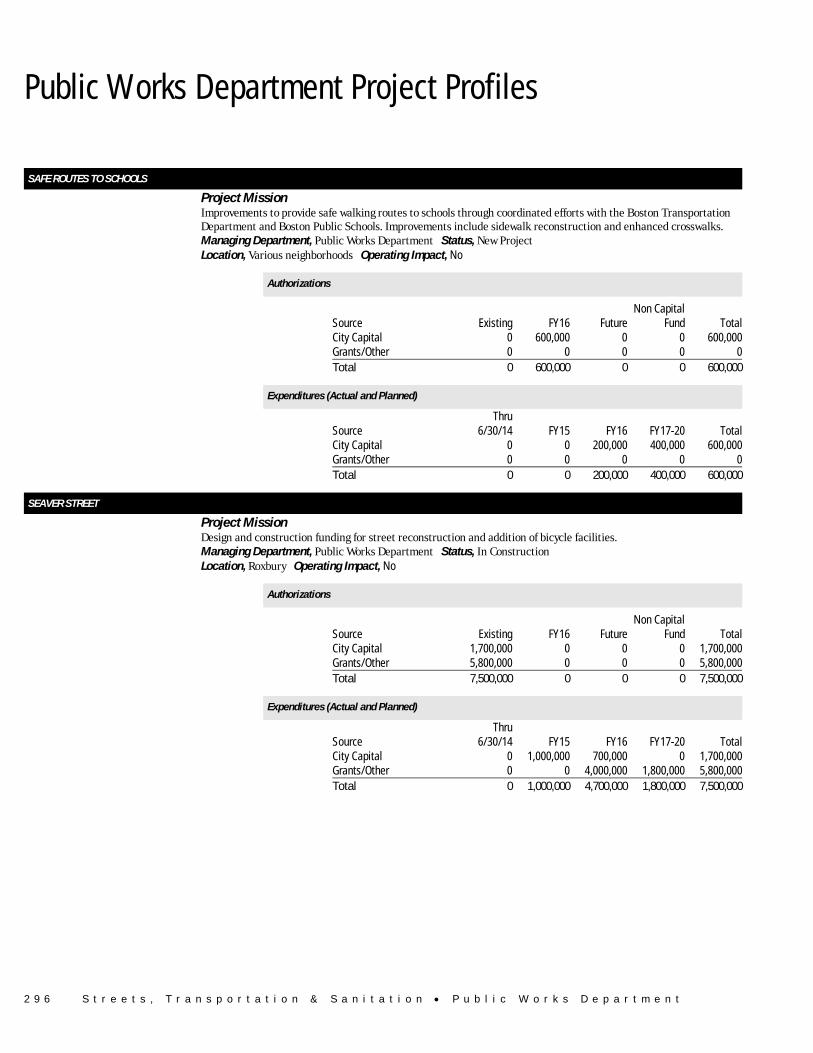
SAFE ROUTES TO SCHOOLS Project Mission Improvements to provide safe walking routes to schools through coordinated efforts with the Boston Transportation
Department and Boston Public Schools. Improvements include sidewalk reconstruction and enhanced crosswalks. Managing Department, Public Works Department Status, New Project Location, Various neighborhoods Operating Impact, No
Authorizations
Source Existing FY16 FutureNon Capital
Fund Total City Capital 0 600,000 0 0 600,000 Grants/Other 0 0 0 0 0 Total 0 600,000 0 0 600,000
Expenditures (Actual and Planned)
Source Thru
6/30/14 FY15 FY16 FY17-20 Total City Capital 0 0 200,000 400,000 600,000 Grants/Other 0 0 0 0 0 Total 0 0 200,000 400,000 600,000
SEAVER STREET Project Mission Design and construction funding for street reconstruction and addition of bicycle facilities. Managing Department, Public Works Department Status, In Construction Location, Roxbury Operating Impact, No
Authorizations
Source Existing FY16 FutureNon Capital
Fund Total City Capital 1,700,000 0 0 0 1,700,000 Grants/Other 5,800,000 0 0 0 5,800,000 Total 7,500,000 0 0 0 7,500,000
Expenditures (Actual and Planned)
Source Thru
6/30/14 FY15 FY16 FY17-20 Total City Capital 0 1,000,000 700,000 0 1,700,000 Grants/Other 0 0 4,000,000 1,800,000 5,800,000 Total 0 1,000,000 4,700,000 1,800,000 7,500,000

S t r e e t s , T r a n s p o r t a t i o n & S a n i t a t i o n • P u b l i c W o r k s D e p a r t m e n t 2 9 7
Public Works Department Project Profiles
SIDEWALK RECONSTRUCTION Project Mission Various sidewalk and pedestrian ramp repairs and reconstruction. Managing Department, Public Works Department Status, Annual Program Location, Citywide Operating Impact, No
Authorizations
Source Existing FY16 FutureNon Capital
Fund Total City Capital 0 0 0 0 0 Grants/Other 30,561,327 4,500,000 7,500,000 0 42,561,327 Total 30,561,327 4,500,000 7,500,000 0 42,561,327
Expenditures (Actual and Planned)
Source Thru
6/30/14 FY15 FY16 FY17-20 Total City Capital 0 0 0 0 0 Grants/Other 24,996,261 4,500,000 4,500,000 8,565,066 42,561,327 Total 24,996,261 4,500,000 4,500,000 8,565,066 42,561,327
STREET LIGHT GAS LAMPS Project Mission Using subsidies from National Grid, this program is designed to retrofit solar powered timers to activate gas lamp
street lights. Managing Department, Public Works Department Status, In Construction Location, Various neighborhoods Operating Impact, Yes
Authorizations
Source Existing FY16 FutureNon Capital
Fund Total City Capital 800,000 0 0 0 800,000 Grants/Other 0 200,000 0 0 200,000 Total 800,000 200,000 0 0 1,000,000
Expenditures (Actual and Planned)
Source Thru
6/30/14 FY15 FY16 FY17-20 Total City Capital 0 500,000 300,000 0 800,000 Grants/Other 0 0 200,000 0 200,000 Total 0 500,000 500,000 0 1,000,000
2 9 8 S t r e e t s , T r a n s p o r t a t i o n & S a n i t a t i o n • P u b l i c W o r k s D e p a r t m e n t
Public Works Department Project Profiles
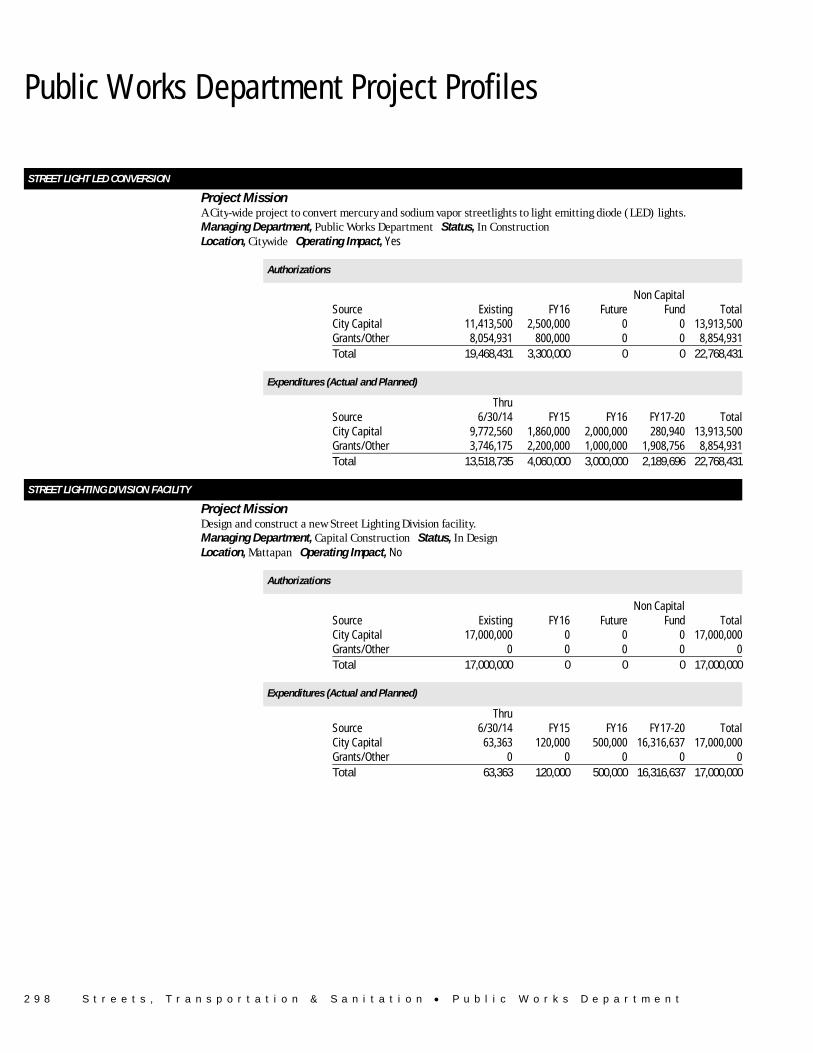
STREET LIGHT LED CONVERSION Project Mission A City-wide project to convert mercury and sodium vapor streetlights to light emitting diode (LED) lights. Managing Department, Public Works Department Status, In Construction Location, Citywide Operating Impact, Yes
Authorizations
Source Existing FY16 FutureNon Capital
Fund Total City Capital 11,413,500 2,500,000 0 0 13,913,500 Grants/Other 8,054,931 800,000 0 0 8,854,931 Total 19,468,431 3,300,000 0 0 22,768,431
Expenditures (Actual and Planned)
Source Thru
6/30/14 FY15 FY16 FY17-20 Total City Capital 9,772,560 1,860,000 2,000,000 280,940 13,913,500 Grants/Other 3,746,175 2,200,000 1,000,000 1,908,756 8,854,931 Total 13,518,735 4,060,000 3,000,000 2,189,696 22,768,431
STREET LIGHTING DIVISION FACILITY Project Mission Design and construct a new Street Lighting Division facility. Managing Department, Capital Construction Status, In Design Location, Mattapan Operating Impact, No
Authorizations
Source Existing FY16 FutureNon Capital
Fund Total City Capital 17,000,000 0 0 0 17,000,000 Grants/Other 0 0 0 0 0 Total 17,000,000 0 0 0 17,000,000
Expenditures (Actual and Planned)
Source Thru
6/30/14 FY15 FY16 FY17-20 Total City Capital 63,363 120,000 500,000 16,316,637 17,000,000 Grants/Other 0 0 0 0 0 Total 63,363 120,000 500,000 16,316,637 17,000,000
S t r e e t s , T r a n s p o r t a t i o n & S a n i t a t i o n • P u b l i c W o r k s D e p a r t m e n t 2 9 9
Public Works Department Project Profiles
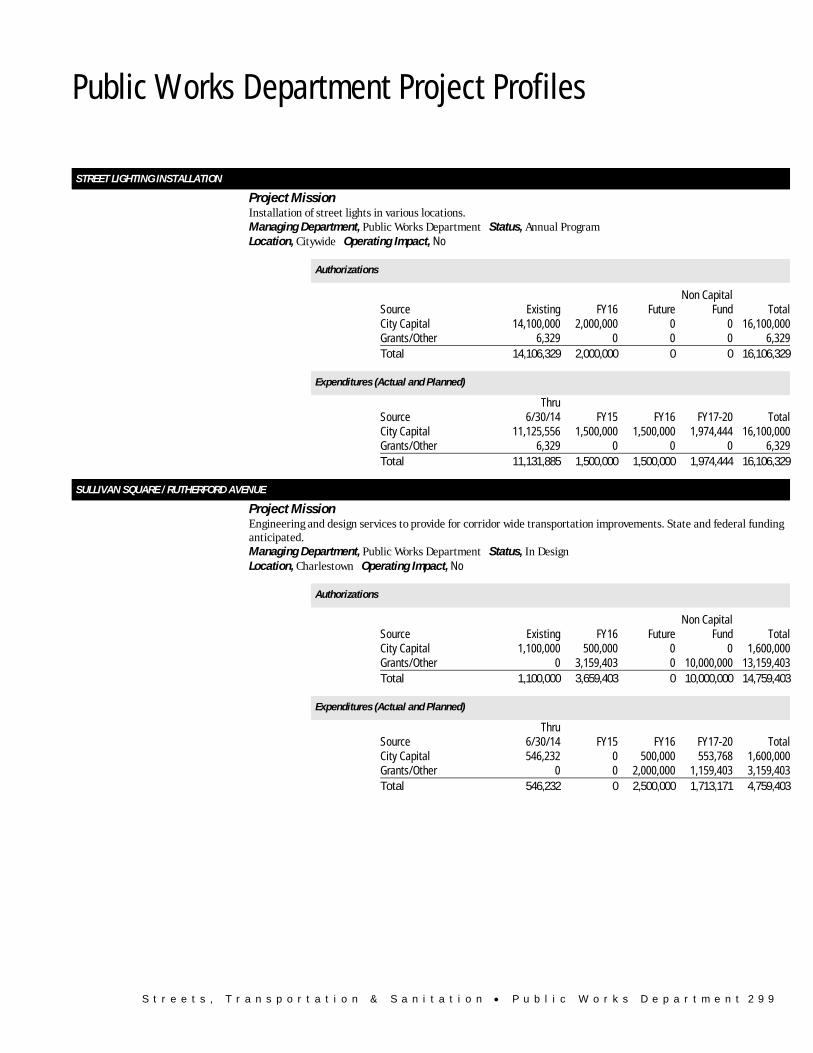
STREET LIGHTING INSTALLATION Project Mission Installation of street lights in various locations. Managing Department, Public Works Department Status, Annual Program Location, Citywide Operating Impact, No
Authorizations
Source Existing FY16 FutureNon Capital
Fund Total City Capital 14,100,000 2,000,000 0 0 16,100,000 Grants/Other 6,329 0 0 0 6,329 Total 14,106,329 2,000,000 0 0 16,106,329
Expenditures (Actual and Planned)
Source Thru
6/30/14 FY15 FY16 FY17-20 Total City Capital 11,125,556 1,500,000 1,500,000 1,974,444 16,100,000 Grants/Other 6,329 0 0 0 6,329 Total 11,131,885 1,500,000 1,500,000 1,974,444 16,106,329
SULLIVAN SQUARE / RUTHERFORD AVENUE Project Mission Engineering and design services to provide for corridor wide transportation improvements. State and federal funding
anticipated. Managing Department, Public Works Department Status, In Design Location, Charlestown Operating Impact, No
Authorizations
Source Existing FY16 FutureNon Capital
Fund Total City Capital 1,100,000 500,000 0 0 1,600,000 Grants/Other 0 3,159,403 0 10,000,000 13,159,403 Total 1,100,000 3,659,403 0 10,000,000 14,759,403
Expenditures (Actual and Planned)
Source Thru
6/30/14 FY15 FY16 FY17-20 Total City Capital 546,232 0 500,000 553,768 1,600,000 Grants/Other 0 0 2,000,000 1,159,403 3,159,403 Total 546,232 0 2,500,000 1,713,171 4,759,403
3 0 0 S t r e e t s , T r a n s p o r t a t i o n & S a n i t a t i o n • P u b l i c W o r k s D e p a r t m e n t
Public Works Department Project Profiles
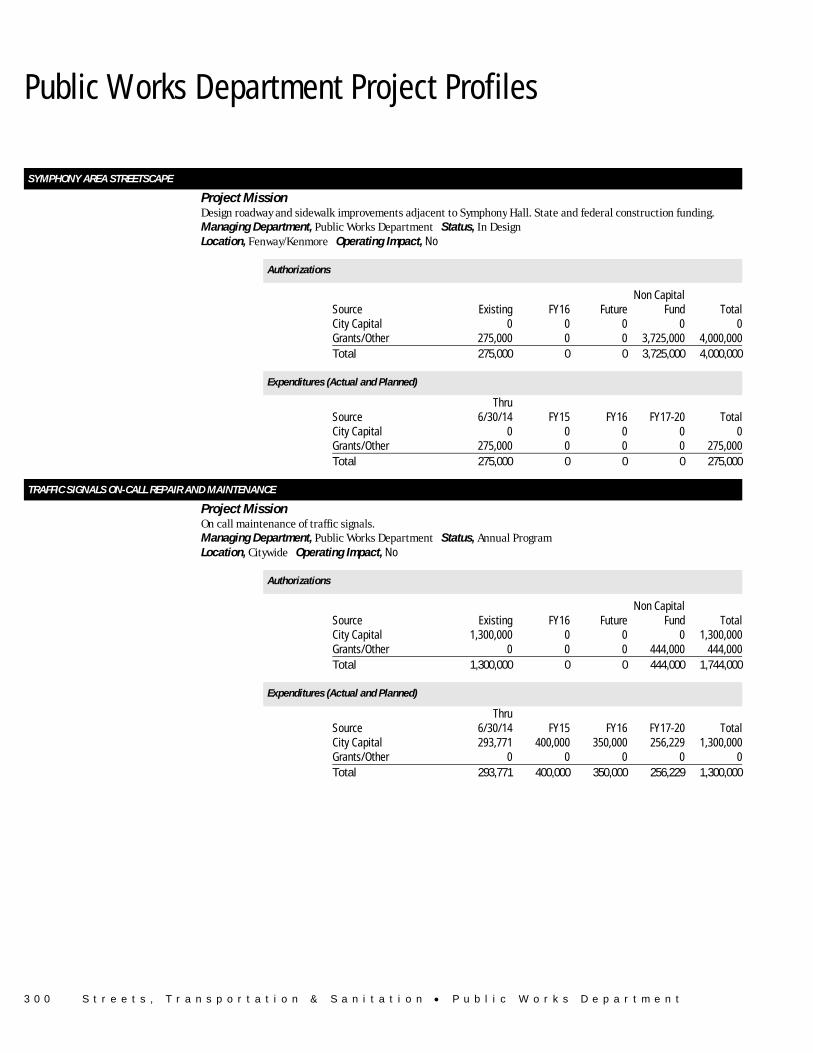
SYMPHONY AREA STREETSCAPE Project Mission Design roadway and sidewalk improvements adjacent to Symphony Hall. State and federal construction funding. Managing Department, Public Works Department Status, In Design Location, Fenway/Kenmore Operating Impact, No
Authorizations
Source Existing FY16 FutureNon Capital
Fund Total City Capital 0 0 0 0 0 Grants/Other 275,000 0 0 3,725,000 4,000,000 Total 275,000 0 0 3,725,000 4,000,000
Expenditures (Actual and Planned)
Source Thru
6/30/14 FY15 FY16 FY17-20 Total City Capital 0 0 0 0 0 Grants/Other 275,000 0 0 0 275,000 Total 275,000 0 0 0 275,000
TRAFFIC SIGNALS ON-CALL REPAIR AND MAINTENANCE Project Mission On call maintenance of traffic signals. Managing Department, Public Works Department Status, Annual Program Location, Citywide Operating Impact, No
Authorizations
Source Existing FY16 FutureNon Capital
Fund Total City Capital 1,300,000 0 0 0 1,300,000 Grants/Other 0 0 0 444,000 444,000 Total 1,300,000 0 0 444,000 1,744,000
Expenditures (Actual and Planned)
Source Thru
6/30/14 FY15 FY16 FY17-20 Total City Capital 293,771 400,000 350,000 256,229 1,300,000 Grants/Other 0 0 0 0 0 Total 293,771 400,000 350,000 256,229 1,300,000
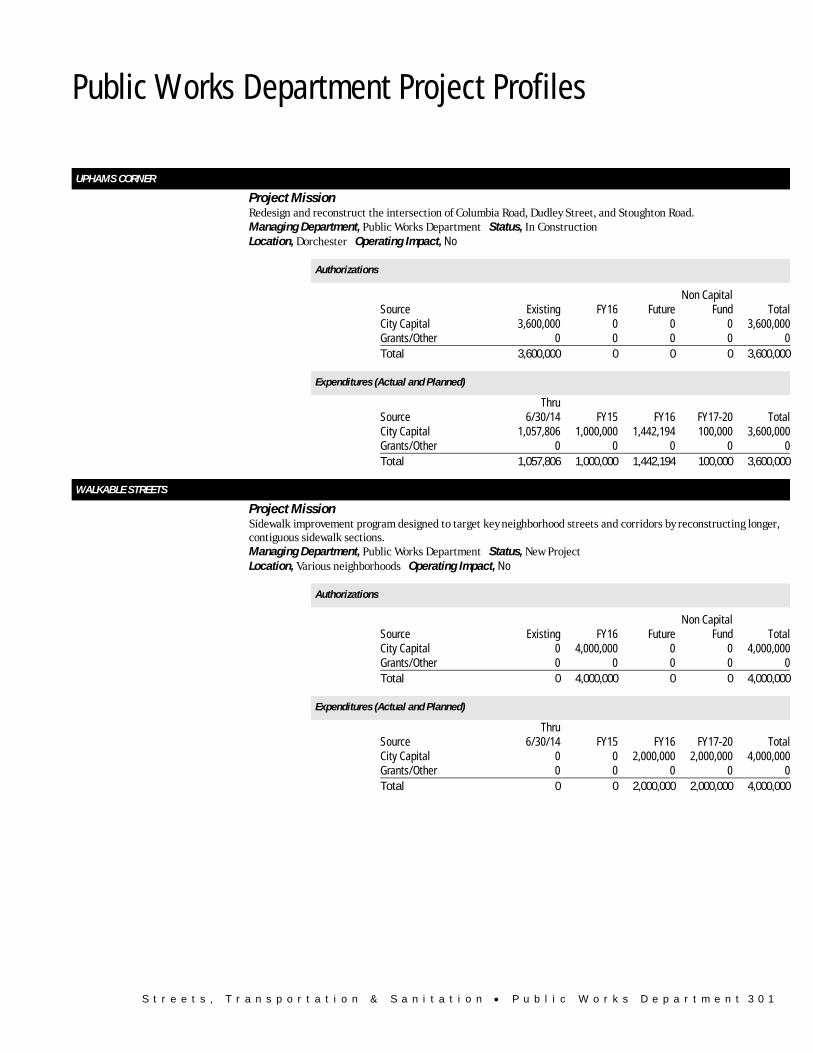
S t r e e t s , T r a n s p o r t a t i o n & S a n i t a t i o n • P u b l i c W o r k s D e p a r t m e n t 3 0 1
Public Works Department Project Profiles
UPHAMS CORNER Project Mission Redesign and reconstruct the intersection of Columbia Road, Dudley Street, and Stoughton Road. Managing Department, Public Works Department Status, In Construction Location, Dorchester Operating Impact, No
Authorizations
Source Existing FY16 FutureNon Capital
Fund Total City Capital 3,600,000 0 0 0 3,600,000 Grants/Other 0 0 0 0 0 Total 3,600,000 0 0 0 3,600,000
Expenditures (Actual and Planned)
Source Thru
6/30/14 FY15 FY16 FY17-20 Total City Capital 1,057,806 1,000,000 1,442,194 100,000 3,600,000 Grants/Other 0 0 0 0 0 Total 1,057,806 1,000,000 1,442,194 100,000 3,600,000
WALKABLE STREETS Project Mission Sidewalk improvement program designed to target key neighborhood streets and corridors by reconstructing longer,
contiguous sidewalk sections. Managing Department, Public Works Department Status, New Project Location, Various neighborhoods Operating Impact, No
Authorizations
Source Existing FY16 FutureNon Capital
Fund Total City Capital 0 4,000,000 0 0 4,000,000 Grants/Other 0 0 0 0 0 Total 0 4,000,000 0 0 4,000,000
Expenditures (Actual and Planned)
Source Thru
6/30/14 FY15 FY16 FY17-20 Total City Capital 0 0 2,000,000 2,000,000 4,000,000 Grants/Other 0 0 0 0 0 Total 0 0 2,000,000 2,000,000 4,000,000
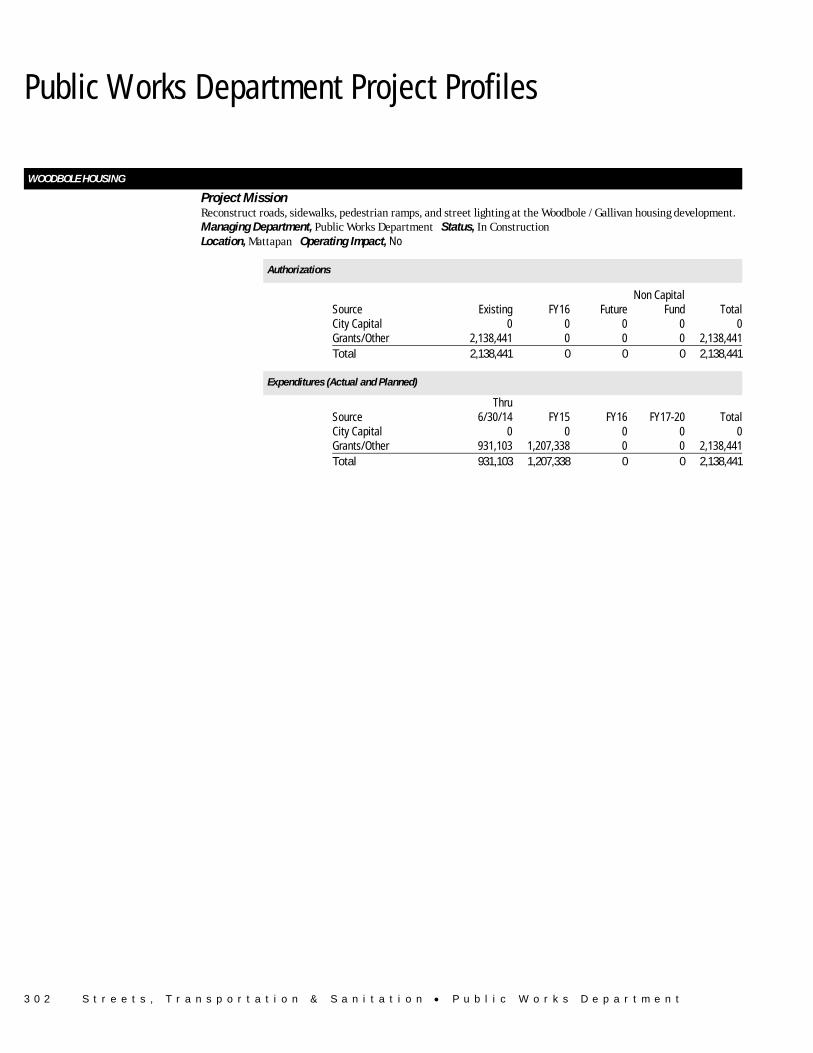
3 0 2 S t r e e t s , T r a n s p o r t a t i o n & S a n i t a t i o n • P u b l i c W o r k s D e p a r t m e n t
Public Works Department Project Profiles
WOODBOLE HOUSING Project Mission Reconstruct roads, sidewalks, pedestrian ramps, and street lighting at the Woodbole / Gallivan housing development. Managing Department, Public Works Department Status, In Construction Location, Mattapan Operating Impact, No
Authorizations
Source Existing FY16 FutureNon Capital
Fund Total City Capital 0 0 0 0 0 Grants/Other 2,138,441 0 0 0 2,138,441 Total 2,138,441 0 0 0 2,138,441
Expenditures (Actual and Planned)
Source Thru
6/30/14 FY15 FY16 FY17-20 Total City Capital 0 0 0 0 0 Grants/Other 931,103 1,207,338 0 0 2,138,441 Total 931,103 1,207,338 0 0 2,138,441
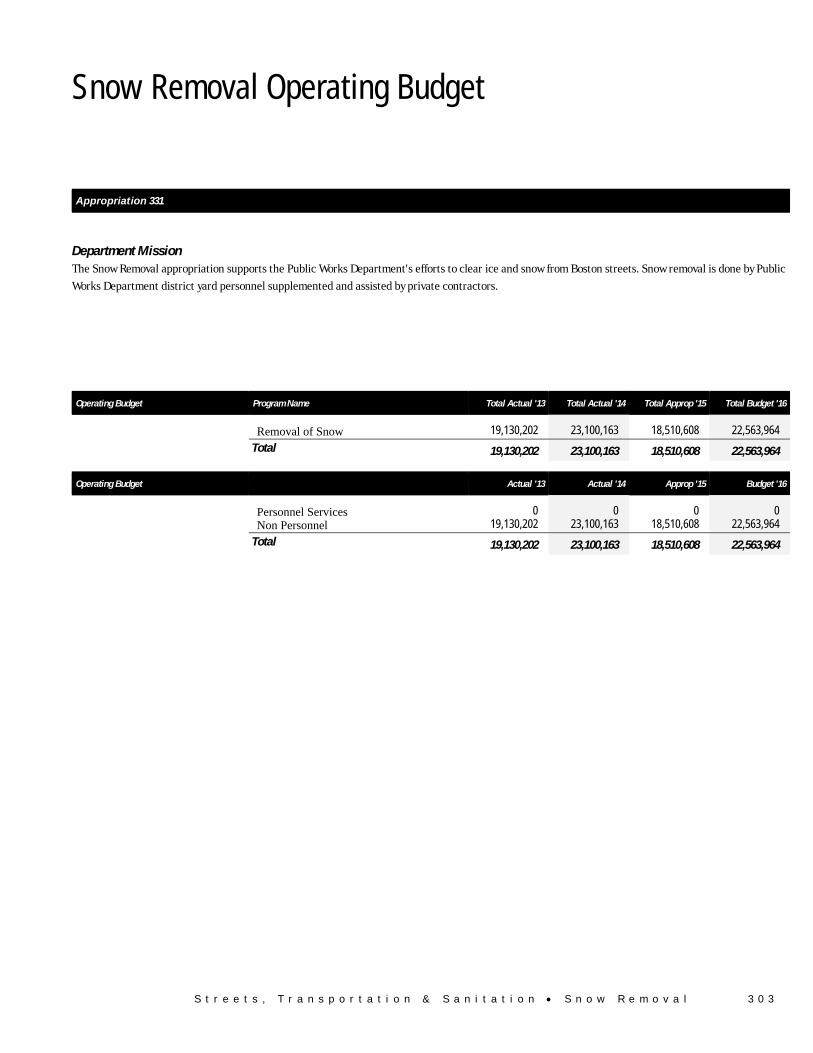
S t r e e t s , T r a n s p o r t a t i o n & S a n i t a t i o n • S n o w R e m o v a l 3 0 3
Snow Removal Operating Budget
Streets, Transportation & Sanitation Snow Removal
Appropriation 331
Department Mission The Snow Removal appropriation supports the Public Works Department's efforts to clear ice and snow from Boston streets. Snow removal is done by Public
Works Department district yard personnel supplemented and assisted by private contractors.
Operating Budget Program Name Total Actual '13 Total Actual '14 Total Approp '15 Total Budget '16
Removal of Snow 19,130,202 23,100,163 18,510,608 22,563,964
Total 19,130,202 23,100,163 18,510,608 22,563,964
Operating Budget Actual '13 Actual '14 Approp '15 Budget '16
Personnel Services 0 0 0 0 Non Personnel 19,130,202 23,100,163 18,510,608 22,563,964
Total 19,130,202 23,100,163 18,510,608 22,563,964
3 0 4 S t r e e t s , T r a n s p o r t a t i o n & S a n i t a t i o n • S n o w R e m o v a l
Snow Removal Operating Budget
Authorizing Statutes • Vehicles Interfering with the Removal of Snow,
CBC Ord. § 11-6.43.
Description of Services The appropriation provides for the purchase of salt
and sand, plowing and hauling of snow by
contractors, purchase and repair of snow removal
equipment, and financing for regular City personnel
engaged in snow removal operations after normal
working hours.
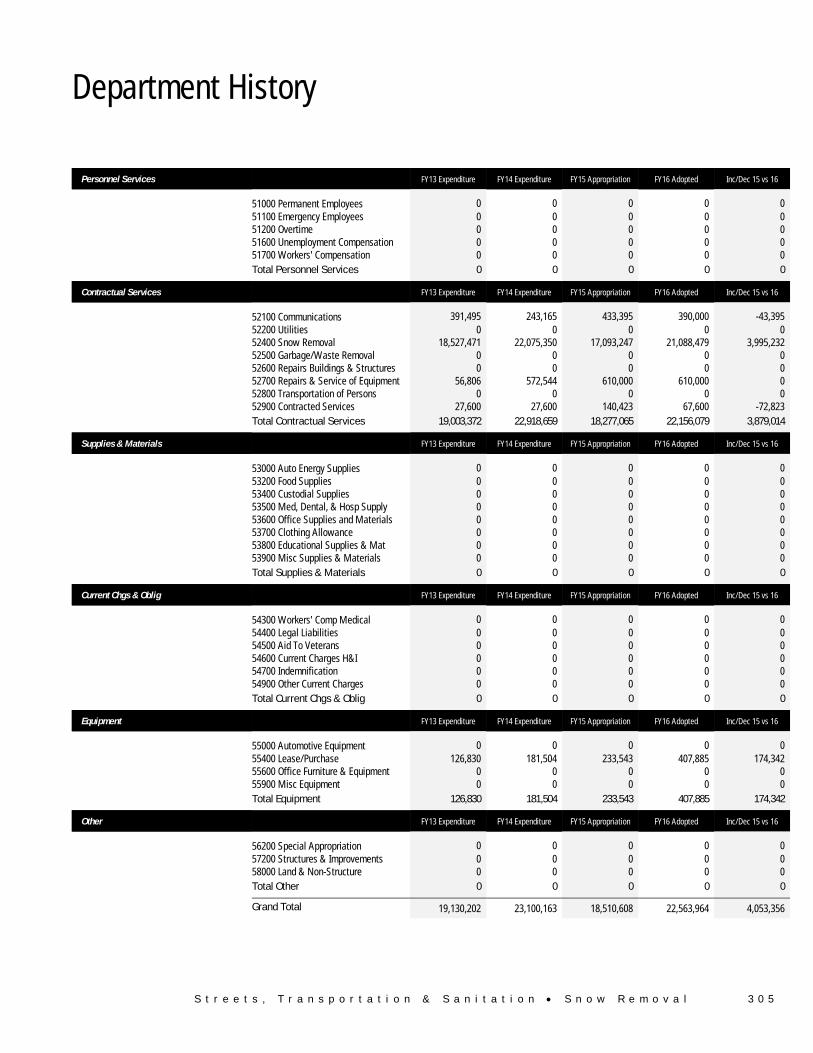
S t r e e t s , T r a n s p o r t a t i o n & S a n i t a t i o n • S n o w R e m o v a l 3 0 5
Department History
Personnel Services FY13 Expenditure FY14 Expenditure FY15 Appropriation FY16 Adopted Inc/Dec 15 vs 16
51000 Permanent Employees 0 0 0 0 0 51100 Emergency Employees 0 0 0 0 0 51200 Overtime 0 0 0 0 0 51600 Unemployment Compensation 0 0 0 0 0 51700 Workers' Compensation 0 0 0 0 0 Total Personnel Services 0 0 0 0 0
Contractual Services FY13 Expenditure FY14 Expenditure FY15 Appropriation FY16 Adopted Inc/Dec 15 vs 16
52100 Communications 391,495 243,165 433,395 390,000 -43,395 52200 Utilities 0 0 0 0 0 52400 Snow Removal 18,527,471 22,075,350 17,093,247 21,088,479 3,995,232 52500 Garbage/Waste Removal 0 0 0 0 0 52600 Repairs Buildings & Structures 0 0 0 0 0 52700 Repairs & Service of Equipment 56,806 572,544 610,000 610,000 0 52800 Transportation of Persons 0 0 0 0 0 52900 Contracted Services 27,600 27,600 140,423 67,600 -72,823 Total Contractual Services 19,003,372 22,918,659 18,277,065 22,156,079 3,879,014
Supplies & Materials FY13 Expenditure FY14 Expenditure FY15 Appropriation FY16 Adopted Inc/Dec 15 vs 16
53000 Auto Energy Supplies 0 0 0 0 0 53200 Food Supplies 0 0 0 0 0 53400 Custodial Supplies 0 0 0 0 0 53500 Med, Dental, & Hosp Supply 0 0 0 0 0 53600 Office Supplies and Materials 0 0 0 0 0 53700 Clothing Allowance 0 0 0 0 0 53800 Educational Supplies & Mat 0 0 0 0 0 53900 Misc Supplies & Materials 0 0 0 0 0 Total Supplies & Materials 0 0 0 0 0
Current Chgs & Oblig FY13 Expenditure FY14 Expenditure FY15 Appropriation FY16 Adopted Inc/Dec 15 vs 16
54300 Workers' Comp Medical 0 0 0 0 0 54400 Legal Liabilities 0 0 0 0 0 54500 Aid To Veterans 0 0 0 0 0 54600 Current Charges H&I 0 0 0 0 0 54700 Indemnification 0 0 0 0 0 54900 Other Current Charges 0 0 0 0 0 Total Current Chgs & Oblig 0 0 0 0 0
Equipment FY13 Expenditure FY14 Expenditure FY15 Appropriation FY16 Adopted Inc/Dec 15 vs 16
55000 Automotive Equipment 0 0 0 0 0 55400 Lease/Purchase 126,830 181,504 233,543 407,885 174,342 55600 Office Furniture & Equipment 0 0 0 0 0 55900 Misc Equipment 0 0 0 0 0 Total Equipment 126,830 181,504 233,543 407,885 174,342
Other FY13 Expenditure FY14 Expenditure FY15 Appropriation FY16 Adopted Inc/Dec 15 vs 16
56200 Special Appropriation 0 0 0 0 0 57200 Structures & Improvements 0 0 0 0 0 58000 Land & Non-Structure 0 0 0 0 0 Total Other 0 0 0 0 0
Grand Total 19,130,202 23,100,163 18,510,608 22,563,964 4,053,356

3 0 6 S t r e e t s , T r a n s p o r t a t i o n & S a n i t a t i o n • S n o w R e m o v a l
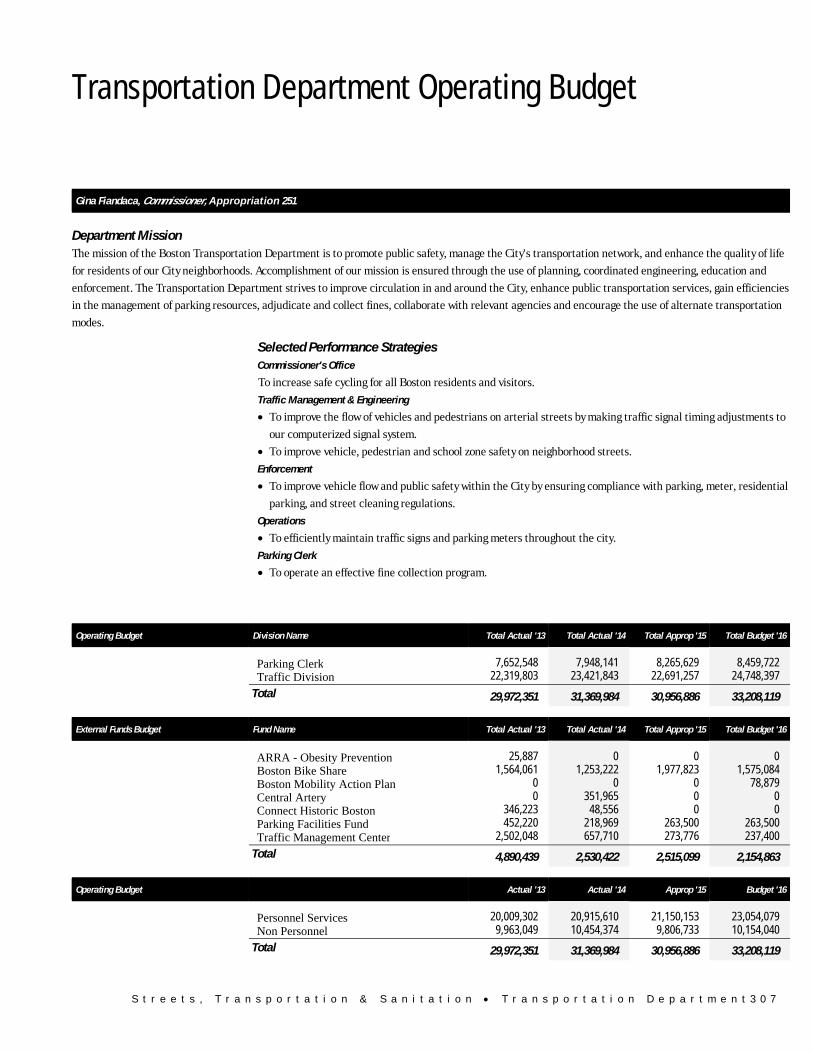
S t r e e t s , T r a n s p o r t a t i o n & S a n i t a t i o n • T r a n s p o r t a t i o n D e p a r t m e n t 3 0 7
Transportation Department Operating Budget
Streets, Transportation & Sanitation Transportation Department
Gina Fiandaca, Commissioner, Appropriation 251
Department Mission The mission of the Boston Transportation Department is to promote public safety, manage the City's transportation network, and enhance the quality of life
for residents of our City neighborhoods. Accomplishment of our mission is ensured through the use of planning, coordinated engineering, education and
enforcement. The Transportation Department strives to improve circulation in and around the City, enhance public transportation services, gain efficiencies
in the management of parking resources, adjudicate and collect fines, collaborate with relevant agencies and encourage the use of alternate transportation
modes.
Selected Performance Strategies Commissioner's Office
To increase safe cycling for all Boston residents and visitors.
Traffic Management & Engineering
• To improve the flow of vehicles and pedestrians on arterial streets by making traffic signal timing adjustments to
our computerized signal system.
• To improve vehicle, pedestrian and school zone safety on neighborhood streets.
Enforcement
• To improve vehicle flow and public safety within the City by ensuring compliance with parking, meter, residential
parking, and street cleaning regulations.
Operations
• To efficiently maintain traffic signs and parking meters throughout the city.
Parking Clerk
• To operate an effective fine collection program.
Operating Budget Division Name Total Actual '13 Total Actual '14 Total Approp '15 Total Budget '16
Parking Clerk 7,652,548 7,948,141 8,265,629 8,459,722Traffic Division 22,319,803 23,421,843 22,691,257 24,748,397
Total 29,972,351 31,369,984 30,956,886 33,208,119
External Funds Budget Fund Name Total Actual '13 Total Actual '14 Total Approp '15 Total Budget '16
ARRA - Obesity Prevention 25,887 0 0 0Boston Bike Share 1,564,061 1,253,222 1,977,823 1,575,084Boston Mobility Action Plan 0 0 0 78,879Central Artery 0 351,965 0 0Connect Historic Boston 346,223 48,556 0 0Parking Facilities Fund 452,220 218,969 263,500 263,500Traffic Management Center 2,502,048 657,710 273,776 237,400
Total 4,890,439 2,530,422 2,515,099 2,154,863
Operating Budget Actual '13 Actual '14 Approp '15 Budget '16
Personnel Services 20,009,302 20,915,610 21,150,153 23,054,079 Non Personnel 9,963,049 10,454,374 9,806,733 10,154,040
Total 29,972,351 31,369,984 30,956,886 33,208,119
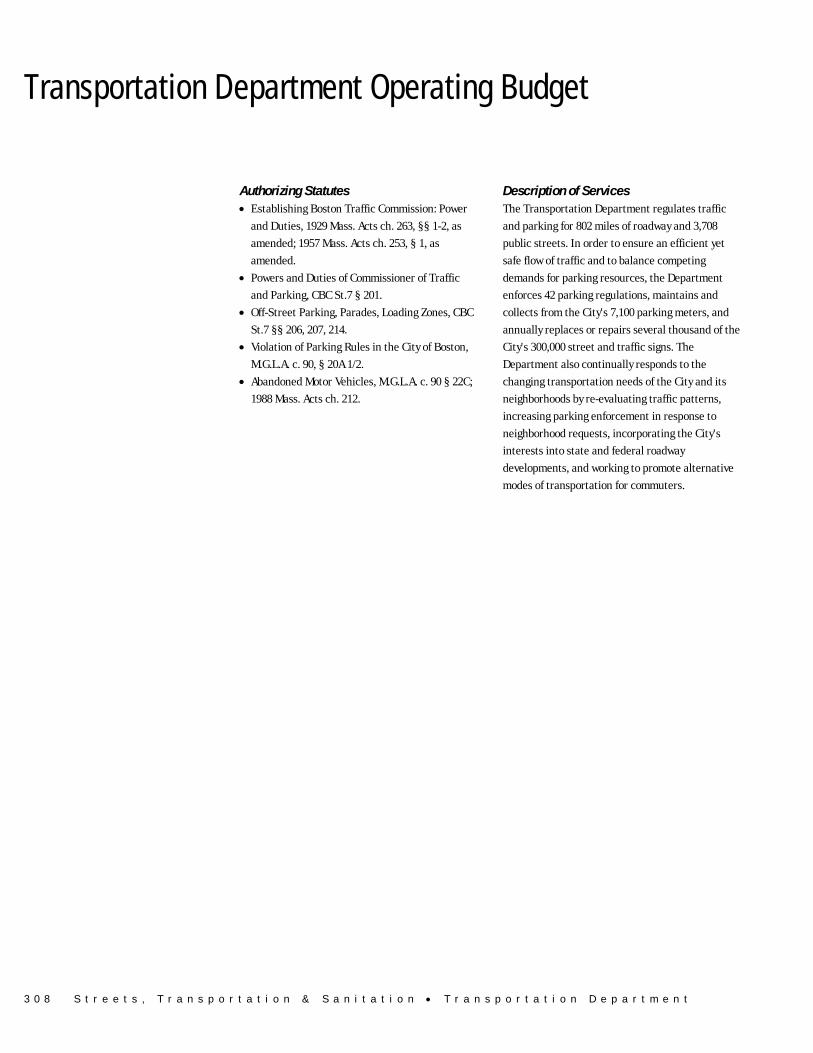
3 0 8 S t r e e t s , T r a n s p o r t a t i o n & S a n i t a t i o n • T r a n s p o r t a t i o n D e p a r t m e n t
Transportation Department Operating Budget
Authorizing Statutes • Establishing Boston Traffic Commission: Power
and Duties, 1929 Mass. Acts ch. 263, §§ 1-2, as
amended; 1957 Mass. Acts ch. 253, § 1, as
amended.
• Powers and Duties of Commissioner of Traffic
and Parking, CBC St.7 § 201.
• Off-Street Parking, Parades, Loading Zones, CBC
St.7 §§ 206, 207, 214.
• Violation of Parking Rules in the City of Boston,
M.G.L.A. c. 90, § 20A 1/2.
• Abandoned Motor Vehicles, M.G.L.A. c. 90 § 22C;
1988 Mass. Acts ch. 212.
Description of Services The Transportation Department regulates traffic
and parking for 802 miles of roadway and 3,708
public streets. In order to ensure an efficient yet
safe flow of traffic and to balance competing
demands for parking resources, the Department
enforces 42 parking regulations, maintains and
collects from the City's 7,100 parking meters, and
annually replaces or repairs several thousand of the
City's 300,000 street and traffic signs. The
Department also continually responds to the
changing transportation needs of the City and its
neighborhoods by re-evaluating traffic patterns,
increasing parking enforcement in response to
neighborhood requests, incorporating the City's
interests into state and federal roadway
developments, and working to promote alternative
modes of transportation for commuters.
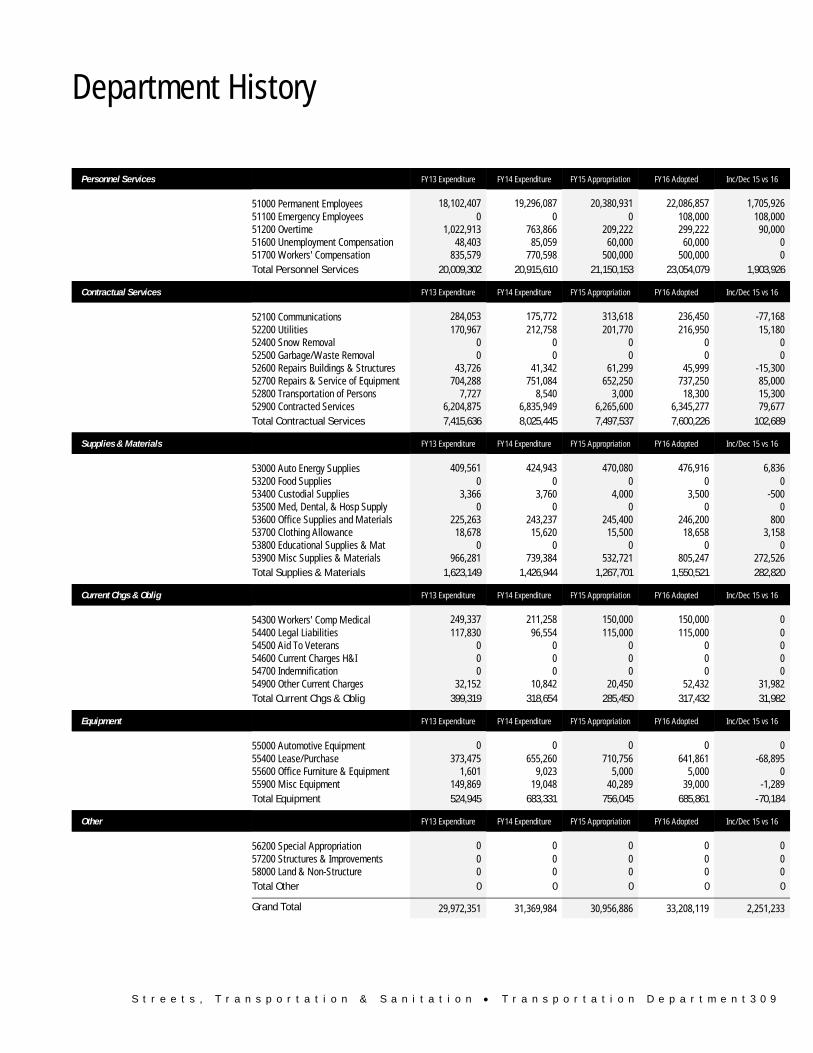
S t r e e t s , T r a n s p o r t a t i o n & S a n i t a t i o n • T r a n s p o r t a t i o n D e p a r t m e n t 3 0 9
Department History
Personnel Services FY13 Expenditure FY14 Expenditure FY15 Appropriation FY16 Adopted Inc/Dec 15 vs 16
51000 Permanent Employees 18,102,407 19,296,087 20,380,931 22,086,857 1,705,926 51100 Emergency Employees 0 0 0 108,000 108,000 51200 Overtime 1,022,913 763,866 209,222 299,222 90,000 51600 Unemployment Compensation 48,403 85,059 60,000 60,000 0 51700 Workers' Compensation 835,579 770,598 500,000 500,000 0 Total Personnel Services 20,009,302 20,915,610 21,150,153 23,054,079 1,903,926
Contractual Services FY13 Expenditure FY14 Expenditure FY15 Appropriation FY16 Adopted Inc/Dec 15 vs 16
52100 Communications 284,053 175,772 313,618 236,450 -77,168 52200 Utilities 170,967 212,758 201,770 216,950 15,180 52400 Snow Removal 0 0 0 0 0 52500 Garbage/Waste Removal 0 0 0 0 0 52600 Repairs Buildings & Structures 43,726 41,342 61,299 45,999 -15,300 52700 Repairs & Service of Equipment 704,288 751,084 652,250 737,250 85,000 52800 Transportation of Persons 7,727 8,540 3,000 18,300 15,300 52900 Contracted Services 6,204,875 6,835,949 6,265,600 6,345,277 79,677 Total Contractual Services 7,415,636 8,025,445 7,497,537 7,600,226 102,689
Supplies & Materials FY13 Expenditure FY14 Expenditure FY15 Appropriation FY16 Adopted Inc/Dec 15 vs 16
53000 Auto Energy Supplies 409,561 424,943 470,080 476,916 6,836 53200 Food Supplies 0 0 0 0 0 53400 Custodial Supplies 3,366 3,760 4,000 3,500 -500 53500 Med, Dental, & Hosp Supply 0 0 0 0 0 53600 Office Supplies and Materials 225,263 243,237 245,400 246,200 800 53700 Clothing Allowance 18,678 15,620 15,500 18,658 3,158 53800 Educational Supplies & Mat 0 0 0 0 0 53900 Misc Supplies & Materials 966,281 739,384 532,721 805,247 272,526 Total Supplies & Materials 1,623,149 1,426,944 1,267,701 1,550,521 282,820
Current Chgs & Oblig FY13 Expenditure FY14 Expenditure FY15 Appropriation FY16 Adopted Inc/Dec 15 vs 16
54300 Workers' Comp Medical 249,337 211,258 150,000 150,000 0 54400 Legal Liabilities 117,830 96,554 115,000 115,000 0 54500 Aid To Veterans 0 0 0 0 0 54600 Current Charges H&I 0 0 0 0 0 54700 Indemnification 0 0 0 0 0 54900 Other Current Charges 32,152 10,842 20,450 52,432 31,982 Total Current Chgs & Oblig 399,319 318,654 285,450 317,432 31,982
Equipment FY13 Expenditure FY14 Expenditure FY15 Appropriation FY16 Adopted Inc/Dec 15 vs 16
55000 Automotive Equipment 0 0 0 0 0 55400 Lease/Purchase 373,475 655,260 710,756 641,861 -68,895 55600 Office Furniture & Equipment 1,601 9,023 5,000 5,000 0 55900 Misc Equipment 149,869 19,048 40,289 39,000 -1,289 Total Equipment 524,945 683,331 756,045 685,861 -70,184
Other FY13 Expenditure FY14 Expenditure FY15 Appropriation FY16 Adopted Inc/Dec 15 vs 16
56200 Special Appropriation 0 0 0 0 0 57200 Structures & Improvements 0 0 0 0 0 58000 Land & Non-Structure 0 0 0 0 0 Total Other 0 0 0 0 0
Grand Total 29,972,351 31,369,984 30,956,886 33,208,119 2,251,233
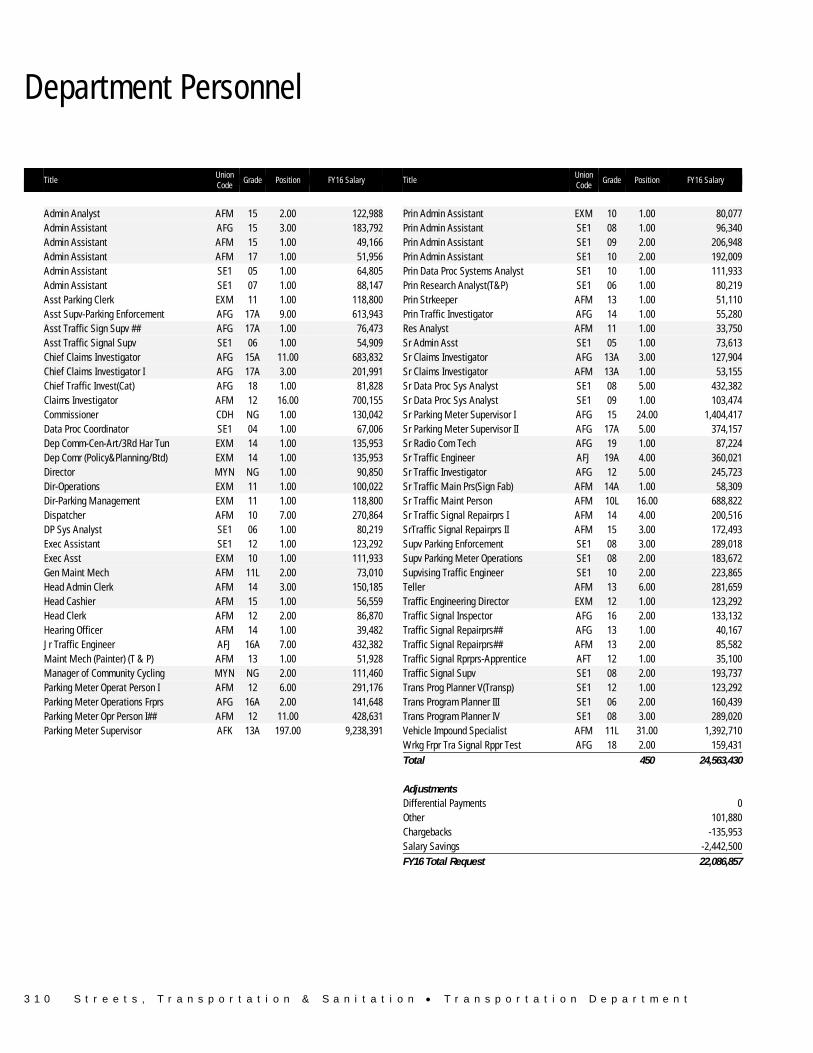
3 1 0 S t r e e t s , T r a n s p o r t a t i o n & S a n i t a t i o n • T r a n s p o r t a t i o n D e p a r t m e n t
Department Personnel
Title Union Code
Grade Position FY16 Salary Title Union Code
Grade Position FY16 Salary
Admin Analyst AFM 15 2.00 122,988 Prin Admin Assistant EXM 10 1.00 80,077 Admin Assistant AFG 15 3.00 183,792 Prin Admin Assistant SE1 08 1.00 96,340 Admin Assistant AFM 15 1.00 49,166 Prin Admin Assistant SE1 09 2.00 206,948 Admin Assistant AFM 17 1.00 51,956 Prin Admin Assistant SE1 10 2.00 192,009 Admin Assistant SE1 05 1.00 64,805 Prin Data Proc Systems Analyst SE1 10 1.00 111,933 Admin Assistant SE1 07 1.00 88,147 Prin Research Analyst(T&P) SE1 06 1.00 80,219 Asst Parking Clerk EXM 11 1.00 118,800 Prin Strkeeper AFM 13 1.00 51,110 Asst Supv-Parking Enforcement AFG 17A 9.00 613,943 Prin Traffic Investigator AFG 14 1.00 55,280 Asst Traffic Sign Supv ## AFG 17A 1.00 76,473 Res Analyst AFM 11 1.00 33,750 Asst Traffic Signal Supv SE1 06 1.00 54,909 Sr Admin Asst SE1 05 1.00 73,613 Chief Claims Investigator AFG 15A 11.00 683,832 Sr Claims Investigator AFG 13A 3.00 127,904 Chief Claims Investigator I AFG 17A 3.00 201,991 Sr Claims Investigator AFM 13A 1.00 53,155 Chief Traffic Invest(Cat) AFG 18 1.00 81,828 Sr Data Proc Sys Analyst SE1 08 5.00 432,382 Claims Investigator AFM 12 16.00 700,155 Sr Data Proc Sys Analyst SE1 09 1.00 103,474 Commissioner CDH NG 1.00 130,042 Sr Parking Meter Supervisor I AFG 15 24.00 1,404,417 Data Proc Coordinator SE1 04 1.00 67,006 Sr Parking Meter Supervisor II AFG 17A 5.00 374,157 Dep Comm-Cen-Art/3Rd Har Tun EXM 14 1.00 135,953 Sr Radio Com Tech AFG 19 1.00 87,224 Dep Comr (Policy&Planning/Btd) EXM 14 1.00 135,953 Sr Traffic Engineer AFJ 19A 4.00 360,021 Director MYN NG 1.00 90,850 Sr Traffic Investigator AFG 12 5.00 245,723 Dir-Operations EXM 11 1.00 100,022 Sr Traffic Main Prs(Sign Fab) AFM 14A 1.00 58,309 Dir-Parking Management EXM 11 1.00 118,800 Sr Traffic Maint Person AFM 10L 16.00 688,822 Dispatcher AFM 10 7.00 270,864 Sr Traffic Signal Repairprs I AFM 14 4.00 200,516 DP Sys Analyst SE1 06 1.00 80,219 SrTraffic Signal Repairprs II AFM 15 3.00 172,493 Exec Assistant SE1 12 1.00 123,292 Supv Parking Enforcement SE1 08 3.00 289,018 Exec Asst EXM 10 1.00 111,933 Supv Parking Meter Operations SE1 08 2.00 183,672 Gen Maint Mech AFM 11L 2.00 73,010 Supvising Traffic Engineer SE1 10 2.00 223,865 Head Admin Clerk AFM 14 3.00 150,185 Teller AFM 13 6.00 281,659 Head Cashier AFM 15 1.00 56,559 Traffic Engineering Director EXM 12 1.00 123,292 Head Clerk AFM 12 2.00 86,870 Traffic Signal Inspector AFG 16 2.00 133,132 Hearing Officer AFM 14 1.00 39,482 Traffic Signal Repairprs## AFG 13 1.00 40,167 Jr Traffic Engineer AFJ 16A 7.00 432,382 Traffic Signal Repairprs## AFM 13 2.00 85,582 Maint Mech (Painter) (T & P) AFM 13 1.00 51,928 Traffic Signal Rprprs-Apprentice AFT 12 1.00 35,100 Manager of Community Cycling MYN NG 2.00 111,460 Traffic Signal Supv SE1 08 2.00 193,737 Parking Meter Operat Person I AFM 12 6.00 291,176 Trans Prog Planner V(Transp) SE1 12 1.00 123,292 Parking Meter Operations Frprs AFG 16A 2.00 141,648 Trans Program Planner III SE1 06 2.00 160,439 Parking Meter Opr Person I## AFM 12 11.00 428,631 Trans Program Planner IV SE1 08 3.00 289,020 Parking Meter Supervisor AFK 13A 197.00 9,238,391 Vehicle Impound Specialist AFM 11L 31.00 1,392,710 Wrkg Frpr Tra Signal Rppr Test AFG 18 2.00 159,431 Total 450 24,563,430 Adjustments Differential Payments 0 Other 101,880 Chargebacks -135,953 Salary Savings -2,442,500 FY16 Total Request 22,086,857
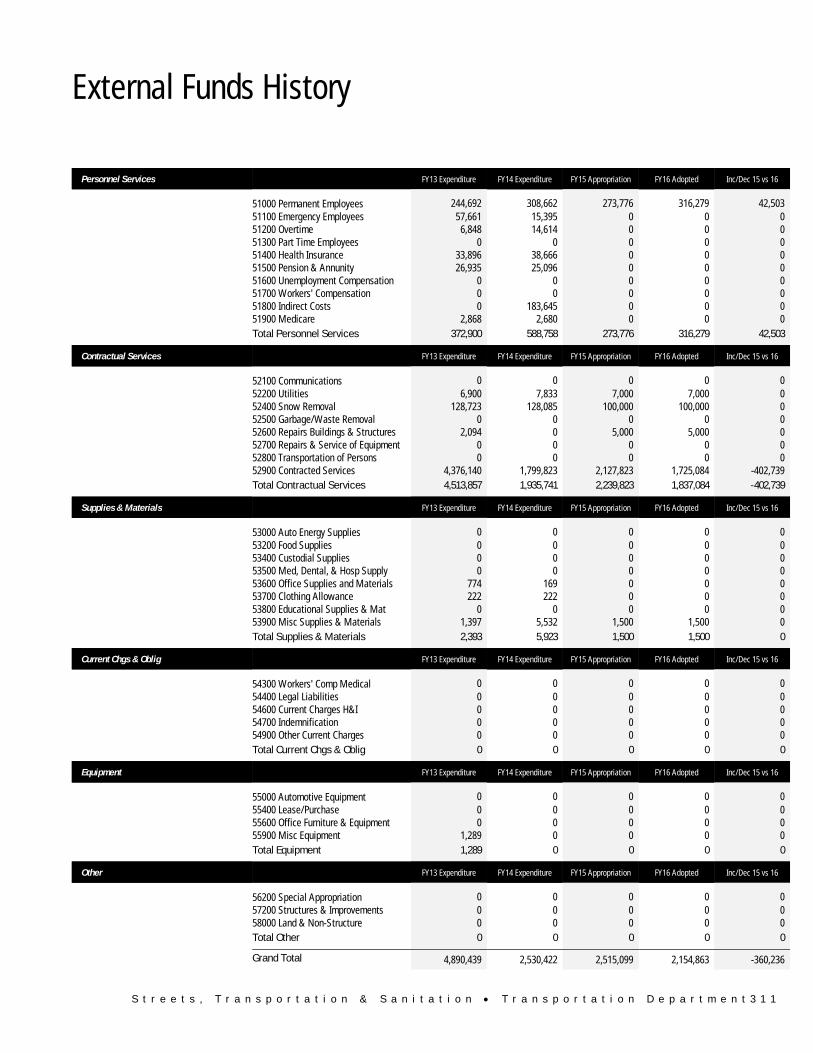
S t r e e t s , T r a n s p o r t a t i o n & S a n i t a t i o n • T r a n s p o r t a t i o n D e p a r t m e n t 3 1 1
External Funds History
Personnel Services FY13 Expenditure FY14 Expenditure FY15 Appropriation FY16 Adopted Inc/Dec 15 vs 16
51000 Permanent Employees 244,692 308,662 273,776 316,279 42,503 51100 Emergency Employees 57,661 15,395 0 0 0 51200 Overtime 6,848 14,614 0 0 0 51300 Part Time Employees 0 0 0 0 0 51400 Health Insurance 33,896 38,666 0 0 0 51500 Pension & Annunity 26,935 25,096 0 0 0 51600 Unemployment Compensation 0 0 0 0 0 51700 Workers' Compensation 0 0 0 0 0 51800 Indirect Costs 0 183,645 0 0 0 51900 Medicare 2,868 2,680 0 0 0 Total Personnel Services 372,900 588,758 273,776 316,279 42,503
Contractual Services FY13 Expenditure FY14 Expenditure FY15 Appropriation FY16 Adopted Inc/Dec 15 vs 16
52100 Communications 0 0 0 0 0 52200 Utilities 6,900 7,833 7,000 7,000 0 52400 Snow Removal 128,723 128,085 100,000 100,000 0 52500 Garbage/Waste Removal 0 0 0 0 0 52600 Repairs Buildings & Structures 2,094 0 5,000 5,000 0 52700 Repairs & Service of Equipment 0 0 0 0 0 52800 Transportation of Persons 0 0 0 0 0 52900 Contracted Services 4,376,140 1,799,823 2,127,823 1,725,084 -402,739 Total Contractual Services 4,513,857 1,935,741 2,239,823 1,837,084 -402,739
Supplies & Materials FY13 Expenditure FY14 Expenditure FY15 Appropriation FY16 Adopted Inc/Dec 15 vs 16
53000 Auto Energy Supplies 0 0 0 0 0 53200 Food Supplies 0 0 0 0 0 53400 Custodial Supplies 0 0 0 0 0 53500 Med, Dental, & Hosp Supply 0 0 0 0 0 53600 Office Supplies and Materials 774 169 0 0 0 53700 Clothing Allowance 222 222 0 0 0 53800 Educational Supplies & Mat 0 0 0 0 0 53900 Misc Supplies & Materials 1,397 5,532 1,500 1,500 0 Total Supplies & Materials 2,393 5,923 1,500 1,500 0
Current Chgs & Oblig FY13 Expenditure FY14 Expenditure FY15 Appropriation FY16 Adopted Inc/Dec 15 vs 16
54300 Workers' Comp Medical 0 0 0 0 0 54400 Legal Liabilities 0 0 0 0 0 54600 Current Charges H&I 0 0 0 0 0 54700 Indemnification 0 0 0 0 0 54900 Other Current Charges 0 0 0 0 0 Total Current Chgs & Oblig 0 0 0 0 0
Equipment FY13 Expenditure FY14 Expenditure FY15 Appropriation FY16 Adopted Inc/Dec 15 vs 16
55000 Automotive Equipment 0 0 0 0 0 55400 Lease/Purchase 0 0 0 0 0 55600 Office Furniture & Equipment 0 0 0 0 0 55900 Misc Equipment 1,289 0 0 0 0 Total Equipment 1,289 0 0 0 0
Other FY13 Expenditure FY14 Expenditure FY15 Appropriation FY16 Adopted Inc/Dec 15 vs 16
56200 Special Appropriation 0 0 0 0 0 57200 Structures & Improvements 0 0 0 0 0 58000 Land & Non-Structure 0 0 0 0 0 Total Other 0 0 0 0 0
Grand Total 4,890,439 2,530,422 2,515,099 2,154,863 -360,236
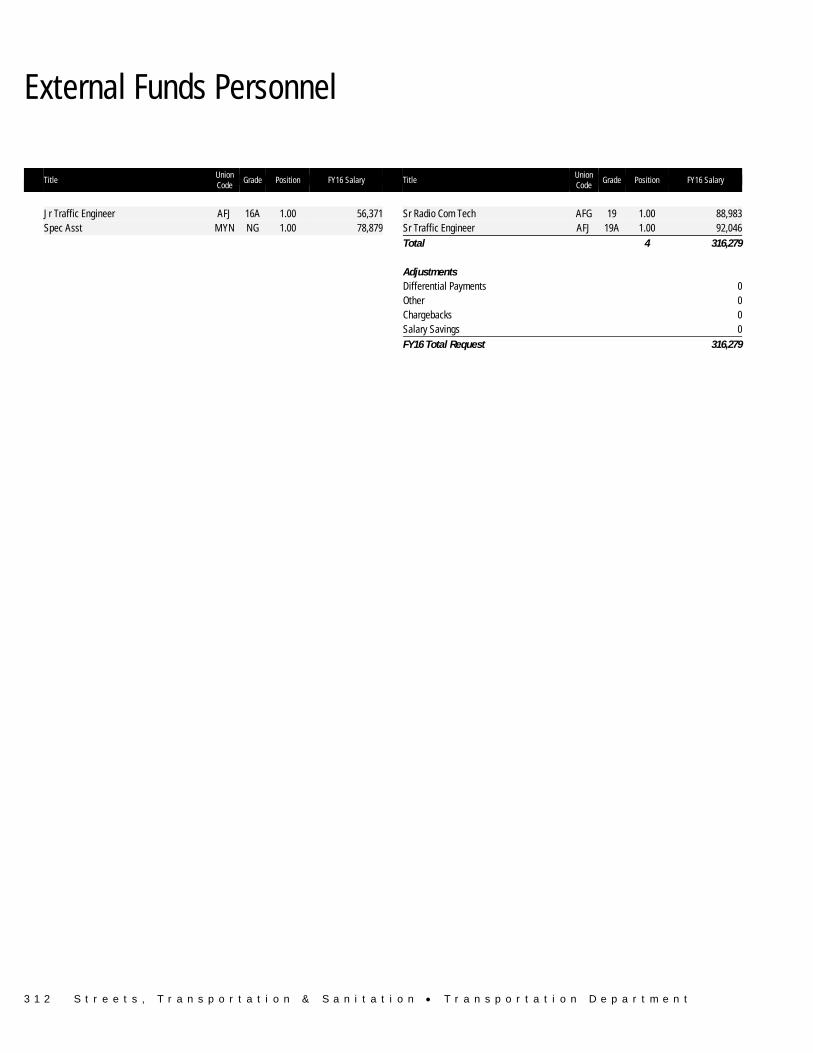
3 1 2 S t r e e t s , T r a n s p o r t a t i o n & S a n i t a t i o n • T r a n s p o r t a t i o n D e p a r t m e n t
External Funds Personnel
Title Union Code
Grade Position FY16 Salary Title Union Code
Grade Position FY16 Salary
Jr Traffic Engineer AFJ 16A 1.00 56,371 Sr Radio Com Tech AFG 19 1.00 88,983 Spec Asst MYN NG 1.00 78,879 Sr Traffic Engineer AFJ 19A 1.00 92,046 Total 4 316,279 Adjustments Differential Payments 0 Other 0 Chargebacks 0 Salary Savings 0 FY16 Total Request 316,279
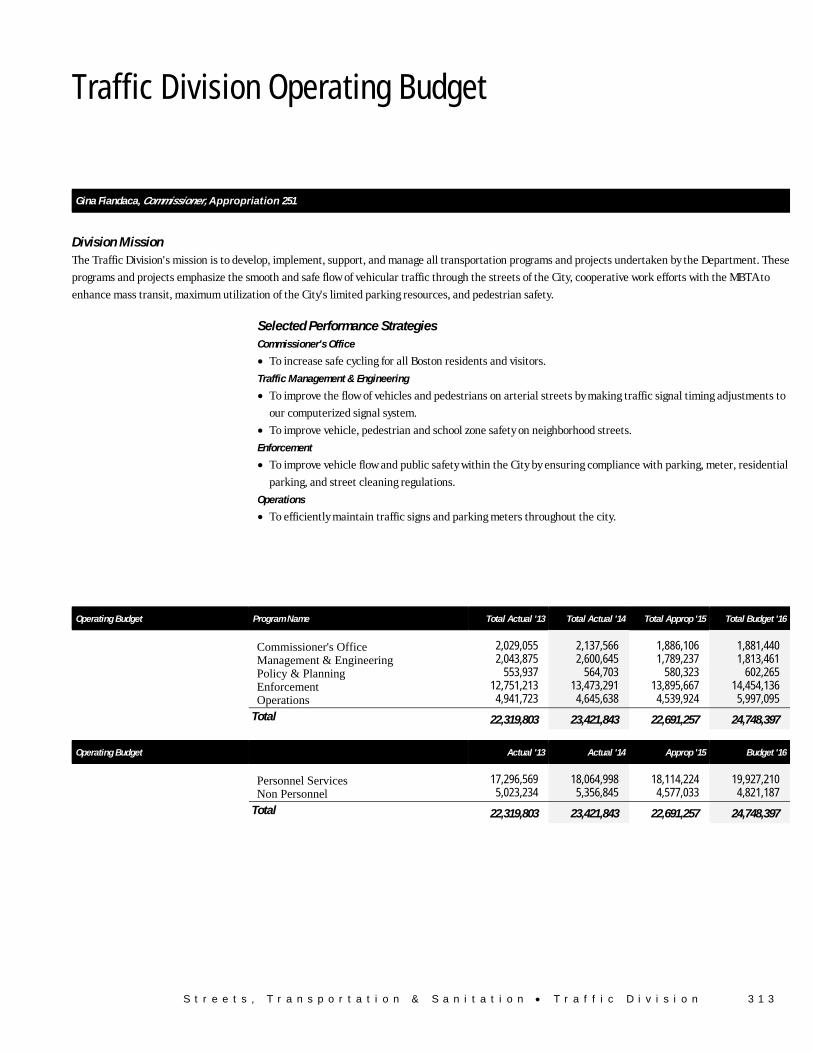
S t r e e t s , T r a n s p o r t a t i o n & S a n i t a t i o n • T r a f f i c D i v i s i o n 3 1 3
Traffic Division Operating Budget
Streets, Transportation & Sanitation Traffic Division
Gina Fiandaca, Commissioner, Appropriation 251
Division Mission The Traffic Division's mission is to develop, implement, support, and manage all transportation programs and projects undertaken by the Department. These
programs and projects emphasize the smooth and safe flow of vehicular traffic through the streets of the City, cooperative work efforts with the MBTA to
enhance mass transit, maximum utilization of the City's limited parking resources, and pedestrian safety.
Selected Performance Strategies Commissioner's Office
• To increase safe cycling for all Boston residents and visitors.
Traffic Management & Engineering
• To improve the flow of vehicles and pedestrians on arterial streets by making traffic signal timing adjustments to
our computerized signal system.
• To improve vehicle, pedestrian and school zone safety on neighborhood streets.
Enforcement
• To improve vehicle flow and public safety within the City by ensuring compliance with parking, meter, residential
parking, and street cleaning regulations.
Operations
• To efficiently maintain traffic signs and parking meters throughout the city.
Operating Budget Program Name Total Actual '13 Total Actual '14 Total Approp '15 Total Budget '16
Commissioner's Office 2,029,055 2,137,566 1,886,106 1,881,440Management & Engineering 2,043,875 2,600,645 1,789,237 1,813,461Policy & Planning 553,937 564,703 580,323 602,265Enforcement 12,751,213 13,473,291 13,895,667 14,454,136Operations 4,941,723 4,645,638 4,539,924 5,997,095
Total 22,319,803 23,421,843 22,691,257 24,748,397
Operating Budget Actual '13 Actual '14 Approp '15 Budget '16
Personnel Services 17,296,569 18,064,998 18,114,224 19,927,210 Non Personnel 5,023,234 5,356,845 4,577,033 4,821,187
Total 22,319,803 23,421,843 22,691,257 24,748,397
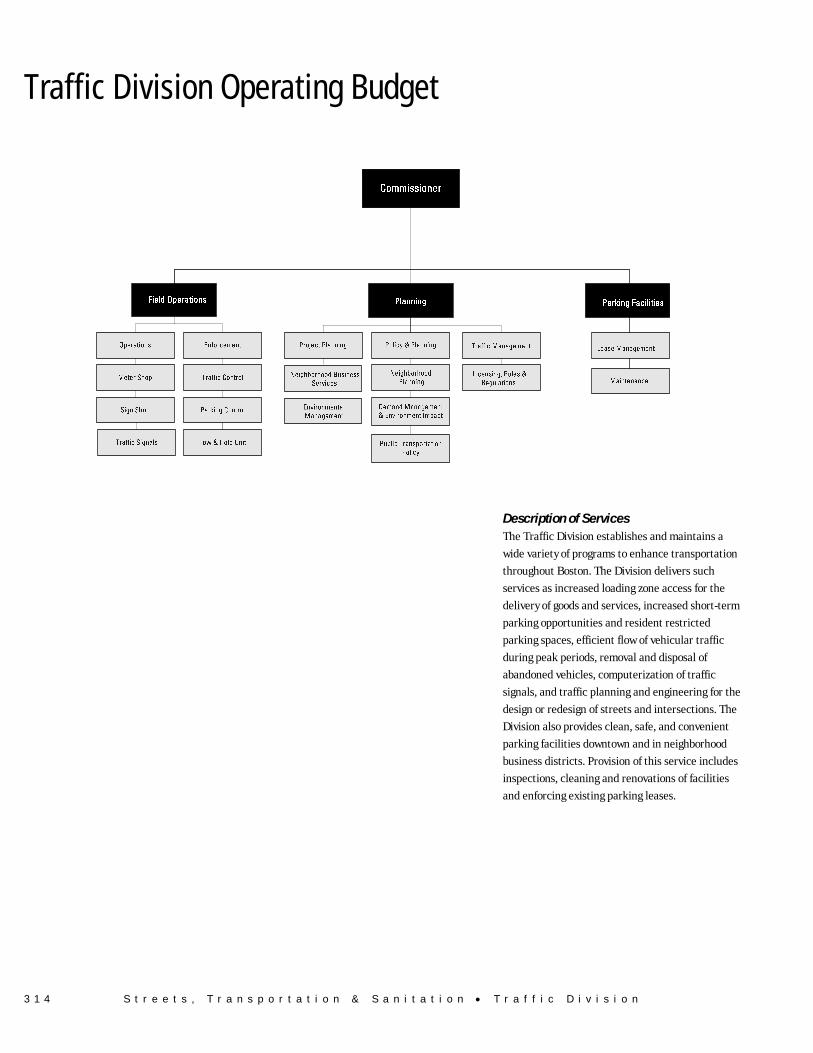
3 1 4 S t r e e t s , T r a n s p o r t a t i o n & S a n i t a t i o n • T r a f f i c D i v i s i o n
Traffic Division Operating Budget
Description of Services
The Traffic Division establishes and maintains a
wide variety of programs to enhance transportation
throughout Boston. The Division delivers such
services as increased loading zone access for the
delivery of goods and services, increased short-term
parking opportunities and resident restricted
parking spaces, efficient flow of vehicular traffic
during peak periods, removal and disposal of
abandoned vehicles, computerization of traffic
signals, and traffic planning and engineering for the
design or redesign of streets and intersections. The
Division also provides clean, safe, and convenient
parking facilities downtown and in neighborhood
business districts. Provision of this service includes
inspections, cleaning and renovations of facilities
and enforcing existing parking leases.
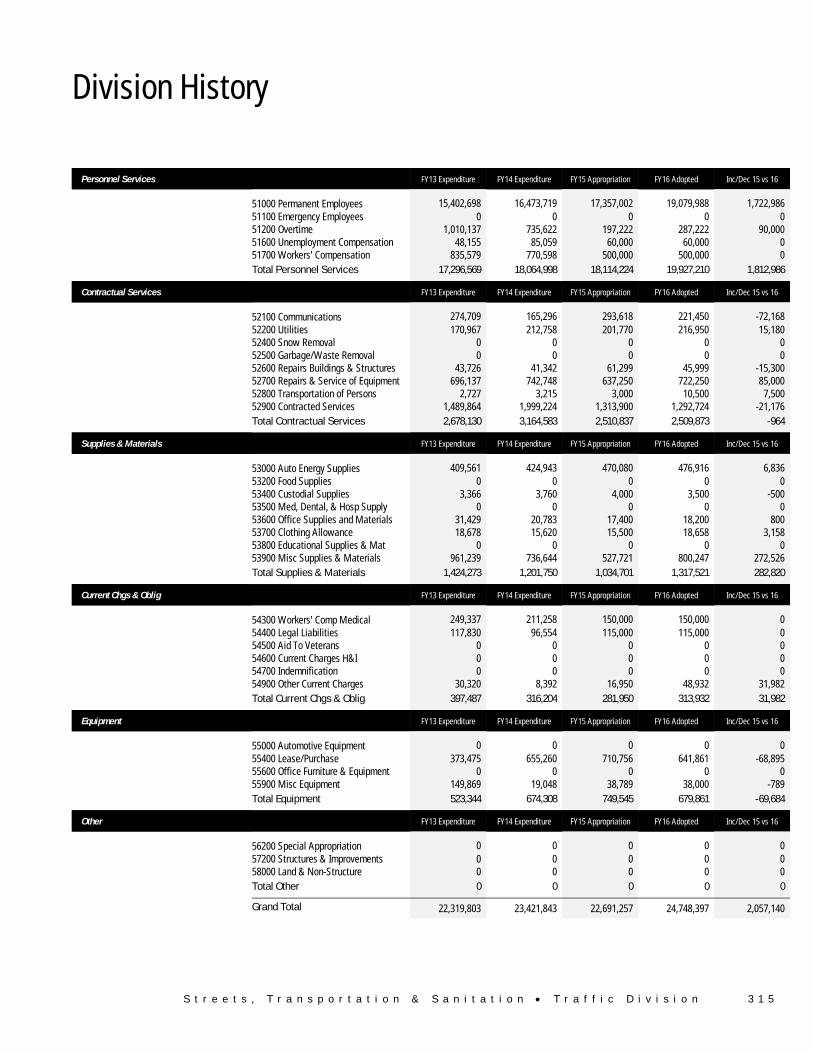
S t r e e t s , T r a n s p o r t a t i o n & S a n i t a t i o n • T r a f f i c D i v i s i o n 3 1 5
Division History
Personnel Services FY13 Expenditure FY14 Expenditure FY15 Appropriation FY16 Adopted Inc/Dec 15 vs 16
51000 Permanent Employees 15,402,698 16,473,719 17,357,002 19,079,988 1,722,986 51100 Emergency Employees 0 0 0 0 0 51200 Overtime 1,010,137 735,622 197,222 287,222 90,000 51600 Unemployment Compensation 48,155 85,059 60,000 60,000 0 51700 Workers' Compensation 835,579 770,598 500,000 500,000 0 Total Personnel Services 17,296,569 18,064,998 18,114,224 19,927,210 1,812,986
Contractual Services FY13 Expenditure FY14 Expenditure FY15 Appropriation FY16 Adopted Inc/Dec 15 vs 16
52100 Communications 274,709 165,296 293,618 221,450 -72,168 52200 Utilities 170,967 212,758 201,770 216,950 15,180 52400 Snow Removal 0 0 0 0 0 52500 Garbage/Waste Removal 0 0 0 0 0 52600 Repairs Buildings & Structures 43,726 41,342 61,299 45,999 -15,300 52700 Repairs & Service of Equipment 696,137 742,748 637,250 722,250 85,000 52800 Transportation of Persons 2,727 3,215 3,000 10,500 7,500 52900 Contracted Services 1,489,864 1,999,224 1,313,900 1,292,724 -21,176 Total Contractual Services 2,678,130 3,164,583 2,510,837 2,509,873 -964
Supplies & Materials FY13 Expenditure FY14 Expenditure FY15 Appropriation FY16 Adopted Inc/Dec 15 vs 16
53000 Auto Energy Supplies 409,561 424,943 470,080 476,916 6,836 53200 Food Supplies 0 0 0 0 0 53400 Custodial Supplies 3,366 3,760 4,000 3,500 -500 53500 Med, Dental, & Hosp Supply 0 0 0 0 0 53600 Office Supplies and Materials 31,429 20,783 17,400 18,200 800 53700 Clothing Allowance 18,678 15,620 15,500 18,658 3,158 53800 Educational Supplies & Mat 0 0 0 0 0 53900 Misc Supplies & Materials 961,239 736,644 527,721 800,247 272,526 Total Supplies & Materials 1,424,273 1,201,750 1,034,701 1,317,521 282,820
Current Chgs & Oblig FY13 Expenditure FY14 Expenditure FY15 Appropriation FY16 Adopted Inc/Dec 15 vs 16
54300 Workers' Comp Medical 249,337 211,258 150,000 150,000 0 54400 Legal Liabilities 117,830 96,554 115,000 115,000 0 54500 Aid To Veterans 0 0 0 0 0 54600 Current Charges H&I 0 0 0 0 0 54700 Indemnification 0 0 0 0 0 54900 Other Current Charges 30,320 8,392 16,950 48,932 31,982 Total Current Chgs & Oblig 397,487 316,204 281,950 313,932 31,982
Equipment FY13 Expenditure FY14 Expenditure FY15 Appropriation FY16 Adopted Inc/Dec 15 vs 16
55000 Automotive Equipment 0 0 0 0 0 55400 Lease/Purchase 373,475 655,260 710,756 641,861 -68,895 55600 Office Furniture & Equipment 0 0 0 0 0 55900 Misc Equipment 149,869 19,048 38,789 38,000 -789 Total Equipment 523,344 674,308 749,545 679,861 -69,684
Other FY13 Expenditure FY14 Expenditure FY15 Appropriation FY16 Adopted Inc/Dec 15 vs 16
56200 Special Appropriation 0 0 0 0 0 57200 Structures & Improvements 0 0 0 0 0 58000 Land & Non-Structure 0 0 0 0 0 Total Other 0 0 0 0 0
Grand Total 22,319,803 23,421,843 22,691,257 24,748,397 2,057,140
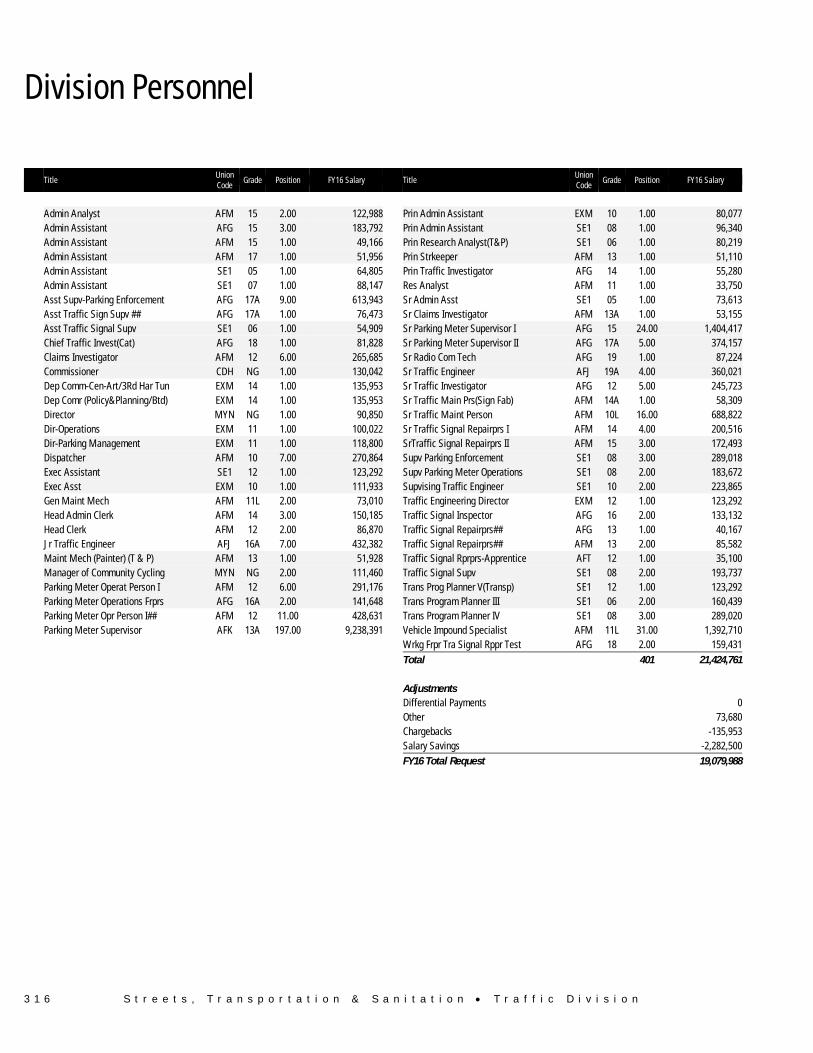
3 1 6 S t r e e t s , T r a n s p o r t a t i o n & S a n i t a t i o n • T r a f f i c D i v i s i o n
Division Personnel
Title Union Code
Grade Position FY16 Salary Title Union Code
Grade Position FY16 Salary
Admin Analyst AFM 15 2.00 122,988 Prin Admin Assistant EXM 10 1.00 80,077 Admin Assistant AFG 15 3.00 183,792 Prin Admin Assistant SE1 08 1.00 96,340 Admin Assistant AFM 15 1.00 49,166 Prin Research Analyst(T&P) SE1 06 1.00 80,219 Admin Assistant AFM 17 1.00 51,956 Prin Strkeeper AFM 13 1.00 51,110 Admin Assistant SE1 05 1.00 64,805 Prin Traffic Investigator AFG 14 1.00 55,280 Admin Assistant SE1 07 1.00 88,147 Res Analyst AFM 11 1.00 33,750 Asst Supv-Parking Enforcement AFG 17A 9.00 613,943 Sr Admin Asst SE1 05 1.00 73,613 Asst Traffic Sign Supv ## AFG 17A 1.00 76,473 Sr Claims Investigator AFM 13A 1.00 53,155 Asst Traffic Signal Supv SE1 06 1.00 54,909 Sr Parking Meter Supervisor I AFG 15 24.00 1,404,417 Chief Traffic Invest(Cat) AFG 18 1.00 81,828 Sr Parking Meter Supervisor II AFG 17A 5.00 374,157 Claims Investigator AFM 12 6.00 265,685 Sr Radio Com Tech AFG 19 1.00 87,224 Commissioner CDH NG 1.00 130,042 Sr Traffic Engineer AFJ 19A 4.00 360,021 Dep Comm-Cen-Art/3Rd Har Tun EXM 14 1.00 135,953 Sr Traffic Investigator AFG 12 5.00 245,723 Dep Comr (Policy&Planning/Btd) EXM 14 1.00 135,953 Sr Traffic Main Prs(Sign Fab) AFM 14A 1.00 58,309 Director MYN NG 1.00 90,850 Sr Traffic Maint Person AFM 10L 16.00 688,822 Dir-Operations EXM 11 1.00 100,022 Sr Traffic Signal Repairprs I AFM 14 4.00 200,516 Dir-Parking Management EXM 11 1.00 118,800 SrTraffic Signal Repairprs II AFM 15 3.00 172,493 Dispatcher AFM 10 7.00 270,864 Supv Parking Enforcement SE1 08 3.00 289,018 Exec Assistant SE1 12 1.00 123,292 Supv Parking Meter Operations SE1 08 2.00 183,672 Exec Asst EXM 10 1.00 111,933 Supvising Traffic Engineer SE1 10 2.00 223,865 Gen Maint Mech AFM 11L 2.00 73,010 Traffic Engineering Director EXM 12 1.00 123,292 Head Admin Clerk AFM 14 3.00 150,185 Traffic Signal Inspector AFG 16 2.00 133,132 Head Clerk AFM 12 2.00 86,870 Traffic Signal Repairprs## AFG 13 1.00 40,167 Jr Traffic Engineer AFJ 16A 7.00 432,382 Traffic Signal Repairprs## AFM 13 2.00 85,582 Maint Mech (Painter) (T & P) AFM 13 1.00 51,928 Traffic Signal Rprprs-Apprentice AFT 12 1.00 35,100 Manager of Community Cycling MYN NG 2.00 111,460 Traffic Signal Supv SE1 08 2.00 193,737 Parking Meter Operat Person I AFM 12 6.00 291,176 Trans Prog Planner V(Transp) SE1 12 1.00 123,292 Parking Meter Operations Frprs AFG 16A 2.00 141,648 Trans Program Planner III SE1 06 2.00 160,439 Parking Meter Opr Person I## AFM 12 11.00 428,631 Trans Program Planner IV SE1 08 3.00 289,020 Parking Meter Supervisor AFK 13A 197.00 9,238,391 Vehicle Impound Specialist AFM 11L 31.00 1,392,710 Wrkg Frpr Tra Signal Rppr Test AFG 18 2.00 159,431 Total 401 21,424,761 Adjustments Differential Payments 0 Other 73,680 Chargebacks -135,953 Salary Savings -2,282,500 FY16 Total Request 19,079,988
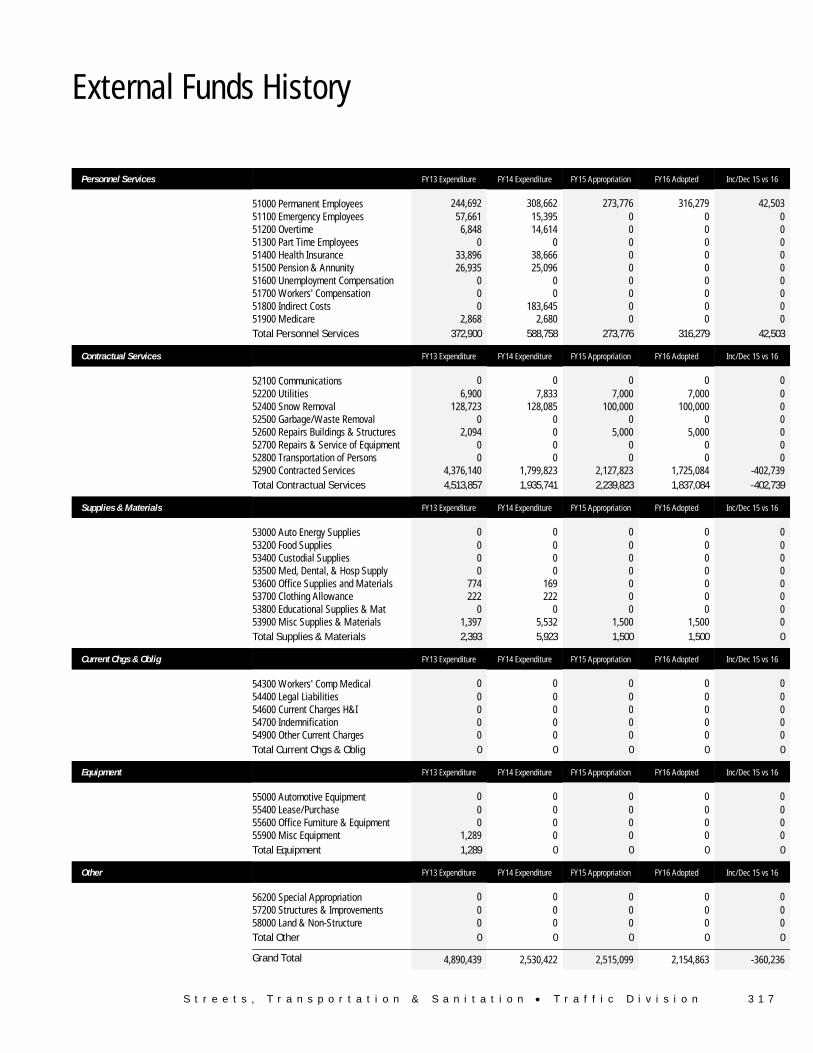
S t r e e t s , T r a n s p o r t a t i o n & S a n i t a t i o n • T r a f f i c D i v i s i o n 3 1 7
External Funds History
Personnel Services FY13 Expenditure FY14 Expenditure FY15 Appropriation FY16 Adopted Inc/Dec 15 vs 16
51000 Permanent Employees 244,692 308,662 273,776 316,279 42,503 51100 Emergency Employees 57,661 15,395 0 0 0 51200 Overtime 6,848 14,614 0 0 0 51300 Part Time Employees 0 0 0 0 0 51400 Health Insurance 33,896 38,666 0 0 0 51500 Pension & Annunity 26,935 25,096 0 0 0 51600 Unemployment Compensation 0 0 0 0 0 51700 Workers' Compensation 0 0 0 0 0 51800 Indirect Costs 0 183,645 0 0 0 51900 Medicare 2,868 2,680 0 0 0 Total Personnel Services 372,900 588,758 273,776 316,279 42,503
Contractual Services FY13 Expenditure FY14 Expenditure FY15 Appropriation FY16 Adopted Inc/Dec 15 vs 16
52100 Communications 0 0 0 0 0 52200 Utilities 6,900 7,833 7,000 7,000 0 52400 Snow Removal 128,723 128,085 100,000 100,000 0 52500 Garbage/Waste Removal 0 0 0 0 0 52600 Repairs Buildings & Structures 2,094 0 5,000 5,000 0 52700 Repairs & Service of Equipment 0 0 0 0 0 52800 Transportation of Persons 0 0 0 0 0 52900 Contracted Services 4,376,140 1,799,823 2,127,823 1,725,084 -402,739 Total Contractual Services 4,513,857 1,935,741 2,239,823 1,837,084 -402,739
Supplies & Materials FY13 Expenditure FY14 Expenditure FY15 Appropriation FY16 Adopted Inc/Dec 15 vs 16
53000 Auto Energy Supplies 0 0 0 0 0 53200 Food Supplies 0 0 0 0 0 53400 Custodial Supplies 0 0 0 0 0 53500 Med, Dental, & Hosp Supply 0 0 0 0 0 53600 Office Supplies and Materials 774 169 0 0 0 53700 Clothing Allowance 222 222 0 0 0 53800 Educational Supplies & Mat 0 0 0 0 0 53900 Misc Supplies & Materials 1,397 5,532 1,500 1,500 0 Total Supplies & Materials 2,393 5,923 1,500 1,500 0
Current Chgs & Oblig FY13 Expenditure FY14 Expenditure FY15 Appropriation FY16 Adopted Inc/Dec 15 vs 16
54300 Workers' Comp Medical 0 0 0 0 0 54400 Legal Liabilities 0 0 0 0 0 54600 Current Charges H&I 0 0 0 0 0 54700 Indemnification 0 0 0 0 0 54900 Other Current Charges 0 0 0 0 0 Total Current Chgs & Oblig 0 0 0 0 0
Equipment FY13 Expenditure FY14 Expenditure FY15 Appropriation FY16 Adopted Inc/Dec 15 vs 16
55000 Automotive Equipment 0 0 0 0 0 55400 Lease/Purchase 0 0 0 0 0 55600 Office Furniture & Equipment 0 0 0 0 0 55900 Misc Equipment 1,289 0 0 0 0 Total Equipment 1,289 0 0 0 0
Other FY13 Expenditure FY14 Expenditure FY15 Appropriation FY16 Adopted Inc/Dec 15 vs 16
56200 Special Appropriation 0 0 0 0 0 57200 Structures & Improvements 0 0 0 0 0 58000 Land & Non-Structure 0 0 0 0 0 Total Other 0 0 0 0 0
Grand Total 4,890,439 2,530,422 2,515,099 2,154,863 -360,236

3 1 8 S t r e e t s , T r a n s p o r t a t i o n & S a n i t a t i o n • T r a f f i c D i v i s i o n
External Funds Personnel
Title Union Code
Grade Position FY16 Salary Title Union Code
Grade Position FY16 Salary
Jr Traffic Engineer AFJ 16A 1.00 56,371 Sr Radio Com Tech AFG 19 1.00 88,983 Spec Asst MYN NG 1.00 78,879 Sr Traffic Engineer AFJ 19A 1.00 92,046 Total 4 316,279 Adjustments Differential Payments 0 Other 0 Chargebacks 0 Salary Savings 0 FY16 Total Request 316,279
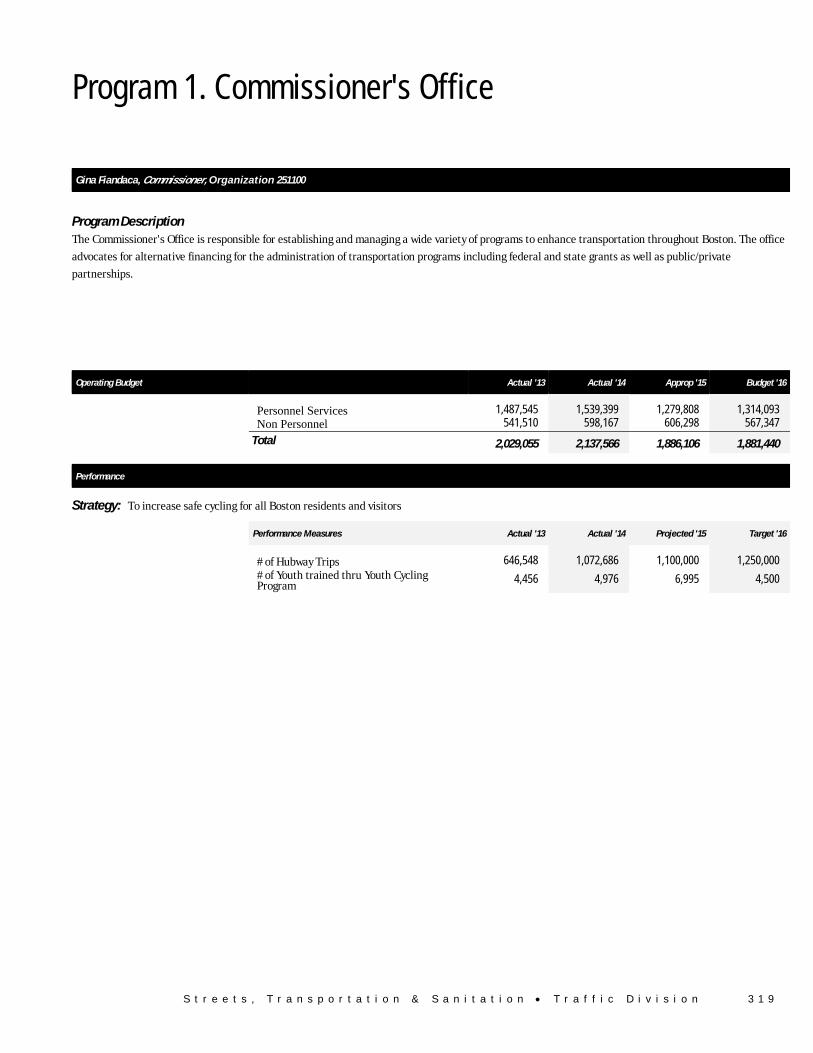
S t r e e t s , T r a n s p o r t a t i o n & S a n i t a t i o n • T r a f f i c D i v i s i o n 3 1 9
Program 1. Commissioner's Office
Gina Fiandaca, Commissioner, Organization 251100
Program Description The Commissioner's Office is responsible for establishing and managing a wide variety of programs to enhance transportation throughout Boston. The office
advocates for alternative financing for the administration of transportation programs including federal and state grants as well as public/private
partnerships.
Operating Budget Actual '13 Actual '14 Approp '15 Budget '16
Personnel Services 1,487,545 1,539,399 1,279,808 1,314,093 Non Personnel 541,510 598,167 606,298 567,347
Total 2,029,055 2,137,566 1,886,106 1,881,440
Performance
Strategy: To increase safe cycling for all Boston residents and visitors
Performance Measures Actual '13 Actual '14 Projected '15 Target '16
# of Hubway Trips 646,548 1,072,686 1,100,000 1,250,000# of Youth trained thru Youth Cycling Program 4,456 4,976 6,995 4,500
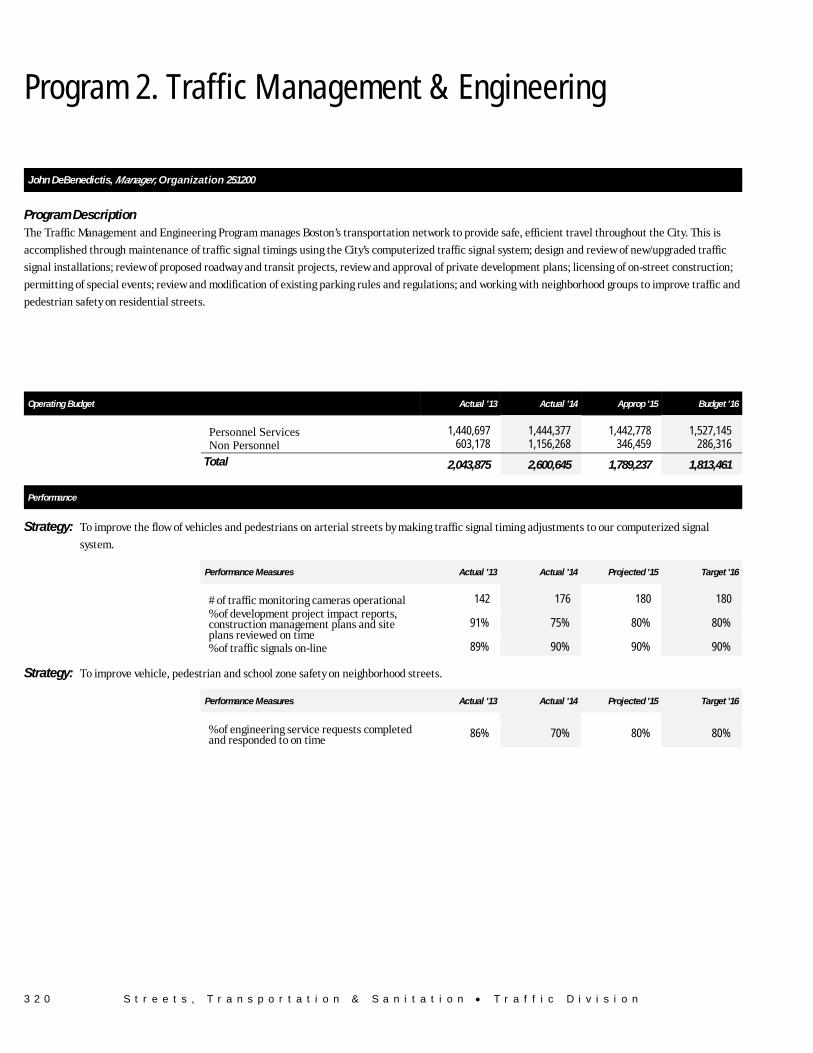
3 2 0 S t r e e t s , T r a n s p o r t a t i o n & S a n i t a t i o n • T r a f f i c D i v i s i o n
Program 2. Traffic Management & Engineering
John DeBenedictis, Manager, Organization 251200
Program Description The Traffic Management and Engineering Program manages Boston’s transportation network to provide safe, efficient travel throughout the City. This is
accomplished through maintenance of traffic signal timings using the City’s computerized traffic signal system; design and review of new/upgraded traffic
signal installations; review of proposed roadway and transit projects, review and approval of private development plans; licensing of on-street construction;
permitting of special events; review and modification of existing parking rules and regulations; and working with neighborhood groups to improve traffic and
pedestrian safety on residential streets.
Operating Budget Actual '13 Actual '14 Approp '15 Budget '16
Personnel Services 1,440,697 1,444,377 1,442,778 1,527,145 Non Personnel 603,178 1,156,268 346,459 286,316
Total 2,043,875 2,600,645 1,789,237 1,813,461
Performance
Strategy: To improve the flow of vehicles and pedestrians on arterial streets by making traffic signal timing adjustments to our computerized signal
system.
Performance Measures Actual '13 Actual '14 Projected '15 Target '16
# of traffic monitoring cameras operational 142 176 180 180
% of development project impact reports, construction management plans and site plans reviewed on time
91% 75% 80% 80%
% of traffic signals on-line 89% 90% 90% 90%
Strategy: To improve vehicle, pedestrian and school zone safety on neighborhood streets.
Performance Measures Actual '13 Actual '14 Projected '15 Target '16
% of engineering service requests completed and responded to on time 86% 70% 80% 80%
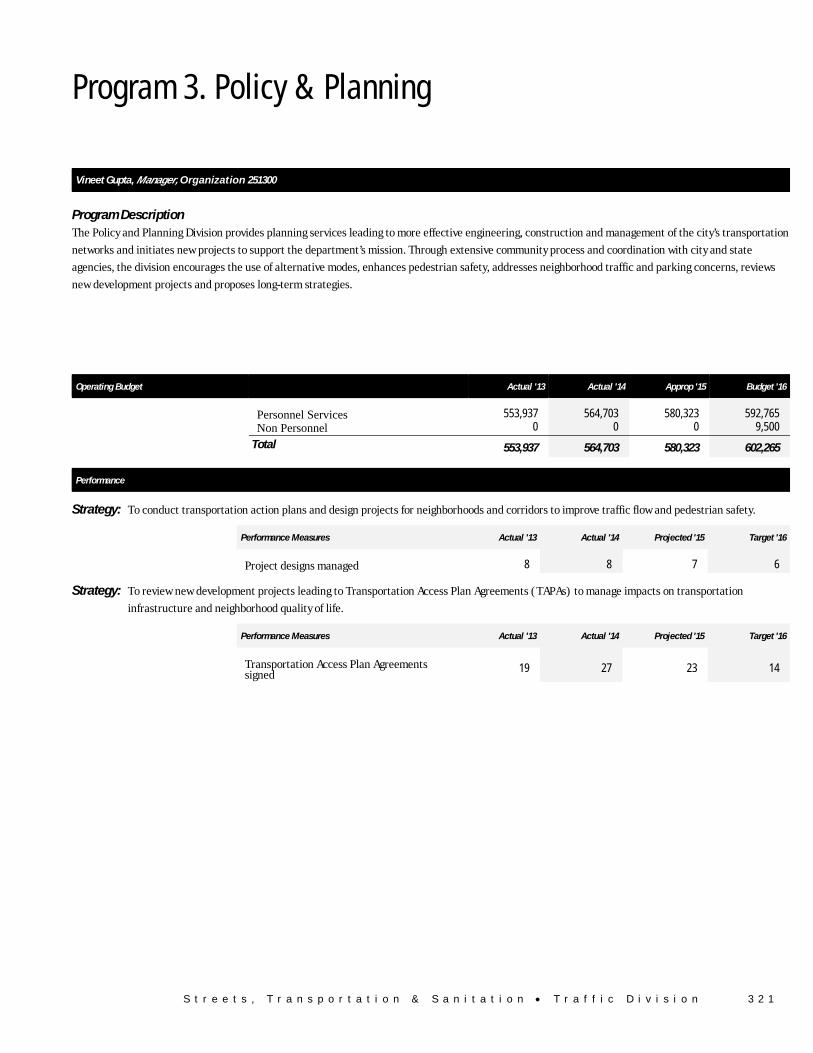
S t r e e t s , T r a n s p o r t a t i o n & S a n i t a t i o n • T r a f f i c D i v i s i o n 3 2 1
Program 3. Policy & Planning
Vineet Gupta, Manager, Organization 251300
Program Description The Policy and Planning Division provides planning services leading to more effective engineering, construction and management of the city’s transportation
networks and initiates new projects to support the department’s mission. Through extensive community process and coordination with city and state
agencies, the division encourages the use of alternative modes, enhances pedestrian safety, addresses neighborhood traffic and parking concerns, reviews
new development projects and proposes long-term strategies.
Operating Budget Actual '13 Actual '14 Approp '15 Budget '16
Personnel Services 553,937 564,703 580,323 592,765 Non Personnel 0 0 0 9,500
Total 553,937 564,703 580,323 602,265
Performance
Strategy: To conduct transportation action plans and design projects for neighborhoods and corridors to improve traffic flow and pedestrian safety.
Performance Measures Actual '13 Actual '14 Projected '15 Target '16
Project designs managed 8 8 7 6
Strategy: To review new development projects leading to Transportation Access Plan Agreements (TAPAs) to manage impacts on transportation
infrastructure and neighborhood quality of life.
Performance Measures Actual '13 Actual '14 Projected '15 Target '16
Transportation Access Plan Agreements signed 19 27 23 14

3 2 2 S t r e e t s , T r a n s p o r t a t i o n & S a n i t a t i o n • T r a f f i c D i v i s i o n
Program 4. Enforcement
Gregory Rooney, Manager, Organization 251400
Program Description The Enforcement Program enhances public safety, improves traffic flow, and promotes parking opportunities and curbside access by encouraging
compliance with the City's rules and regulations through issuance of citations and towing of illegally parked vehicles.
Operating Budget Actual '13 Actual '14 Approp '15 Budget '16
Personnel Services 10,954,365 11,547,954 12,093,976 12,598,879 Non Personnel 1,796,848 1,925,337 1,801,691 1,855,257
Total 12,751,213 13,473,291 13,895,667 14,454,136
Performance
Strategy: To improve vehicle flow and public safety within the City by ensuring compliance with parking, meter, residential parking, and street cleaning
regulations.
Performance Measures Actual '13 Actual '14 Projected '15 Target '16
Tickets issued by Enforcement Unit 1,232,298 1,271,931 1,206,326 1,344,000Total tows 11,841 14,389 15,710 15,000
Responsiveness to Constituent Requests (CRM) Actual '13 Actual '14 Projected '15 Target '16
# of abandoned vehicle requests received 1,552 1,795 2,070 1,800% of abandoned vehicle requests completed on time 99% 98% 98% 80%
Average time to complete an abandoned vehicle request (Days) 12 13 11 12
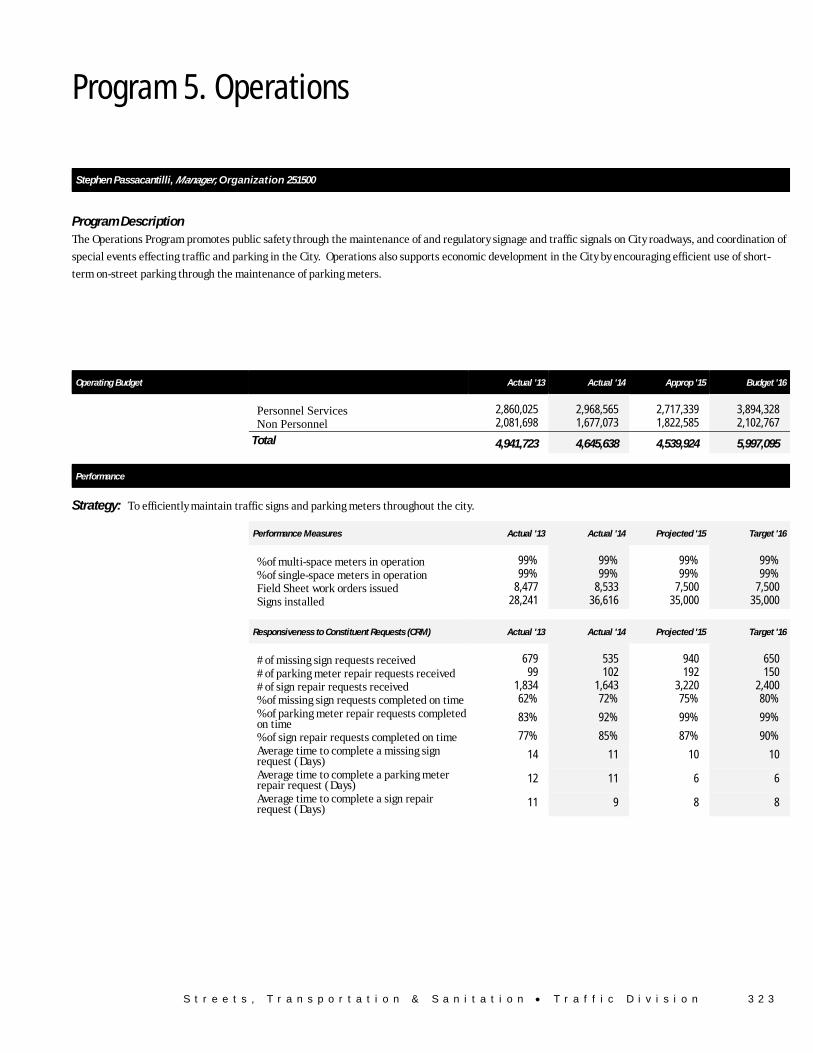
S t r e e t s , T r a n s p o r t a t i o n & S a n i t a t i o n • T r a f f i c D i v i s i o n 3 2 3
Program 5. Operations
Stephen Passacantilli, Manager, Organization 251500
Program Description The Operations Program promotes public safety through the maintenance of and regulatory signage and traffic signals on City roadways, and coordination of
special events effecting traffic and parking in the City. Operations also supports economic development in the City by encouraging efficient use of short-
term on-street parking through the maintenance of parking meters.
Operating Budget Actual '13 Actual '14 Approp '15 Budget '16
Personnel Services 2,860,025 2,968,565 2,717,339 3,894,328 Non Personnel 2,081,698 1,677,073 1,822,585 2,102,767
Total 4,941,723 4,645,638 4,539,924 5,997,095
Performance
Strategy: To efficiently maintain traffic signs and parking meters throughout the city.
Performance Measures Actual '13 Actual '14 Projected '15 Target '16
% of multi-space meters in operation 99% 99% 99% 99%% of single-space meters in operation 99% 99% 99% 99%Field Sheet work orders issued 8,477 8,533 7,500 7,500Signs installed 28,241 36,616 35,000 35,000
Responsiveness to Constituent Requests (CRM) Actual '13 Actual '14 Projected '15 Target '16
# of missing sign requests received 679 535 940 650# of parking meter repair requests received 99 102 192 150# of sign repair requests received 1,834 1,643 3,220 2,400% of missing sign requests completed on time 62% 72% 75% 80%% of parking meter repair requests completed on time 83% 92% 99% 99%
% of sign repair requests completed on time 77% 85% 87% 90%Average time to complete a missing sign request (Days) 14 11 10 10
Average time to complete a parking meter repair request (Days) 12 11 6 6
Average time to complete a sign repair request (Days) 11 9 8 8

3 2 4 S t r e e t s , T r a n s p o r t a t i o n & S a n i t a t i o n • T r a f f i c D i v i s i o n
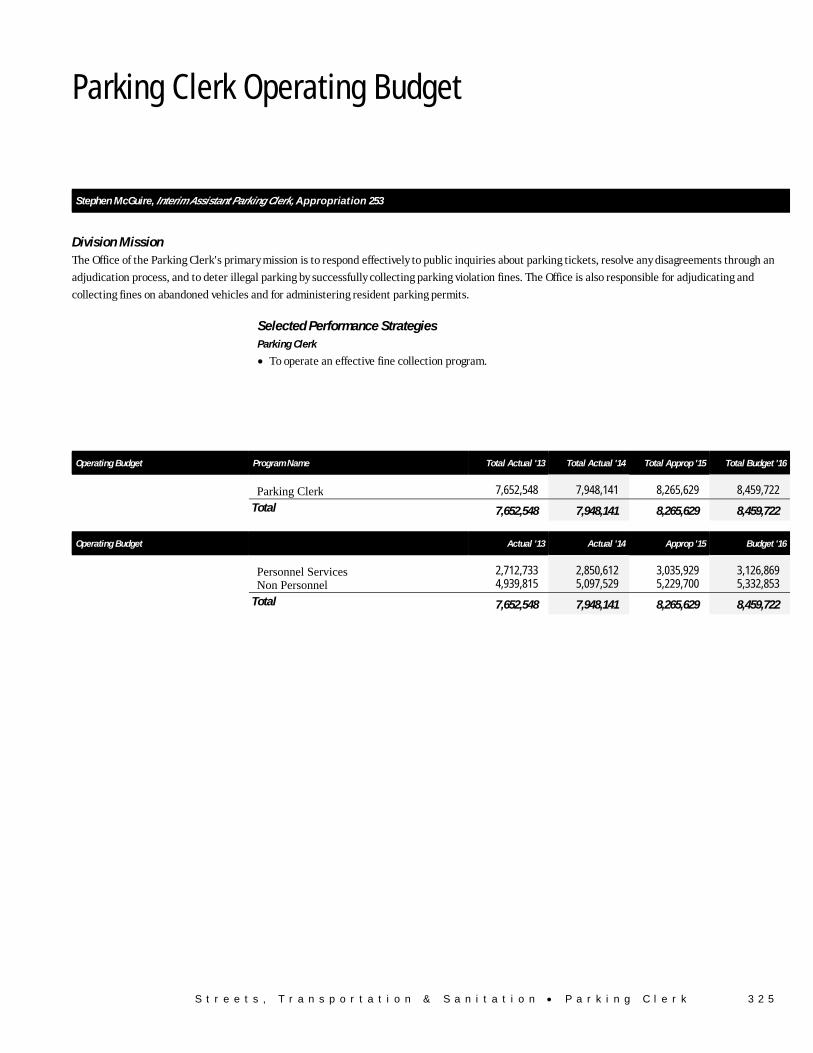
S t r e e t s , T r a n s p o r t a t i o n & S a n i t a t i o n • P a r k i n g C l e r k 3 2 5
Parking Clerk Operating Budget
Streets, Transportation & Sanitation Parking Clerk
Stephen McGuire, Interim Assistant Parking Clerk, Appropriation 253
Division Mission The Office of the Parking Clerk's primary mission is to respond effectively to public inquiries about parking tickets, resolve any disagreements through an
adjudication process, and to deter illegal parking by successfully collecting parking violation fines. The Office is also responsible for adjudicating and
collecting fines on abandoned vehicles and for administering resident parking permits.
Selected Performance Strategies Parking Clerk
• To operate an effective fine collection program.
Operating Budget Program Name Total Actual '13 Total Actual '14 Total Approp '15 Total Budget '16
Parking Clerk 7,652,548 7,948,141 8,265,629 8,459,722
Total 7,652,548 7,948,141 8,265,629 8,459,722
Operating Budget Actual '13 Actual '14 Approp '15 Budget '16
Personnel Services 2,712,733 2,850,612 3,035,929 3,126,869 Non Personnel 4,939,815 5,097,529 5,229,700 5,332,853
Total 7,652,548 7,948,141 8,265,629 8,459,722
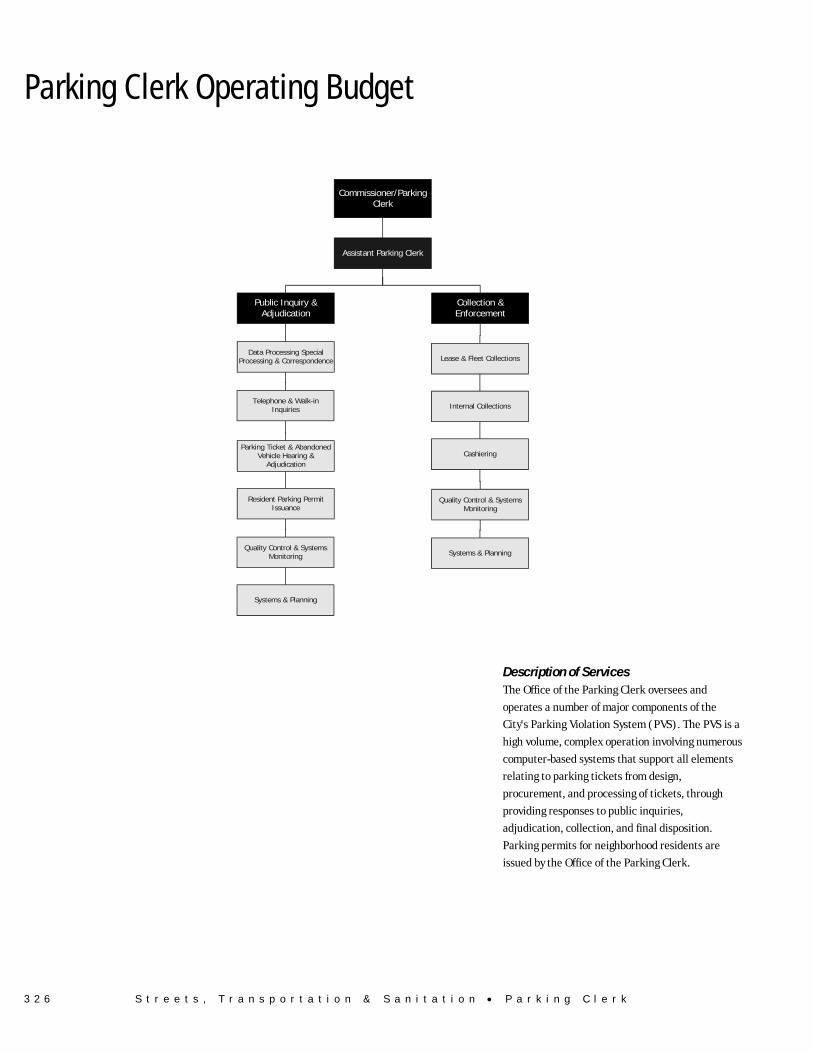
3 2 6 S t r e e t s , T r a n s p o r t a t i o n & S a n i t a t i o n • P a r k i n g C l e r k
Parking Clerk Operating Budget
Commissioner/ParkingClerk
Public Inquiry &Adjudication
Data Processing SpecialProcessing & Correspondence
Telephone & Walk-inInquiries
Parking Ticket & AbandonedVehicle Hearing &
Adjudication
Resident Parking PermitIssuance
Quality Control & SystemsMonitoring
Systems & Planning
Collection &Enforcement
Lease & Fleet Collections
Internal Collections
Cashiering
Quality Control & SystemsMonitoring
Systems & Planning
Assistant Parking Clerk
Description of Services
The Office of the Parking Clerk oversees and
operates a number of major components of the
City's Parking Violation System (PVS). The PVS is a
high volume, complex operation involving numerous
computer-based systems that support all elements
relating to parking tickets from design,
procurement, and processing of tickets, through
providing responses to public inquiries,
adjudication, collection, and final disposition.
Parking permits for neighborhood residents are
issued by the Office of the Parking Clerk.
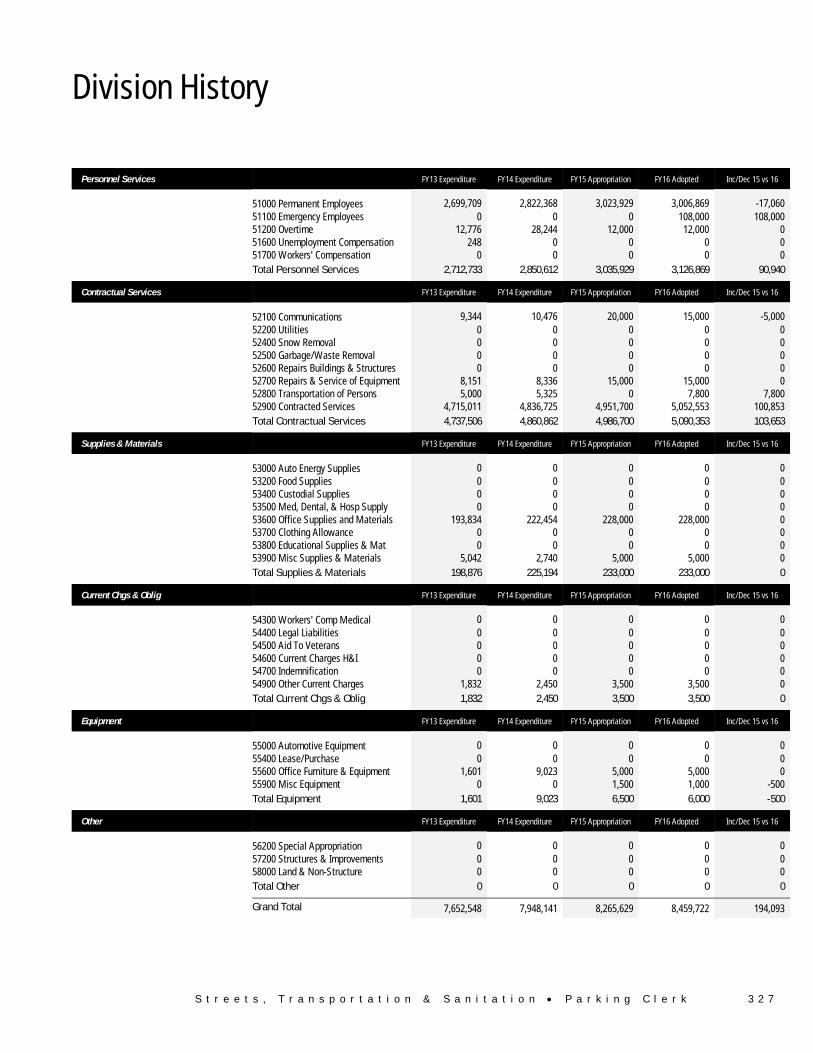
S t r e e t s , T r a n s p o r t a t i o n & S a n i t a t i o n • P a r k i n g C l e r k 3 2 7
Division History
Personnel Services FY13 Expenditure FY14 Expenditure FY15 Appropriation FY16 Adopted Inc/Dec 15 vs 16
51000 Permanent Employees 2,699,709 2,822,368 3,023,929 3,006,869 -17,060 51100 Emergency Employees 0 0 0 108,000 108,000 51200 Overtime 12,776 28,244 12,000 12,000 0 51600 Unemployment Compensation 248 0 0 0 0 51700 Workers' Compensation 0 0 0 0 0 Total Personnel Services 2,712,733 2,850,612 3,035,929 3,126,869 90,940
Contractual Services FY13 Expenditure FY14 Expenditure FY15 Appropriation FY16 Adopted Inc/Dec 15 vs 16
52100 Communications 9,344 10,476 20,000 15,000 -5,000 52200 Utilities 0 0 0 0 0 52400 Snow Removal 0 0 0 0 0 52500 Garbage/Waste Removal 0 0 0 0 0 52600 Repairs Buildings & Structures 0 0 0 0 0 52700 Repairs & Service of Equipment 8,151 8,336 15,000 15,000 0 52800 Transportation of Persons 5,000 5,325 0 7,800 7,800 52900 Contracted Services 4,715,011 4,836,725 4,951,700 5,052,553 100,853 Total Contractual Services 4,737,506 4,860,862 4,986,700 5,090,353 103,653
Supplies & Materials FY13 Expenditure FY14 Expenditure FY15 Appropriation FY16 Adopted Inc/Dec 15 vs 16
53000 Auto Energy Supplies 0 0 0 0 0 53200 Food Supplies 0 0 0 0 0 53400 Custodial Supplies 0 0 0 0 0 53500 Med, Dental, & Hosp Supply 0 0 0 0 0 53600 Office Supplies and Materials 193,834 222,454 228,000 228,000 0 53700 Clothing Allowance 0 0 0 0 0 53800 Educational Supplies & Mat 0 0 0 0 0 53900 Misc Supplies & Materials 5,042 2,740 5,000 5,000 0 Total Supplies & Materials 198,876 225,194 233,000 233,000 0
Current Chgs & Oblig FY13 Expenditure FY14 Expenditure FY15 Appropriation FY16 Adopted Inc/Dec 15 vs 16
54300 Workers' Comp Medical 0 0 0 0 0 54400 Legal Liabilities 0 0 0 0 0 54500 Aid To Veterans 0 0 0 0 0 54600 Current Charges H&I 0 0 0 0 0 54700 Indemnification 0 0 0 0 0 54900 Other Current Charges 1,832 2,450 3,500 3,500 0 Total Current Chgs & Oblig 1,832 2,450 3,500 3,500 0
Equipment FY13 Expenditure FY14 Expenditure FY15 Appropriation FY16 Adopted Inc/Dec 15 vs 16
55000 Automotive Equipment 0 0 0 0 0 55400 Lease/Purchase 0 0 0 0 0 55600 Office Furniture & Equipment 1,601 9,023 5,000 5,000 0 55900 Misc Equipment 0 0 1,500 1,000 -500 Total Equipment 1,601 9,023 6,500 6,000 -500
Other FY13 Expenditure FY14 Expenditure FY15 Appropriation FY16 Adopted Inc/Dec 15 vs 16
56200 Special Appropriation 0 0 0 0 0 57200 Structures & Improvements 0 0 0 0 0 58000 Land & Non-Structure 0 0 0 0 0 Total Other 0 0 0 0 0
Grand Total 7,652,548 7,948,141 8,265,629 8,459,722 194,093
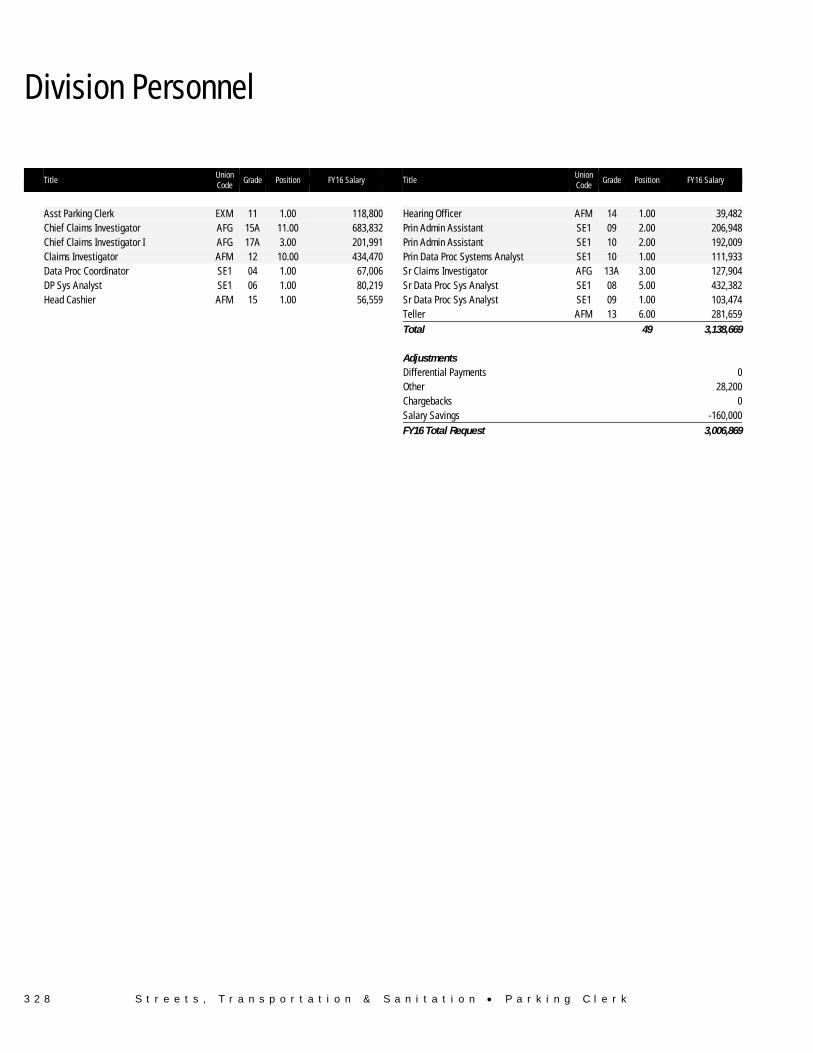
3 2 8 S t r e e t s , T r a n s p o r t a t i o n & S a n i t a t i o n • P a r k i n g C l e r k
Division Personnel
Title Union Code
Grade Position FY16 Salary Title Union Code
Grade Position FY16 Salary
Asst Parking Clerk EXM 11 1.00 118,800 Hearing Officer AFM 14 1.00 39,482 Chief Claims Investigator AFG 15A 11.00 683,832 Prin Admin Assistant SE1 09 2.00 206,948 Chief Claims Investigator I AFG 17A 3.00 201,991 Prin Admin Assistant SE1 10 2.00 192,009 Claims Investigator AFM 12 10.00 434,470 Prin Data Proc Systems Analyst SE1 10 1.00 111,933 Data Proc Coordinator SE1 04 1.00 67,006 Sr Claims Investigator AFG 13A 3.00 127,904 DP Sys Analyst SE1 06 1.00 80,219 Sr Data Proc Sys Analyst SE1 08 5.00 432,382 Head Cashier AFM 15 1.00 56,559 Sr Data Proc Sys Analyst SE1 09 1.00 103,474 Teller AFM 13 6.00 281,659 Total 49 3,138,669 Adjustments Differential Payments 0 Other 28,200 Chargebacks 0 Salary Savings -160,000 FY16 Total Request 3,006,869
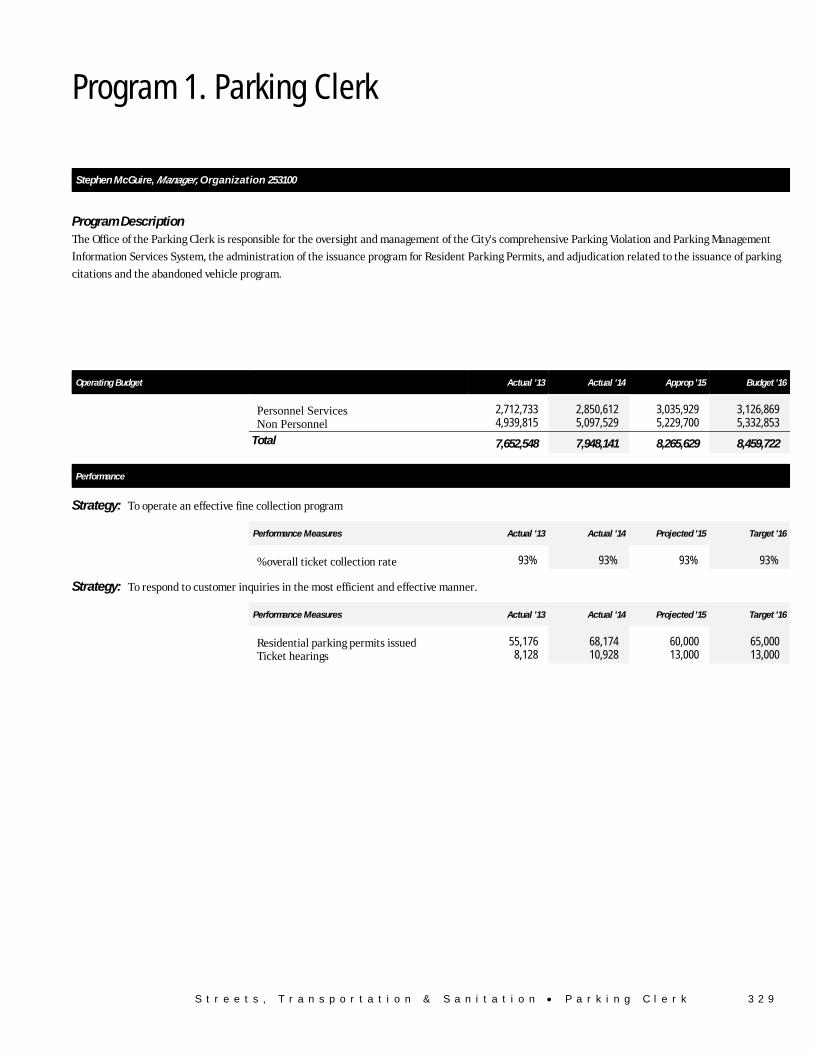
S t r e e t s , T r a n s p o r t a t i o n & S a n i t a t i o n • P a r k i n g C l e r k 3 2 9
Program 1. Parking Clerk
Stephen McGuire, Manager, Organization 253100
Program Description The Office of the Parking Clerk is responsible for the oversight and management of the City's comprehensive Parking Violation and Parking Management
Information Services System, the administration of the issuance program for Resident Parking Permits, and adjudication related to the issuance of parking
citations and the abandoned vehicle program.
Operating Budget Actual '13 Actual '14 Approp '15 Budget '16
Personnel Services 2,712,733 2,850,612 3,035,929 3,126,869 Non Personnel 4,939,815 5,097,529 5,229,700 5,332,853
Total 7,652,548 7,948,141 8,265,629 8,459,722
Performance
Strategy: To operate an effective fine collection program
Performance Measures Actual '13 Actual '14 Projected '15 Target '16
% overall ticket collection rate 93% 93% 93% 93%
Strategy: To respond to customer inquiries in the most efficient and effective manner.
Performance Measures Actual '13 Actual '14 Projected '15 Target '16
Residential parking permits issued 55,176 68,174 60,000 65,000Ticket hearings 8,128 10,928 13,000 13,000
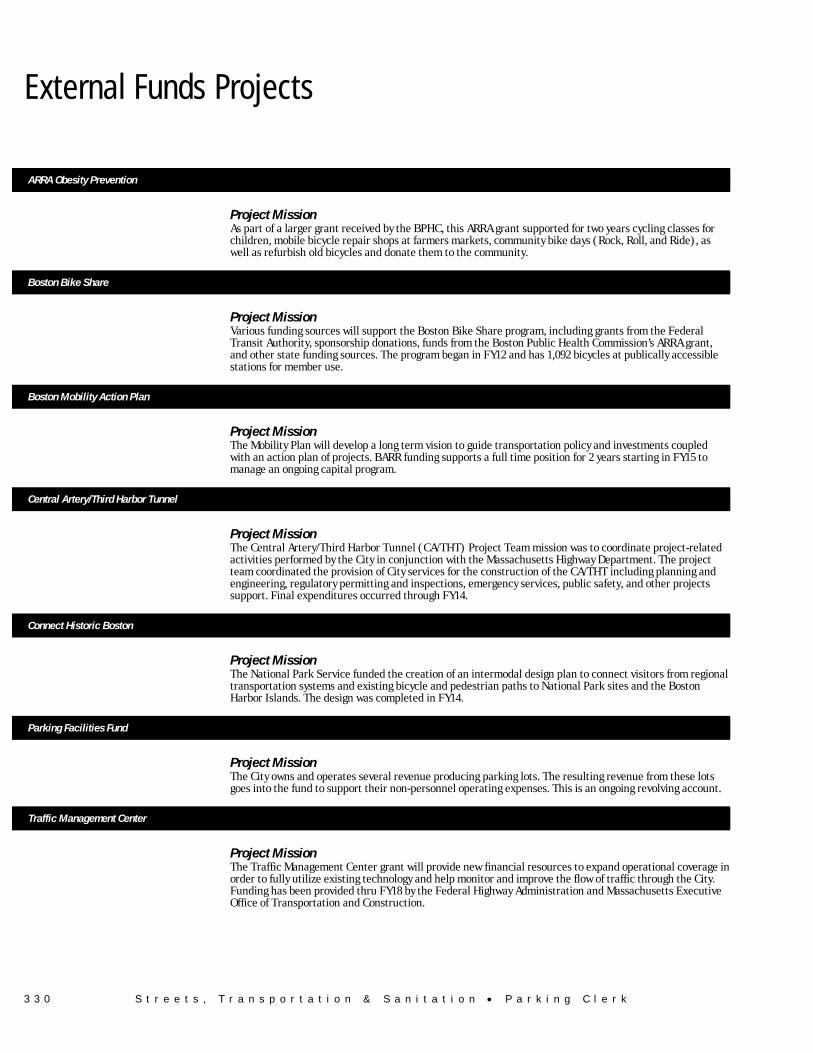
3 3 0 S t r e e t s , T r a n s p o r t a t i o n & S a n i t a t i o n • P a r k i n g C l e r k
External Funds Projects
ARRA Obesity Prevention
Project Mission As part of a larger grant received by the BPHC, this ARRA grant supported for two years cycling classes for children, mobile bicycle repair shops at farmers markets, community bike days (Rock, Roll, and Ride), as well as refurbish old bicycles and donate them to the community.
Boston Bike Share
Project Mission Various funding sources will support the Boston Bike Share program, including grants from the Federal Transit Authority, sponsorship donations, funds from the Boston Public Health Commission’s ARRA grant, and other state funding sources. The program began in FY12 and has 1,092 bicycles at publically accessible stations for member use.
Boston Mobility Action Plan
Project Mission The Mobility Plan will develop a long term vision to guide transportation policy and investments coupled with an action plan of projects. BARR funding supports a full time position for 2 years starting in FY15 to manage an ongoing capital program.
Central Artery/Third Harbor Tunnel
Project Mission The Central Artery/Third Harbor Tunnel (CA/THT) Project Team mission was to coordinate project-related activities performed by the City in conjunction with the Massachusetts Highway Department. The project team coordinated the provision of City services for the construction of the CA/THT including planning and engineering, regulatory permitting and inspections, emergency services, public safety, and other projects support. Final expenditures occurred through FY14.
Connect Historic Boston
Project Mission The National Park Service funded the creation of an intermodal design plan to connect visitors from regional transportation systems and existing bicycle and pedestrian paths to National Park sites and the Boston Harbor Islands. The design was completed in FY14.
Parking Facilities Fund
Project Mission The City owns and operates several revenue producing parking lots. The resulting revenue from these lots goes into the fund to support their non-personnel operating expenses. This is an ongoing revolving account.
Traffic Management Center
Project Mission The Traffic Management Center grant will provide new financial resources to expand operational coverage in order to fully utilize existing technology and help monitor and improve the flow of traffic through the City. Funding has been provided thru FY18 by the Federal Highway Administration and Massachusetts Executive Office of Transportation and Construction.
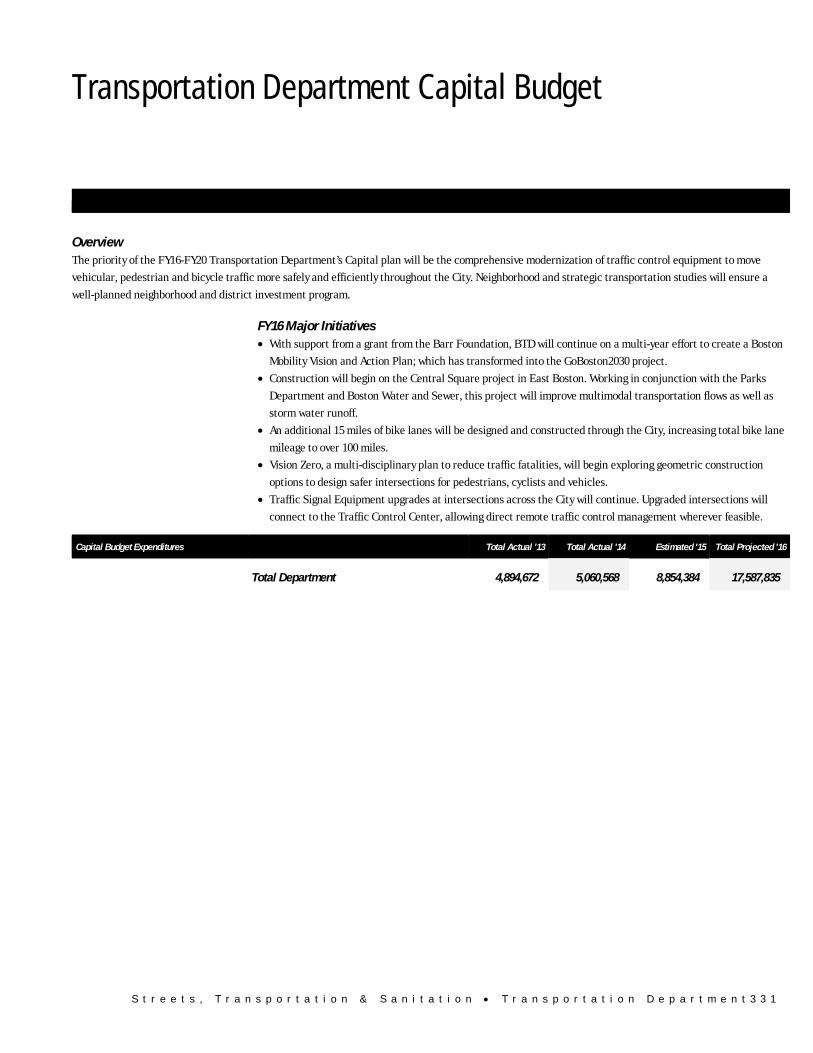
S t r e e t s , T r a n s p o r t a t i o n & S a n i t a t i o n • T r a n s p o r t a t i o n D e p a r t m e n t 3 3 1
Transportation Department Capital Budget
Streets, Transportation & Sanitation Transportation Department
Overview The priority of the FY16-FY20 Transportation Department’s Capital plan will be the comprehensive modernization of traffic control equipment to move
vehicular, pedestrian and bicycle traffic more safely and efficiently throughout the City. Neighborhood and strategic transportation studies will ensure a
well-planned neighborhood and district investment program.
FY16 Major Initiatives • With support from a grant from the Barr Foundation, BTD will continue on a multi-year effort to create a Boston
Mobility Vision and Action Plan; which has transformed into the GoBoston2030 project.
• Construction will begin on the Central Square project in East Boston. Working in conjunction with the Parks
Department and Boston Water and Sewer, this project will improve multimodal transportation flows as well as
storm water runoff.
• An additional 15 miles of bike lanes will be designed and constructed through the City, increasing total bike lane
mileage to over 100 miles.
• Vision Zero, a multi-disciplinary plan to reduce traffic fatalities, will begin exploring geometric construction
options to design safer intersections for pedestrians, cyclists and vehicles.
• Traffic Signal Equipment upgrades at intersections across the City will continue. Upgraded intersections will
connect to the Traffic Control Center, allowing direct remote traffic control management wherever feasible.
Capital Budget Expenditures Total Actual '13 Total Actual '14 Estimated '15 Total Projected '16
Total Department 4,894,672 5,060,568 8,854,384 17,587,835
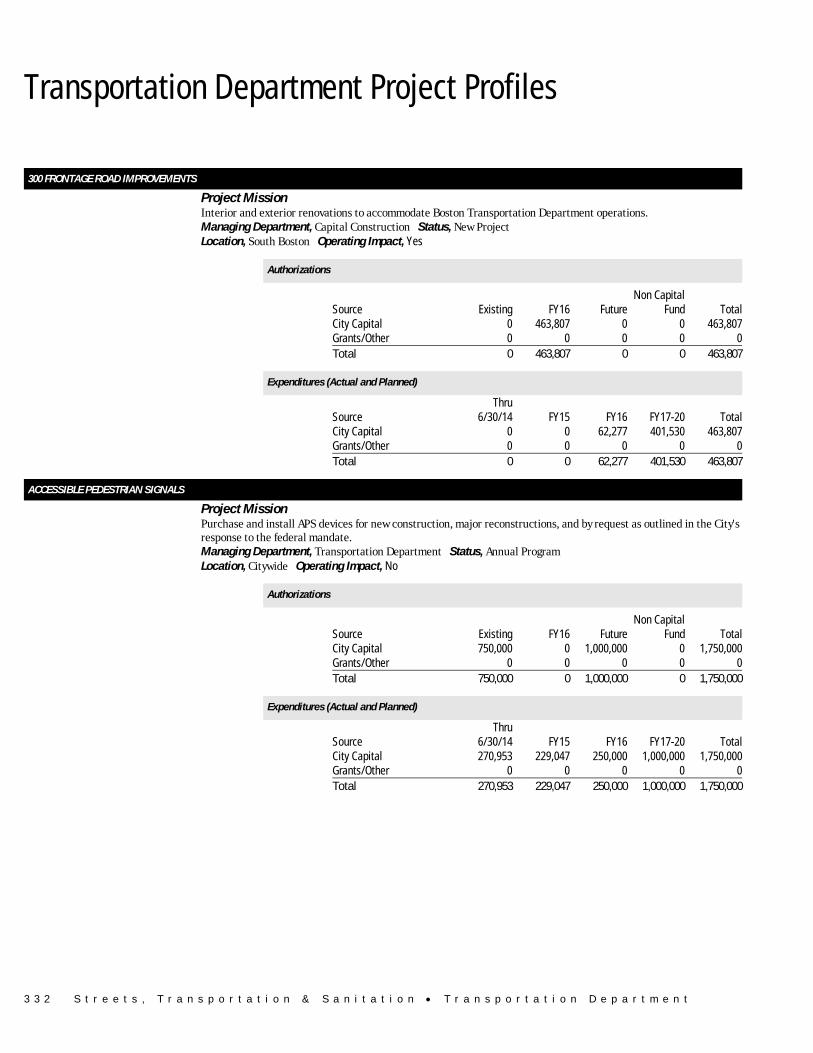
3 3 2 S t r e e t s , T r a n s p o r t a t i o n & S a n i t a t i o n • T r a n s p o r t a t i o n D e p a r t m e n t
Transportation Department Project Profiles
300 FRONTAGE ROAD IMPROVEMENTS Project Mission Interior and exterior renovations to accommodate Boston Transportation Department operations. Managing Department, Capital Construction Status, New Project Location, South Boston Operating Impact, Yes
Authorizations
Source Existing FY16 FutureNon Capital
Fund Total City Capital 0 463,807 0 0 463,807 Grants/Other 0 0 0 0 0 Total 0 463,807 0 0 463,807
Expenditures (Actual and Planned)
Source Thru
6/30/14 FY15 FY16 FY17-20 Total City Capital 0 0 62,277 401,530 463,807 Grants/Other 0 0 0 0 0 Total 0 0 62,277 401,530 463,807
ACCESSIBLE PEDESTRIAN SIGNALS Project Mission Purchase and install APS devices for new construction, major reconstructions, and by request as outlined in the City's
response to the federal mandate. Managing Department, Transportation Department Status, Annual Program Location, Citywide Operating Impact, No
Authorizations
Source Existing FY16 FutureNon Capital
Fund Total City Capital 750,000 0 1,000,000 0 1,750,000 Grants/Other 0 0 0 0 0 Total 750,000 0 1,000,000 0 1,750,000
Expenditures (Actual and Planned)
Source Thru
6/30/14 FY15 FY16 FY17-20 Total City Capital 270,953 229,047 250,000 1,000,000 1,750,000 Grants/Other 0 0 0 0 0 Total 270,953 229,047 250,000 1,000,000 1,750,000
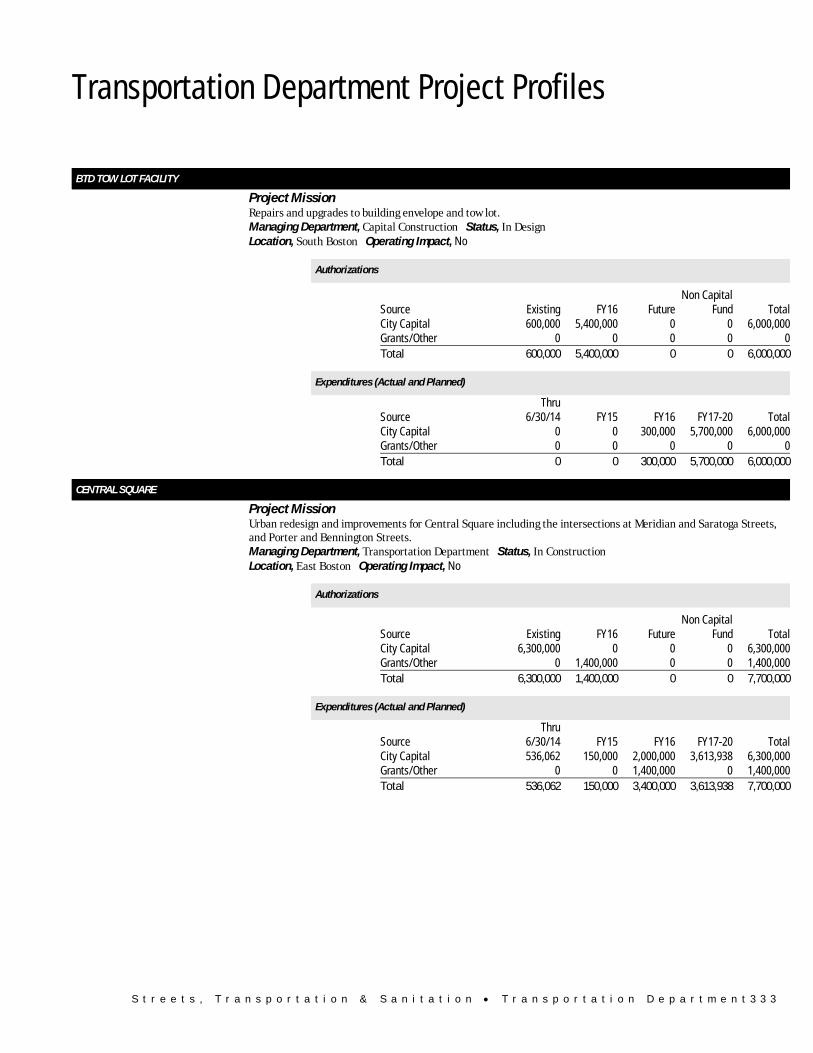
S t r e e t s , T r a n s p o r t a t i o n & S a n i t a t i o n • T r a n s p o r t a t i o n D e p a r t m e n t 3 3 3
Transportation Department Project Profiles
BTD TOW LOT FACILITY Project Mission Repairs and upgrades to building envelope and tow lot. Managing Department, Capital Construction Status, In Design Location, South Boston Operating Impact, No
Authorizations
Source Existing FY16 FutureNon Capital
Fund Total City Capital 600,000 5,400,000 0 0 6,000,000 Grants/Other 0 0 0 0 0 Total 600,000 5,400,000 0 0 6,000,000
Expenditures (Actual and Planned)
Source Thru
6/30/14 FY15 FY16 FY17-20 Total City Capital 0 0 300,000 5,700,000 6,000,000 Grants/Other 0 0 0 0 0 Total 0 0 300,000 5,700,000 6,000,000
CENTRAL SQUARE Project Mission Urban redesign and improvements for Central Square including the intersections at Meridian and Saratoga Streets,
and Porter and Bennington Streets. Managing Department, Transportation Department Status, In Construction Location, East Boston Operating Impact, No
Authorizations
Source Existing FY16 FutureNon Capital
Fund Total City Capital 6,300,000 0 0 0 6,300,000 Grants/Other 0 1,400,000 0 0 1,400,000 Total 6,300,000 1,400,000 0 0 7,700,000
Expenditures (Actual and Planned)
Source Thru
6/30/14 FY15 FY16 FY17-20 Total City Capital 536,062 150,000 2,000,000 3,613,938 6,300,000 Grants/Other 0 0 1,400,000 0 1,400,000 Total 536,062 150,000 3,400,000 3,613,938 7,700,000
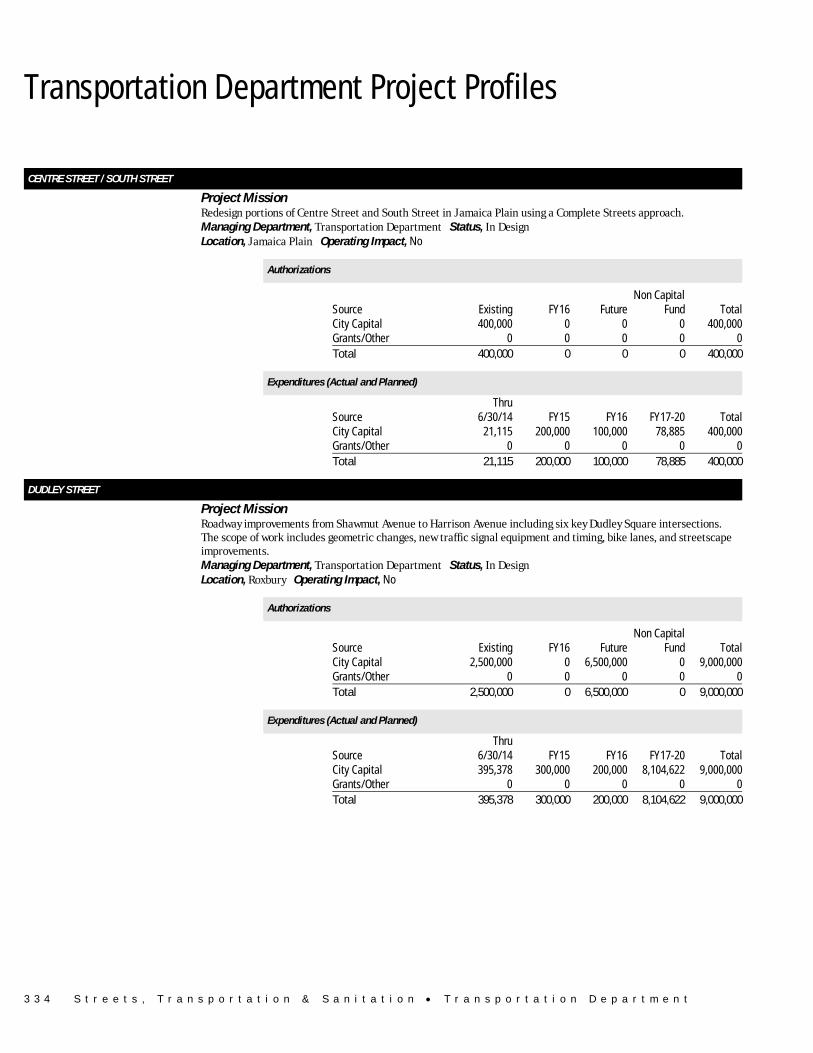
3 3 4 S t r e e t s , T r a n s p o r t a t i o n & S a n i t a t i o n • T r a n s p o r t a t i o n D e p a r t m e n t
Transportation Department Project Profiles
CENTRE STREET / SOUTH STREET Project Mission Redesign portions of Centre Street and South Street in Jamaica Plain using a Complete Streets approach. Managing Department, Transportation Department Status, In Design Location, Jamaica Plain Operating Impact, No
Authorizations
Source Existing FY16 FutureNon Capital
Fund Total City Capital 400,000 0 0 0 400,000 Grants/Other 0 0 0 0 0 Total 400,000 0 0 0 400,000
Expenditures (Actual and Planned)
Source Thru
6/30/14 FY15 FY16 FY17-20 Total City Capital 21,115 200,000 100,000 78,885 400,000 Grants/Other 0 0 0 0 0 Total 21,115 200,000 100,000 78,885 400,000
DUDLEY STREET Project Mission Roadway improvements from Shawmut Avenue to Harrison Avenue including six key Dudley Square intersections.
The scope of work includes geometric changes, new traffic signal equipment and timing, bike lanes, and streetscape improvements.
Managing Department, Transportation Department Status, In Design Location, Roxbury Operating Impact, No
Authorizations
Source Existing FY16 FutureNon Capital
Fund Total City Capital 2,500,000 0 6,500,000 0 9,000,000 Grants/Other 0 0 0 0 0 Total 2,500,000 0 6,500,000 0 9,000,000
Expenditures (Actual and Planned)
Source Thru
6/30/14 FY15 FY16 FY17-20 Total City Capital 395,378 300,000 200,000 8,104,622 9,000,000 Grants/Other 0 0 0 0 0 Total 395,378 300,000 200,000 8,104,622 9,000,000
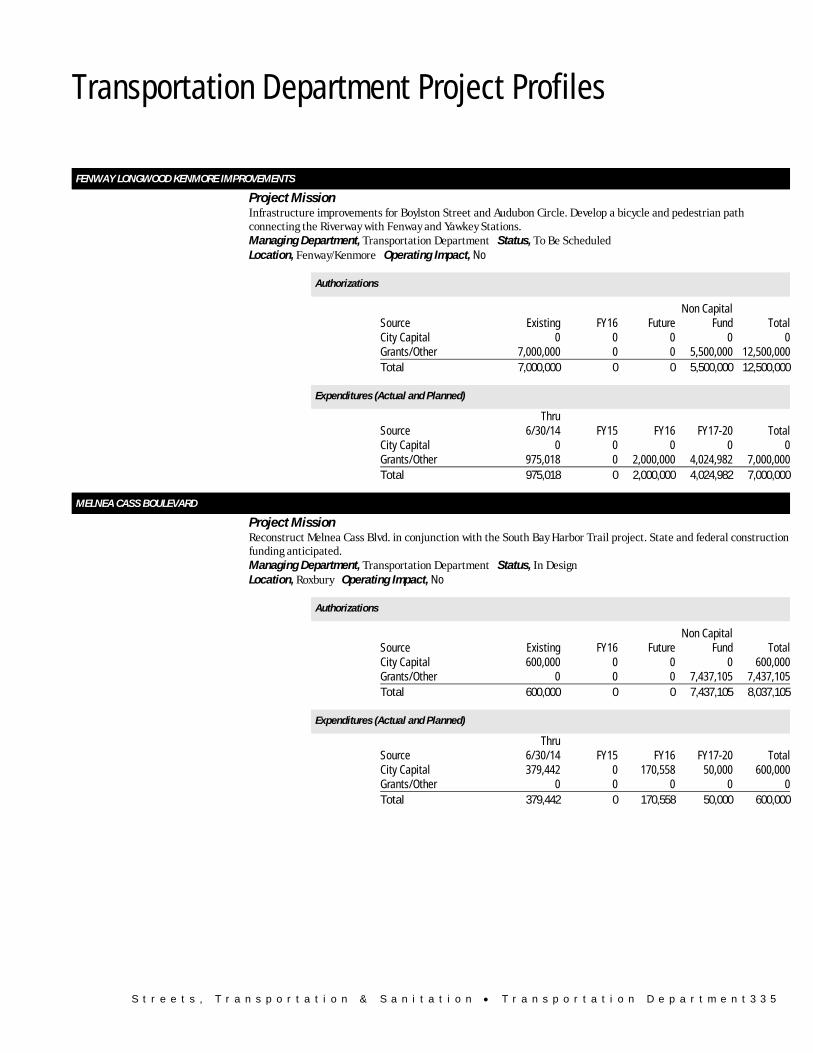
S t r e e t s , T r a n s p o r t a t i o n & S a n i t a t i o n • T r a n s p o r t a t i o n D e p a r t m e n t 3 3 5
Transportation Department Project Profiles
FENWAY LONGWOOD KENMORE IMPROVEMENTS Project Mission Infrastructure improvements for Boylston Street and Audubon Circle. Develop a bicycle and pedestrian path
connecting the Riverway with Fenway and Yawkey Stations. Managing Department, Transportation Department Status, To Be Scheduled Location, Fenway/Kenmore Operating Impact, No
Authorizations
Source Existing FY16 FutureNon Capital
Fund Total City Capital 0 0 0 0 0 Grants/Other 7,000,000 0 0 5,500,000 12,500,000 Total 7,000,000 0 0 5,500,000 12,500,000
Expenditures (Actual and Planned)
Source Thru
6/30/14 FY15 FY16 FY17-20 Total City Capital 0 0 0 0 0 Grants/Other 975,018 0 2,000,000 4,024,982 7,000,000 Total 975,018 0 2,000,000 4,024,982 7,000,000
MELNEA CASS BOULEVARD Project Mission Reconstruct Melnea Cass Blvd. in conjunction with the South Bay Harbor Trail project. State and federal construction
funding anticipated. Managing Department, Transportation Department Status, In Design Location, Roxbury Operating Impact, No
Authorizations
Source Existing FY16 FutureNon Capital
Fund Total City Capital 600,000 0 0 0 600,000 Grants/Other 0 0 0 7,437,105 7,437,105 Total 600,000 0 0 7,437,105 8,037,105
Expenditures (Actual and Planned)
Source Thru
6/30/14 FY15 FY16 FY17-20 Total City Capital 379,442 0 170,558 50,000 600,000 Grants/Other 0 0 0 0 0 Total 379,442 0 170,558 50,000 600,000
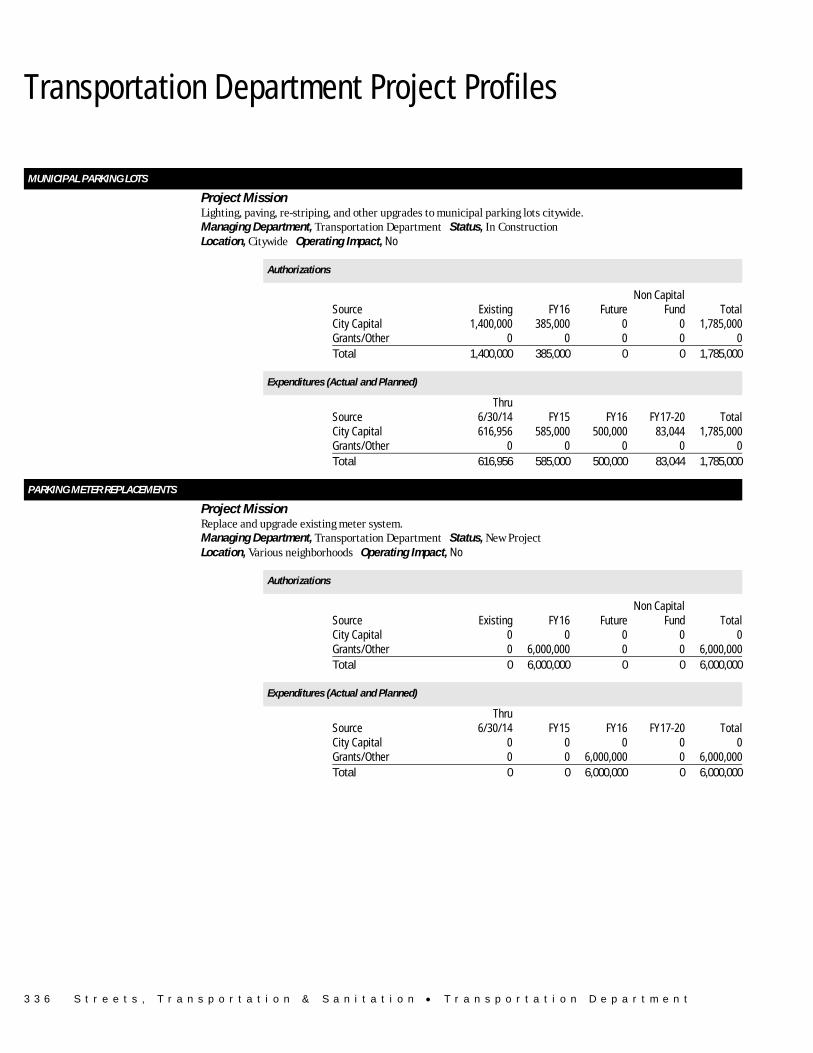
3 3 6 S t r e e t s , T r a n s p o r t a t i o n & S a n i t a t i o n • T r a n s p o r t a t i o n D e p a r t m e n t
Transportation Department Project Profiles
MUNICIPAL PARKING LOTS Project Mission Lighting, paving, re-striping, and other upgrades to municipal parking lots citywide. Managing Department, Transportation Department Status, In Construction Location, Citywide Operating Impact, No
Authorizations
Source Existing FY16 FutureNon Capital
Fund Total City Capital 1,400,000 385,000 0 0 1,785,000 Grants/Other 0 0 0 0 0 Total 1,400,000 385,000 0 0 1,785,000
Expenditures (Actual and Planned)
Source Thru
6/30/14 FY15 FY16 FY17-20 Total City Capital 616,956 585,000 500,000 83,044 1,785,000 Grants/Other 0 0 0 0 0 Total 616,956 585,000 500,000 83,044 1,785,000
PARKING METER REPLACEMENTS Project Mission Replace and upgrade existing meter system. Managing Department, Transportation Department Status, New Project Location, Various neighborhoods Operating Impact, No
Authorizations
Source Existing FY16 FutureNon Capital
Fund Total City Capital 0 0 0 0 0 Grants/Other 0 6,000,000 0 0 6,000,000 Total 0 6,000,000 0 0 6,000,000
Expenditures (Actual and Planned)
Source Thru
6/30/14 FY15 FY16 FY17-20 Total City Capital 0 0 0 0 0 Grants/Other 0 0 6,000,000 0 6,000,000 Total 0 0 6,000,000 0 6,000,000
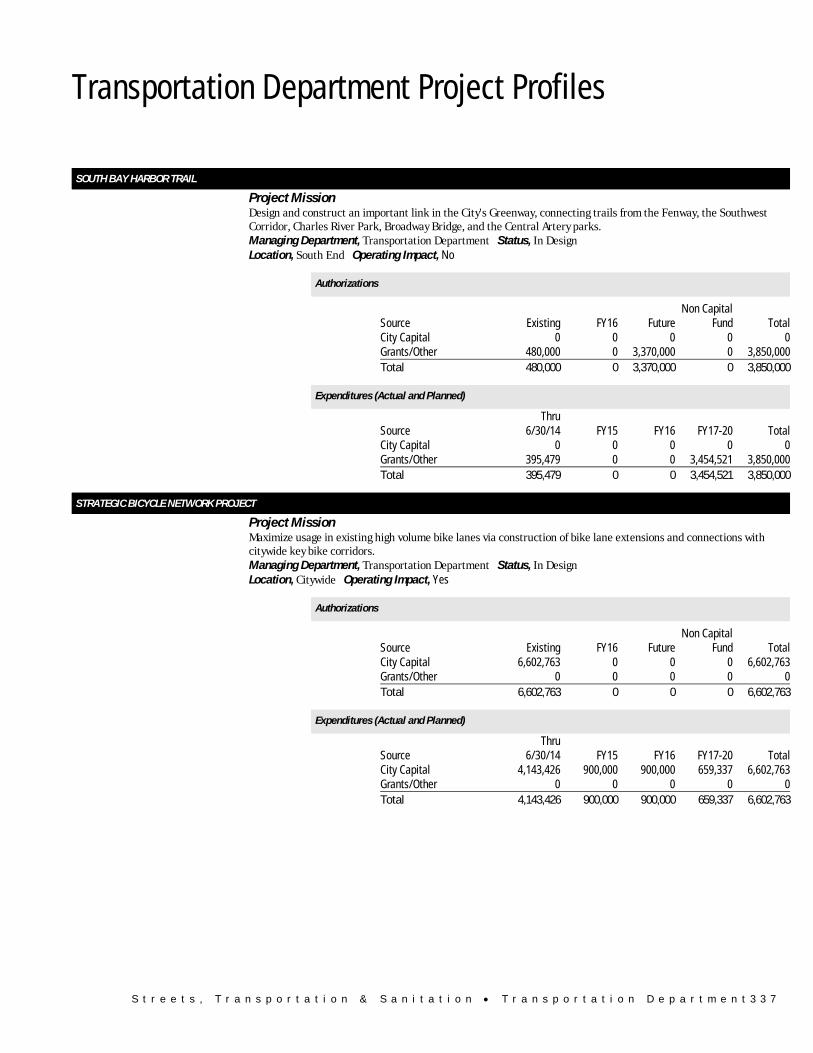
S t r e e t s , T r a n s p o r t a t i o n & S a n i t a t i o n • T r a n s p o r t a t i o n D e p a r t m e n t 3 3 7
Transportation Department Project Profiles
SOUTH BAY HARBOR TRAIL Project Mission Design and construct an important link in the City's Greenway, connecting trails from the Fenway, the Southwest
Corridor, Charles River Park, Broadway Bridge, and the Central Artery parks. Managing Department, Transportation Department Status, In Design Location, South End Operating Impact, No
Authorizations
Source Existing FY16 FutureNon Capital
Fund Total City Capital 0 0 0 0 0 Grants/Other 480,000 0 3,370,000 0 3,850,000 Total 480,000 0 3,370,000 0 3,850,000
Expenditures (Actual and Planned)
Source Thru
6/30/14 FY15 FY16 FY17-20 Total City Capital 0 0 0 0 0 Grants/Other 395,479 0 0 3,454,521 3,850,000 Total 395,479 0 0 3,454,521 3,850,000
STRATEGIC BICYCLE NETWORK PROJECT Project Mission Maximize usage in existing high volume bike lanes via construction of bike lane extensions and connections with
citywide key bike corridors. Managing Department, Transportation Department Status, In Design Location, Citywide Operating Impact, Yes
Authorizations
Source Existing FY16 FutureNon Capital
Fund Total City Capital 6,602,763 0 0 0 6,602,763 Grants/Other 0 0 0 0 0 Total 6,602,763 0 0 0 6,602,763
Expenditures (Actual and Planned)
Source Thru
6/30/14 FY15 FY16 FY17-20 Total City Capital 4,143,426 900,000 900,000 659,337 6,602,763 Grants/Other 0 0 0 0 0 Total 4,143,426 900,000 900,000 659,337 6,602,763
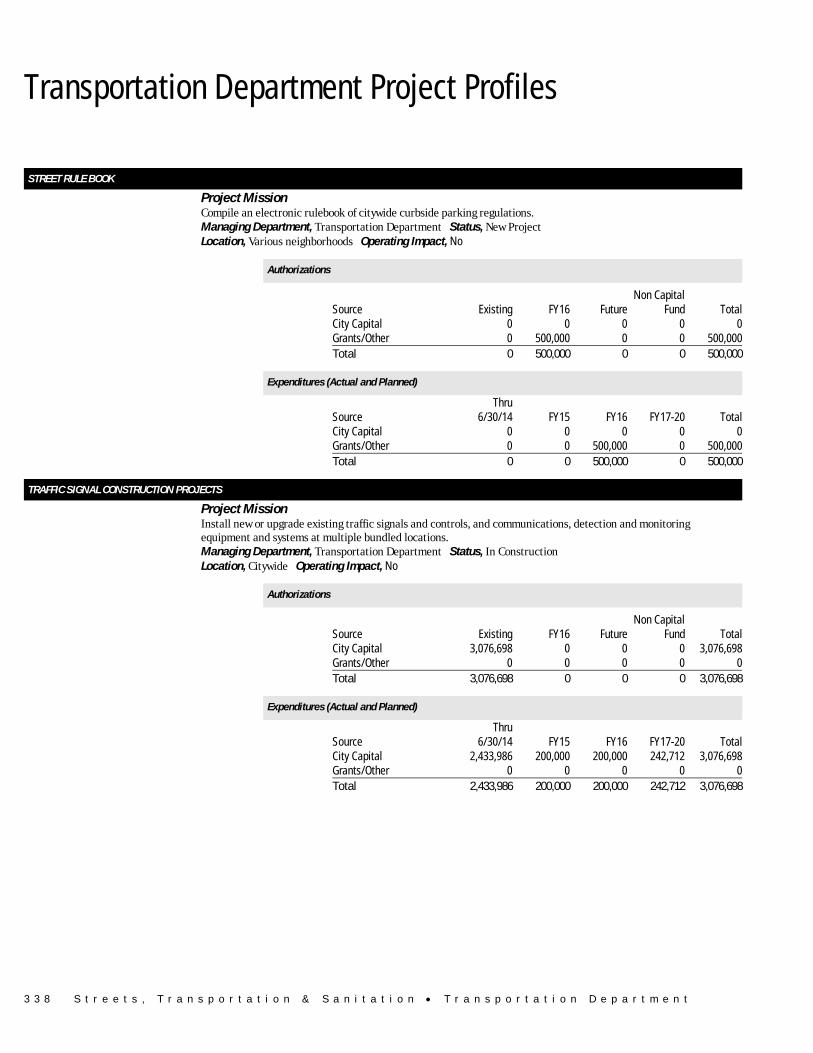
3 3 8 S t r e e t s , T r a n s p o r t a t i o n & S a n i t a t i o n • T r a n s p o r t a t i o n D e p a r t m e n t
Transportation Department Project Profiles
STREET RULE BOOK Project Mission Compile an electronic rulebook of citywide curbside parking regulations. Managing Department, Transportation Department Status, New Project Location, Various neighborhoods Operating Impact, No
Authorizations
Source Existing FY16 FutureNon Capital
Fund Total City Capital 0 0 0 0 0 Grants/Other 0 500,000 0 0 500,000 Total 0 500,000 0 0 500,000
Expenditures (Actual and Planned)
Source Thru
6/30/14 FY15 FY16 FY17-20 Total City Capital 0 0 0 0 0 Grants/Other 0 0 500,000 0 500,000 Total 0 0 500,000 0 500,000
TRAFFIC SIGNAL CONSTRUCTION PROJECTS Project Mission Install new or upgrade existing traffic signals and controls, and communications, detection and monitoring
equipment and systems at multiple bundled locations. Managing Department, Transportation Department Status, In Construction Location, Citywide Operating Impact, No
Authorizations
Source Existing FY16 FutureNon Capital
Fund Total City Capital 3,076,698 0 0 0 3,076,698 Grants/Other 0 0 0 0 0 Total 3,076,698 0 0 0 3,076,698
Expenditures (Actual and Planned)
Source Thru
6/30/14 FY15 FY16 FY17-20 Total City Capital 2,433,986 200,000 200,000 242,712 3,076,698 Grants/Other 0 0 0 0 0 Total 2,433,986 200,000 200,000 242,712 3,076,698
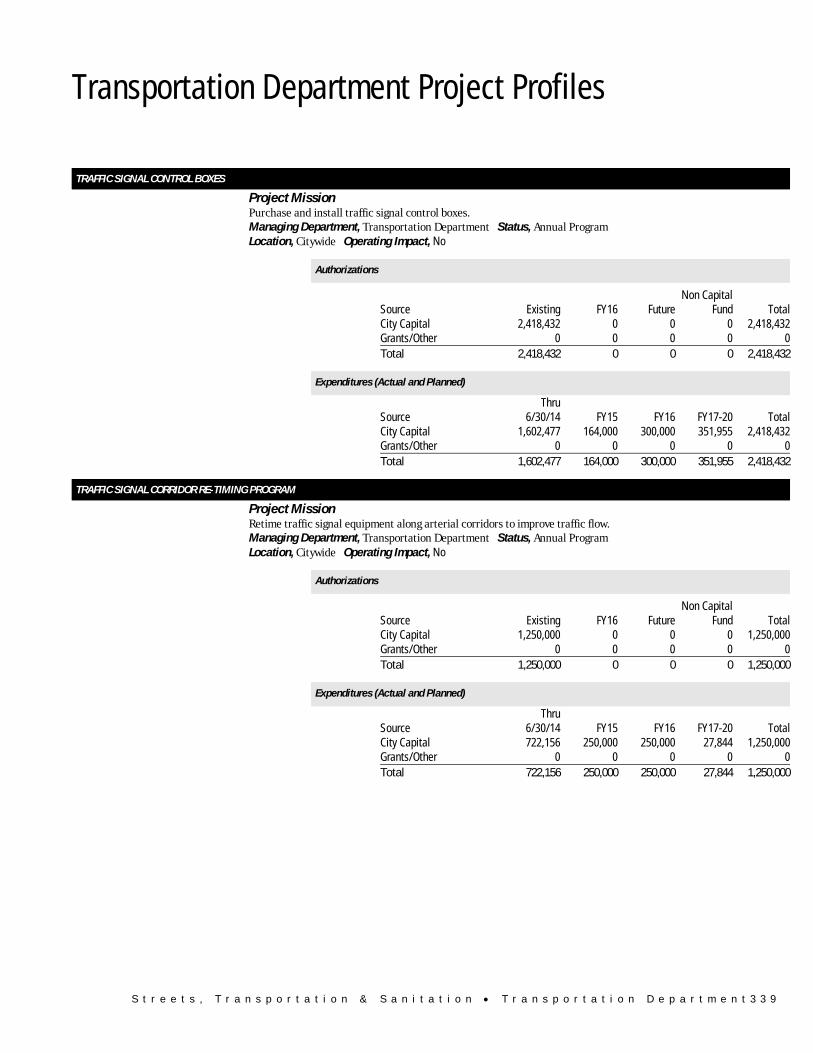
S t r e e t s , T r a n s p o r t a t i o n & S a n i t a t i o n • T r a n s p o r t a t i o n D e p a r t m e n t 3 3 9
Transportation Department Project Profiles
TRAFFIC SIGNAL CONTROL BOXES Project Mission Purchase and install traffic signal control boxes. Managing Department, Transportation Department Status, Annual Program Location, Citywide Operating Impact, No
Authorizations
Source Existing FY16 FutureNon Capital
Fund Total City Capital 2,418,432 0 0 0 2,418,432 Grants/Other 0 0 0 0 0 Total 2,418,432 0 0 0 2,418,432
Expenditures (Actual and Planned)
Source Thru
6/30/14 FY15 FY16 FY17-20 Total City Capital 1,602,477 164,000 300,000 351,955 2,418,432 Grants/Other 0 0 0 0 0 Total 1,602,477 164,000 300,000 351,955 2,418,432
TRAFFIC SIGNAL CORRIDOR RE-TIMING PROGRAM Project Mission Retime traffic signal equipment along arterial corridors to improve traffic flow. Managing Department, Transportation Department Status, Annual Program Location, Citywide Operating Impact, No
Authorizations
Source Existing FY16 FutureNon Capital
Fund Total City Capital 1,250,000 0 0 0 1,250,000 Grants/Other 0 0 0 0 0 Total 1,250,000 0 0 0 1,250,000
Expenditures (Actual and Planned)
Source Thru
6/30/14 FY15 FY16 FY17-20 Total City Capital 722,156 250,000 250,000 27,844 1,250,000 Grants/Other 0 0 0 0 0 Total 722,156 250,000 250,000 27,844 1,250,000
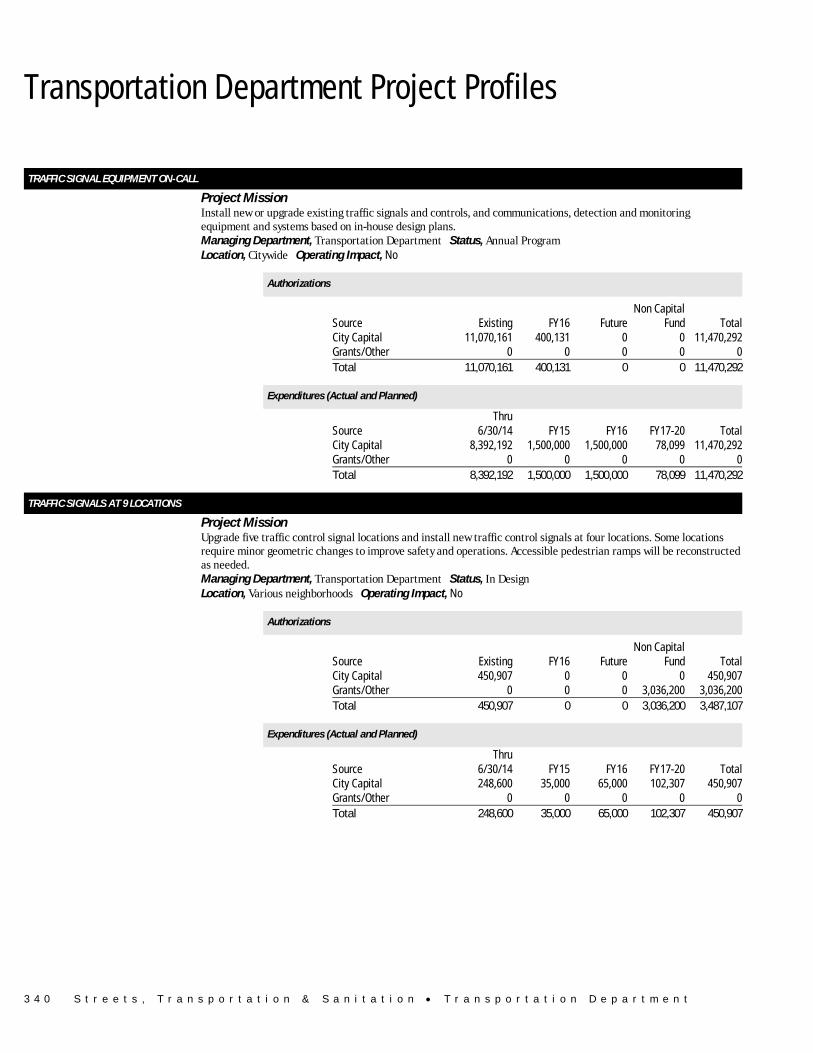
3 4 0 S t r e e t s , T r a n s p o r t a t i o n & S a n i t a t i o n • T r a n s p o r t a t i o n D e p a r t m e n t
Transportation Department Project Profiles
TRAFFIC SIGNAL EQUIPMENT ON-CALL Project Mission Install new or upgrade existing traffic signals and controls, and communications, detection and monitoring
equipment and systems based on in-house design plans. Managing Department, Transportation Department Status, Annual Program Location, Citywide Operating Impact, No
Authorizations
Source Existing FY16 FutureNon Capital
Fund Total City Capital 11,070,161 400,131 0 0 11,470,292 Grants/Other 0 0 0 0 0 Total 11,070,161 400,131 0 0 11,470,292
Expenditures (Actual and Planned)
Source Thru
6/30/14 FY15 FY16 FY17-20 Total City Capital 8,392,192 1,500,000 1,500,000 78,099 11,470,292 Grants/Other 0 0 0 0 0 Total 8,392,192 1,500,000 1,500,000 78,099 11,470,292
TRAFFIC SIGNALS AT 9 LOCATIONS Project Mission Upgrade five traffic control signal locations and install new traffic control signals at four locations. Some locations
require minor geometric changes to improve safety and operations. Accessible pedestrian ramps will be reconstructed as needed.
Managing Department, Transportation Department Status, In Design Location, Various neighborhoods Operating Impact, No
Authorizations
Source Existing FY16 FutureNon Capital
Fund Total City Capital 450,907 0 0 0 450,907 Grants/Other 0 0 0 3,036,200 3,036,200 Total 450,907 0 0 3,036,200 3,487,107
Expenditures (Actual and Planned)
Source Thru
6/30/14 FY15 FY16 FY17-20 Total City Capital 248,600 35,000 65,000 102,307 450,907 Grants/Other 0 0 0 0 0 Total 248,600 35,000 65,000 102,307 450,907
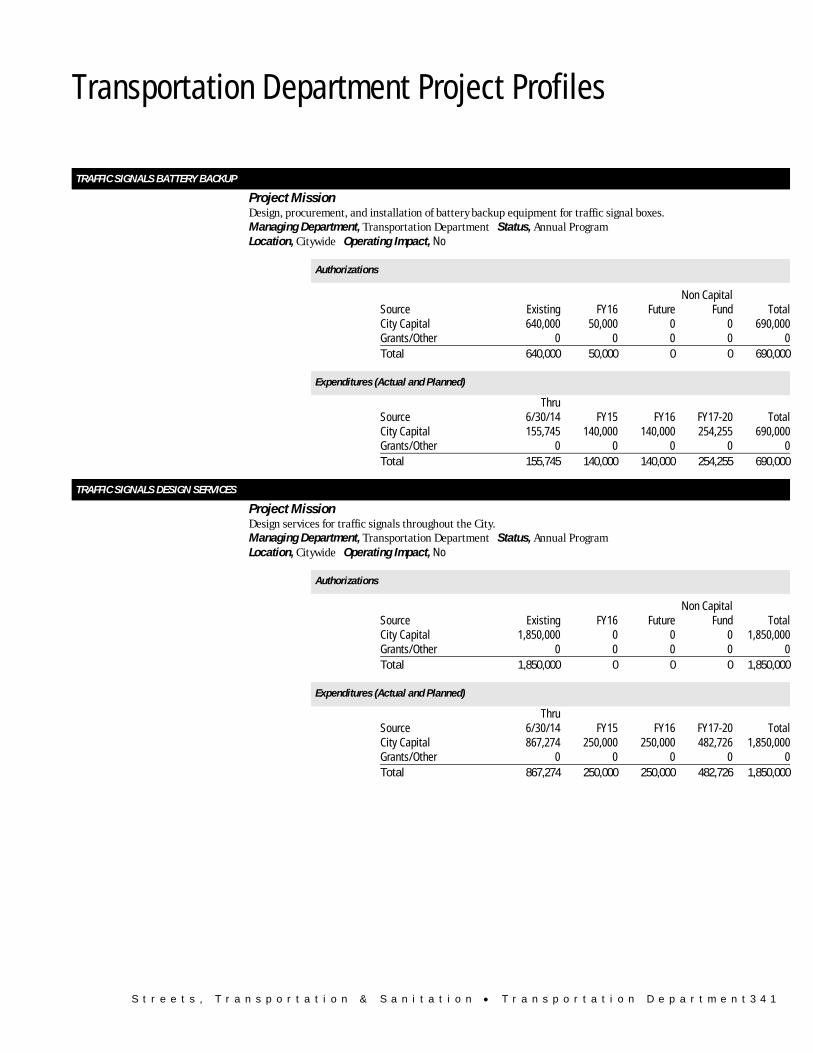
S t r e e t s , T r a n s p o r t a t i o n & S a n i t a t i o n • T r a n s p o r t a t i o n D e p a r t m e n t 3 4 1
Transportation Department Project Profiles
TRAFFIC SIGNALS BATTERY BACKUP Project Mission Design, procurement, and installation of battery backup equipment for traffic signal boxes. Managing Department, Transportation Department Status, Annual Program Location, Citywide Operating Impact, No
Authorizations
Source Existing FY16 FutureNon Capital
Fund Total City Capital 640,000 50,000 0 0 690,000 Grants/Other 0 0 0 0 0 Total 640,000 50,000 0 0 690,000
Expenditures (Actual and Planned)
Source Thru
6/30/14 FY15 FY16 FY17-20 Total City Capital 155,745 140,000 140,000 254,255 690,000 Grants/Other 0 0 0 0 0 Total 155,745 140,000 140,000 254,255 690,000
TRAFFIC SIGNALS DESIGN SERVICES Project Mission Design services for traffic signals throughout the City. Managing Department, Transportation Department Status, Annual Program Location, Citywide Operating Impact, No
Authorizations
Source Existing FY16 FutureNon Capital
Fund Total City Capital 1,850,000 0 0 0 1,850,000 Grants/Other 0 0 0 0 0 Total 1,850,000 0 0 0 1,850,000
Expenditures (Actual and Planned)
Source Thru
6/30/14 FY15 FY16 FY17-20 Total City Capital 867,274 250,000 250,000 482,726 1,850,000 Grants/Other 0 0 0 0 0 Total 867,274 250,000 250,000 482,726 1,850,000
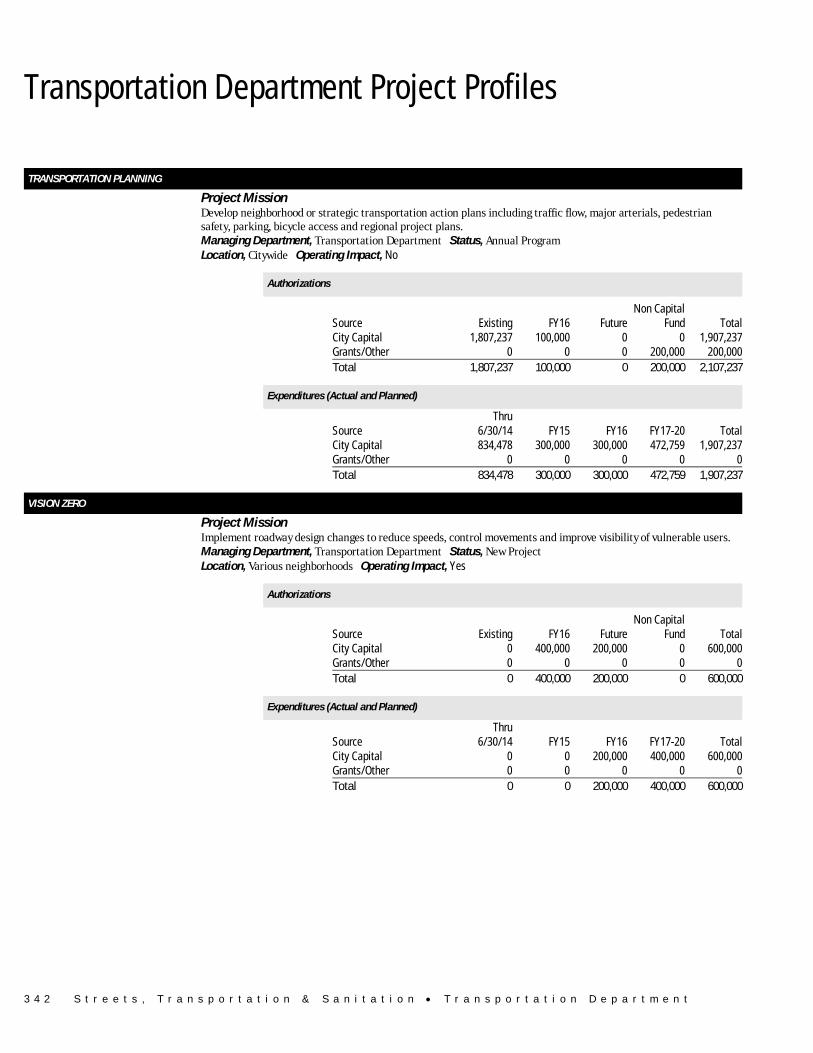
3 4 2 S t r e e t s , T r a n s p o r t a t i o n & S a n i t a t i o n • T r a n s p o r t a t i o n D e p a r t m e n t
Transportation Department Project Profiles
TRANSPORTATION PLANNING Project Mission Develop neighborhood or strategic transportation action plans including traffic flow, major arterials, pedestrian
safety, parking, bicycle access and regional project plans. Managing Department, Transportation Department Status, Annual Program Location, Citywide Operating Impact, No
Authorizations
Source Existing FY16 FutureNon Capital
Fund Total City Capital 1,807,237 100,000 0 0 1,907,237 Grants/Other 0 0 0 200,000 200,000 Total 1,807,237 100,000 0 200,000 2,107,237
Expenditures (Actual and Planned)
Source Thru
6/30/14 FY15 FY16 FY17-20 Total City Capital 834,478 300,000 300,000 472,759 1,907,237 Grants/Other 0 0 0 0 0 Total 834,478 300,000 300,000 472,759 1,907,237
VISION ZERO Project Mission Implement roadway design changes to reduce speeds, control movements and improve visibility of vulnerable users. Managing Department, Transportation Department Status, New Project Location, Various neighborhoods Operating Impact, Yes
Authorizations
Source Existing FY16 FutureNon Capital
Fund Total City Capital 0 400,000 200,000 0 600,000 Grants/Other 0 0 0 0 0 Total 0 400,000 200,000 0 600,000
Expenditures (Actual and Planned)
Source Thru
6/30/14 FY15 FY16 FY17-20 Total City Capital 0 0 200,000 400,000 600,000 Grants/Other 0 0 0 0 0 Total 0 0 200,000 400,000 600,000
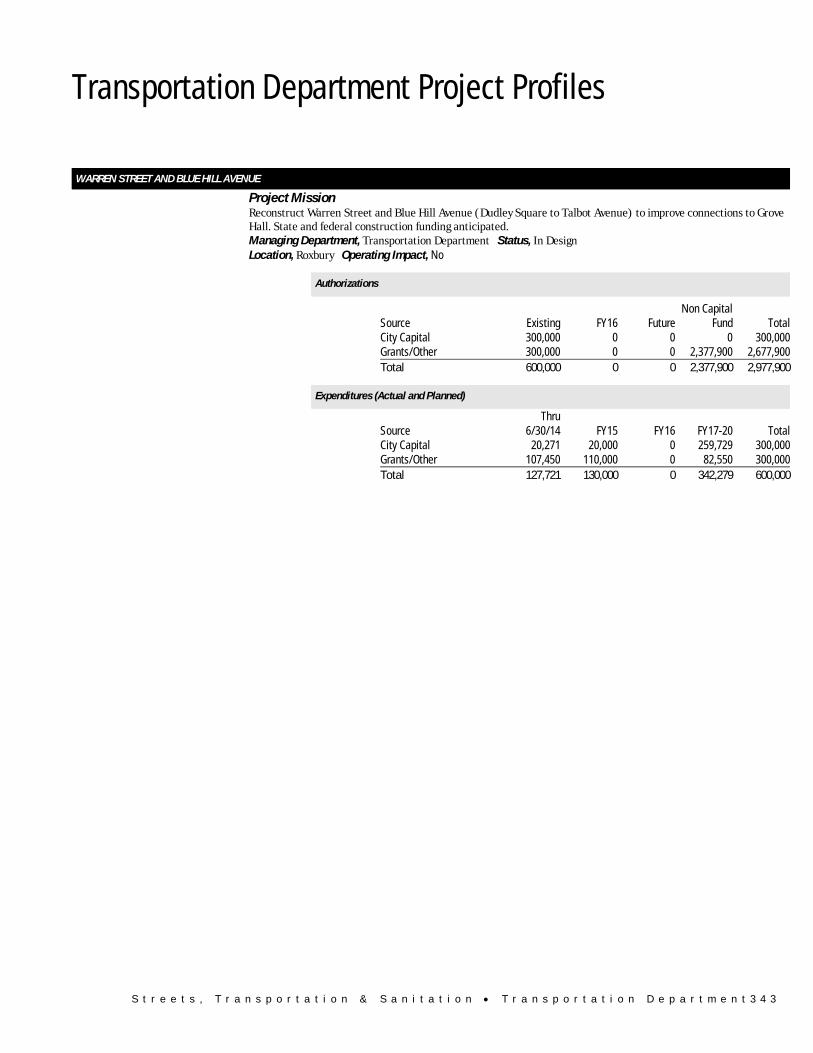
S t r e e t s , T r a n s p o r t a t i o n & S a n i t a t i o n • T r a n s p o r t a t i o n D e p a r t m e n t 3 4 3
Transportation Department Project Profiles
WARREN STREET AND BLUE HILL AVENUE Project Mission Reconstruct Warren Street and Blue Hill Avenue (Dudley Square to Talbot Avenue) to improve connections to Grove
Hall. State and federal construction funding anticipated. Managing Department, Transportation Department Status, In Design Location, Roxbury Operating Impact, No
Authorizations
Source Existing FY16 FutureNon Capital
Fund Total City Capital 300,000 0 0 0 300,000 Grants/Other 300,000 0 0 2,377,900 2,677,900 Total 600,000 0 0 2,377,900 2,977,900
Expenditures (Actual and Planned)
Source Thru
6/30/14 FY15 FY16 FY17-20 Total City Capital 20,271 20,000 0 259,729 300,000 Grants/Other 107,450 110,000 0 82,550 300,000 Total 127,721 130,000 0 342,279 600,000