Embed Size (px)
Citation preview
u
Tri-State Generation and Transmission Association, Inc.
and
Sunflower Electric Power Corporation Holcomb Expansion Project Coal Technology Selection Study Update
Final Report Project Number: 167721 File Number: 40.1200
June 18, 2010
Black & Veatch Corporation 11401 Lamar
Overland Park, Kansas 66211 Tel: (913) 458-2000 www.bv.com
Holcomb Expansion Project Coal Technology Selection Study Update
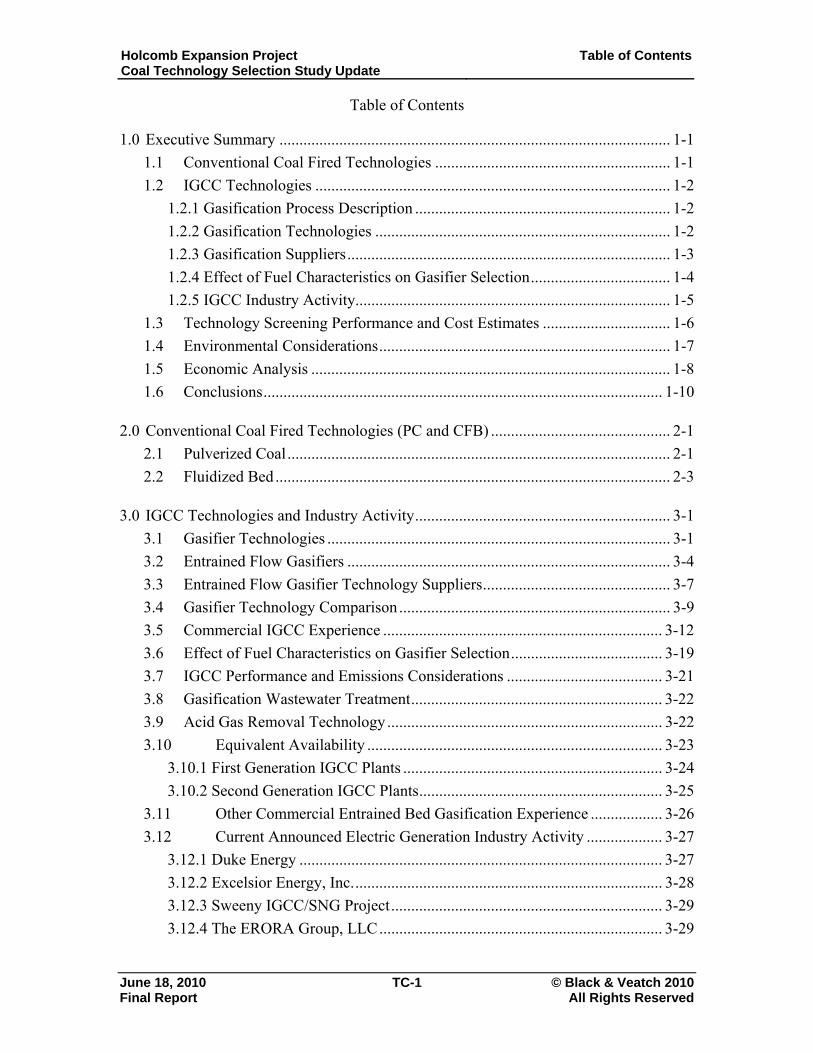
Table of Contents
June 18, 2010 TC-1 © Black & Veatch 2010 Final Report All Rights Reserved
Table of Contents
1.0 Executive Summary .................................................................................................. 1-1
1.1 Conventional Coal Fired Technologies ........................................................... 1-1
1.2 IGCC Technologies ......................................................................................... 1-2
1.2.1 Gasification Process Description ................................................................ 1-2
1.2.2 Gasification Technologies .......................................................................... 1-2
1.2.3 Gasification Suppliers................................................................................. 1-3
1.2.4 Effect of Fuel Characteristics on Gasifier Selection................................... 1-4
1.2.5 IGCC Industry Activity............................................................................... 1-5
1.3 Technology Screening Performance and Cost Estimates ................................ 1-6
1.4 Environmental Considerations......................................................................... 1-7
1.5 Economic Analysis .......................................................................................... 1-8
1.6 Conclusions.................................................................................................... 1-10
2.0 Conventional Coal Fired Technologies (PC and CFB) ............................................. 2-1
2.1 Pulverized Coal................................................................................................ 2-1
2.2 Fluidized Bed................................................................................................... 2-3
3.0 IGCC Technologies and Industry Activity................................................................ 3-1
3.1 Gasifier Technologies ...................................................................................... 3-1
3.2 Entrained Flow Gasifiers ................................................................................. 3-4
3.3 Entrained Flow Gasifier Technology Suppliers............................................... 3-7
3.4 Gasifier Technology Comparison .................................................................... 3-9
3.5 Commercial IGCC Experience ...................................................................... 3-12
3.6 Effect of Fuel Characteristics on Gasifier Selection...................................... 3-19
3.7 IGCC Performance and Emissions Considerations ....................................... 3-21
3.8 Gasification Wastewater Treatment............................................................... 3-22
3.9 Acid Gas Removal Technology..................................................................... 3-22
3.10 Equivalent Availability .......................................................................... 3-23
3.10.1 First Generation IGCC Plants ................................................................. 3-24
3.10.2 Second Generation IGCC Plants............................................................. 3-25
3.11 Other Commercial Entrained Bed Gasification Experience .................. 3-26
3.12 Current Announced Electric Generation Industry Activity ................... 3-27
3.12.1 Duke Energy ........................................................................................... 3-27
3.12.2 Excelsior Energy, Inc.............................................................................. 3-28
3.12.3 Sweeny IGCC/SNG Project.................................................................... 3-29
3.12.4 The ERORA Group, LLC....................................................................... 3-29
Holcomb Expansion Project Coal Technology Selection Study Update
Table of Contents
June 18, 2010 TC-2 © Black & Veatch 2010 Final Report All Rights Reserved
3.12.5 Mississippi Power ................................................................................... 3-30
3.12.6 Summary of Proposed Projects............................................................... 3-31
4.0 Technology Screening Performance and Cost Estimates.......................................... 4-1
4.1 Assumptions..................................................................................................... 4-1
4.1.1 Overall Assumptions................................................................................... 4-1
4.1.2 Thermal Unit Cycle Arrangement Assumptions......................................... 4-3
4.1.3 IGCC Cycle Arrangement Assumptions..................................................... 4-5
4.2 Performance Cases........................................................................................... 4-7
4.2.1 PC and CFB Cases ...................................................................................... 4-7
4.2.2 IGCC Cases................................................................................................. 4-7
4.3 Emissions ....................................................................................................... 4-11
4.4 Capital Costs .................................................................................................. 4-11
4.5 Nonfuel O&M Costs ...................................................................................... 4-14
5.0 Economic Analysis.................................................................................................. 5-15
5.1 Economic Criteria .......................................................................................... 5-15
5.2 Busbar Analysis ............................................................................................. 5-15
6.0 Conclusions ............................................................................................................... 6-1
List of Tables
Table 1-1. Summary of Performance and Cost Estimates .............................................. 1-7
Table 1-2. Expected Emission Rate Performance........................................................... 1-8
Table 1-3. Busbar Results ............................................................................................... 1-9
Table 3-1. Gasifier Technologies.................................................................................... 3-3
Table 3-2. Comparison of Key Gasifier Design Parameters......................................... 3-11
Table 3-3. IGCC Projects--All Fuels ............................................................................ 3-13
Table 3-4. Coal-Based IGCC Demonstration Plants .................................................... 3-15
Table 3-5. As-Received Coal Properties of Typical Coals ........................................... 3-20
Table 3-6. Coal/Coke Fueled IGCC Plant Equivalent Availabilities ........................... 3-25
Table 3-7. Estimated Equivalent Availabilities for Shell IGCC................................... 3-26
Table 4-1. Dry Fork Mine PRB Coal Properties............................................................. 4-2
Table 4-2. PC and CFB Cycle Arrangement Assumptions............................................. 4-4
Table 4-3. IGCC Cycle Arrangement Assumptions ....................................................... 4-7
Table 4-4. Supercritical PC Performance Estimates....................................................... 4-8
Table 4-5. Subcritical PC Performance Estimates.......................................................... 4-9
Holcomb Expansion Project Coal Technology Selection Study Update
Table of Contents
June 18, 2010 TC-3 © Black & Veatch 2010 Final Report All Rights Reserved
Table 4-6. CFB Performance Estimates.......................................................................... 4-9
Table 4-7. 3-on-1 GE 7F-SG IGCC Performance Estimates........................................ 4-10
Table 4-8. Expected Emission Rate Performance......................................................... 4-11
Table 4-9. Overnight Capital Cost Estimates (2010$).................................................. 4-12
Table 4-10. Potential Owner’s Costs ............................................................................ 4-13
Table 4-11. O&M Consumables Cost Assumptions (2010$) ....................................... 4-14
Table 4-12. Estimated O&M Costs at Average Ambient Conditions (2010$) ............. 4-14
Table 5-1. Economic Criteria........................................................................................ 5-15
Table 5-2. Fuel Forecast, PRB Coal ............................................................................. 5-16
Table 5-3. Summary of Performance and Cost Estimates ............................................ 5-17
Table 5-4. Busbar Results ............................................................................................. 5-18
List of Figures Figure 1-1. Levelized Busbar Cost Comparison............................................................. 1-9
Figure 2-1. Environmental Benefits of CFB Technology............................................... 2-5
Figure 3-1. IGCC Process Flow Diagram....................................................................... 3-4
Figure 3-2. Potential Areas for Integration ................................................................... 3-19
Figure 5-1. Levelized Busbar Cost Comparison........................................................... 5-18
Holcomb Expansion Project Coal Technology Selection Study Update
Acronym List
June 18, 2010 AL-1 © Black & Veatch 2010 Final Report All Rights Reserved
Acronym List
ACI Activated Carbon Injection
AEP American Electric Power
AFBC Atmospheric Fluidized Bed Combustion
AGR Acid Gas Removal
ASU Air Separation Unit
BACT Best Available Control Technology
BFB Bubbling Fluidized Bed
Ca/S Calcium to Sulfur
CaO Calcium Oxide
CaS Calcium Sulfide
CaSO4 Calcium Sulfate
CC Combined Cycle
CCPI Clean Coal Power Initiative
CCRB Clean Coal Review Board
CFB Circulating Fluidized Bed
CO Carbon Monoxide
CO2 Carbon Dioxide
COP ConocoPhillips
COS Carbonyl Sulfide
CTG Combustion Turbine Generator
DA Deaerator
DLN Dry-low NOx
DOE Department of Energy
EIS Environmental Impact Statement
EPC Engineering, Procurement, and Construction
EPRI Electric Power Research Institute
FBC Fluidized Bed Combustion
FEED Front End Engineering Design
FGD Flue Gas Desulfurization
FWH Feed Water Heater
GE General Electric
GEC Gasification Engineering Corporation
H2S Hydrogen Sulfide
H2SO4 Sulfuric Acid
HCl Hydrogen Chloride
HCN Hydrogen Cyanide
Holcomb Expansion Project Coal Technology Selection Study Update
Acronym List
June 18, 2010 AL-2 © Black & Veatch 2010 Final Report All Rights Reserved
Hg Mercury
HHV Higher Heating Value
HP High-Pressure
HRSG Heat Recovery Steam Generator
HTHR High Temperature Heat Recovery
IGCC Integrated Gasification Combined Cycle
ISO International Standards Organization
KBR Kellogg Brown and Root
LHV Lower Heating Value
LP Low-Pressure
LSB Last-Stage Blade
MDEA Methyl Diethanol Amine
MHI Mitsubishi Heavy Industries
N2 Nitrogen
NEPA National Environmental Policy Act
NGCC Natural Gas-fired Combined Cycle
NH3 Ammonia
NOx Oxides of Nitrogen
NPHR Net Plant Heat Rate
O2 Oxygen
O&M Operations and Maintenance
OUC Orlando Utilities Commission
PC Pulverized Coal
petcoke Petroleum Coke
PM Particulate Matter
PPA Power Purchase Agreement
PRB Powder River Basin
PSDF Power Systems Development Facility
PUCO Public Utilities Commission of Ohio
RFP Request for Proposal
SCR Selective Catalytic Reduction
SO2 Sulfur Dioxide
SNCR Selective Noncatalytic Reduction
SPG Siemens Power Generation
STG Steam Turbine Generator
SPG Siemens Power Generation
SWEPCO Southwestern Electric Power Company
Holcomb Expansion Project Coal Technology Selection Study Update
Acronym List
June 18, 2010 AL-3 © Black & Veatch 2010 Final Report All Rights Reserved
syngas Synthetic Gas
TC Tandem Compound
TRIG™ Transport Reactor Integrated Gasification
US United States
VWO Valves Wide Open
WHB Waste Heat Boiler
ZLD Zero Liquid Discharge
4F Four-Flow
Holcomb Expansion Project Coal Technology Selection Study Update
Units of Measure
June 18, 2010 UM-1 © Black & Veatch 2010 Final Report All Rights Reserved
Units of Measure ¢ cents
$ dollar
% percent
° F degrees Fahrenheit
Btu British thermal unit
ft foot
ft3 cubic feet
h hour
in. HgA inches mercury absolute
kW kilowatt
lb pound
ltpd long tons per day (2,200 lb/day)
m3 cubic meters
MBtu million British thermal unit
mg milligrams
MW megawatt
MWh megawatt-hour
ppb parts per billion
ppm parts per million
ppmvd parts per million volumetric dry
psia pounds per square inch absolute
psig pounds per square inch gauge
scf standard cubic feet
sec second
stpd short tons per day (2,000 lb/day)
tpd tons per day
yr year
Holcomb Expansion Project Coal Technology Selection Study Update
1.0 Executive Summary
June 18, 2010 1-1 © Black & Veatch 2010 Final Report All Rights Reserved
1.0 Executive Summary
Black & Veatch was retained to perform a coal technology selection study for the
Holcomb Expansion Project (Expansion Project). The study compared subcritical and
supercritical pulverized coal (PC), circulating fluidized bed (CFB), and integrated
gasification combined cycle (IGCC) technologies. Performance and cost estimates were
based on the use of Dry Fork Mine Powder River Basin (PRB) coal at the existing
Holcomb plant site. A busbar economic analysis was also performed.
1.1 Conventional Coal Fired Technologies Coal is the most widely used fuel for the production of power in the United States
(US), and most coal burning power plants use PC boilers. PC units have the advantage of
utilizing a proven technology with a high reliability level. PC units are relatively easy to
operate and maintain. PC boilers are operating with steaming capacities sufficient to
support up to 1,000 MW or more of electrical generation. For these larger units,
economies of scale result in reduced busbar costs compared to smaller units. Realization
of the economies of scale for PC boilers has led to the construction of units
predominantly larger than 250 MW. These units can be designed to operate with
supercritical steam conditions which improve overall plant efficiency and reduce fuel
costs and the total mass of flue gas emissions compared to smaller subcritical units.
During the 1980s, fluidized bed combustion (FBC) emerged as a viable
alternative to PC-fueled units for the combustion of solid fuels. FBC was applied to the
electric utility industry because of its perceived air emission advantages over competing
combustion technologies. Sulfur dioxide (SO2) emissions could be controlled from FBC
units without the use of external scrubbers, and oxides of nitrogen (NOx) emissions from
FBC units were inherently low. Furthermore, FBC units were touted as being “fuel
flexible,” with the capability of firing a wide range of solid fuels with varying heating
value, ash content, and moisture content. CFB boilers are the most common type of FBC
for coal fired projects.
Even though CFB boilers have been providing steam for electric power
generation for more than 20 years, the steaming capacities have been limited to less than
150 MW in most cases. Over the past decade, the offered capacity by CFB boiler
vendors has increased. Both Foster Wheeler and Babcock & Wilcox now offer CFB
boilers with capacities over 600 MW. To date, the largest CFB boiler to be constructed is
the 460 MW unit supplied by Foster Wheeler for PKE - Elektrownia Lagisza in Lagisza,
Poland. This CFB boiler is a supercritical reheat boiler and is currently under
commissioning and is planned to fire bituminous coal and coal slurry as a primary and
Holcomb Expansion Project Coal Technology Selection Study Update
1.0 Executive Summary
June 18, 2010 1-2 © Black & Veatch 2010 Final Report All Rights Reserved
secondary fuel, respectively. Several other CFB boilers in the 300 MW class have been
developed over the past decade. Black & Veatch is aware of two new plants currently
under construction in the U.S. Some of the earliest 300 MW class CFB boilers were
installed at the JEA Northside Generating station in Northside, Florida. This unit consists
of two 300 MW subcritical reheat CFB boilers. It has been in operation since 2001 and
fires petroleum coke and bituminous coal as its primary and secondary fuels,
respectively.
1.2 IGCC Technologies The following sub-sections provide summary level descriptions of gasification
and IGCC.
1.2.1 Gasification Process Description
Gasification consists of partially oxidizing a carbon containing feedstock (solid or
liquid) at a high temperature (2,500 to 3,000 F) to produce a synthetic gas (syngas)
consisting primarily of carbon monoxide (CO) and hydrogen. A small portion of the
carbon is completely oxidized to carbon dioxide (CO2) to generate sufficient heat for the
endothermic gasification reactions. The gasifier operates in a reducing environment that
converts most of the sulfur in the feed to hydrogen sulfide (H2S). A small amount of the
sulfur is converted to carbonyl sulfide (COS).
An IGCC plant typically includes an air separation unit (ASU) that cryogenically
separates oxygen from nitrogen. The oxygen is used as the oxidant in the gasifier to
produce low heating value gas (200 to 300 Btu/scf higher heating value [HHV]). High-
pressure (HP) nitrogen from the ASU is used to dilute the syngas heating value to
approximately 125 to 150 Btu/scf lower heating value (LHV) for NOx control.
Significant cleanup of the syngas is required before it enters the combustion turbine
generator (CTG) combustor.
1.2.2 Gasification Technologies
Gasifier technologies are typically classified by their characteristic mode of fuel
residence and include the following:
Entrained flow gasifiers
Fluid bed gasifiers
Fixed bed (or moving bed) gasifiers
Entrained flow gasifiers have a residence time on the order of seconds, fluid bed
gasifiers have a residence time on the order of minutes, and fixed bed gasifiers have a
Holcomb Expansion Project Coal Technology Selection Study Update
1.0 Executive Summary
June 18, 2010 1-3 © Black & Veatch 2010 Final Report All Rights Reserved
residence time on the order of hours. At the present time, entrained flow gasifiers are
generally considered to be the best choice for high capacity gasification to produce a
syngas suitable for CTG fuel for power generation.
1.2.3 Gasification Suppliers
Until recently, there were three suppliers of utility scale, entrained flow
gasification technologies.
ConocoPhillips (COP), which licenses “E-Gas” (which was developed by
Dow). COP purchased this technology from Global Energy in August 2003.
General Electric (GE), which purchased Texaco gasification technology from
ChevronTexaco in June 2004.
Shell, which developed its gasification technology in conjunction with Uhde
(formerly Krupp).
Since 2006, additional vendors that have entered the utility scale, entrained flow
gasifier market including the following:
MHI, which developed an air (oxygen enriched) gasifier specifically for IGCC
applications. MHI has been operating an IGCC demonstration plant in Japan
since 2007.
PRENFLO, which was originally developed by Uhde. The PRENFLO
technology is very similar to the Shell gasifier; Uhde and Shell worked
together marketing the Shell gasifier between 1999 and 2009. Uhde has been
marketing the PRENFLO gasifier since their agreement with Shell expired in
2009.
Siemens, which purchased the Future Energy (Noell) gasifier technology in
2006.
The COP and GE gasifiers are refractory lined coal-water slurry feed. Shell,
PRENFLO, and MHI all have water wall gasifiers that produce high pressure steam.
Siemens has a water screen that can produce low pressure steam. Shell, PRENFLO,
MHI, and Siemens are all dry feed technologies.
Coal-based IGCC projects using these gasification technologies are in various
stages of development in the United States. As these projects progress, and as additional
projects are announced, the engineering, procurement, and construction (EPC) terms and
conditions may be developed. It is unlikely at the current level of gasifier technology
development that an EPC contractor would provide an overall project guarantee which
would “wrap” the supplied technology and equipment. In the current marketplace,
Holcomb Expansion Project Coal Technology Selection Study Update
1.0 Executive Summary
June 18, 2010 1-4 © Black & Veatch 2010 Final Report All Rights Reserved
Owner’s would be expected to supply their own contingency and assume some level of
risk associated with the overall guarantees of the plant. In projects going forward into
construction much of this contingency and risk is mitigated through co-funding by the
United States Department of Energy (US DOE).
1.2.4 Effect of Fuel Characteristics on Gasifier Selection
There are three general coal feedstocks typically considered for domestic IGCC
projects: Pittsburgh No. 8, Illinois No. 6, and PRB. Petcoke is a fourth solid fuel
feedstock that is frequently considered for IGCC applications. Petcoke, as an opportunity
fuel, can be a lower cost fuel, but it is not as readily obtainable as coal unless in the
proximity of an oil refinery. Coal-based operating experience has been focused
predominantly on bituminous coals; but there is also experience with sub-bituminous,
lignite, and petcoke. Although the majority of sub-bituminous experience has been
limited to the E-Gas (then Dow) gasification technology at the Louisiana Gasification
Technologies Incorporated (LGTI) plant in Plaquemine Louisiana, the nature of the US
coal market and the abundance of PRB coal naturally results in an interest in using PRB
coals for IGCC using other developing gasification technologies.
All of the major gasification technologies can operate on bituminous coals and
petcoke; Shell, PRENFLO, MHI, and Siemens gasification technologies would have a
strong economic advantage over COP and GE when 100 percent PRB coal is used,
because they dry the coal during milling. Therefore, the high moisture content of PRB
does not affect gasifier performance. The COP and GE gasification technologies slurry
the coal with water during milling to enable the gasifier fuel feed system. The heat
required to evaporate this additional water in the gasifier is provided by combusting
carbon in the coal to CO2, which greatly reduces the heat value of the syngas. Because of
the inherently low heating value of PRB coal, gasification technologies which slurry the
coal such as COP and GE, may not be best suited technologies for gasifying PRB coal,
though, it is technically feasible. COP has successfully demonstrated the gasification of
PRB coal with their technology.
This study reviews the commercially available entrained flow gasification
technologies. Since PRB will be the fuel for the Holcomb project, the cost and
performance data developed for the more detailed comparison is based upon the Shell
technology, which is representative of the drymilled gasification technologies.
Holcomb Expansion Project Coal Technology Selection Study Update
1.0 Executive Summary
June 18, 2010 1-5 © Black & Veatch 2010 Final Report All Rights Reserved
1.2.5 IGCC Industry Activity
There have been approximately 18 IGCC projects completed throughout the
world. Of these, ten were originally designed for coal, two for petcoke, and six for liquid
fuels. Two of the coal-based IGCC plants, Cool Water in California and the LGTI Plant
in Louisiana, were small demonstration projects and have been decommissioned.
Another small coal IGCC demonstration project was Sierra Pacific’s Piñon Pine Project
in Nevada. This project, based on a fluid bed technology, was not successful. The
Schwarze Pumpe plant in Germany operated for many years but was shut down in 2007
because of the large cost of its waste to methanol operation. The plant is expected to
restart operation on lignite fuel.
Of the six operating coal IGCC plants, one is a 350 MW lignite cogeneration
plant that has 26 Lurgi fixed bed gasifiers, and five are utility scale, entrained flow
gasification demonstration projects, ranging in capacity from 250 to 300 MW and located
in Florida, Indiana, The Netherlands, Spain, and Japan. Each of the five entrained flow
gasification demonstration projects was a government-subsidized IGCC demonstration.
Each of these IGCC plants consists of a single train (one ASU, one gasifier, one gas
treating train, and one combined cycle (CC) composed of one CTG, one heat recovery
steam generator (HRSG), and one steam turbine generator [STG]). Each plant
experienced numerous problems during its first years of operation.
The operation of these five commercial coal-fueled IGCC plants has provided
benchmarks for expected capacity, efficiency, and environmental performance.
Uncertainty remains regarding plant availability and capital and operations and
maintenance (O&M) costs. The complexity and relative immaturity of the IGCC process
increases opportunities for deficiencies in design, vendor-supplied equipment,
construction, operation, and maintenance. Duke Energy is midway through the
construction of an IGCC plant in Edwardsport, Indiana. The expected capacity of the
plant is 618 MW (net). The plant is scheduled to reach mechanical completion in
September, 2012.1
1 As access June 3, 2010 at http://www.powergenworldwide.com/index/display/articledisplay/9015885896/articles/powergenworldwide/coal-generation/new-projects/2010/04/edwardsport-igcc.html
Holcomb Expansion Project Coal Technology Selection Study Update
1.0 Executive Summary
June 18, 2010 1-6 © Black & Veatch 2010 Final Report All Rights Reserved
1.3 Technology Screening Performance and Cost Estimates Black & Veatch developed performance and cost estimates of four baseload
generation technology options. The performance and cost data were utilized in a busbar
screening tool discussed in Section 5.0. For purposes of this evaluation, the technologies
were evaluated on a consistent basis relative to each other. The following four baseload
technologies were considered:
Supercritical PC.
Subcritical PC.
CFB.
IGCC.
The needs of the project require a net plant output of 895 MW (net) at the plant
boundary at the hot day ambient condition. The PC and CFB options were configured to
provide a net plant output of 895 MW net. The IGCC unit was configured to best satisfy
this requirement without substantially exceeding a net plant output of 895 MW.
The cost estimates have assumed that this project would be an add-on unit at the
existing Holcomb Station. A summary of the performance and cost estimates are shown
in Table 1-1.
Holcomb Expansion Project Coal Technology Selection Study Update
1.0 Executive Summary
June 18, 2010 1-7 © Black & Veatch 2010 Final Report All Rights Reserved
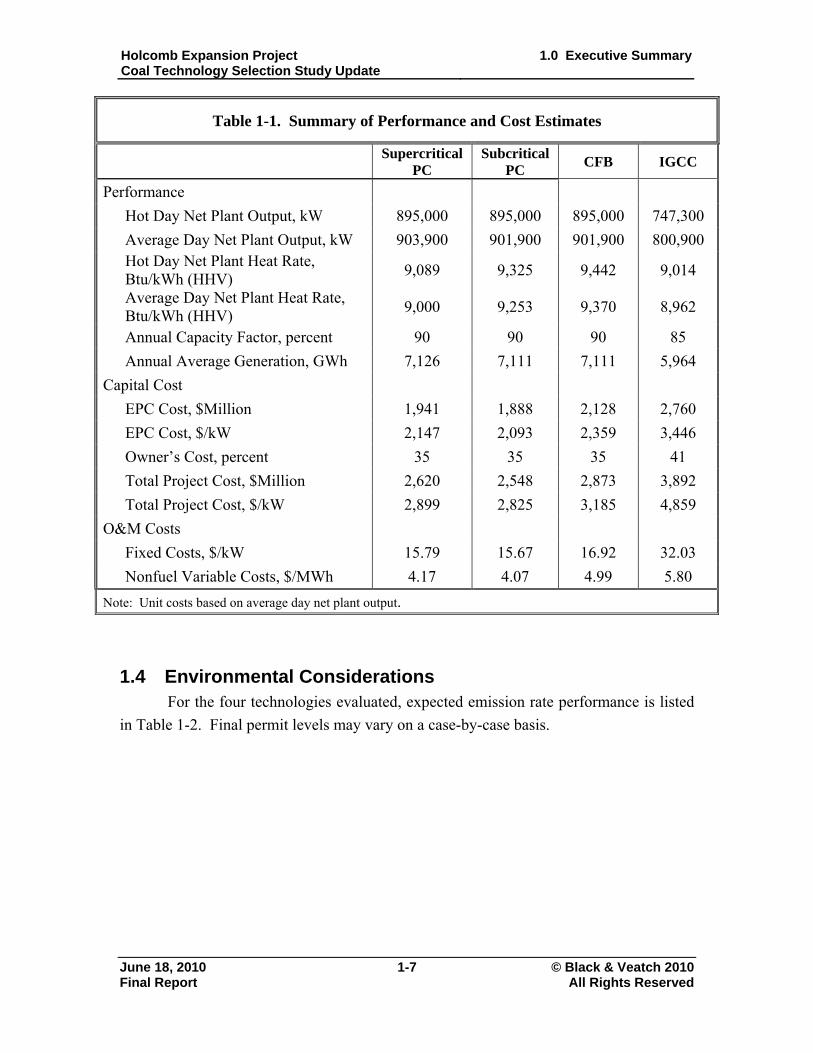
Table 1-1. Summary of Performance and Cost Estimates
Supercritical PC
Subcritical PC
CFB IGCC
Performance
Hot Day Net Plant Output, kW 895,000 895,000 895,000 747,300
Average Day Net Plant Output, kW 903,900 901,900 901,900 800,900 Hot Day Net Plant Heat Rate, Btu/kWh (HHV)
9,089 9,325 9,442 9,014
Average Day Net Plant Heat Rate, Btu/kWh (HHV)
9,000 9,253 9,370 8,962
Annual Capacity Factor, percent 90 90 90 85
Annual Average Generation, GWh 7,126 7,111 7,111 5,964
Capital Cost
EPC Cost, $Million 1,941 1,888 2,128 2,760
EPC Cost, $/kW 2,147 2,093 2,359 3,446
Owner’s Cost, percent 35 35 35 41
Total Project Cost, $Million 2,620 2,548 2,873 3,892
Total Project Cost, $/kW 2,899 2,825 3,185 4,859
O&M Costs
Fixed Costs, $/kW 15.79 15.67 16.92 32.03
Nonfuel Variable Costs, $/MWh 4.17 4.07 4.99 5.80
Note: Unit costs based on average day net plant output.
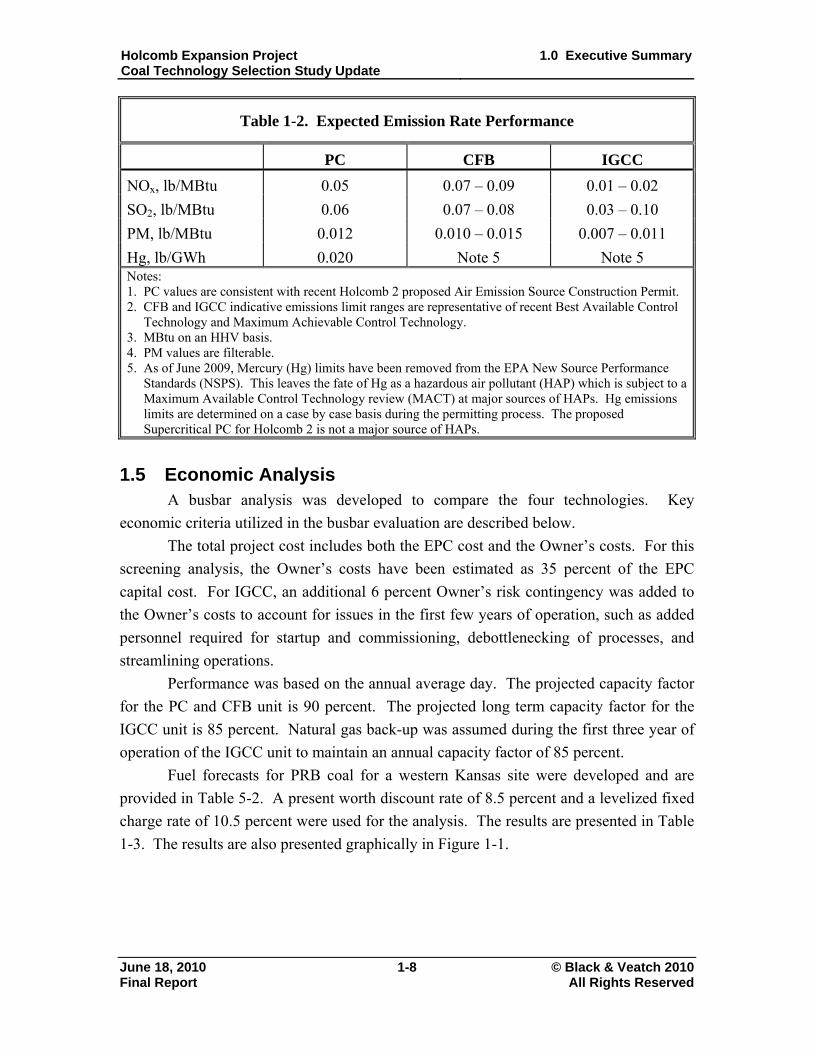
1.4 Environmental Considerations For the four technologies evaluated, expected emission rate performance is listed
in Table 1-2. Final permit levels may vary on a case-by-case basis.
Holcomb Expansion Project Coal Technology Selection Study Update
1.0 Executive Summary
June 18, 2010 1-8 © Black & Veatch 2010 Final Report All Rights Reserved
Table 1-2. Expected Emission Rate Performance
PC CFB IGCC
NOx, lb/MBtu 0.05 0.07 – 0.09 0.01 – 0.02
SO2, lb/MBtu 0.06 0.07 – 0.08 0.03 – 0.10
PM, lb/MBtu 0.012 0.010 – 0.015 0.007 – 0.011
Hg, lb/GWh 0.020 Note 5 Note 5 Notes: 1. PC values are consistent with recent Holcomb 2 proposed Air Emission Source Construction Permit. 2. CFB and IGCC indicative emissions limit ranges are representative of recent Best Available Control
Technology and Maximum Achievable Control Technology. 3. MBtu on an HHV basis. 4. PM values are filterable. 5. As of June 2009, Mercury (Hg) limits have been removed from the EPA New Source Performance
Standards (NSPS). This leaves the fate of Hg as a hazardous air pollutant (HAP) which is subject to a Maximum Available Control Technology review (MACT) at major sources of HAPs. Hg emissions limits are determined on a case by case basis during the permitting process. The proposed Supercritical PC for Holcomb 2 is not a major source of HAPs.
1.5 Economic Analysis A busbar analysis was developed to compare the four technologies. Key
economic criteria utilized in the busbar evaluation are described below.
The total project cost includes both the EPC cost and the Owner’s costs. For this
screening analysis, the Owner’s costs have been estimated as 35 percent of the EPC
capital cost. For IGCC, an additional 6 percent Owner’s risk contingency was added to
the Owner’s costs to account for issues in the first few years of operation, such as added
personnel required for startup and commissioning, debottlenecking of processes, and
streamlining operations.
Performance was based on the annual average day. The projected capacity factor
for the PC and CFB unit is 90 percent. The projected long term capacity factor for the
IGCC unit is 85 percent. Natural gas back-up was assumed during the first three year of
operation of the IGCC unit to maintain an annual capacity factor of 85 percent.
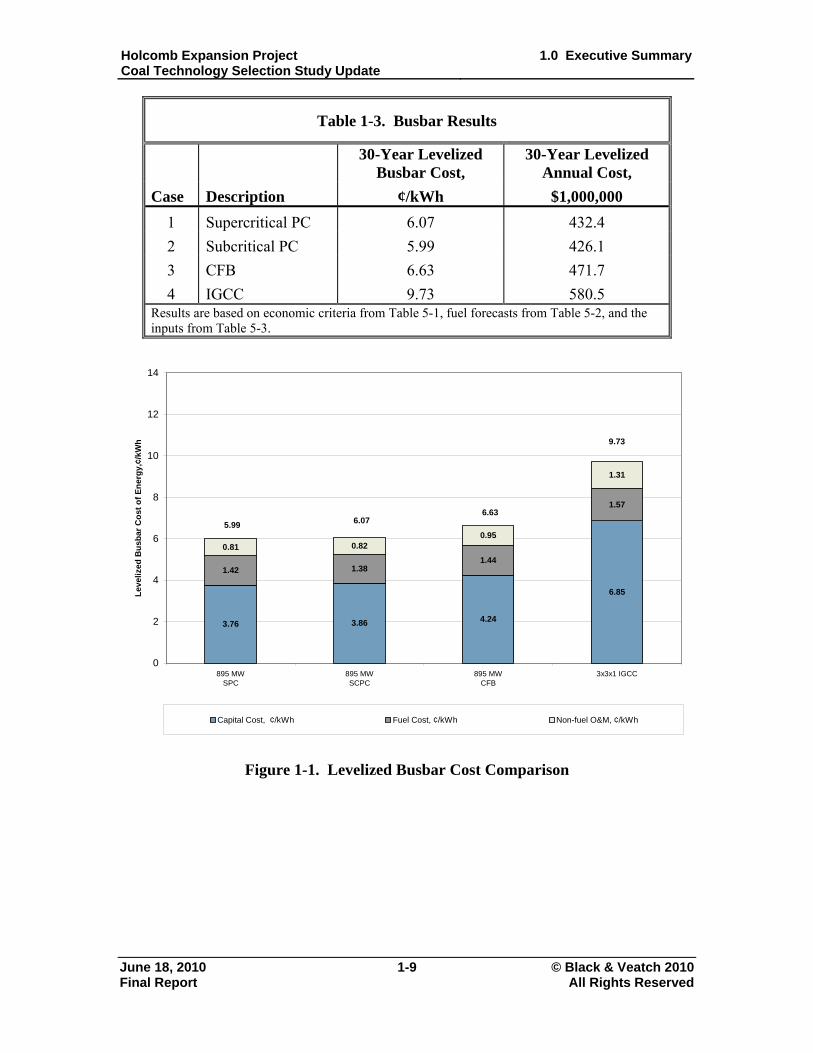
Fuel forecasts for PRB coal for a western Kansas site were developed and are
provided in Table 5-2. A present worth discount rate of 8.5 percent and a levelized fixed
charge rate of 10.5 percent were used for the analysis. The results are presented in Table
1-3. The results are also presented graphically in Figure 1-1.
Holcomb Expansion Project Coal Technology Selection Study Update
1.0 Executive Summary
June 18, 2010 1-9 © Black & Veatch 2010 Final Report All Rights Reserved
Table 1-3. Busbar Results
30-Year Levelized
Busbar Cost, 30-Year Levelized
Annual Cost,
Case Description ¢/kWh $1,000,000
1 Supercritical PC 6.07 432.4
2 Subcritical PC 5.99 426.1
3 CFB 6.63 471.7
4 IGCC 9.73 580.5 Results are based on economic criteria from Table 5-1, fuel forecasts from Table 5-2, and the inputs from Table 5-3.
3.76 3.86 4.24
6.85
1.381.44
1.57
0.81 0.820.95
1.31
1.42
0
2
4
6
8
10
12
14
895 MWSPC
895 MWSCPC
895 MWCFB
3x3x1 IGCC
Lev
eliz
ed B
usb
ar C
ost
of
En
erg
y,¢/
kWh
Capital Cost, ¢/kWh Fuel Cost, ¢/kWh Non-fuel O&M, ¢/kWh
5.99 6.076.63
9.73
Figure 1-1. Levelized Busbar Cost Comparison
Holcomb Expansion Project Coal Technology Selection Study Update
1.0 Executive Summary
June 18, 2010 1-10 © Black & Veatch 2010 Final Report All Rights Reserved
1.6 Conclusions The economic analysis, as provided in Table 1-3, indicates the lowest cost
technologies are the conventional PC and CFB units. The IGCC levelized busbar cost is
roughly 50 percent higher than those of the PC and CFB. The costs of emission
allowances were not included in the busbar cost analysis.
IGCC is not economically competitive with PC. The limited commercial and
operational experience of IGCC would make it a substantial operational and commercial
risk as a generating technology for the Expansion Project. IGCC, therefore, is not a
practical alternative for the Expansion Project.
The other two technologies evaluated, PC (either super or subcritical) and CFB,
are commercially available for consideration for a new 895 MW coal-fired generating
facility at Holcomb. The emissions of regulated pollutants from these two technologies
are very similar. The most fuel efficient technology is supercritical PC, whose heat rate
is approximately three percent better than the subcritical and CFB technologies. CFB is
expected to be slightly more expensive, as measured by the levelized busbar cost of
power, than PC.
Within the accuracy of the evaluation, the subcritical and supercritical PCs are
assumed to be equivalent. Supercritical PC is more efficient than the subcritical PC,
which reduces the coal consumption by roughly 2.5 percent which directly reduces the
total mass of the flue gas emissions by comparison.
Holcomb Expansion Project Coal Technology Selection Study Update
2.0 Conventional Coal Fired Technologies
June 18, 2010 2-1 © Black & Veatch 2010 Final Report All Rights Reserved
2.0 Conventional Coal Fired Technologies (PC and CFB)
This section contains a summary-level comparison of CFB and PC technologies,
along with a review of CFB experience in the United States, and a discussion of the
issues related to scaling-up CFB unit sizes.
The function of a steam generator is to provide controlled release of heat from the
fuel and efficient transfer of heat to the feedwater and steam. The transfer of heat
produces main steam at the pressure and temperature required by the HP turbine.
Conventional coal fired steam generator design has evolved into two basic combustion
and heat transfer technologies. Suspension firing of coal in a PC unit and combustion of
crushed coal in a CFB unit are the predominant coal fired technologies in operation today
for larger utility scale applications.
2.1 Pulverized Coal Coal is the most widely used fuel for the production of power in the US, and most
coal-burning power plants use PC boilers. PC units have the advantage of utilizing a
proven technology with a high reliability. These units can be very large, up to 1,000 MW
or more, and the economies of scale can result in low busbar costs. PC units are
relatively easy to operate and maintain.
New generation PC boilers can be designed at supercritical steam pressures of
3,600 to 4,500 psig, compared to the steam pressure of 2,400 psig for conventional
subcritical boilers. The increase in pressure from subcritical to supercritical pressure can
decrease the net plant heat rate over 2 percent. This increase in efficiency comes at a
cost, however, and the economics of the decision between subcritical and supercritical
design depend on the cost of fuel, expected unit capacity factor, environmental factors,
and the cost of capital.
With PC technology, coal that is sized to roughly 20 mm top size is fed to the
pulverizers, which finely grind the coal to a size of no less than 70 percent through a
200 mesh screen (70 microns). This pulverized coal is conveyed to the coal burners
suspended in the primary air stream. At the burner, this mixture of primary air and coal
is further mixed with secondary air and, with the presence of sufficient heat for ignition,
the coal burns in suspension with the expectation that combustion will be complete
before the burner flame contacts the back wall or side walls of the furnace. Current
pulverized fuel combustion technology also includes features to minimize unintended
products of combustion, such as NOx and other air toxics such as CO.
Because of the high combustion temperature of PC at the burners, the furnace
enclosure is constructed of membrane waterwalls to absorb the radiant heat of
Holcomb Expansion Project Coal Technology Selection Study Update
2.0 Conventional Coal Fired Technologies
June 18, 2010 2-2 © Black & Veatch 2010 Final Report All Rights Reserved
combustion. This heat absorption in the furnace is used to evaporate the preheated boiler
feedwater that is circulated through the membrane furnace walls. The steam from the
evaporated feedwater is separated from the liquid feedwater and routed to additional heat
transfer surfaces in the steam generator. Once the products of coal combustion (ash and
flue gas) have been cooled sufficiently by the waterwall surfaces so that the ash is no
longer molten but is in a solid and non-tacky form, heat transfer surfaces, predominantly
of the convective type, absorb the remaining heat of combustion. These convective heat
transfer surfaces are the superheaters, reheaters, and economizers located within the
steam generator enclosure downstream of the furnace. The final section of boiler heat
recovery is in the air preheater, where the flue gas leaving the economizer surface is
further cooled by regenerative or recuperative heat transfer to the incoming combustion
air.
Though the steam generating surfaces are designed to preclude the deposition of
molten or sticky ash products, on-line cleaning systems are provided to enable the
removal of ash deposits as they occur. These on-line cleaners are typically soot blowers
that utilize either HP steam or air to dislodge ash deposits from heat transfer surfaces or,
in cases with extreme ash deposition, utilize high pressure water to remove molten ash
deposits from evaporative steam generator surfaces. The characteristics of the coal, such
as ash content and the ash chemical composition, dictate the type, quantity, and frequency
of use of these on-line ash cleaning systems. Ash characteristics also dictate steam
generator design regarding the maximum flue gas temperatures that can be tolerated
entering convective heat transfer surfaces. The design must ensure that ash in the flue
gas stream has been sufficiently cooled so that it will not rapidly agglomerate or bond to
convective heat transfer surfaces. For very hard and erosive ash components, the flue gas
velocities must be sufficiently slow so that the ash will not rapidly erode heat transfer
surfaces.
With PC combustion technology, the majority of the solid ash components in the
coal will be carried in the flue gas stream all the way through the furnace and convective
heat transfer components so that they may be collected by particulate removal equipment
downstream of the air preheaters. Typically, no less than 80 percent of the total ash will
be carried out of the steam generator for collection downstream. Approximately 15
percent of the total fuel ash is collected from the furnace hopper (bottom ash), and 5
percent is collected in hoppers located below the steam generator economizer and
regenerative air heaters.
Holcomb Expansion Project Coal Technology Selection Study Update
2.0 Conventional Coal Fired Technologies
June 18, 2010 2-3 © Black & Veatch 2010 Final Report All Rights Reserved
2.2 Fluidized Bed During the 1980s, FBC emerged as a viable alternative to PC-fueled units for the
combustion of solid fuels. Initially used in the chemical and process industries, FBC was
applied to the electric utility industry because of its perceived air emissions advantages
over competing combustion technologies. Also, FBC units tend to be “fuel flexible,”
with the capability of firing a wider range of solid fuels with varying heating value, ash
content, and moisture content compared to PC boilers. Slagging and fouling tendencies
were minimized in the FBC units because of low combustion temperatures.
The most common type of FBC boiler is the atmospheric FBC which is generally
divided into two categories: bubbling fluidized bed (BFB) and circulating fluidized bed
(CFB).
A CFB operates at higher bed fluidizing velocities than a BFB and has better
environmental characteristics and higher efficiency than BFB. A CFB boiler is generally
the FBC technology of choice for fossil fuel applications greater than 50 MW and is the
primary coal fired boiler alternative to a PC boiler
In a CFB unit, a portion of the combustion air is introduced through the bottom of
the bed. The bed material normally consists of fuel, limestone (for sulfur capture), and
ash. The bottom of the bed is supported by water-cooled membrane walls with specially
designed air nozzles that distribute the air uniformly. The fuel and limestone are fed into
the lower bed. In the presence of fluidizing air, the fuel and limestone quickly and
uniformly mix under the turbulent environment and behave like a fluid. Carbon particles
in the fuel are exposed to the combustion air. The balance of combustion air is
introduced at the top of the lower, dense bed. Staged combustion and low combustion
temperature limit the formation of thermal NOx.
The bed fluidizing air velocity is greater than the terminal velocity of most of the
particles in the bed and, thus, fluidizing air carries the particles through the combustion
chamber to the particulate separators at the furnace exit. The captured solids, including
any unburned carbon and unused calcium oxide (CaO), are re-injected directly back into
the combustion chamber without passing through an external recirculation. This internal
solids circulation provides longer residence time for fuel and limestone, resulting in good
combustion and improved sulfur capture.
Commercial CFB units offer greater fuel diversity than PC units, operate at
competitive efficiencies, and, when coupled with a polishing SO2 scrubber, operate with
emissions at or below the current levels mandated by federal standards.
By the late 1980s, the transition had been made from small industrial sized boilers
to several electrical utility reheat boilers in operation in a size range from 75 to 165 MW.
Several reheat boilers up to 300 MW are currently in service, and boiler suppliers are
Holcomb Expansion Project Coal Technology Selection Study Update
2.0 Conventional Coal Fired Technologies
June 18, 2010 2-4 © Black & Veatch 2010 Final Report All Rights Reserved
offering boiler designs to provide steam generation sufficient to support up to 600 MW,
with commercial guarantees.2 Fuels for these applications range from petcoke and
bituminous coal to high ash refuse from bituminous coal preparation and cleaning plants,
and high moisture fuels such as lignite. Some units were installed to utilize the tailings
and washing residue from early anthracite mining operations.
A feature of CFB is that a portion of the SO2 can be removed in the combustion
process by adding limestone to the fluidized bed. The CaO formed from the calcination
of limestone reacts with SO2 to form calcium sulfate (CaSO4), which is removed from the
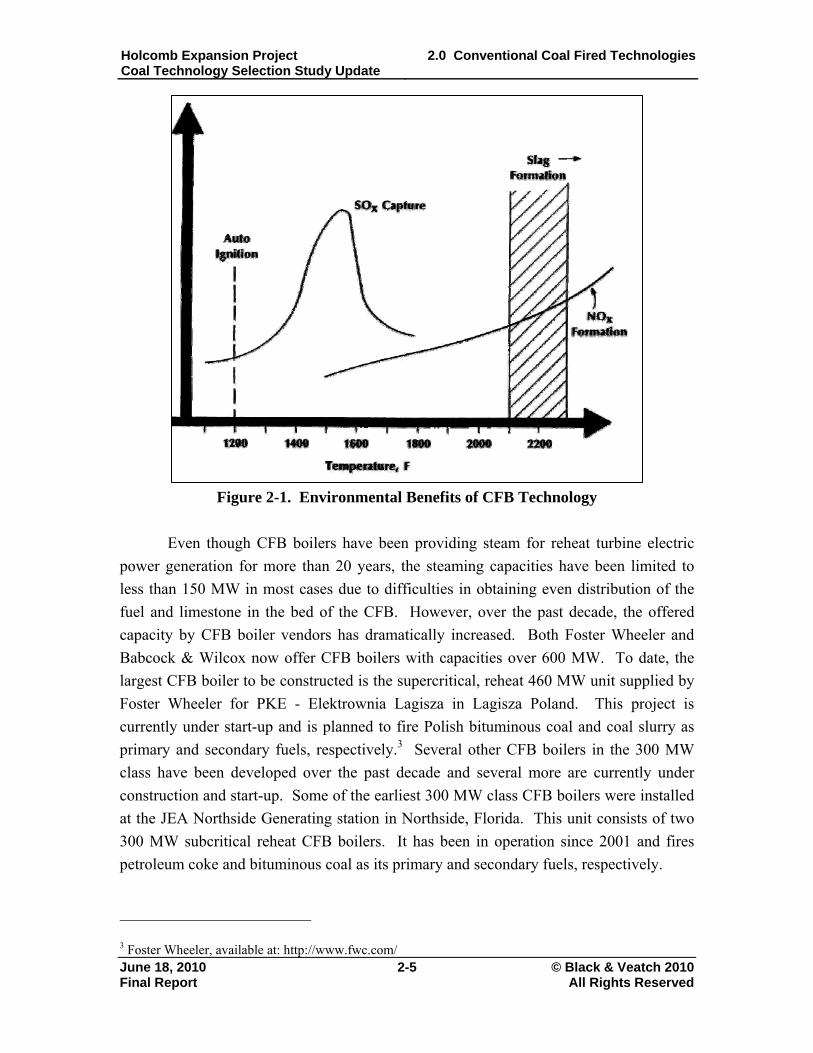
flue gas with a conventional particulate removal device. CFB combustion temperature is
controlled at approximately 1,600º F, compared to approximately 2,500 to 3,000º F for
conventional PC boilers. Combustion at the lower temperature has several benefits.
First, the lower temperature minimizes the sorbent (typically limestone) requirement,
because the required calcium to sulfur (Ca/S) molar ratio for a given SO2 removal
efficiency is minimized in this temperature range. Second, 1,550 to 1,600º F is well
below the ash fusion temperatures of most fuels, so the fuel ash never reaches its
softening or melting points. The slagging and fouling problems that are characteristic of
PC units are significantly reduced, if not eliminated. Finally, the lower temperature
reduces NOx emissions by nearly eliminating thermal NOx. Figure 2-1 illustrates the
benefits of a lower combustion temperature for CFBs.
Because combustion temperatures are below ash fusion temperatures, the design
of a CFB boiler is not as dependent on ash properties as is a conventional PC boiler.
With proper design considerations, a CFB boiler can fire a wider range of fuels with less
operating difficulty.
The fuel size for a CFB boiler is much coarser than the pulverized fuel needed for
suspension firing in a PC boiler. Compared to the typical 70 micron particle size for a PC
unit, the typical fuel size for a CFB is approximately 5,000 microns. For high ash fuels,
the use of larger fuel sizing reduces auxiliary power and pulverizer maintenance
requirements and eliminates the high cost of pulverizer installation.
2 For the purpose of this study, a 3x300 MW boiler configuration has been assumed.
Holcomb Expansion Project Coal Technology Selection Study Update
2.0 Conventional Coal Fired Technologies
June 18, 2010 2-5 © Black & Veatch 2010 Final Report All Rights Reserved
Figure 2-1. Environmental Benefits of CFB Technology
Even though CFB boilers have been providing steam for reheat turbine electric
power generation for more than 20 years, the steaming capacities have been limited to
less than 150 MW in most cases due to difficulties in obtaining even distribution of the
fuel and limestone in the bed of the CFB. However, over the past decade, the offered
capacity by CFB boiler vendors has dramatically increased. Both Foster Wheeler and
Babcock & Wilcox now offer CFB boilers with capacities over 600 MW. To date, the
largest CFB boiler to be constructed is the supercritical, reheat 460 MW unit supplied by
Foster Wheeler for PKE - Elektrownia Lagisza in Lagisza Poland. This project is
currently under start-up and is planned to fire Polish bituminous coal and coal slurry as
primary and secondary fuels, respectively.3 Several other CFB boilers in the 300 MW
class have been developed over the past decade and several more are currently under
construction and start-up. Some of the earliest 300 MW class CFB boilers were installed
at the JEA Northside Generating station in Northside, Florida. This unit consists of two
300 MW subcritical reheat CFB boilers. It has been in operation since 2001 and fires
petroleum coke and bituminous coal as its primary and secondary fuels, respectively.
3 Foster Wheeler, available at: http://www.fwc.com/
Holcomb Expansion Project Coal Technology Selection Study Update
3.0 IGCC Technologies and Industry Activity
June 18, 2010 3-1 © Black & Veatch 2010 Final Report All Rights Reserved
3.0 IGCC Technologies and Industry Activity
IGCC is an alternative to PC and CFB for coal-based electricity generation,
although there is comparatively little commercial experience to date.
In the near term, reliability is expected to be lower for an IGCC plant than for a
PC or CFB plant with respect to producing electricity from coal. IGCC plants are
expected to achieve long-term annual availabilities in the 80 to
85 percent range on coal, unless equipped with a spare gasifier or natural gas back-up.
By comparison, a well-operated PC or CFB plant can achieve availabilities of
approximately 90 percent. IGCC availability on coal during initial startup and the first
several years of operation is expected to be significantly lower.
Cost, schedule, and plant availability issues cause IGCC projects to have higher
financial risk than conventional PC or CFB power generation projects. Details regarding
the guarantee levels for cost, schedule, and performance; the associated liquidated
damages clauses and risk premium; and availability assurances are not well defined and
IGCC projects could be challenging to finance in the near term.
3.1 Gasifier Technologies Gasification is a technology with a history that dates back to the 1800s. The first
patent was granted to Lurgi GmbH in Germany in 1887. By 1930, coal gasification had
become widespread, and, in the 1940s, commercial coal gasification was used to provide
“town” gas for streetlights in both Europe and the United States. Gasifier technologies
are typically classified by their characteristic mode of fuel residence and include the
following:
Entrained flow
Fluid bed
Fixed bed
Entrained flow gasifiers have a residence time on the order of seconds, fluid bed
gasifiers have a residence time on the order of minutes, and fixed bed gasifiers have a
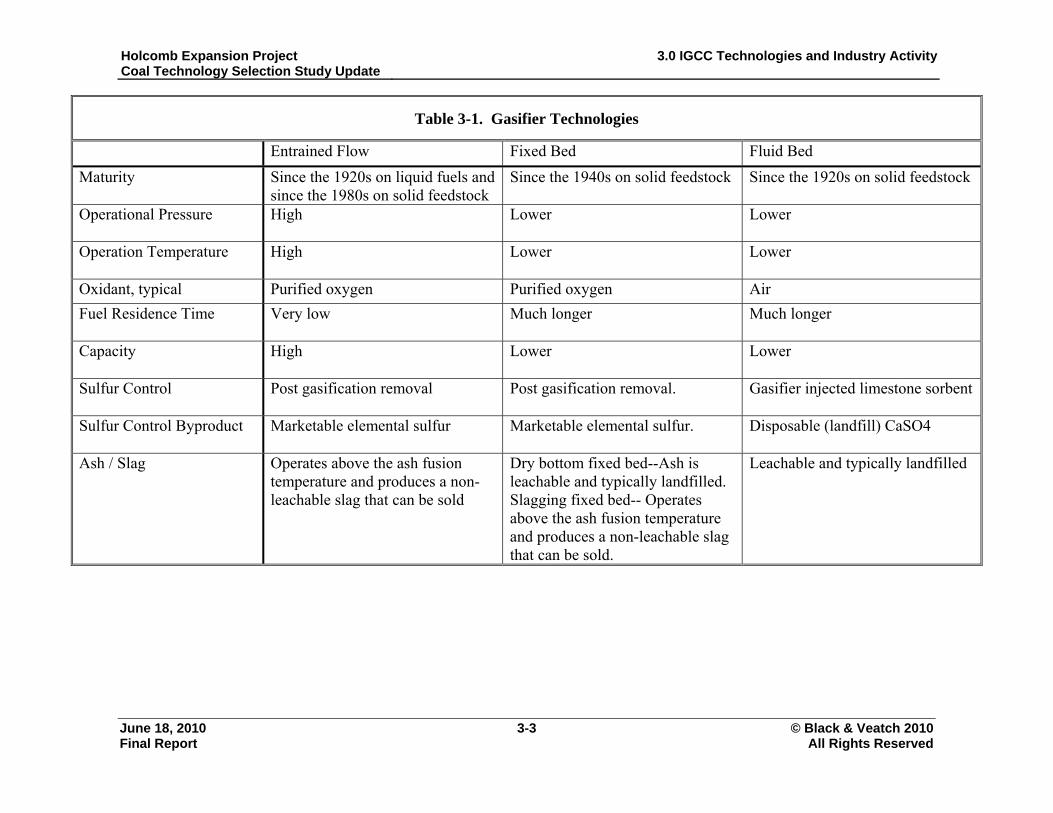
residence time on the order of hours. Table 3-1 summarizes key characteristic
differences for the three main types of gasifier technologies compared to entrained flow
gasifiers.
Entrained flow gasifiers have been operating on solid fuels since the mid-1980s to
produce chemicals and, since the mid-1990s, to produce electricity. At this time, based
upon their characteristics and level of development, entrained flow gasifiers are the best
choice for high capacity gasification for power generation. The following sections
Holcomb Expansion Project Coal Technology Selection Study Update
3.0 IGCC Technologies and Industry Activity
June 18, 2010 3-2 © Black & Veatch 2010 Final Report All Rights Reserved
provide more in-depth descriptions for entrained flow gasifiers and entrained flow
gasifier technology suppliers.
Holcomb Expansion Project Coal Technology Selection Study Update
3.0 IGCC Technologies and Industry Activity
June 18, 2010 3-3 © Black & Veatch 2010 Final Report All Rights Reserved
Table 3-1. Gasifier Technologies
Entrained Flow Fixed Bed Fluid Bed
Maturity Since the 1920s on liquid fuels and since the 1980s on solid feedstock
Since the 1940s on solid feedstock Since the 1920s on solid feedstock
Operational Pressure High Lower Lower
Operation Temperature High Lower Lower
Oxidant, typical Purified oxygen Purified oxygen Air
Fuel Residence Time Very low Much longer Much longer
Capacity High Lower Lower
Sulfur Control Post gasification removal Post gasification removal. Gasifier injected limestone sorbent
Sulfur Control Byproduct Marketable elemental sulfur Marketable elemental sulfur. Disposable (landfill) CaSO4
Ash / Slag Operates above the ash fusion temperature and produces a non-leachable slag that can be sold
Dry bottom fixed bed--Ash is leachable and typically landfilled. Slagging fixed bed-- Operates above the ash fusion temperature and produces a non-leachable slag that can be sold.
Leachable and typically landfilled
Holcomb Expansion Project Coal Technology Selection Study Update
3.0 IGCC Technologies and Industry Activity
June 18, 2010 3-4 © Black & Veatch 2010 Final Report All Rights Reserved
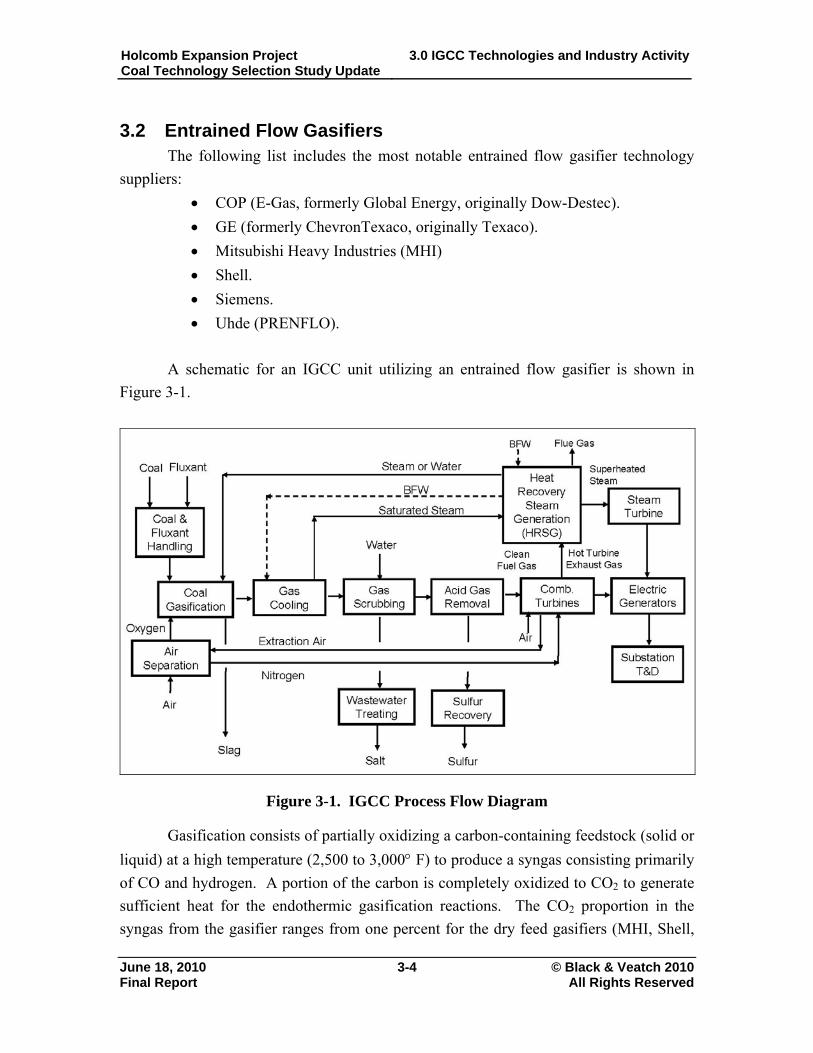
3.2 Entrained Flow Gasifiers The following list includes the most notable entrained flow gasifier technology
suppliers:
COP (E-Gas, formerly Global Energy, originally Dow-Destec).
GE (formerly ChevronTexaco, originally Texaco).
Mitsubishi Heavy Industries (MHI)
Shell.
Siemens.
Uhde (PRENFLO).
A schematic for an IGCC unit utilizing an entrained flow gasifier is shown in
Figure 3-1.
Figure 3-1. IGCC Process Flow Diagram
Gasification consists of partially oxidizing a carbon-containing feedstock (solid or
liquid) at a high temperature (2,500 to 3,000 F) to produce a syngas consisting primarily
of CO and hydrogen. A portion of the carbon is completely oxidized to CO2 to generate
sufficient heat for the endothermic gasification reactions. The CO2 proportion in the
syngas from the gasifier ranges from one percent for the dry feed gasifiers (MHI, Shell,
Holcomb Expansion Project Coal Technology Selection Study Update
3.0 IGCC Technologies and Industry Activity
June 18, 2010 3-5 © Black & Veatch 2010 Final Report All Rights Reserved
Siemens and Uhde) to more than 15 percent for the slurry feed COP and GE gasifiers.
The gasifier operates in a reducing environment that converts most of the sulfur in the
feed to hydrogen sulfide (H2S). A small amount of sulfur is converted to carbonyl sulfide
(COS). Other minor syngas constituents include ammonia (NH3), hydrogen cyanide
(HCN), hydrogen chloride (HCl), and entrained ash, which contains unconverted carbon.
In IGCC applications, the gasifier pressure is typically 450 to 550 psig. This pressure is
determined by the CTG syngas supply pressure requirements. GE gasifiers operate at
higher pressures, up to 1,000 psig, and the excess syngas pressure is let down in an
expander to produce additional power.
A fluxant is fed with the coal to control the slag viscosity so that it will flow out
of the gasifier. Fluxant addition is less than 2 percent of the coal feed. The fluxant is
typically limestone, but PC boiler ash can also be used. The required fluxant composition
and proportion will vary with the coal feed composition. The gasification process
operators must know the feed coal composition and make fluxant adjustments when the
coal composition changes. Too little fluxant can allow excessive slag to accumulate in
the gasifier, which could damage the refractory and eventually choke the gasifier. Too
much fluxant can produce long cylindrical slag particles instead of small slag granules
when the slag is quenched in the lockhopper. These long thin slag particles will plug up
the slag lockhopper.
Solid fuel feeds to the gasifier can be dry or slurried. Solid fuels slurried in water
do not require the addition of steam for temperature moderation. While slurries typically
use water, oil can also be used. Steam is added to the oxygen as a temperature moderator
for dry solid feed gasifiers, solid feeds slurried in oil, and oil feed gasifiers.
Entrained flow gasifiers use oxygen to produce syngas heating values in the range
of 250 to 300 Btu/scf on an HHV basis. An oxygen concentration of 95 percent by
volume is the economic optimum for IGCC plants using entrained flow gasifiers that only
produce power. (Higher oxygen concentrations are optimum when most of the syngas is
used to produce hydrogen.) Oxygen is produced cryogenically by compressing air,
cooling and drying the air, removing CO2 from the air, chilling the feed air with product
oxygen and nitrogen, reducing the air pressure to provide autorefrigeration and liquefy
the air at -300 F, and separating the liquid oxygen and liquid nitrogen by distillation.
Air compression consumes a significant amount of power, between 13 and 17 percent of
the IGCC gross power output.
The raw hot syngas is cooled by boiler feedwater to a temperature suitable for
cleaning. The syngas cooling process generates saturated steam that can be superheated
in the HRSG and integrated into the steam cycle. The steam quantities and pressures
vary with the gasification process design.
Holcomb Expansion Project Coal Technology Selection Study Update
3.0 IGCC Technologies and Industry Activity
June 18, 2010 3-6 © Black & Veatch 2010 Final Report All Rights Reserved
Before raw syngas enters the CTG combustor, the H2S, COS, NH3, HCN, and
particulates must be removed. Cooled syngas is scrubbed to remove NH3, water soluble
salts, and particulates. Syngas may also be filtered to remove additional particulates.
COS in the syngas is hydrolyzed by a catalyst to H2S, which is removed from the syngas
by absorption in a solvent. This absorption process is called acid gas removal (AGR).
Syngas is filtered in ceramic candle filters at the Buggenum and Puertollano
IGCC plants. At the Wabash IGCC plant, syngas was initially filtered in ceramic candle
filters; later, the filter elements (candles) were changed to sintered metal. The syngas
filters at Buggenum, Puertollano, and Wabash are located upstream of the AGR. At the
Polk County IGCC plant, particulate is removed from the syngas in a syngas scrubber by
intimate contact with water.
The H2S that is removed from the syngas by absorption in a solvent is desorbed as
a concentrated acid gas when the solvent is regenerated by lowering its pressure and
increasing its temperature. Descriptions of commercial AGR systems are provided in
Section 3.9. The acid gas stream can be converted to either elemental sulfur in the Claus
sulfur recovery process or sulfuric acid in a wet sulfuric acid process.
The primary chemical reaction in the Claus process is the reaction of H2S and SO2
to produce elemental sulfur and water. This reaction requires a catalyst and is performed
in two stages. The SO2 is produced by oxidizing (burning) one third of the H2S in the
feed gas. External fuel is only needed to initially heat up the Claus thermal reactor and
initiate combustion of the acid gas. Under normal operation, the oxidation of H2S
provides sufficient heat to maintain the reaction. The sulfur is formed as a vapor. The S2
form of sulfur reacts with itself to produce S6 and S8, which are subsequently condensed.
This condensed liquid sulfur is separated from the residual gas and stored in a pit at 275
to 300 F. As required, the liquid sulfur is pumped from the pit to railcars for shipment.
Solid sulfur can be produced in blocks or pellets by cooling the liquid sulfur to ambient
temperature. The residual (tail gas) is primarily CO2 and nitrogen, which are compressed
and reinjected into the syngas upstream of the AGR.
In the wet sulfuric acid process a portion of the sour acid gas from the AGR is
combusted to form SO2 and the hot combustion products are cooled in a Waste Heat
Boiler. One advantage of doing this is that the exothermal heat from combustion and the
sulfuric acid reactions can be recovered as superheated steam and used internally in the
steam cycle resulting in an overall more efficient plant. The cooled combustion products
are passed to an SO2 Oxidation Reactor, where the SO2 is catalytically converted to SO3.
The oxidation reaction is exothermic and the reaction heat can be recovered in heat
exchangers to produce superheated high pressure steam. The cooled gas leaves the heat
Holcomb Expansion Project Coal Technology Selection Study Update
3.0 IGCC Technologies and Industry Activity
June 18, 2010 3-7 © Black & Veatch 2010 Final Report All Rights Reserved
exchanger and is introduced in the bottom part of the condenser where ambient air is used
to condense the sulfuric acid.
Hydrogen in syngas prevents the use of dry low NOx (DLN) combustors in the
CTGs. Dilution of the syngas to reduce flame temperature is required for NOx control.
Syngas can be diluted by adding water vapor and/or nitrogen. Water vapor can be added
to the syngas by evaporating water using low level heat. Nitrogen can be added by
compressing excess nitrogen from the ASU and adding it to the syngas, either upstream
of the CTG or by injection into the CTG. Syngas dilution for NOx control increases the
mass flow through the CTG, which also increases power output.
3.3 Entrained Flow Gasifier Technology Suppliers Although there have been relatively few major players in the recent past for the
large scale, solid fuel, gasifier market, the number of established vendors has increased.
The level and type of experience (e.g. IGCC, chemicals) varies among technology
suppliers. The following major technology suppliers have expressed their interest in the
ongoing development of IGCC projects:
COP, which licenses E-Gas technology that was developed by Dow. COP
purchased this technology from Global Energy in August 2003.
GE, which purchased Texaco gasification technology from ChevronTexaco in
June 2004. GE offers both Quench and Radiant (high temperature heat
recovery [HTHR]) cooler gasifiers.
MHI, which is an air blown (oxygen enriched), dry feed gasifier that is being
developed specifically for IGCC applications.
Shell, which developed its gasification technology in conjunction with
PRENFLO.
Uhde, which recently re-entered the gasifier vendor market after their
agreement with Shell was not renewed toward the end of 2008.
Siemens, which purchased the Future Energy (Noell) gasifier technology in
2006. The Siemens gasifier uses a full spray quench configuration, but is
developing a partial water quench for IGCC applications.
Although there are other gasifier vendors, Black & Veatch believes the six
indicated above are those likely to be selected for most IGCC applications.
The COP and GE gasifiers are refractory lined with coal-water slurry feed. The
GE quench gasifier is used extensively in chemical plants around the world. GE has been
expanding their commercial offering to larger scales to meet demand for larger chemical
Holcomb Expansion Project Coal Technology Selection Study Update
3.0 IGCC Technologies and Industry Activity
June 18, 2010 3-8 © Black & Veatch 2010 Final Report All Rights Reserved
plants and large scale IGCC plants. COP has significantly less experience than GE, but is
one of the only gasifiers with a demonstration scale IGCC plant operating on solid fuel.
Shell and Krupp-Koppers (now Uhde) jointly developed a waterwall type gasifier
with dry, PC feed specifically for IGCC power generation in the late 1970s for a 150 long
tons per day (ltpd) demonstration plant near Hamburg, West Germany. During the
1990s, Shell and Krupp-Koppers licensed their gasification technology separately. The
Puertollano, Spain IGCC plant, which was built in the mid-1990s, uses Krupp-Kopper’s
PRENFLO gasification technology. In the late 1990s, Krupp-Koppers merged with
Uhde; Uhde reached an agreement with Shell to license Shell gasification technology. In
2008 Uhde did not renew their agreement with Shell and now commercially offers the
PRENFLO gasifier.
Siemens and MHI are relatively new to the utility scale solid fuel gasification
market. Siemens purchased their gasification technology from Future Energy in 2006.
The technology was developed at the Deutche Brennerstoff Institute (DBI) and was
owned and developed by several companies before Future Energy. Siemens has been
aggressively marketing their technology for chemicals and substitute natural gas
applications, but is also interested in the IGCC market. In contrast, MHI is focused
almost entirely on the IGCC market and has developed their technology with that in
mind. MHI is not an oxygen blown gasifier, but does use an ASU to supply nitrogen for
its dry feed process to the gasifier. The oxygen produced in the ASU is used to enrich the
air used in the gasification process. MHI developed a 250 MW IGCC plant (Nakoso) in
Iwaki City, Japan that began construction in 2004 and was completed in 2007. The plant
has completed several thousand hours of operation to date.4
With the exception of the MHI gasifier, each of the commercial entrained flow
coal gasification technologies generates similar syngas products. The gasifiers react the
coal with oxygen and water at high pressure and high temperature to produce syngas
consisting primarily of hydrogen and CO. The raw syngas from the gasifier also contains
CO2, water, H2S, COS, NH3, HCN, and other trace impurities (the MHI gasifier also has
significant quantities of N2). The syngas exits the gasifier reactor at approximately 2,500
to 2,900 F.
4 Yoshitaka Ishibashi, “Second Year Operation Results of CCP’s Nakoso 250MW Air-blown IGCC Demonstration Plant.” Gasification Technologies Conference 2009, October 6, 2009
Holcomb Expansion Project Coal Technology Selection Study Update
3.0 IGCC Technologies and Industry Activity
June 18, 2010 3-9 © Black & Veatch 2010 Final Report All Rights Reserved
Each of the gasification processes cools the hot syngas from the gasifier reactor
differently. In the COP process, the hot syngas is partially quenched with coal slurry,
resulting in a second stage of coal gasification. The chemically quenched syngas is
further cooled to produce steam in a fired tube heat exchanger. (Syngas flow is through
the tubes. Boiler water and steam flow is through the shell side.) Unconverted coal is
filtered from the cooled syngas and recycled to the gasifier first stage. GE has two
methods for cooling the hot syngas from the gasifier: radiant cooling to produce HP
steam via HTHR and water quench followed by low-pressure (LP) steam generation. The
MHI gasifier uses a chemical quench cooling similar to COP, but with a dry feed,
followed by a water tube convective syngas cooler that produces HP steam for the steam
turbine. In the Shell process, hot syngas is cooled with recycled syngas to solidify the
molten fly slag and then further cooled in a convective cooler to produce high
temperature steam. The Siemens gasifier uses a water spray to quench the syngas to
saturation conditions. Although they are developing a partial water quench with
subsequent heat recovery, the lack of steam generation explains in part Siemens’ focus on
chemical plants rather than power generation.
The cooled, raw syngas is cleaned by various treatments, including filtration,
scrubbing with water, catalytic conversion, and scrubbing with solvents. The clean
syngas that is used as CTG fuel contains hydrogen, CO, CO2, water, and parts per million
(ppm) concentrations of H2S and COS.
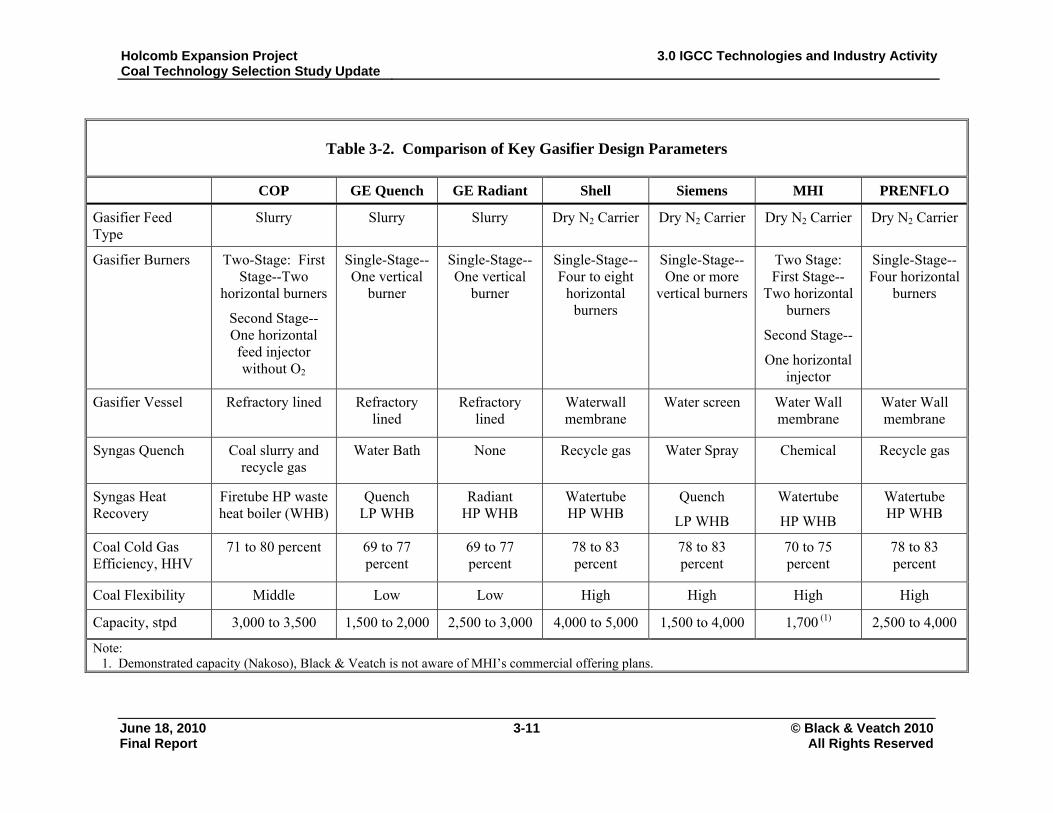
3.4 Gasifier Technology Comparison Table 3-2 provides process design characteristic data for the COP, GE, Shell,
Siemens, MHI, and PRENFLO gasification technologies for systems that would be
applicable for a utility scale IGCC. Overall, energy conversion efficiencies for IGCC
plants vary with the gasification technology type, system design, level of integration, and
coal composition. The gasifier efficiency of converting the coal fuel value to the syngas
fuel value, after sulfur removal, is known as the cold gas efficiency, which is generally
expressed in HHV. The values for cold gas efficiency in Table 3-2 are indicative of the
range of achievable performance for coal and petcoke. The Shell, Siemens, and
PRENFLO gasification technologies have the highest cold gas efficiencies, because the
gasifier feed coal is injected into the gasifier dry. The COP and GE gasifiers use a coal
and water slurry for the fuel feed. The Shell and PRENFLO dry feed coal gasification
processes have higher capital costs. The MHI gasifier has a lower cold gas efficiency
than the other dry feed gasifiers because of the nitrogen in the air used for gasification.
Cooling the hot syngas to produce HP steam contributes to higher IGCC
efficiency, but with a higher capital cost. Shell, PRENFLO, MHI, and COP generate HP
Holcomb Expansion Project Coal Technology Selection Study Update
3.0 IGCC Technologies and Industry Activity
June 18, 2010 3-10 © Black & Veatch 2010 Final Report All Rights Reserved
steam from syngas cooling. GE offers both HP steam generation using a radiant syngas
cooler and LP steam generation using its quench process, which has a significantly lower
capital cost. Siemens is developing a partial water quench; when complete it should also
be able to produce high pressure steam from the syngas cooling process.5
The COP and GE gasifiers are refractory lined, while the Shell, PRENFLO, and
MHI gasifiers have an inner water tube wall (membrane). Siemens uses a water screen
that produces small quantities of low to medium pressure steam. The refractory lined
gasifiers have a lower capital cost, but the refractory requires frequent repair and
replacement. The COP and GE gasifier burners typically require more frequent
replacement than the Shell gasifier burners.
It is notable that gasifier sizing issues exist with respect to the different gasifier
technologies. Shell has stated that its maximum gasifier capacity is 5,000 short tons per
day (stpd) of dried coal, which is large enough to supply syngas to two GE 7F-Syngas
(SG) or Siemens SGT6-5000F CTGs. Black & Veatch expects that the Uhde will offer
similar PRENFLO sizes. GE offers gasifiers in three standard sizes: 750, 900, and 1,800
ft3. GE added the 1,800 ft3 gasifier in quench mode to their commercial offering in 2008.
The 1,800 ft3 gasifier in radiant mode has been available since about 1996. The 1,800 ft3
radiant GE gasifier will supply sufficient syngas for a GE 7F-SG or Siemens SGT6-
5000F CTG. COP currently offers a gasifier that will supply sufficient syngas for a GE
7F-SG or Siemens SGT6-5000F CTG. Siemens offers their gasifier in sizes of 500 and
1,200 MW thermal. The 1,200 MWth gasifier is large enough to supply syngas to one
advanced F class turbine. Black & Veatch is not aware of MHI’s commercial offering
plans.
5 Harry Morehead, “Siemens – US DOE Advanced H2 Turbine Program Technology Development is Key to Meeting Program Goals.” Gasification Technology Conference 2008, October 7, 2008.
Holcomb Expansion Project Coal Technology Selection Study Update
3.0 IGCC Technologies and Industry Activity
June 18, 2010 3-11 © Black & Veatch 2010 Final Report All Rights Reserved
Table 3-2. Comparison of Key Gasifier Design Parameters
COP GE Quench GE Radiant Shell Siemens MHI PRENFLO
Gasifier Feed Type
Slurry Slurry Slurry Dry N2 Carrier Dry N2 Carrier Dry N2 Carrier Dry N2 Carrier
Gasifier Burners Two-Stage: First Stage--Two
horizontal burners
Second Stage--One horizontal feed injector without O2
Single-Stage--One vertical
burner
Single-Stage--One vertical
burner
Single-Stage--Four to eight
horizontal burners
Single-Stage--One or more
vertical burners
Two Stage: First Stage--
Two horizontal burners
Second Stage--
One horizontal injector
Single-Stage--Four horizontal
burners
Gasifier Vessel Refractory lined Refractory lined
Refractory lined
Waterwall membrane
Water screen Water Wall membrane
Water Wall membrane
Syngas Quench Coal slurry and recycle gas
Water Bath None Recycle gas Water Spray Chemical Recycle gas
Syngas Heat Recovery
Firetube HP waste heat boiler (WHB)
Quench LP WHB
Radiant HP WHB
Watertube HP WHB
Quench
LP WHB
Watertube
HP WHB
Watertube HP WHB
Coal Cold Gas Efficiency, HHV
71 to 80 percent 69 to 77 percent
69 to 77 percent
78 to 83 percent
78 to 83 percent
70 to 75 percent
78 to 83 percent
Coal Flexibility Middle Low Low High High High High
Capacity, stpd 3,000 to 3,500 1,500 to 2,000 2,500 to 3,000 4,000 to 5,000 1,500 to 4,000 1,700 (1) 2,500 to 4,000
Note: 1. Demonstrated capacity (Nakoso), Black & Veatch is not aware of MHI’s commercial offering plans.
Holcomb Expansion Project Coal Technology Selection Study Update
3.0 IGCC Technologies and Industry Activity
June 18, 2010 3-12 © Black & Veatch 2010 Final Report All Rights Reserved
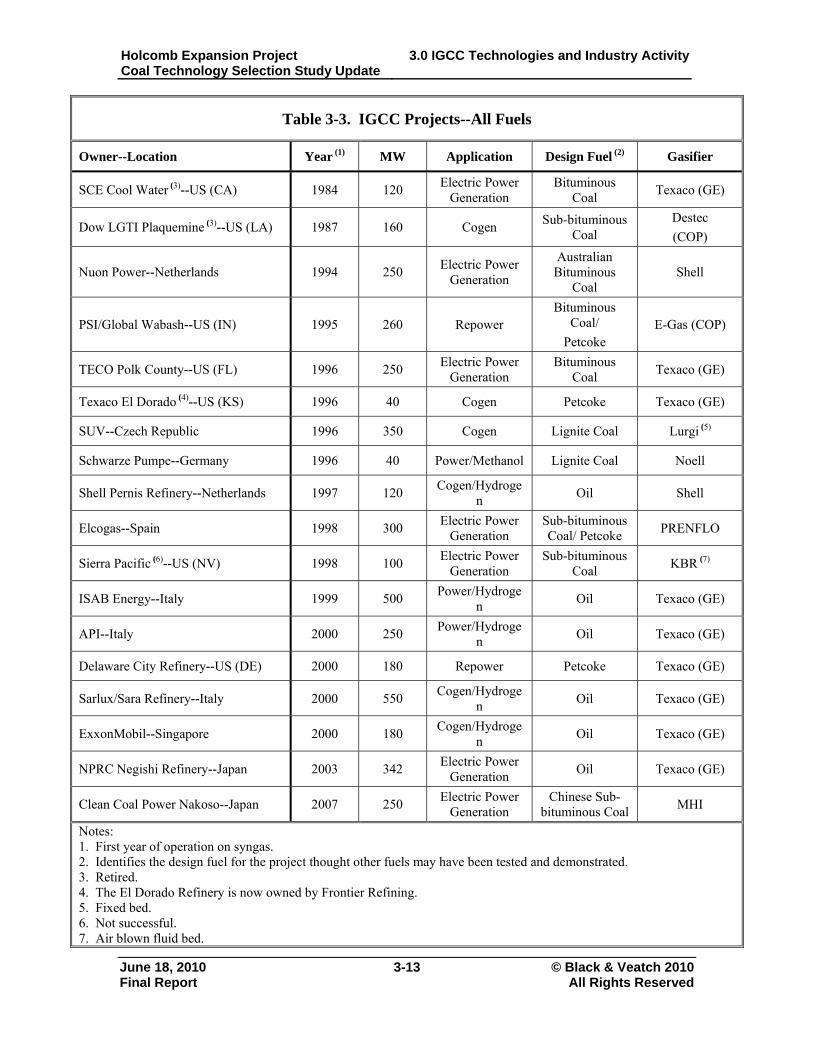
3.5 Commercial IGCC Experience There have been approximately 18 IGCC projects completed throughout the world, as listed in Table 3-3. Of these, 16 are based on entrained flow gasification technology. Ten of the projects were originally designed for coal, two for petcoke, and the other six for liquid fuels. Two of the coal-based IGCC plants, Cool Water in California and LGTI in Louisiana, were small demonstration projects and have been decommissioned. Another small coal IGCC demonstration project was Sierra Pacific’s Piñon Pine Project in Nevada. This project, based on KRW fluid bed technology, was not successful. The Schwarze Pumpe plant in Germany operated for many years but was shut down in 2007 because of the large cost of its waste to methanol operation. The plant is expected to restart on lignite fuel. To Black & Veatch’s knowledge, there are currently thirteen operating IGCC plants.
Holcomb Expansion Project Coal Technology Selection Study Update
3.0 IGCC Technologies and Industry Activity
June 18, 2010 3-13 © Black & Veatch 2010 Final Report All Rights Reserved
Table 3-3. IGCC Projects--All Fuels
Owner--Location Year (1) MW Application Design Fuel (2) Gasifier
SCE Cool Water (3)--US (CA) 1984 120 Electric Power
Generation Bituminous
Coal Texaco (GE)
Dow LGTI Plaquemine (3)--US (LA) 1987 160 Cogen Sub-bituminous
Coal Destec
(COP)
Nuon Power--Netherlands 1994 250 Electric Power
Generation
Australian Bituminous
Coal Shell
PSI/Global Wabash--US (IN) 1995 260 Repower Bituminous
Coal/
Petcoke E-Gas (COP)
TECO Polk County--US (FL) 1996 250 Electric Power
Generation Bituminous
Coal Texaco (GE)
Texaco El Dorado (4)--US (KS) 1996 40 Cogen Petcoke Texaco (GE)
SUV--Czech Republic 1996 350 Cogen Lignite Coal Lurgi (5)
Schwarze Pumpe--Germany 1996 40 Power/Methanol Lignite Coal Noell
Shell Pernis Refinery--Netherlands 1997 120 Cogen/Hydroge
n Oil Shell
Elcogas--Spain 1998 300 Electric Power
Generation Sub-bituminous Coal/ Petcoke
PRENFLO
Sierra Pacific (6)--US (NV) 1998 100 Electric Power
Generation Sub-bituminous
Coal KBR (7)
ISAB Energy--Italy 1999 500 Power/Hydroge
n Oil Texaco (GE)
API--Italy 2000 250 Power/Hydroge
n Oil Texaco (GE)
Delaware City Refinery--US (DE) 2000 180 Repower Petcoke Texaco (GE)
Sarlux/Sara Refinery--Italy 2000 550 Cogen/Hydroge
n Oil Texaco (GE)
ExxonMobil--Singapore 2000 180 Cogen/Hydroge
n Oil Texaco (GE)
NPRC Negishi Refinery--Japan 2003 342 Electric Power
Generation Oil Texaco (GE)
Clean Coal Power Nakoso--Japan 2007 250 Electric Power
Generation Chinese Sub-
bituminous Coal MHI
Notes: 1. First year of operation on syngas. 2. Identifies the design fuel for the project thought other fuels may have been tested and demonstrated. 3. Retired. 4. The El Dorado Refinery is now owned by Frontier Refining. 5. Fixed bed. 6. Not successful. 7. Air blown fluid bed.
Holcomb Expansion Project Coal Technology Selection Study Update
3.0 IGCC Technologies and Industry Activity
June 18, 2010 3-14 © Black & Veatch 2010 Final Report All Rights Reserved
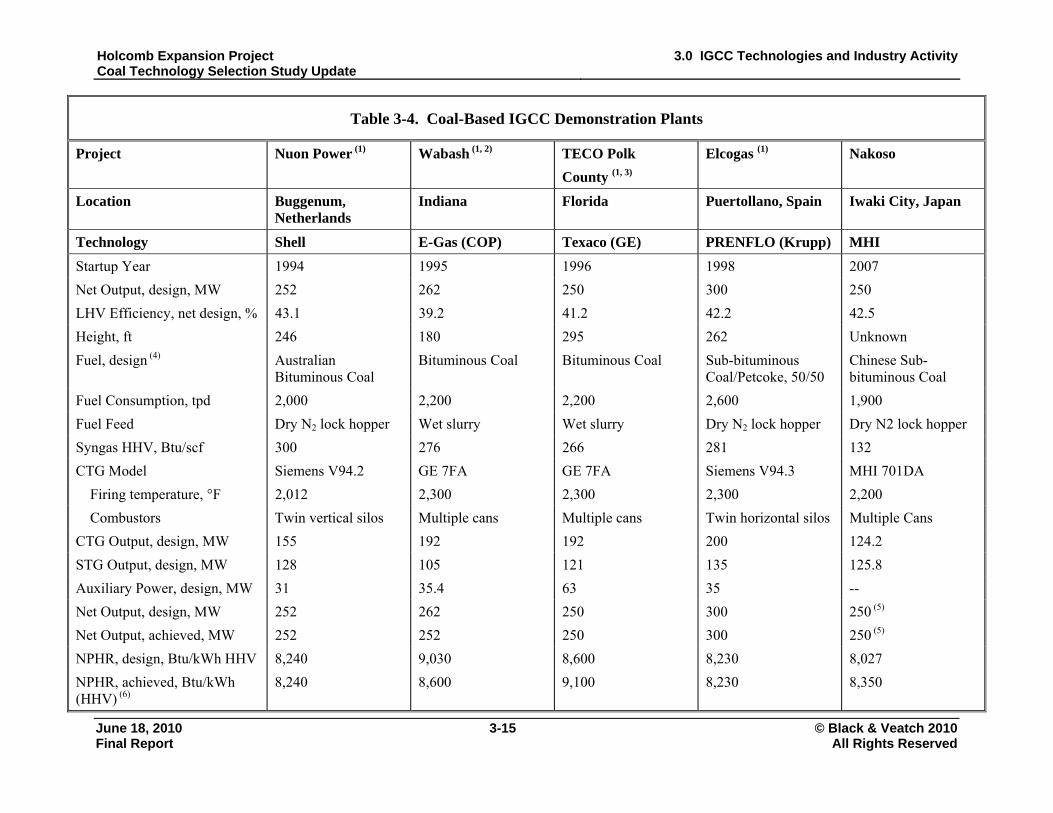
Of the six operating coal-based IGCC plants, one is a 350 MW lignite cogeneration plant that has 26 Lurgi fixed bed gasifiers, and five are, entrained flow gasification demonstration projects, ranging in capacity from 250 to 300 MW, which are located in Florida, Indiana, Japan, The Netherlands, and Spain. The Wabash Indiana IGCC plant did not operate for an extended period in 2004 and 2005 because of contractual problems, but it is currently operating. Design data for these five demonstration plants are indicated in Table 3-4.
Holcomb Expansion Project Coal Technology Selection Study Update
3.0 IGCC Technologies and Industry Activity
June 18, 2010 3-15 © Black & Veatch 2010 Final Report All Rights Reserved
Table 3-4. Coal-Based IGCC Demonstration Plants
Project Nuon Power (1) Wabash (1, 2) TECO Polk
County (1, 3)
Elcogas (1) Nakoso
Location Buggenum, Netherlands
Indiana Florida Puertollano, Spain Iwaki City, Japan
Technology Shell E-Gas (COP) Texaco (GE) PRENFLO (Krupp) MHI
Startup Year 1994 1995 1996 1998 2007
Net Output, design, MW 252 262 250 300 250
LHV Efficiency, net design, % 43.1 39.2 41.2 42.2 42.5
Height, ft 246 180 295 262 Unknown
Fuel, design (4) Australian Bituminous Coal
Bituminous Coal Bituminous Coal Sub-bituminous Coal/Petcoke, 50/50
Chinese Sub-bituminous Coal
Fuel Consumption, tpd 2,000 2,200 2,200 2,600 1,900
Fuel Feed Dry N2 lock hopper Wet slurry Wet slurry Dry N2 lock hopper Dry N2 lock hopper
Syngas HHV, Btu/scf 300 276 266 281 132
CTG Model Siemens V94.2 GE 7FA GE 7FA Siemens V94.3 MHI 701DA
Firing temperature, °F 2,012 2,300 2,300 2,300 2,200
Combustors Twin vertical silos Multiple cans Multiple cans Twin horizontal silos Multiple Cans
CTG Output, design, MW 155 192 192 200 124.2
STG Output, design, MW 128 105 121 135 125.8
Auxiliary Power, design, MW 31 35.4 63 35 --
Net Output, design, MW 252 262 250 300 250 (5)
Net Output, achieved, MW 252 252 250 300 250 (5)
NPHR, design, Btu/kWh HHV 8,240 9,030 8,600 8,230 8,027
NPHR, achieved, Btu/kWh (HHV) (6)
8,240 8,600 9,100 8,230 8,350
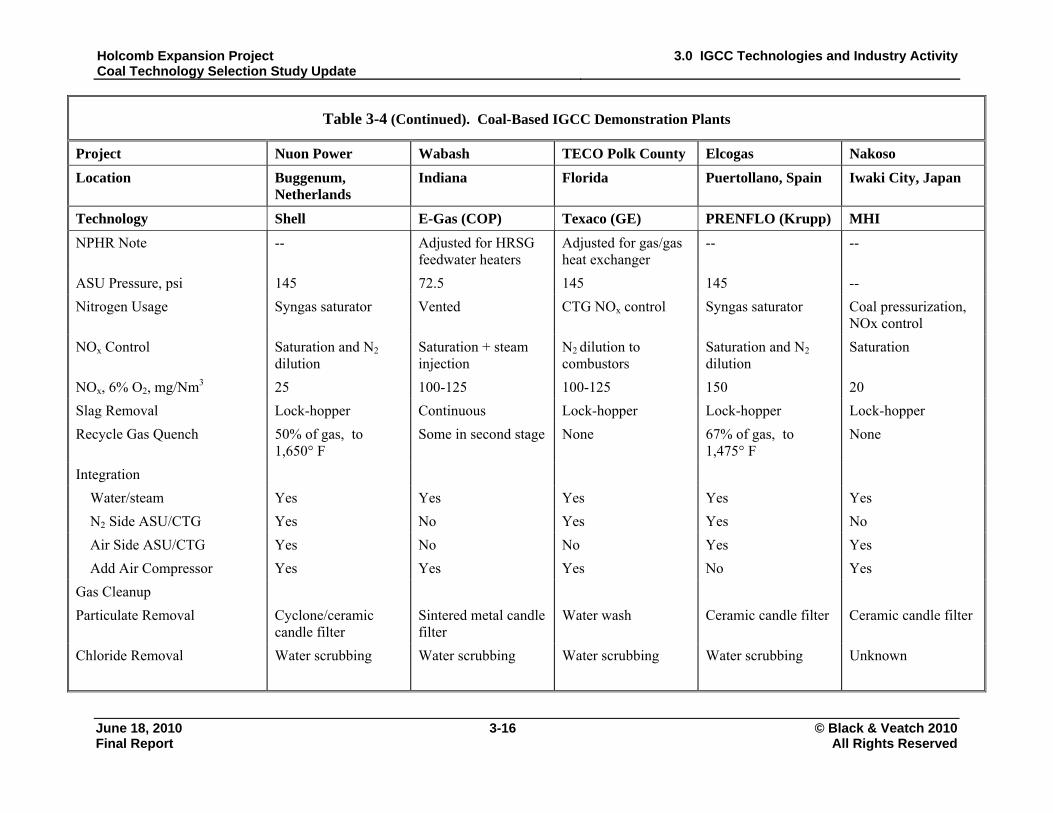
Holcomb Expansion Project Coal Technology Selection Study Update
3.0 IGCC Technologies and Industry Activity
June 18, 2010 3-16 © Black & Veatch 2010 Final Report All Rights Reserved
Table 3-4 (Continued). Coal-Based IGCC Demonstration Plants
Project Nuon Power Wabash TECO Polk County Elcogas Nakoso
Location Buggenum, Netherlands
Indiana Florida Puertollano, Spain Iwaki City, Japan
Technology Shell E-Gas (COP) Texaco (GE) PRENFLO (Krupp) MHI
NPHR Note -- Adjusted for HRSG feedwater heaters
Adjusted for gas/gas heat exchanger
-- --
ASU Pressure, psi 145 72.5 145 145 --
Nitrogen Usage Syngas saturator Vented CTG NOx control Syngas saturator Coal pressurization, NOx control
NOx Control Saturation and N2 dilution
Saturation + steam injection
N2 dilution to
combustors Saturation and N2 dilution
Saturation
NOx, 6% O2, mg/Nm3 25 100-125 100-125 150 20
Slag Removal Lock-hopper Continuous Lock-hopper Lock-hopper Lock-hopper
Recycle Gas Quench 50% of gas, to 1,650° F
Some in second stage None 67% of gas, to 1,475° F
None
Integration
Water/steam Yes Yes Yes Yes Yes
N2 Side ASU/CTG Yes No Yes Yes No
Air Side ASU/CTG Yes No No Yes Yes
Add Air Compressor Yes Yes Yes No Yes
Gas Cleanup
Particulate Removal Cyclone/ceramic candle filter
Sintered metal candle filter
Water wash Ceramic candle filter Ceramic candle filter
Chloride Removal
Water scrubbing Water scrubbing Water scrubbing Water scrubbing Unknown
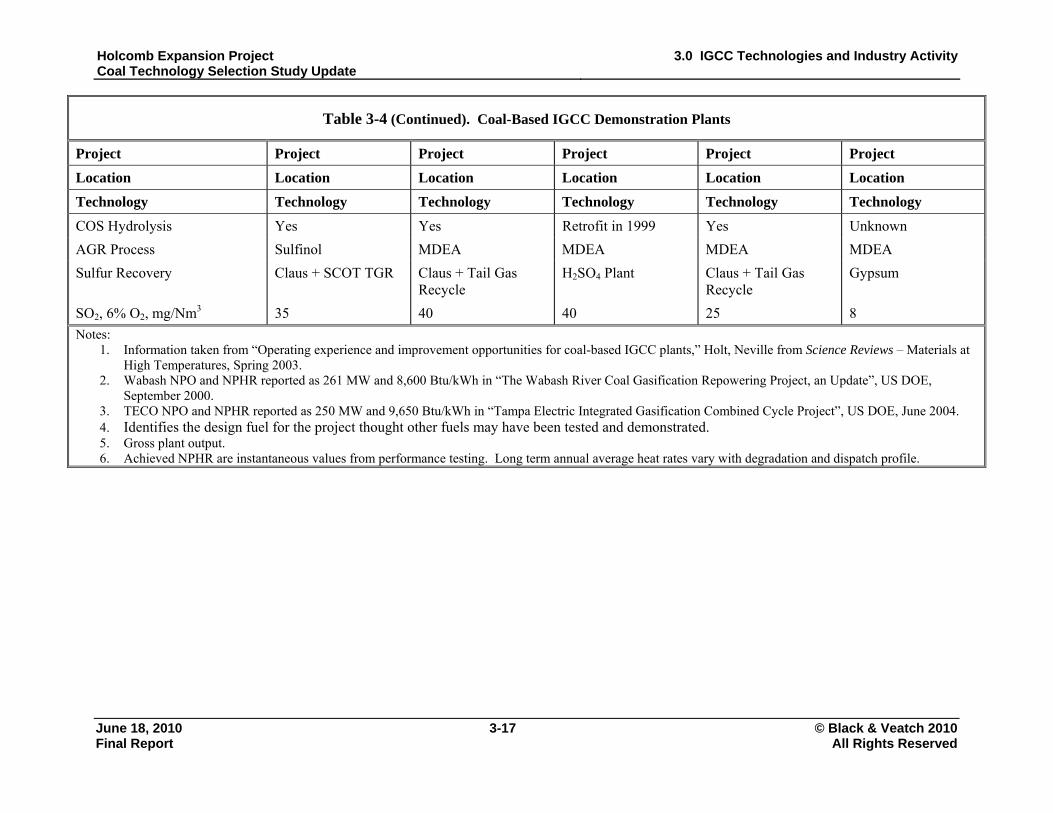
Holcomb Expansion Project Coal Technology Selection Study Update
3.0 IGCC Technologies and Industry Activity
June 18, 2010 3-17 © Black & Veatch 2010 Final Report All Rights Reserved
Table 3-4 (Continued). Coal-Based IGCC Demonstration Plants
Project Project Project Project Project Project
Location Location Location Location Location Location
Technology Technology Technology Technology Technology Technology
COS Hydrolysis Yes Yes Retrofit in 1999 Yes Unknown
AGR Process Sulfinol MDEA MDEA MDEA MDEA
Sulfur Recovery Claus + SCOT TGR Claus + Tail Gas Recycle
H2SO4 Plant Claus + Tail Gas Recycle
Gypsum
SO2, 6% O2, mg/Nm3 35 40 40 25 8
Notes: 1. Information taken from “Operating experience and improvement opportunities for coal-based IGCC plants,” Holt, Neville from Science Reviews – Materials at
High Temperatures, Spring 2003. 2. Wabash NPO and NPHR reported as 261 MW and 8,600 Btu/kWh in “The Wabash River Coal Gasification Repowering Project, an Update”, US DOE,
September 2000. 3. TECO NPO and NPHR reported as 250 MW and 9,650 Btu/kWh in “Tampa Electric Integrated Gasification Combined Cycle Project”, US DOE, June 2004. 4. Identifies the design fuel for the project thought other fuels may have been tested and demonstrated. 5. Gross plant output. 6. Achieved NPHR are instantaneous values from performance testing. Long term annual average heat rates vary with degradation and dispatch profile.
Holcomb Expansion Project Coal Technology Selection Study Update
3.0 IGCC Technologies and Industry Activity
June 18, 2010 3-18 © Black & Veatch 2010 Final Report All Rights Reserved
Each of the five projects was a government-subsidized IGCC demonstration, two in the United States, two in Europe, and one in Japan. Each of these IGCC plants consists of a single train (one ASU, one gasifier, one gas treating train, and one CC consisting of one CTG, one HRSG, and one STG). The Wabash IGCC unit has one spare gasifier in place; however, the spare gasifier is not connected to the process. Each plant experienced numerous problems during its first years of operation. Table 3-4 also summarizes the integration in each plant. Basically, there are three major areas for potential integration:
Water and steam between the power generation area and the gasification
island. High- and low-level heat rejection from the gasification process is
utilized to produce CC power.
The nitrogen side of the ASU and CTG. Waste nitrogen is mixed with the
syngas to reduce NOx formation and to increase power output.
The air side of the ASU and the CTG. Air is extracted from the CTG
compressor to reduce the auxiliary power and increase efficiency.
Figure 3-2 depicts potential areas of integration. The European plants have been
highly integrated, partly in response to higher fuel prices, while the US plants have been
less integrated. Both the Nuon Power Buggenum, Netherlands plant and the Elcogas
Puertollano, Spain plant experienced operating difficulties as a result of the highly
integrated design; most of these design and operating issues have been resolved.
Though the demonstration of these five commercial coal-fueled IGCC plants has
provided benchmarks for expected capacity and environmental performance, uncertainty
still remains regarding availability, reliability, and cost. The complexity and relative
immaturity of the IGCC process increases opportunities for deficiencies in design,
vendor-supplied equipment, construction, operation, and maintenance. The high risks of
capital cost overruns and low availability in the first few years of operation have
presented obstacles to the development of non-subsidized coal-fueled IGCC projects. In
addition, the long term operational efficiency of the demonstration plants is a better
indicator of efficiency than the initial heat rate testing that has been reported.
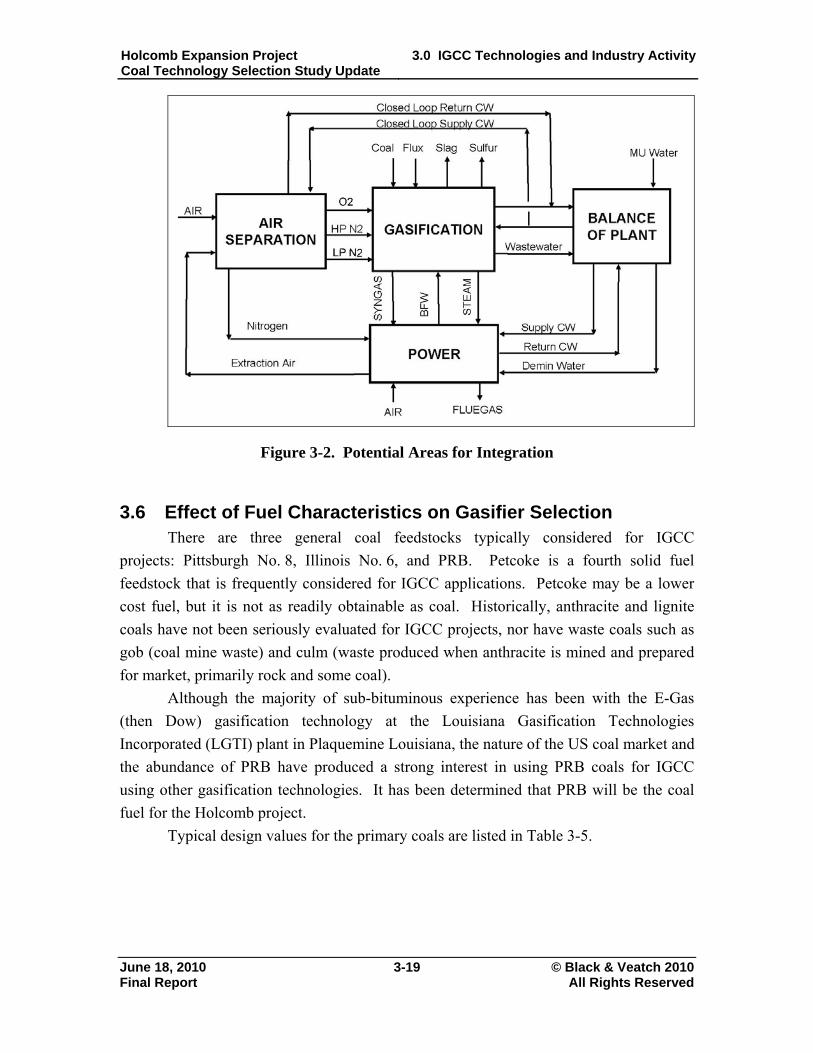
Holcomb Expansion Project Coal Technology Selection Study Update
3.0 IGCC Technologies and Industry Activity
June 18, 2010 3-19 © Black & Veatch 2010 Final Report All Rights Reserved
Figure 3-2. Potential Areas for Integration
3.6 Effect of Fuel Characteristics on Gasifier Selection There are three general coal feedstocks typically considered for IGCC
projects: Pittsburgh No. 8, Illinois No. 6, and PRB. Petcoke is a fourth solid fuel
feedstock that is frequently considered for IGCC applications. Petcoke may be a lower
cost fuel, but it is not as readily obtainable as coal. Historically, anthracite and lignite
coals have not been seriously evaluated for IGCC projects, nor have waste coals such as
gob (coal mine waste) and culm (waste produced when anthracite is mined and prepared
for market, primarily rock and some coal). Although the majority of sub-bituminous experience has been with the E-Gas
(then Dow) gasification technology at the Louisiana Gasification Technologies
Incorporated (LGTI) plant in Plaquemine Louisiana, the nature of the US coal market and
the abundance of PRB have produced a strong interest in using PRB coals for IGCC
using other gasification technologies. It has been determined that PRB will be the coal
fuel for the Holcomb project.
Typical design values for the primary coals are listed in Table 3-5.
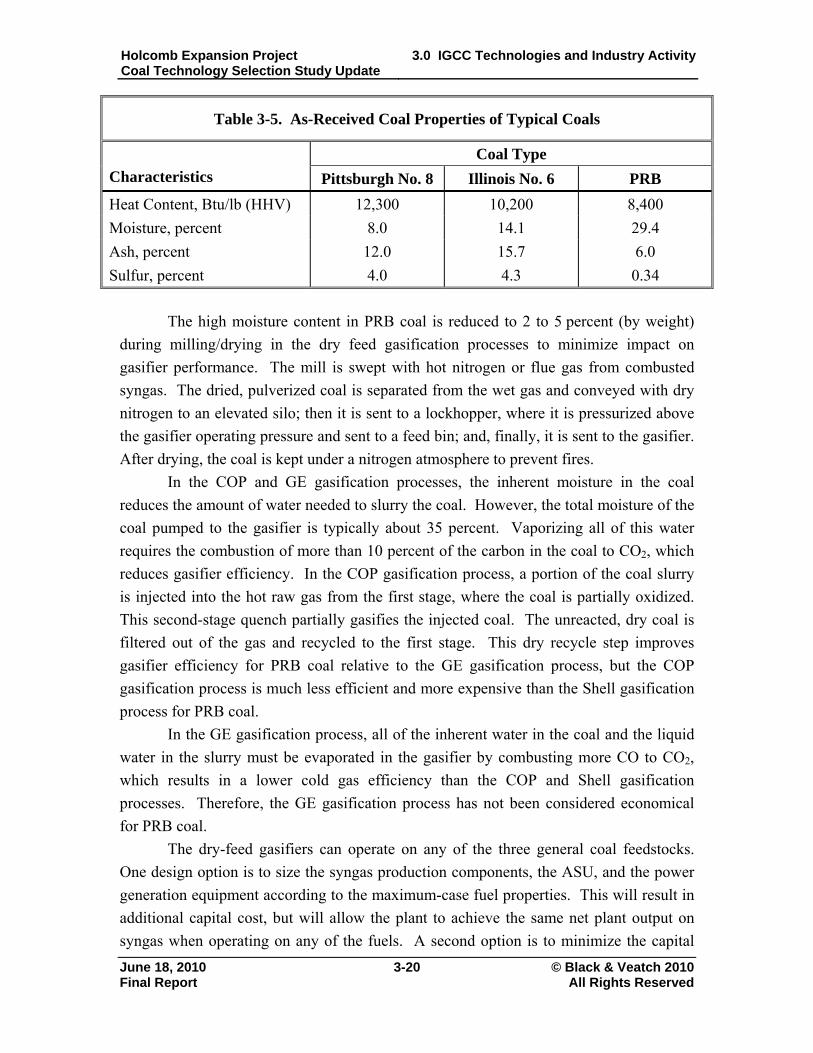
Holcomb Expansion Project Coal Technology Selection Study Update
3.0 IGCC Technologies and Industry Activity
June 18, 2010 3-20 © Black & Veatch 2010 Final Report All Rights Reserved
Table 3-5. As-Received Coal Properties of Typical Coals
Coal Type
Characteristics Pittsburgh No. 8 Illinois No. 6 PRB
Heat Content, Btu/lb (HHV) 12,300 10,200 8,400
Moisture, percent 8.0 14.1 29.4
Ash, percent 12.0 15.7 6.0
Sulfur, percent 4.0 4.3 0.34
The high moisture content in PRB coal is reduced to 2 to 5 percent (by weight)
during milling/drying in the dry feed gasification processes to minimize impact on
gasifier performance. The mill is swept with hot nitrogen or flue gas from combusted
syngas. The dried, pulverized coal is separated from the wet gas and conveyed with dry
nitrogen to an elevated silo; then it is sent to a lockhopper, where it is pressurized above
the gasifier operating pressure and sent to a feed bin; and, finally, it is sent to the gasifier.
After drying, the coal is kept under a nitrogen atmosphere to prevent fires.
In the COP and GE gasification processes, the inherent moisture in the coal
reduces the amount of water needed to slurry the coal. However, the total moisture of the
coal pumped to the gasifier is typically about 35 percent. Vaporizing all of this water
requires the combustion of more than 10 percent of the carbon in the coal to CO2, which
reduces gasifier efficiency. In the COP gasification process, a portion of the coal slurry
is injected into the hot raw gas from the first stage, where the coal is partially oxidized.
This second-stage quench partially gasifies the injected coal. The unreacted, dry coal is
filtered out of the gas and recycled to the first stage. This dry recycle step improves
gasifier efficiency for PRB coal relative to the GE gasification process, but the COP
gasification process is much less efficient and more expensive than the Shell gasification
process for PRB coal.
In the GE gasification process, all of the inherent water in the coal and the liquid
water in the slurry must be evaporated in the gasifier by combusting more CO to CO2,
which results in a lower cold gas efficiency than the COP and Shell gasification
processes. Therefore, the GE gasification process has not been considered economical
for PRB coal.
The dry-feed gasifiers can operate on any of the three general coal feedstocks.
One design option is to size the syngas production components, the ASU, and the power
generation equipment according to the maximum-case fuel properties. This will result in
additional capital cost, but will allow the plant to achieve the same net plant output on
syngas when operating on any of the fuels. A second option is to minimize the capital
Holcomb Expansion Project Coal Technology Selection Study Update
3.0 IGCC Technologies and Industry Activity
June 18, 2010 3-21 © Black & Veatch 2010 Final Report All Rights Reserved
expense; some examples of this include designing for a Pittsburgh No. 8 fuel and either
derating if other fuels are used or co-firing natural gas with the syngas.
3.7 IGCC Performance and Emissions Considerations IGCC net power output decreases with increasing ambient temperature, but this
reduction is less than that of a natural gas combined cycle (NGCC) plant. The reduction
in CTG air compressor capacity resulting from increased ambient temperature can be
compensated for by increased nitrogen injection, which results in constant CTG power
output, but increased auxiliary power consumption. Plant auxiliary power consumption
also increases slightly with the ambient temperature for ASU air compression and cooling
tower fans.
The CO and NOx emissions estimates are based on CTGs firing syngas with
nitrogen dilution and with SCR and CO oxidation catalyst in the HRSG. Some recent
IGCC projects have assumed SCR and CO oxidation catalysts. The need for SCR and
CO oxidation catalysts will be dependent on the permitting process and based on a BACT
review. The CO and NOx emissions estimates before SCR and CO catalyst are listed
below:
25 ppmvd CO in the CTG exhaust gas.
15 ppmvd NOx (at 15 percent by volume O2) in the CTG exhaust gas.
The SO2 emissions estimate was based on a 25 ppm molar concentration of sulfur
as H2S and COS in the syngas. Sulfur removal efficiencies of greater than 99 percent are
achievable for an IGCC plant processing high sulfur coal or petcoke. During normal
operation, a coal-fueled IGCC plant will have air emissions approaching those of an
NGCC plant. Flaring during startups, shutdowns, and upsets can result in significant SO2
emissions; however, the entrained flow gasification technologies under consideration can
be started up and shut down without sour gas flaring under normal conditions. Sour gas
flaring during upsets cannot be eliminated, but can be minimized by appropriate process
design and operating procedures.
Syngas will flow through sulfur impregnated carbon, which is estimated to lower
the syngas mercury concentration below 5 ppb by weight. Up to 40 percent of the
mercury in the coal may be removed upstream of the sulfur impregnated carbon by
scrubbing, which would reduce the mercury concentration to the inlet of the sulfur
impregnated carbon to 30 to 42 ppb by weight. Eastman Chemical Company’s coal
gasification plant has used sulfur impregnated carbon beds for mercury removal since its
startup in 1993. Eastman reports 90 to 95 percent mercury removal with a bed life of
18 to 24 months. Estimated emission limits are provided in Section 4.3.
Holcomb Expansion Project Coal Technology Selection Study Update
3.0 IGCC Technologies and Industry Activity
June 18, 2010 3-22 © Black & Veatch 2010 Final Report All Rights Reserved
3.8 Gasification Wastewater Treatment There are two general categories of plant wastewater:
Streams that contain metals from the as-received coal, referred to as
gasification wastewater streams.
Streams that do not contain these metals, referred to as balance-of-plant
wastewater streams.
The gasification wastewater streams will be combined and treated separately from
the balance-of-plant wastewater streams. Accurate specification of the process
wastewater composition has been a problem on other operating gasification plants
because of the wide variation in coal composition. The wastewater treatment design
should accommodate variation in wastewater composition. There are three basic options
for treating gasification wastewater streams:
The open discharge concept, which consists of metals precipitation, followed
by biological treatment to produce an effluent suitable for discharge.
The zero liquid discharge (ZLD) concept, which consists of lime softening,
followed by evaporation and/or crystallization to produce a solid salt for
landfill disposal.
Discharge to a municipal sewage treatment facility or other receiving stream.
This option is generally considered impractical because the coal gasification
wastewater exceeds typical pretreatment limitations.
Biological treatment of the gasification wastewater can be problematic because
the diverse contaminants are believed to be sufficiently variable so that the operation
would be unreliable, which could result in violations of expected permit requirements.
The open discharge system would cost approximately the same as the ZLD option and is
not a proven technology in this application. The operating costs are equivalent between
the ZLD and open discharge systems. However, ZLD requires additional LP steam that
could otherwise be used to generate an additional 2 to 5 MW of electricity.
3.9 Acid Gas Removal Technology Sulfur in coal is converted to H2S and COS during gasification. The molar ratio
of H2S to COS in the raw syngas from the gasifier varies according to the gasifier type,
from approximately 13 to 1 for the Shell gasifier to approximately 26 to 1 for the COP
and GE gasifiers. The resulting syngas is treated to meet CTG fuel and air emissions
permit requirements. The requirement is for total sulfur in the clean syngas to be less
than 25 ppm by weight, which is equivalent to 15 ppm by mole of COS and H2S.
Holcomb Expansion Project Coal Technology Selection Study Update
3.0 IGCC Technologies and Industry Activity
June 18, 2010 3-23 © Black & Veatch 2010 Final Report All Rights Reserved
The three primary solvents considered for IGCC AGR are Rectisol, Selexol, and
methyl diethanol amine (MDEA). Rectisol uses methanol as a solvent and is very
efficient at removing sulfur compounds, ammonia, VOCs, mercury, HCN, and carbonyls.
The technology can also be designed for efficient CO2 removal. Compared to Selexol
and MDEA the Rectisol technology is expensive.
Selexol solvent is a mixture of dimethyl ethers of polyethylene glycol,
CH3(CH2CH2O)nCH3, where n is between 3 and 9. UOP licenses Selexol technology for
treating syngas from gasification. Selexol is a physical solvent. Its capacity to absorb
sulfur compounds (including H2S) and to absorb CO2 increases with increasing pressure
and decreasing temperature.
MDEA (HOC2H4)2NCH3 is a chemical solvent, specifically a selective amine
used to remove H2S, while leaving most of the CO2 in the syngas. MDEA forms a
chemical bond with H2S and CO2. MDEA’s performance is nearly independent of
operating pressure. Typical absorber operating temperatures with amines are between 80
and 120 F. Lower absorber operating temperatures increase both H2S solubility and
selectivity over CO2.
Selection of an acid gas removal technology is an economic decision based on
tradeoffs between capital costs, operating and maintenance costs, and required reduction
in sulfur emissions.
3.10 Equivalent Availability In the near term, an IGCC plant is not expected to be as reliable as a PC or CFB
plant with respect to producing electricity from coal. Long-term equivalent availability
for an IGCC plant is estimated to be in the range of 80 to 85 percent. Well-operated PC
and CFB plants have established availabilities of 90 percent and greater. Based on past
experience, IGCC availability during initial startup and the first several years of operation
is expected to be significantly lower than the long-term targets. This can be mitigated by
firing the CTGs with backup fuel (such as natural gas or low sulfur fuel oil). The
equivalent availability of the combined cycle portion of an IGCC plant is expected to be
above 90 percent. The equivalent availability of an IGCC plant could also be increased
by providing a spare gasifier. Spare gasifier economics depend on the gasifier
technology, cost of backup fuel, and plant dispatch economics. As seen in the past with
other developing technologies, future generations of coal-fueled IGCC plants may take
advantage of the lessons learned from existing operating plants, but significant startup
problems should be expected.
Holcomb Expansion Project Coal Technology Selection Study Update
3.0 IGCC Technologies and Industry Activity
June 18, 2010 3-24 © Black & Veatch 2010 Final Report All Rights Reserved
3.10.1 First Generation IGCC Plants
Solids-related problems (erosion, pluggage, unstable flows, and syngas cooler
tube leaks) caused significant gasification downtime for the four oldest coal-based IGCC
demonstration plants. Gasifier burner and refractory maintenance also resulted in
significant downtime for the COP and GE gasifiers. For the Buggenum and Puertollano
plants, CTG problems related to syngas combustion and startup air extraction were
significant. Since the problems were identified, plant modifications and O&M
improvements have greatly improved performance; these plants now produce electricity
at design rates and close to design efficiencies. There is not currently enough
information on the Nakoso demonstration IGCC to determine where the early problems
have arisen. However, it is clear that some of their operating targets have been pushed
back. It is expected that these setbacks will be overcome with additional design
considerations and gained operational experience.
Estimated annual equivalent availabilities for producing electricity from coal
(syngas operation) are listed in Table 3-6 for the four oldest of the coal-based IGCC
plants discussed in Section 3.5. These equivalent availabilities are for electricity
production from coal or petcoke; power generation from firing the CTG on backup fuel is
excluded. Gasification process availability for each of these plants was poor during the
first several years of operation and continues to be a problem. The complexity and
relative technological immaturity of large-scale commercial gasification processes
increase opportunities for deficiencies in design, vendor-supplied equipment,
construction, and O&M. During the first several years of plant operation, most of these
deficiencies were corrected, and the plant staff has optimized the plant O&M as they
have “moved up the gasification learning curve.” Design improvements are expected to
be introduced on future IGCC plants, which should improve equivalent availability.
There is not enough information on the Nakoso plant to form an opinion on the plant
equivalent availability.
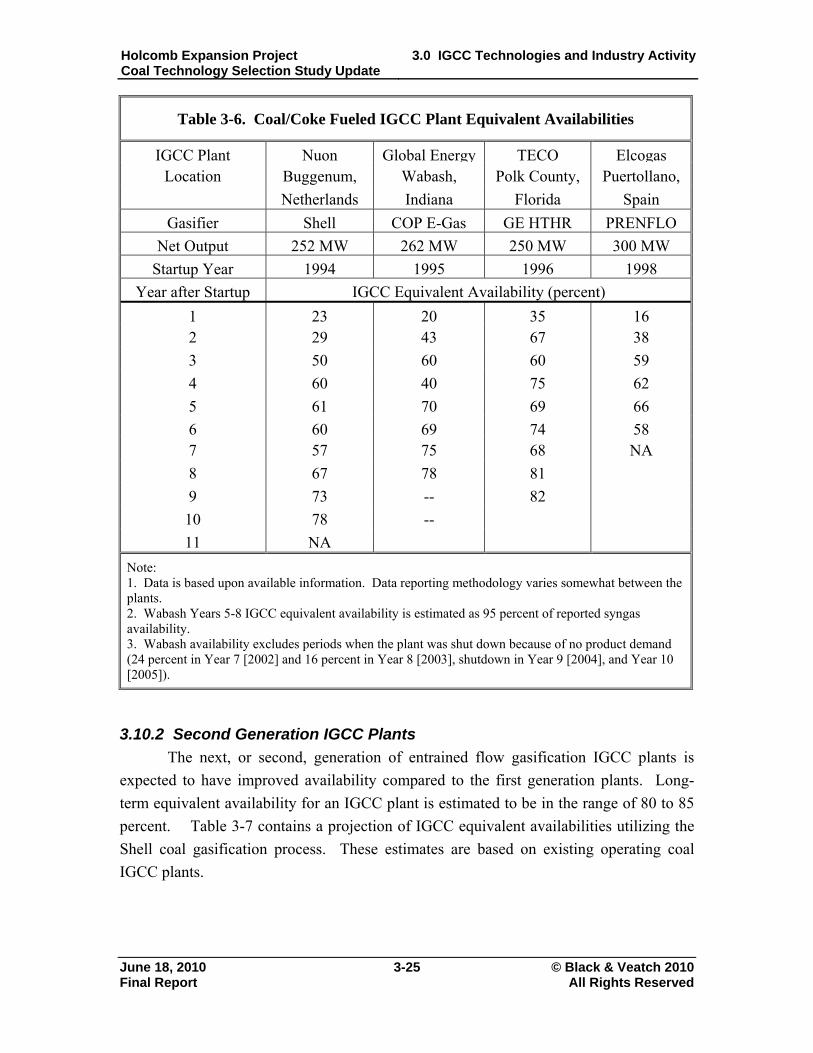
Holcomb Expansion Project Coal Technology Selection Study Update
3.0 IGCC Technologies and Industry Activity
June 18, 2010 3-25 © Black & Veatch 2010 Final Report All Rights Reserved
Table 3-6. Coal/Coke Fueled IGCC Plant Equivalent Availabilities
IGCC Plant Nuon Global Energy TECO ElcogasLocation Buggenum, Wabash, Polk County, Puertollano,
Netherlands Indiana Florida Spain
Gasifier Shell COP E-Gas GE HTHR PRENFLO
Net Output 252 MW 262 MW 250 MW 300 MW
Startup Year 1994 1995 1996 1998
Year after Startup IGCC Equivalent Availability (percent)
1 23 20 35 16 2 29 43 67 38
3 50 60 60 59
4 60 40 75 62
5 61 70 69 66
6 60 69 74 58 7 57 75 68 NA
8 67 78 81
9 73 -- 82
10 78 --
11 NA
Note: 1. Data is based upon available information. Data reporting methodology varies somewhat between the plants. 2. Wabash Years 5-8 IGCC equivalent availability is estimated as 95 percent of reported syngas availability. 3. Wabash availability excludes periods when the plant was shut down because of no product demand (24 percent in Year 7 [2002] and 16 percent in Year 8 [2003], shutdown in Year 9 [2004], and Year 10 [2005]).
3.10.2 Second Generation IGCC Plants
The next, or second, generation of entrained flow gasification IGCC plants is
expected to have improved availability compared to the first generation plants. Long-
term equivalent availability for an IGCC plant is estimated to be in the range of 80 to 85
percent. Table 3-7 contains a projection of IGCC equivalent availabilities utilizing the
Shell coal gasification process. These estimates are based on existing operating coal
IGCC plants.
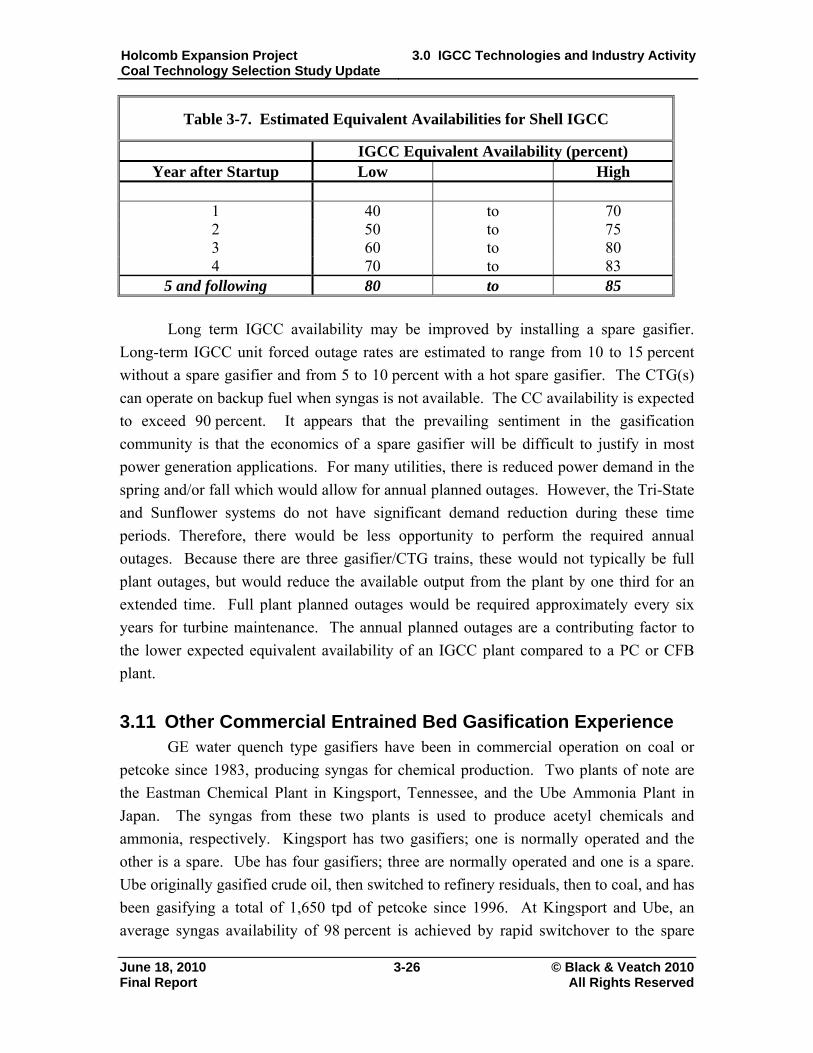
Holcomb Expansion Project Coal Technology Selection Study Update
3.0 IGCC Technologies and Industry Activity
June 18, 2010 3-26 © Black & Veatch 2010 Final Report All Rights Reserved
Table 3-7. Estimated Equivalent Availabilities for Shell IGCC
IGCC Equivalent Availability (percent) Year after Startup Low High
1 40 to 70 2 50 to 75 3 60 to 80 4 70 to 83
5 and following 80 to 85
Long term IGCC availability may be improved by installing a spare gasifier.
Long-term IGCC unit forced outage rates are estimated to range from 10 to 15 percent
without a spare gasifier and from 5 to 10 percent with a hot spare gasifier. The CTG(s)
can operate on backup fuel when syngas is not available. The CC availability is expected
to exceed 90 percent. It appears that the prevailing sentiment in the gasification
community is that the economics of a spare gasifier will be difficult to justify in most
power generation applications. For many utilities, there is reduced power demand in the
spring and/or fall which would allow for annual planned outages. However, the Tri-State
and Sunflower systems do not have significant demand reduction during these time
periods. Therefore, there would be less opportunity to perform the required annual
outages. Because there are three gasifier/CTG trains, these would not typically be full
plant outages, but would reduce the available output from the plant by one third for an
extended time. Full plant planned outages would be required approximately every six
years for turbine maintenance. The annual planned outages are a contributing factor to
the lower expected equivalent availability of an IGCC plant compared to a PC or CFB
plant.
3.11 Other Commercial Entrained Bed Gasification Experience GE water quench type gasifiers have been in commercial operation on coal or
petcoke since 1983, producing syngas for chemical production. Two plants of note are
the Eastman Chemical Plant in Kingsport, Tennessee, and the Ube Ammonia Plant in
Japan. The syngas from these two plants is used to produce acetyl chemicals and
ammonia, respectively. Kingsport has two gasifiers; one is normally operated and the
other is a spare. Ube has four gasifiers; three are normally operated and one is a spare.
Ube originally gasified crude oil, then switched to refinery residuals, then to coal, and has
been gasifying a total of 1,650 tpd of petcoke since 1996. At Kingsport and Ube, an
average syngas availability of 98 percent is achieved by rapid switchover to the spare
Holcomb Expansion Project Coal Technology Selection Study Update
3.0 IGCC Technologies and Industry Activity
June 18, 2010 3-27 © Black & Veatch 2010 Final Report All Rights Reserved
gasifier, which is on hot standby, and the high level of resources (e.g., O&M) applied to
the gasification process.
The Eastman Kingsport plant has occasionally been referred to as an IGCC plant.
This is incorrect because it produces no power; the Eastman plant produces syngas for
chemical production, with no power generation. The economics of chemical production
at the Eastman facility are different from the economics of the power market. As such, a
fully redundant gasifier is warranted at the Eastman facility. Eastman has made
gasification one of its focus areas, as evidenced by its formation of the Eastman
Gasification Services Company.
3.12 Current Announced Electric Generation Industry Activity Major industry participants, such as AEP and Duke, are considering implementing
IGCC projects. In addition, numerous smaller companies are pursuing gasification
projects using state and federal grants. One coal-fueled IGCC project is currently under
construction in the US. The Duke Energy Edwardsport plant is over 50 percent
completed. Duke expects the plant to begin commercial operations in late 2012 or early
2013. Although the Global Energy plant in Lima, Ohio, is technically under
construction, the company stopped construction October 2006 and has not been able to
generate enough financing to restart.
The four projects described below were selected because of their perceived stage
of development and their applicability to IGCC projects. The data contained in the
descriptions comes from publicly available sources. There is generally not enough data
to describe the scope of work associated with the cost estimates provided, or to compare
them with costs presented in this study.
3.12.1 Duke Energy
On October 26, 2004, PSI Energy, Cinergy’s (now Duke) Indiana subsidiary,
signed a letter of intent with GE and Bechtel Corporation to study the feasibility of an
IGCC plant. This letter of intent was the first step toward reaching a contract to design
and construct the plant. This plant was the first one announced under the GE/Bechtel
alliance.
On September 21, 2005, Vectren Corp. and Cinergy/PSI announced that they
would work together on plans for a clean coal power plant that would generate about 600
MW of electrical capacity. On March 10, 2006, Cinergy and Duke Energy merged under
and retained the Duke Energy name. On March 22, 2006, an agreement was signed with
GE and Bechtel to begin a FEED, which took about 12 months to complete.
Holcomb Expansion Project Coal Technology Selection Study Update
3.0 IGCC Technologies and Industry Activity
June 18, 2010 3-28 © Black & Veatch 2010 Final Report All Rights Reserved
Construction on the Edwardsport plant began in 2008 and has progressed steadily. The
plant is scheduled to reach mechanical completion in 2012.
3.12.2 Excelsior Energy, Inc.
On June 10, 2004, COP and Excelsior Energy, Inc., signed a development and
technology licensing agreement for an IGCC plant utilizing COP E-Gas technology.
Excelsior’s Mesaba Energy Project will be located in northeastern Minnesota in an area
known as the Iron Range.
Excelsior has been engaged in the development of this project since 2001. The
Mesaba Energy Project has received broad-based support from state government, labor,
business, and political leaders within Minnesota and in Washington, DC. Supportive
legislation passed in Minnesota provides the project with an exemption from the
certificate of need process for initial and future generation and transmission.
On October 26, 2004, the US DOE announced that the Excelsior Energy team had
been selected to receive a $36 million award as part of the 2002 CCPI. At that time, the
estimated total cost for the coal-based demonstration project was reported to be $1.18
billion (the basis for this number is unclear). This project was one of two selected to
demonstrate advanced power generation systems using IGCC technology. Excelsior
Energy has also been awarded $10 million in funding from a Minnesota renewable
energy account.
On August 29, 2005, Excelsior Energy announced that it had selected a preferred
and an alternate site. The preferred site is in Itasca County, Minnesota. Approval of site
selection must be obtained from the Minnesota Public Utilities Commission. Excelsior
Energy has secured an option for more than 1,000 acres. The project cost for a single
600 MW 2-on-1 IGCC facility was reported as $1.5 billion.
On October 5, 2005, the US DOE announced its intent to prepare an
Environmental Impact Statement (EIS). In an October 2005 presentation, the total
project cost was identified as $1.97 billion (the basis for this number is unclear, but likely
includes O&M and fuel for the demonstration period), with the project expected to be
operational in 2012 and producing up to 600 MW (net) of electricity. A 2012 operational
date appears unlikely since construction has not yet started. The project is expected to be
able to utilize bituminous and sub-bituminous coals as well as petcoke blends. The
design heat rate, utilizing bituminous coal, would be 8,600 Btu/kWh.
The March 27, 2006, issue of GHG Transactions & Technologies reported that the
project will capture between 20 and 30 percent of the CO2 emissions when it begins
operation. On May 22, 2006, funding was received from the US DOE.
Holcomb Expansion Project Coal Technology Selection Study Update
3.0 IGCC Technologies and Industry Activity
June 18, 2010 3-29 © Black & Veatch 2010 Final Report All Rights Reserved
Since 2006, Excelsior has been making minor headway in project development
including an agreement with COP for a process design package, acquisition of rights to a
site, execution of transmission agreements, and completion of the environmental impact
study. The project was also selected by the US DOE for its federal loan guarantee
program.
3.12.3 Sweeny IGCC/SNG Project
COP is developing the Sweeny IGCC and SNG project to produce power and
energy for the Sweeny oil refining complex. Project development began in 2008 when
COP completed conceptual engineering of the plant. The project will use the common
technologies for IGCC and SNG production to produce a syngas stream that can be used
for either power generation or for SNG production. The gasifier feed will be petcoke
produced at the adjacent Sweeny refinery. The plant will replace or supplement a 440
MW gas fired cogeneration plant that currently supplies power and steam to the refinery.
The IGCC plant is also expected to capture and sequester about 85 percent of its CO2
emissions.
In 2009 the Sweeny gasification project was selected by the US DOE for a $3
million cooperative agreement cost sharing for project development. COP is hopeful that
the project will also be selected to receive $1.4 billion of ARRA funds. The plant is
expected to begin operations in 2014 or 2015.
3.12.4 The ERORA Group, LLC
In 2004, the ERORA Group began developing the Taylorville Energy Center, a
677 MW minemouth IGCC project in Illinois based on GE technology. The reported
project cost at that time was $1.1 billion (the basis for this number is unclear), with a
projected construction start in 2007 and a commercial operation date in 2010. Permits for
the mine have been acquired, and the air permit application has been filed. The Illinois
Clean Coal Review Board (CCRB) and the Illinois Department of Economic Opportunity
awarded ERORA a $5.75 million grant for feasibility studies, as well as engineering and
design studies.
On April 5, 2005, Eastman Chemical Company and ERORA entered into an
agreement to study the feasibility of chemicals co-production at the proposed IGCC
facility. Initially envisioned as a PC facility in 2003, ERORA received a grant from the
Illinois CCRB to study the potential for coal gasification. The co-production of
chemicals from syngas has the potential to significantly improve the economics of power
generation. The project is expected to be based on a 2-on-1 7FB CC with three gasifiers
(two, plus one full spare).
Holcomb Expansion Project Coal Technology Selection Study Update
3.0 IGCC Technologies and Industry Activity
June 18, 2010 3-30 © Black & Veatch 2010 Final Report All Rights Reserved
On January 23, 2006, ERORA signed a license agreement with GE Energy,
authorizing the use of GE’s gasification technology for the project. GE also has been
selected to provide the process design for the gasification portion of the facility and the
power island.
Between 2006 and 2010 the plant design changed from a pure IGCC design
without CO2 capture to a co-production design for producing SNG and power. The
power plant is expected to be a state-of-the-art SNG fired combined cycle. The plant
could be run in SNG mode or power mode depending on the prices of electricity and
SNG. SNG production has CO2 capture inherent in its design. The state of Illinois
passed a clean coal bill early in 2009 that provided funds for a FEED study of the
Taylorville Energy Center. In March 2010 ERORA estimated that the total cost of the
plant would be about $3.5 billion. The basis of this cost estimate is unknown.
ERORA is also developing a similar project in Henderson County, Kentucky,
known as Cash Creek.
3.12.5 Mississippi Power
Mississippi Power, a wholly owned subsidiary of Southern Company, announced
on May 27, 2010 the continued development of the Kemper County IGCC power plant,
reversing their announcement on April 30, 2010 to cancel the project. The announcement
to further pursue the project followed the Mississippi Public Service Commission’s
issuance of a new order which conditionally approves the construction of the plant. The
new order raises the cost cap of the plant to $2.88 billion and allows Mississippi Power to
raise financing capital for the plant from its customers prior to the commercial operation
of the plant beginning in 2012. The original order issued by the Public Service
Commission did not allow Mississippi Power to raise financing capital for the plant from
its customers prior to commercial operation. The original order also stipulated that the
plant had to be constructed at a cost less than $2.4 billion. This original order by the
Mississippi Public Service Commission was in response to Mississippi Power’s January
16, 2009 filing for a certificate of public convenience and necessity to construct the
proposed IGCC plant.
The IGCC plant will utilize transport integrated gasification (TRIG) technology,
has a planned net capacity of 582 MW, and an expected commercial operation date of
2014. The project will make use of regionally available lignite coal. Southern Company,
along with the US DOE, has been engaged in the development and research of coal
gasification technologies at the Power Systems Development Facility (PSDF) near
Wilsonville, Alabama. The Kemper County IGCC facility is planned to be a scale-up of
the plant already in operation at the PSDF facility. The scaled-up design was developed
Holcomb Expansion Project Coal Technology Selection Study Update
3.0 IGCC Technologies and Industry Activity
June 18, 2010 3-31 © Black & Veatch 2010 Final Report All Rights Reserved
collaboratively by Southern Company, Kellogg Brown Root (KBR), and the US DOE.
The TRIG design is intended to be capable of gasifying low rank coals such as PRB and
lignite.
3.12.6 Summary of Proposed Projects
The development activities of the four projects discussed in the previous
subsections represent advances in the development of new IGCC plants within the US.
Entrained flow gasification technology has been selected for four of the five projects.
The Duke and ERORA projects are based on bituminous coal. Excelsior Energy
anticipates a blend of fuels that would include PRB coal, Illinois coal, and/or petcoke.
The Sweeny project is based on petcoke. The Mississippi Power project plans to gasify
lignite.
Since 2006 there has been an increased interest in producing SNG via gasification
and then using the SNG to produce power. This has been evident in the focus of some
IGCC plants to co-produce SNG and power. Other projects have focused only on SNG
production and only produce power as a bottoming cycle to the SNG process. Black &
Veatch expects that the continued interest in SNG production will be tied to natural gas
prices.
Holcomb Expansion Project Coal Technology Selection Study Update
4.0 Technology Screening Performance and Cost Estimates
June 18, 2010 4-1 © Black & Veatch 2010 Final Report All Rights Reserved
4.0 Technology Screening Performance and Cost Estimates
Black & Veatch developed performance and cost estimates of four baseload
generation technology options. The performance and cost data were utilized in a busbar
screening tool discussed in Section 5.0. For purposes of this evaluation, it was critical
that the technologies be evaluated on a consistent basis relative to each other. The
following four baseload technologies were considered:
Supercritical PC.
Subcritical PC.
CFB.
IGCC.
The needs of the project require a net plant output of 895 MW. Therefore, the
units were designed to produce at least 895 MW (net) at the plant boundary at any
ambient temperature less than the hot day. The PC and CFB units were sized at 895
MW net. The IGCC unit was configured to best satisfy this requirement without
substantially exceeding a net plant output of 895 MW. Duct firing capabilities were not
included with the IGCC unit.
The cost estimates have assumed that this project would be an add-on unit at the
existing Holcomb Station.
4.1 Assumptions Black & Veatch developed a list of assumptions for each technology. These
assumptions are provided in the following subsections.
4.1.1 Overall Assumptions
The plant location would be in western Kansas. For the basis of the estimates, an
elevation of 2,915 feet (the elevation of Holcomb, Kansas) was selected. Project
conditions include the following:
Ambient pressure--13.21 psia.
Hot day--94° F dry bulb, 73° F wet bulb.
Average day--52° F dry bulb, 43° F wet bulb.
Powder River Basin (PRB) coal from the Dry Fork mine is assumed as the
fuel source. Dry Fork mine ultimate and proximate analysis is provided in
Table 4-1.
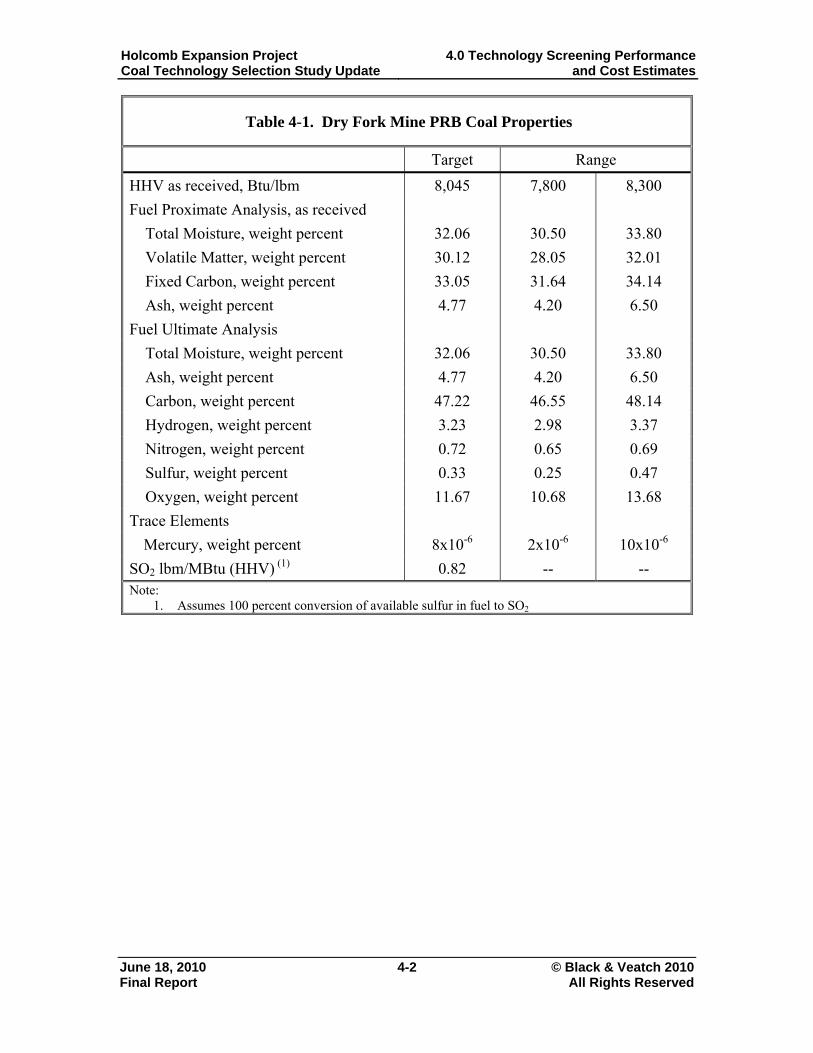
Holcomb Expansion Project Coal Technology Selection Study Update
4.0 Technology Screening Performance and Cost Estimates
June 18, 2010 4-2 © Black & Veatch 2010 Final Report All Rights Reserved
Table 4-1. Dry Fork Mine PRB Coal Properties
Target Range
HHV as received, Btu/lbm 8,045 7,800 8,300
Fuel Proximate Analysis, as received
Total Moisture, weight percent 32.06 30.50 33.80
Volatile Matter, weight percent 30.12 28.05 32.01
Fixed Carbon, weight percent 33.05 31.64 34.14
Ash, weight percent 4.77 4.20 6.50
Fuel Ultimate Analysis
Total Moisture, weight percent 32.06 30.50 33.80
Ash, weight percent 4.77 4.20 6.50
Carbon, weight percent 47.22 46.55 48.14
Hydrogen, weight percent 3.23 2.98 3.37
Nitrogen, weight percent 0.72 0.65 0.69
Sulfur, weight percent 0.33 0.25 0.47
Oxygen, weight percent 11.67 10.68 13.68
Trace Elements
Mercury, weight percent 8x10⁻⁶ 2x10⁻⁶ 10x10-6
SO2 lbm/MBtu (HHV) (1) 0.82 -- -- Note:
1. Assumes 100 percent conversion of available sulfur in fuel to SO2
Holcomb Expansion Project Coal Technology Selection Study Update
4.0 Technology Screening Performance and Cost Estimates
June 18, 2010 4-3 © Black & Veatch 2010 Final Report All Rights Reserved
4.1.2 Thermal Unit Cycle Arrangement Assumptions
Cycle arrangement assumptions specific to each PC and CFB case used in the
development of the estimates are summarized in Table 4-2. Cycle arrangement
assumptions were developed based on Black & Veatch experience.
AQCS were selected as a design basis to develop performance and cost estimates
and were selected to meet anticipated air quality requirements. Actual AQCS would be
selected to control criteria pollutants under a Prevention of Significant Deterioration
(PSD) permit and would be subject to a Best Available Control Technology Review
(BACT). AQCS are based on input from Tri-State/Sunflower and their recent permitting
activities with the Holcomb new unit addition. The assumed AQCS for the PC and CFB
technologies are provided as follows:
PC
o NOx Control
Combustion controls -- Low NOx burners (LNB) and over-fire air
(OFA) (air staging).
Post combustion controls -- Selective catalytic reduction (SCR)
o SO2 Control -- Semi-dry lime spray dryer absorber (SDA) flue gas
desulfurization (FGD).
o CO Control -- Combustion design and boiler tuning.
o PM10 Control -- Pulse jet fabric filter (PJFF).
o Hg Control -- Brominated activated carbon injection (ACI).
CFB
o NOx Control
Combustion controls -- Combustion design (low combustion
temperatures), OFA.
Post combustion controls -- Selective non-catalytic reduction (SNCR).
o SO2 Control – In-bed sorbent injection and polishing semi-dry lime spray
dryer absorber (SDA) FGD.
o CO Control -- Combustion design and boiler tuning.
o PM10 Control -- PJFF.
o Hg Control -- Brominated ACI.
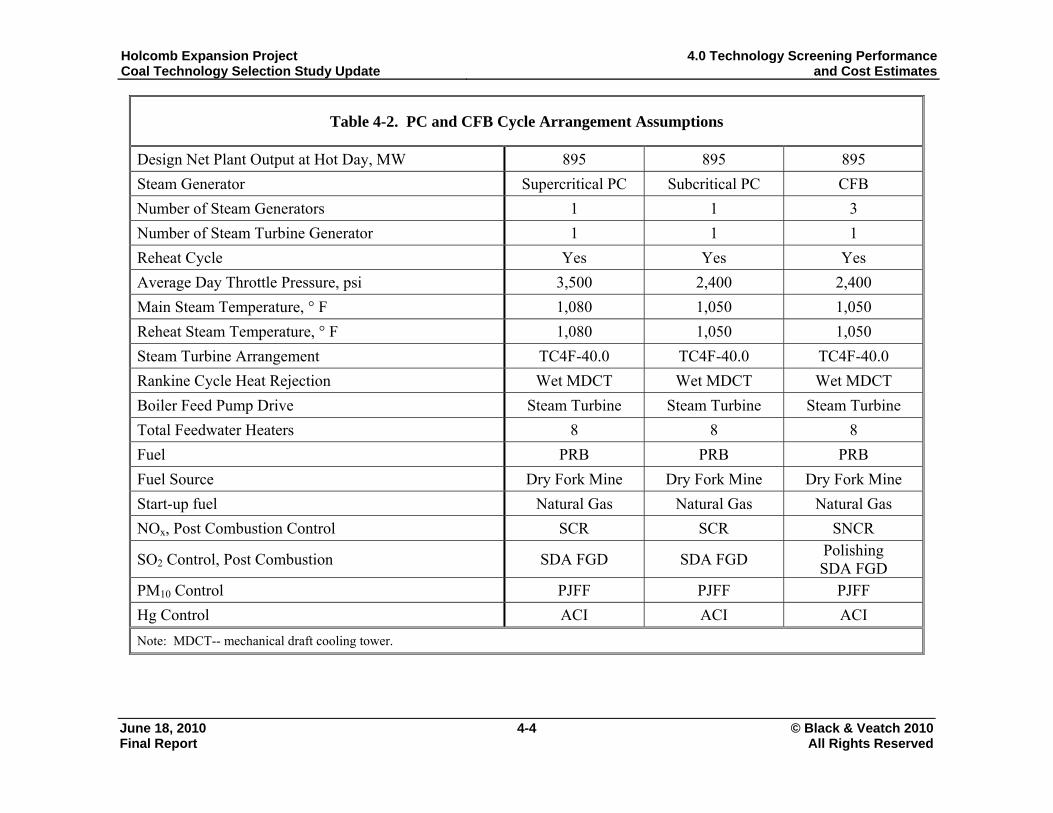
Holcomb Expansion Project Coal Technology Selection Study Update
4.0 Technology Screening Performance and Cost Estimates
June 18, 2010 4-4 © Black & Veatch 2010 Final Report All Rights Reserved
Table 4-2. PC and CFB Cycle Arrangement Assumptions
Design Net Plant Output at Hot Day, MW 895 895 895
Steam Generator Supercritical PC Subcritical PC CFB
Number of Steam Generators 1 1 3
Number of Steam Turbine Generator 1 1 1
Reheat Cycle Yes Yes Yes
Average Day Throttle Pressure, psi 3,500 2,400 2,400
Main Steam Temperature, ° F 1,080 1,050 1,050
Reheat Steam Temperature, ° F 1,080 1,050 1,050
Steam Turbine Arrangement TC4F-40.0 TC4F-40.0 TC4F-40.0
Rankine Cycle Heat Rejection Wet MDCT Wet MDCT Wet MDCT
Boiler Feed Pump Drive Steam Turbine Steam Turbine Steam Turbine
Total Feedwater Heaters 8 8 8
Fuel PRB PRB PRB
Fuel Source Dry Fork Mine Dry Fork Mine Dry Fork Mine
Start-up fuel Natural Gas Natural Gas Natural Gas
NOx, Post Combustion Control SCR SCR SNCR
SO2 Control, Post Combustion SDA FGD SDA FGD Polishing SDA FGD
PM10 Control PJFF PJFF PJFF
Hg Control ACI ACI ACI
Note: MDCT-- mechanical draft cooling tower.
Holcomb Expansion Project Coal Technology Selection Study Update
4.0 Technology Screening Performance and Cost Estimates
June 18, 2010 4-5 © Black & Veatch 2010 Final Report All Rights Reserved
4.1.3 IGCC Cycle Arrangement Assumptions
Unlike conventional PC and CFB units, an IGCC unit cannot be sized to match a
selected net plant output. The constraints are similar to that of a conventional natural gas
fired simple or combined cycle units. The CTGs come in discrete sizes and are much
more sensitive to changes in elevation and ambient temperature than thermal plants.
Currently, the available IGCC design configurations are based on state-of-the-art
conventional “F” class CTGs modified to fire syngas. The GE 7F-SG and the SPG
SGT6-5000F CTGs are the most likely models to be incorporated into an IGCC. At ISO
conditions (sea level, 59 F, 60 percent relative humidity), these CTGs are rated at
232 MW when firing syngas. A single 7F-SG or SGT6-5000F in an IGCC configuration
produces a nominal 300 MW (net) at ISO conditions. Hence, a 3-on-1 IGCC
configuration will produce a nominal 900 MW (net) at ISO conditions. The net output
will vary somewhat depending on the gasification technology employed, as well as with
the degree of integration.
The IGCC unit was configured to best satisfy the 895 MW (net) project capacity
without substantially exceeding a net plant output of 895 MW. IGCC units utilize CTGs
and large air compressors in the ASU. Because CTGs and air compressors are mass flow
devices, their performance is affected with changes in ambient conditions. Generally
speaking, as temperatures rise, and ambient pressure drops, CTG efficiency and output
decreases while air compressor loads increase, due to the lower density of the air. A
decrease in CTG gross output and an increase in ASU auxiliary load have a negative
effect on plant performance. The coal gasification process itself is minimally affected by
changes in ambient conditions. Adjusting for site-specific elevation and temperature, the
resultant net plant capacity at the average annual temperature is 800,900 kW. On a peak
summer day, this output is further degraded to 747,300 kW. The net output on a hot day
can be partially restored using evaporative inlet cooling on the CTGs.
Cycle arrangement assumptions used in the development of the estimates are
summarized in Table 4-3. Cycle arrangement assumptions were developed based on
Black & Veatch experience.
Holcomb Expansion Project Coal Technology Selection Study Update
4.0 Technology Screening Performance and Cost Estimates
June 18, 2010 4-6 © Black & Veatch 2010 Final Report All Rights Reserved
AQCS were selected as a design basis to develop performance and cost estimates
and were selected to meet anticipated air quality requirements. Actual AQCS would be
selected to control criteria pollutants under a PSD permit and would be subject to a
BACT. The assumed AQCS for the IGCC technology is provided as follows:
NOx Control
o SCR catalyst.
o Nitrogen dilution.
o Syngas saturation.
SO2 Control
o COS hydrolysis.
o Selexol acid gas removal.
o Claus SRU with tailgas recycle.
PM10 Control
o Candle filter.
Hg Control -- sulfided carbon bed.
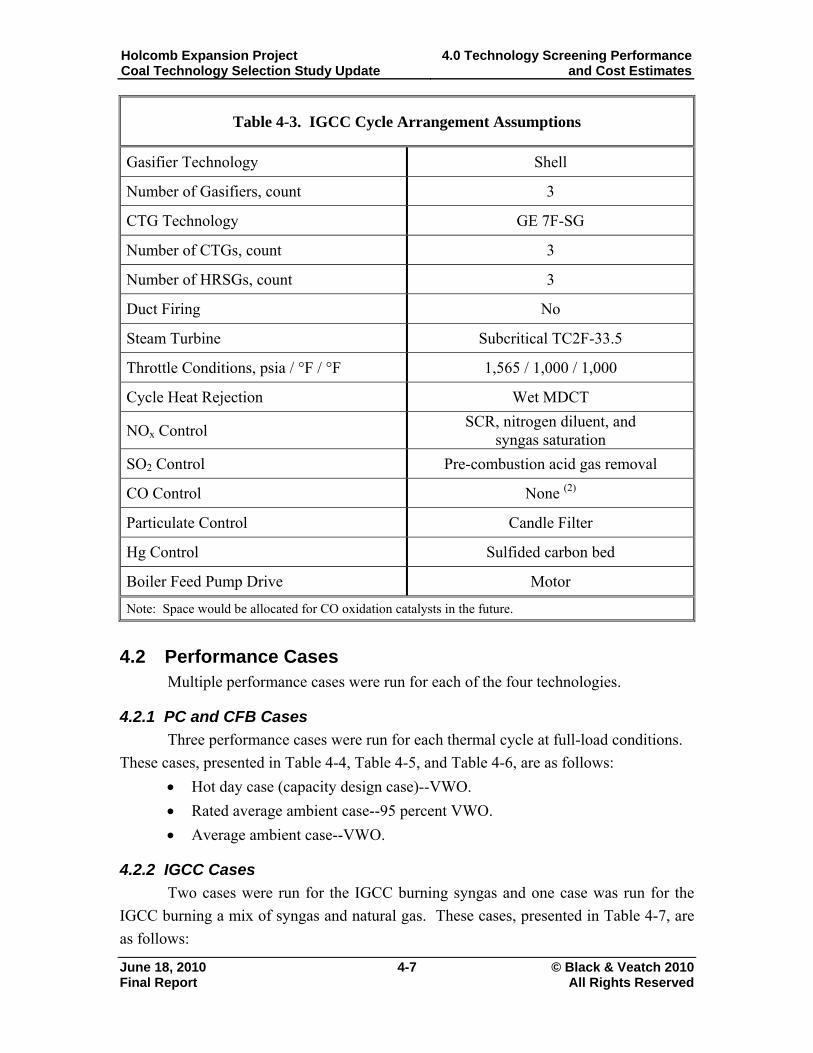
Holcomb Expansion Project Coal Technology Selection Study Update
4.0 Technology Screening Performance and Cost Estimates
June 18, 2010 4-7 © Black & Veatch 2010 Final Report All Rights Reserved
Table 4-3. IGCC Cycle Arrangement Assumptions
Gasifier Technology Shell
Number of Gasifiers, count 3
CTG Technology GE 7F-SG
Number of CTGs, count 3
Number of HRSGs, count 3
Duct Firing No
Steam Turbine Subcritical TC2F-33.5
Throttle Conditions, psia / °F / °F 1,565 / 1,000 / 1,000
Cycle Heat Rejection Wet MDCT
NOx Control SCR, nitrogen diluent, and
syngas saturation
SO2 Control Pre-combustion acid gas removal
CO Control None (2)
Particulate Control Candle Filter
Hg Control Sulfided carbon bed
Boiler Feed Pump Drive Motor
Note: Space would be allocated for CO oxidation catalysts in the future.
4.2 Performance Cases Multiple performance cases were run for each of the four technologies.
4.2.1 PC and CFB Cases
Three performance cases were run for each thermal cycle at full-load conditions.
These cases, presented in Table 4-4, Table 4-5, and Table 4-6, are as follows:
Hot day case (capacity design case)--VWO.
Rated average ambient case--95 percent VWO.
Average ambient case--VWO.
4.2.2 IGCC Cases
Two cases were run for the IGCC burning syngas and one case was run for the
IGCC burning a mix of syngas and natural gas. These cases, presented in Table 4-7, are
as follows:
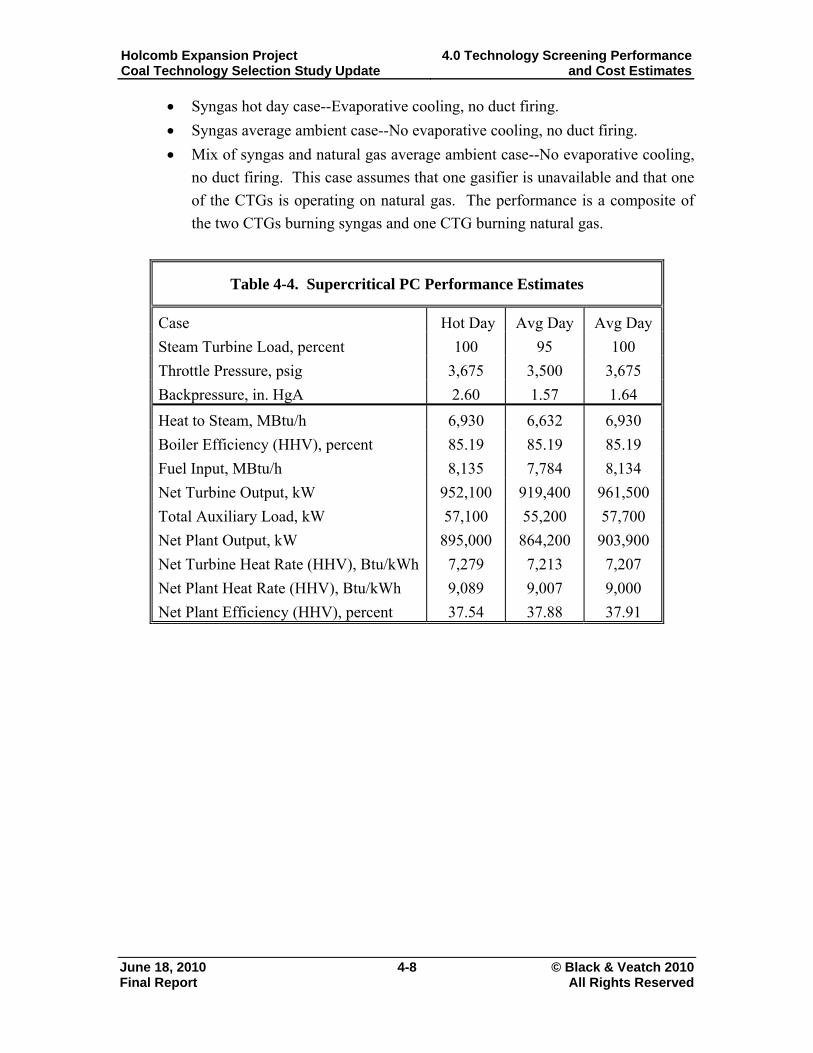
Holcomb Expansion Project Coal Technology Selection Study Update
4.0 Technology Screening Performance and Cost Estimates
June 18, 2010 4-8 © Black & Veatch 2010 Final Report All Rights Reserved
Syngas hot day case--Evaporative cooling, no duct firing.
Syngas average ambient case--No evaporative cooling, no duct firing.
Mix of syngas and natural gas average ambient case--No evaporative cooling,
no duct firing. This case assumes that one gasifier is unavailable and that one
of the CTGs is operating on natural gas. The performance is a composite of
the two CTGs burning syngas and one CTG burning natural gas.
Table 4-4. Supercritical PC Performance Estimates
Case Hot Day Avg Day Avg Day
Steam Turbine Load, percent 100 95 100
Throttle Pressure, psig 3,675 3,500 3,675
Backpressure, in. HgA 2.60 1.57 1.64
Heat to Steam, MBtu/h 6,930 6,632 6,930
Boiler Efficiency (HHV), percent 85.19 85.19 85.19
Fuel Input, MBtu/h 8,135 7,784 8,134
Net Turbine Output, kW 952,100 919,400 961,500
Total Auxiliary Load, kW 57,100 55,200 57,700
Net Plant Output, kW 895,000 864,200 903,900
Net Turbine Heat Rate (HHV), Btu/kWh 7,279 7,213 7,207
Net Plant Heat Rate (HHV), Btu/kWh 9,089 9,007 9,000
Net Plant Efficiency (HHV), percent 37.54 37.88 37.91
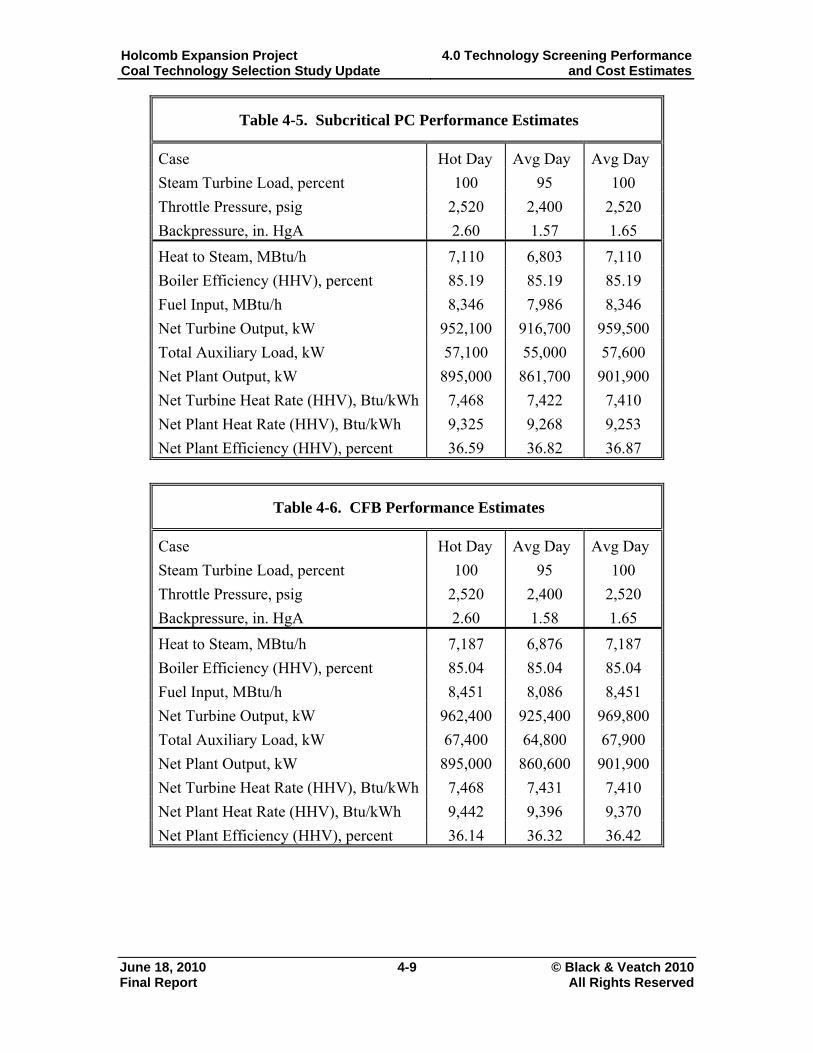
Holcomb Expansion Project Coal Technology Selection Study Update
4.0 Technology Screening Performance and Cost Estimates
June 18, 2010 4-9 © Black & Veatch 2010 Final Report All Rights Reserved
Table 4-5. Subcritical PC Performance Estimates
Case Hot Day Avg Day Avg Day
Steam Turbine Load, percent 100 95 100
Throttle Pressure, psig 2,520 2,400 2,520
Backpressure, in. HgA 2.60 1.57 1.65
Heat to Steam, MBtu/h 7,110 6,803 7,110
Boiler Efficiency (HHV), percent 85.19 85.19 85.19
Fuel Input, MBtu/h 8,346 7,986 8,346
Net Turbine Output, kW 952,100 916,700 959,500
Total Auxiliary Load, kW 57,100 55,000 57,600
Net Plant Output, kW 895,000 861,700 901,900
Net Turbine Heat Rate (HHV), Btu/kWh 7,468 7,422 7,410
Net Plant Heat Rate (HHV), Btu/kWh 9,325 9,268 9,253
Net Plant Efficiency (HHV), percent 36.59 36.82 36.87
Table 4-6. CFB Performance Estimates
Case Hot Day Avg Day Avg Day
Steam Turbine Load, percent 100 95 100
Throttle Pressure, psig 2,520 2,400 2,520
Backpressure, in. HgA 2.60 1.58 1.65
Heat to Steam, MBtu/h 7,187 6,876 7,187
Boiler Efficiency (HHV), percent 85.04 85.04 85.04
Fuel Input, MBtu/h 8,451 8,086 8,451
Net Turbine Output, kW 962,400 925,400 969,800
Total Auxiliary Load, kW 67,400 64,800 67,900
Net Plant Output, kW 895,000 860,600 901,900
Net Turbine Heat Rate (HHV), Btu/kWh 7,468 7,431 7,410
Net Plant Heat Rate (HHV), Btu/kWh 9,442 9,396 9,370
Net Plant Efficiency (HHV), percent 36.14 36.32 36.42
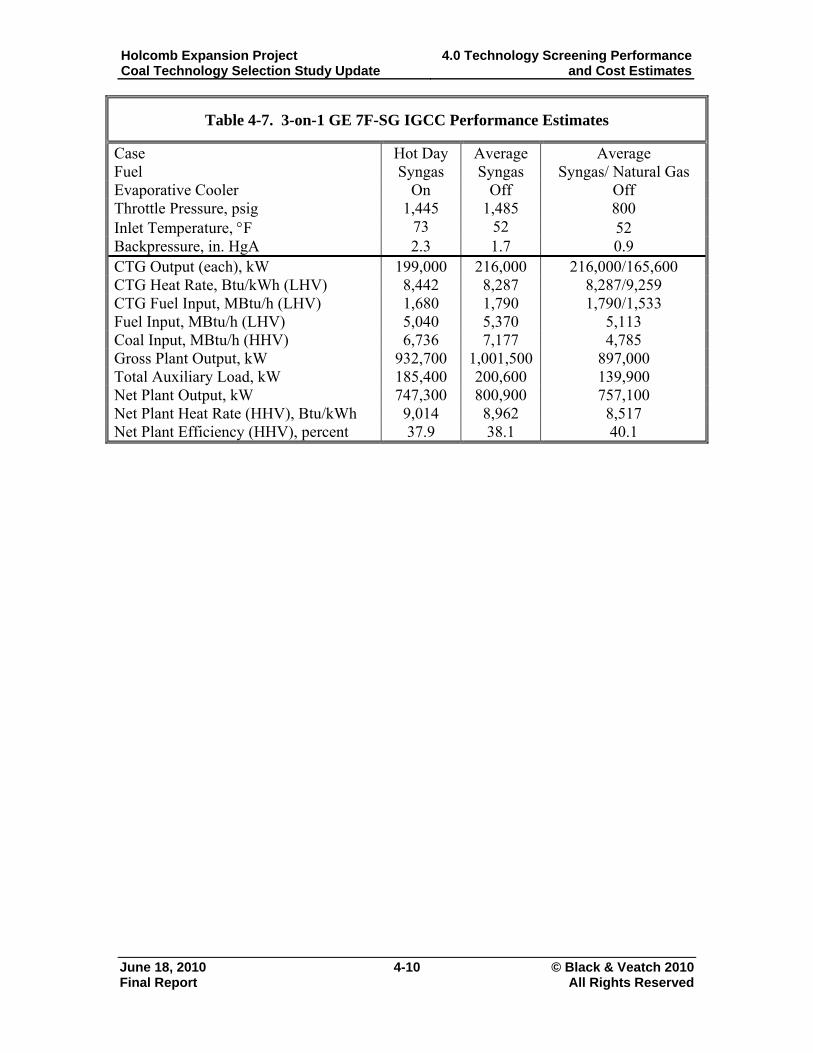
Holcomb Expansion Project Coal Technology Selection Study Update
4.0 Technology Screening Performance and Cost Estimates
June 18, 2010 4-10 © Black & Veatch 2010 Final Report All Rights Reserved
Table 4-7. 3-on-1 GE 7F-SG IGCC Performance Estimates
Case Hot Day Average Average Fuel Syngas Syngas Syngas/ Natural Gas Evaporative Cooler On Off Off Throttle Pressure, psig 1,445 1,485 800 Inlet Temperature, F 73 52 52 Backpressure, in. HgA 2.3 1.7 0.9 CTG Output (each), kW 199,000 216,000 216,000/165,600 CTG Heat Rate, Btu/kWh (LHV) 8,442 8,287 8,287/9,259 CTG Fuel Input, MBtu/h (LHV) 1,680 1,790 1,790/1,533 Fuel Input, MBtu/h (LHV) 5,040 5,370 5,113 Coal Input, MBtu/h (HHV) 6,736 7,177 4,785 Gross Plant Output, kW 932,700 1,001,500 897,000 Total Auxiliary Load, kW 185,400 200,600 139,900 Net Plant Output, kW 747,300 800,900 757,100 Net Plant Heat Rate (HHV), Btu/kWh 9,014 8,962 8,517 Net Plant Efficiency (HHV), percent 37.9 38.1 40.1
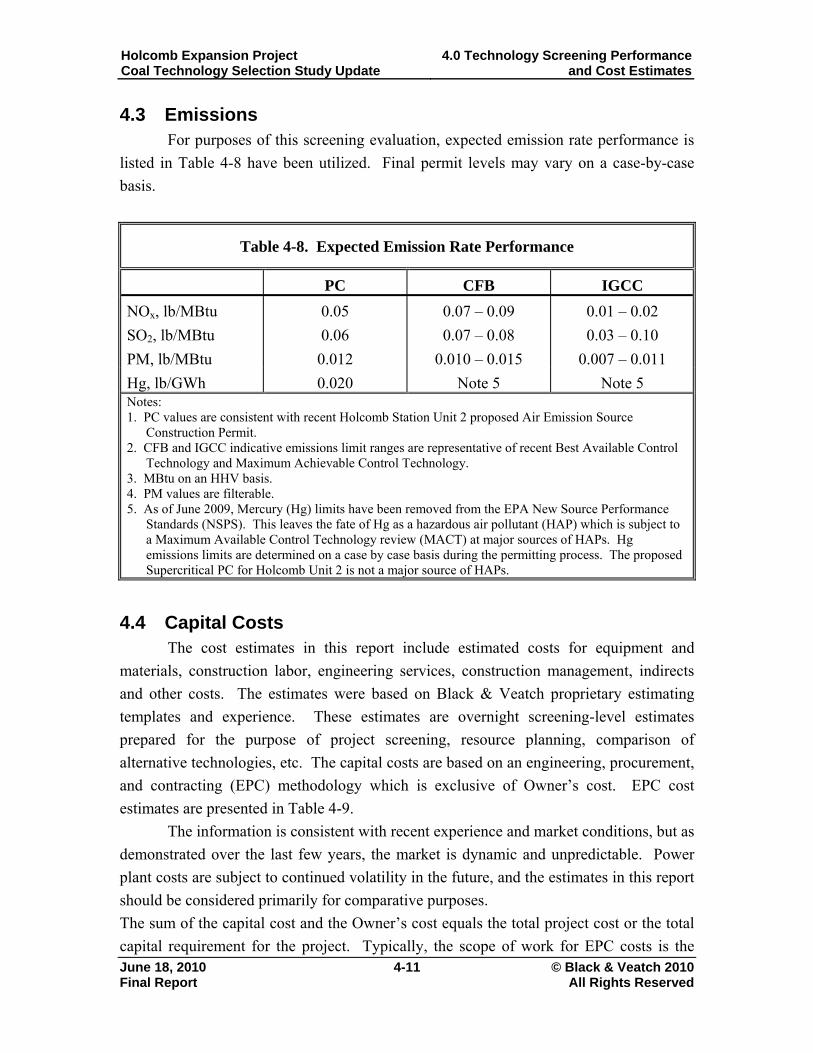
Holcomb Expansion Project Coal Technology Selection Study Update
4.0 Technology Screening Performance and Cost Estimates
June 18, 2010 4-11 © Black & Veatch 2010 Final Report All Rights Reserved
4.3 Emissions For purposes of this screening evaluation, expected emission rate performance is
listed in Table 4-8 have been utilized. Final permit levels may vary on a case-by-case
basis.
Table 4-8. Expected Emission Rate Performance
PC CFB IGCC
NOx, lb/MBtu 0.05 0.07 – 0.09 0.01 – 0.02
SO2, lb/MBtu 0.06 0.07 – 0.08 0.03 – 0.10
PM, lb/MBtu 0.012 0.010 – 0.015 0.007 – 0.011
Hg, lb/GWh 0.020 Note 5 Note 5 Notes: 1. PC values are consistent with recent Holcomb Station Unit 2 proposed Air Emission Source
Construction Permit. 2. CFB and IGCC indicative emissions limit ranges are representative of recent Best Available Control
Technology and Maximum Achievable Control Technology. 3. MBtu on an HHV basis. 4. PM values are filterable. 5. As of June 2009, Mercury (Hg) limits have been removed from the EPA New Source Performance
Standards (NSPS). This leaves the fate of Hg as a hazardous air pollutant (HAP) which is subject to a Maximum Available Control Technology review (MACT) at major sources of HAPs. Hg emissions limits are determined on a case by case basis during the permitting process. The proposed Supercritical PC for Holcomb Unit 2 is not a major source of HAPs.
4.4 Capital Costs The cost estimates in this report include estimated costs for equipment and
materials, construction labor, engineering services, construction management, indirects
and other costs. The estimates were based on Black & Veatch proprietary estimating
templates and experience. These estimates are overnight screening-level estimates
prepared for the purpose of project screening, resource planning, comparison of
alternative technologies, etc. The capital costs are based on an engineering, procurement,
and contracting (EPC) methodology which is exclusive of Owner’s cost. EPC cost
estimates are presented in Table 4-9.
The information is consistent with recent experience and market conditions, but as
demonstrated over the last few years, the market is dynamic and unpredictable. Power
plant costs are subject to continued volatility in the future, and the estimates in this report
should be considered primarily for comparative purposes.
The sum of the capital cost and the Owner’s cost equals the total project cost or the total
capital requirement for the project. Typically, the scope of work for EPC costs is the
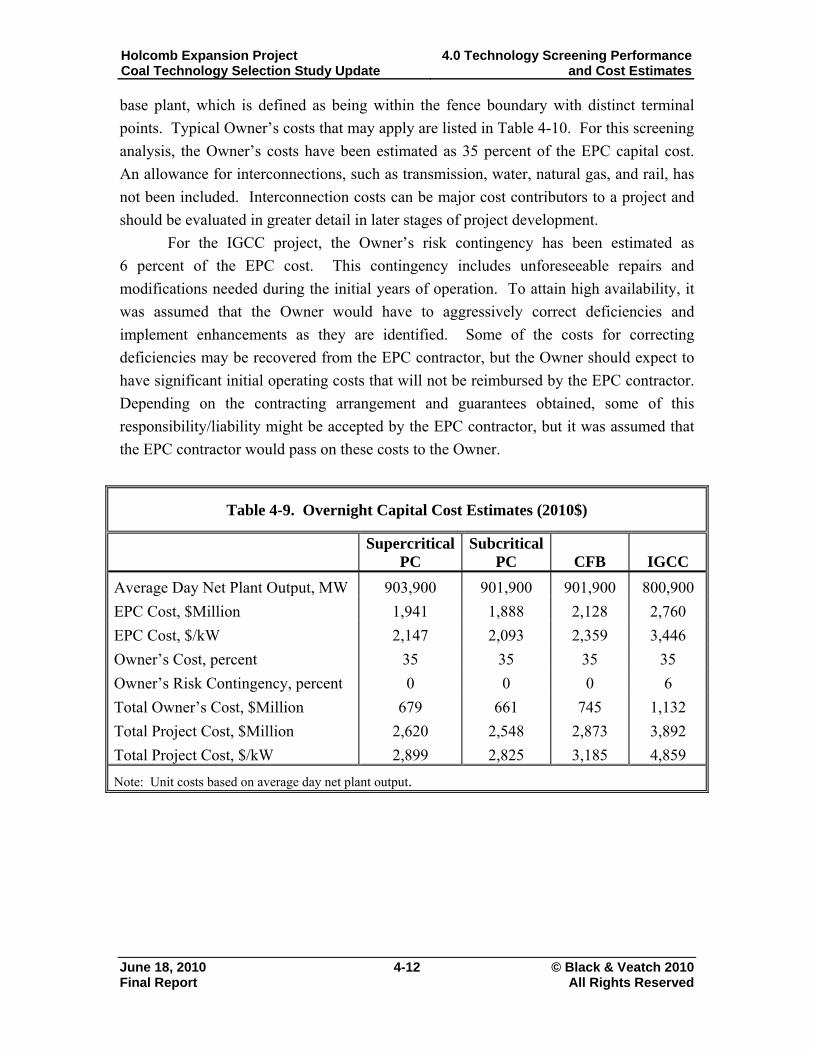
Holcomb Expansion Project Coal Technology Selection Study Update
4.0 Technology Screening Performance and Cost Estimates
June 18, 2010 4-12 © Black & Veatch 2010 Final Report All Rights Reserved
base plant, which is defined as being within the fence boundary with distinct terminal
points. Typical Owner’s costs that may apply are listed in Table 4-10. For this screening
analysis, the Owner’s costs have been estimated as 35 percent of the EPC capital cost.
An allowance for interconnections, such as transmission, water, natural gas, and rail, has
not been included. Interconnection costs can be major cost contributors to a project and
should be evaluated in greater detail in later stages of project development.
For the IGCC project, the Owner’s risk contingency has been estimated as
6 percent of the EPC cost. This contingency includes unforeseeable repairs and
modifications needed during the initial years of operation. To attain high availability, it
was assumed that the Owner would have to aggressively correct deficiencies and
implement enhancements as they are identified. Some of the costs for correcting
deficiencies may be recovered from the EPC contractor, but the Owner should expect to
have significant initial operating costs that will not be reimbursed by the EPC contractor.
Depending on the contracting arrangement and guarantees obtained, some of this
responsibility/liability might be accepted by the EPC contractor, but it was assumed that
the EPC contractor would pass on these costs to the Owner.
Table 4-9. Overnight Capital Cost Estimates (2010$)
Supercritical
PC Subcritical
PC CFB IGCC
Average Day Net Plant Output, MW 903,900 901,900 901,900 800,900
EPC Cost, $Million 1,941 1,888 2,128 2,760
EPC Cost, $/kW 2,147 2,093 2,359 3,446
Owner’s Cost, percent 35 35 35 35
Owner’s Risk Contingency, percent 0 0 0 6
Total Owner’s Cost, $Million 679 661 745 1,132
Total Project Cost, $Million 2,620 2,548 2,873 3,892
Total Project Cost, $/kW 2,899 2,825 3,185 4,859
Note: Unit costs based on average day net plant output.
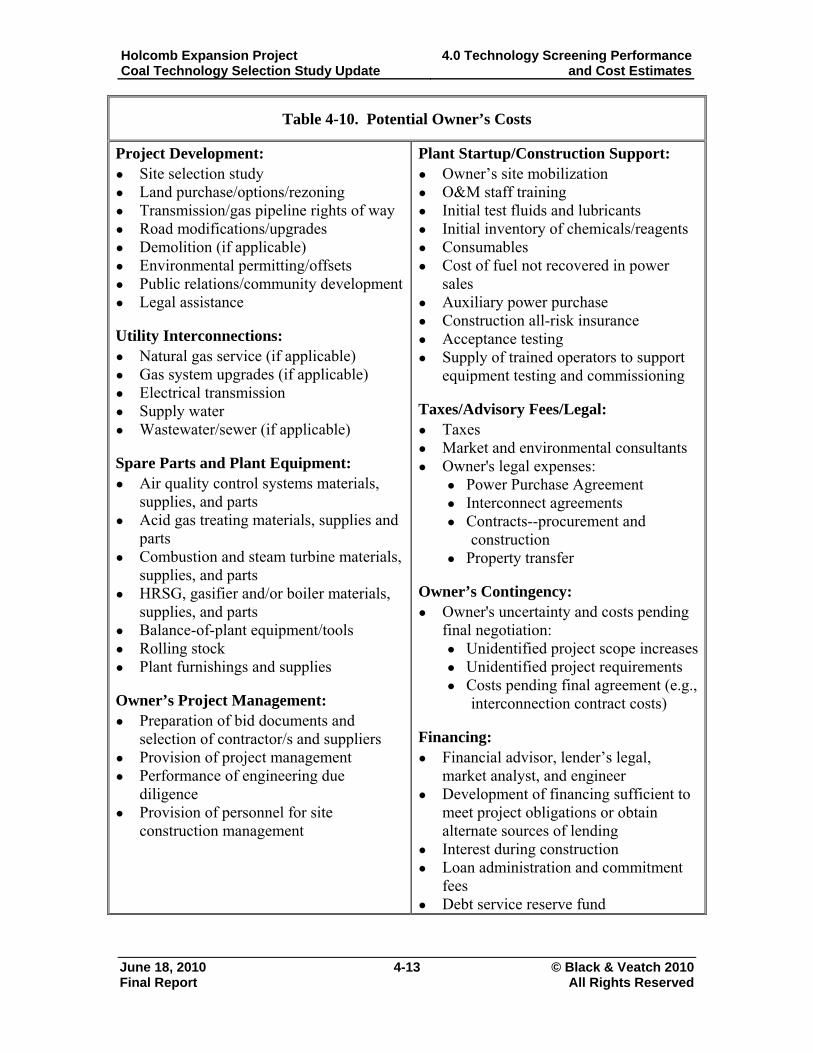
Holcomb Expansion Project Coal Technology Selection Study Update
4.0 Technology Screening Performance and Cost Estimates
June 18, 2010 4-13 © Black & Veatch 2010 Final Report All Rights Reserved
Table 4-10. Potential Owner’s Costs
Project Development: ● Site selection study ● Land purchase/options/rezoning ● Transmission/gas pipeline rights of way ● Road modifications/upgrades ● Demolition (if applicable) ● Environmental permitting/offsets ● Public relations/community development ● Legal assistance
Utility Interconnections: ● Natural gas service (if applicable) ● Gas system upgrades (if applicable) ● Electrical transmission ● Supply water ● Wastewater/sewer (if applicable)
Spare Parts and Plant Equipment: ● Air quality control systems materials,
supplies, and parts ● Acid gas treating materials, supplies and
parts ● Combustion and steam turbine materials,
supplies, and parts ● HRSG, gasifier and/or boiler materials,
supplies, and parts ● Balance-of-plant equipment/tools ● Rolling stock ● Plant furnishings and supplies
Owner’s Project Management: ● Preparation of bid documents and
selection of contractor/s and suppliers ● Provision of project management ● Performance of engineering due
diligence ● Provision of personnel for site
construction management
Plant Startup/Construction Support: ● Owner’s site mobilization ● O&M staff training ● Initial test fluids and lubricants ● Initial inventory of chemicals/reagents ● Consumables ● Cost of fuel not recovered in power
sales ● Auxiliary power purchase ● Construction all-risk insurance ● Acceptance testing ● Supply of trained operators to support
equipment testing and commissioning
Taxes/Advisory Fees/Legal: ● Taxes ● Market and environmental consultants ● Owner's legal expenses:
● Power Purchase Agreement ● Interconnect agreements ● Contracts--procurement and
construction ● Property transfer
Owner’s Contingency: ● Owner's uncertainty and costs pending
final negotiation: ● Unidentified project scope increases● Unidentified project requirements ● Costs pending final agreement (e.g.,
interconnection contract costs)
Financing: ● Financial advisor, lender’s legal,
market analyst, and engineer ● Development of financing sufficient to
meet project obligations or obtain alternate sources of lending
● Interest during construction ● Loan administration and commitment
fees ● Debt service reserve fund
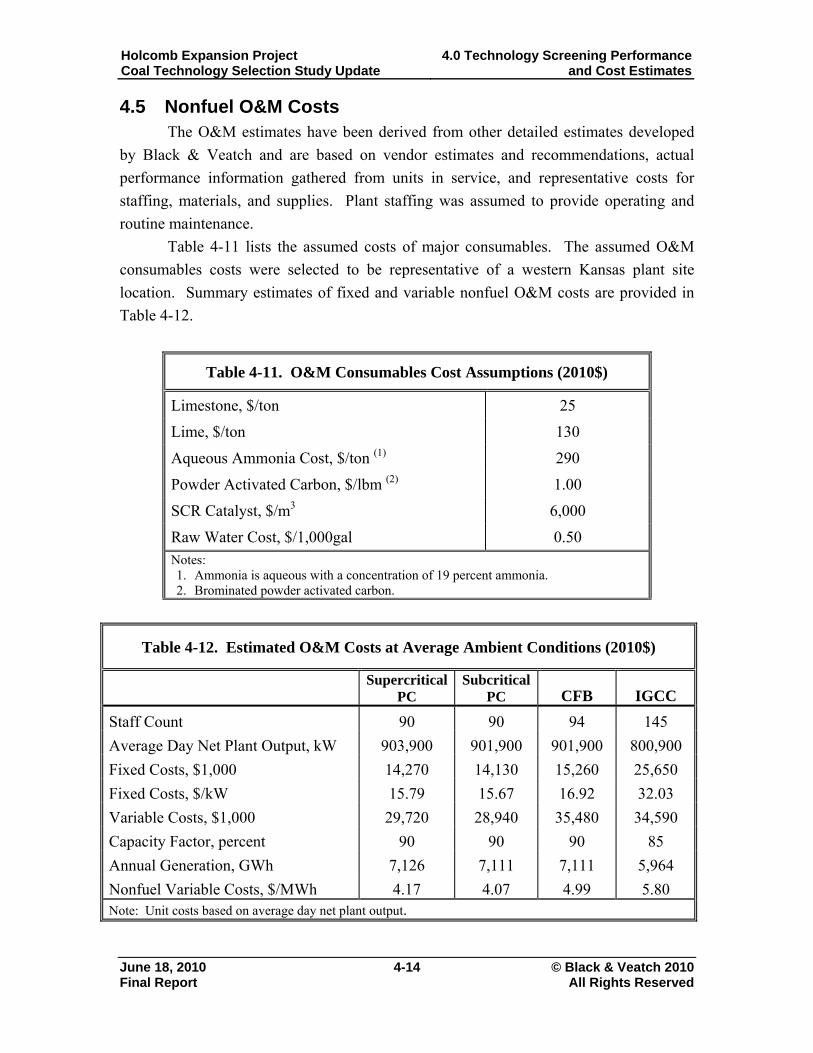
Holcomb Expansion Project Coal Technology Selection Study Update
4.0 Technology Screening Performance and Cost Estimates
June 18, 2010 4-14 © Black & Veatch 2010 Final Report All Rights Reserved
4.5 Nonfuel O&M Costs The O&M estimates have been derived from other detailed estimates developed
by Black & Veatch and are based on vendor estimates and recommendations, actual
performance information gathered from units in service, and representative costs for
staffing, materials, and supplies. Plant staffing was assumed to provide operating and
routine maintenance.
Table 4-11 lists the assumed costs of major consumables. The assumed O&M
consumables costs were selected to be representative of a western Kansas plant site
location. Summary estimates of fixed and variable nonfuel O&M costs are provided in
Table 4-12.
Table 4-11. O&M Consumables Cost Assumptions (2010$)
Limestone, $/ton 25
Lime, $/ton 130
Aqueous Ammonia Cost, $/ton (1) 290
Powder Activated Carbon, $/lbm (2) 1.00
SCR Catalyst, $/m3 6,000
Raw Water Cost, $/1,000gal 0.50 Notes: 1. Ammonia is aqueous with a concentration of 19 percent ammonia. 2. Brominated powder activated carbon.
Table 4-12. Estimated O&M Costs at Average Ambient Conditions (2010$)
Supercritical
PC Subcritical
PC CFB IGCC
Staff Count 90 90 94 145
Average Day Net Plant Output, kW 903,900 901,900 901,900 800,900
Fixed Costs, $1,000 14,270 14,130 15,260 25,650
Fixed Costs, $/kW 15.79 15.67 16.92 32.03
Variable Costs, $1,000 29,720 28,940 35,480 34,590
Capacity Factor, percent 90 90 90 85
Annual Generation, GWh 7,126 7,111 7,111 5,964
Nonfuel Variable Costs, $/MWh 4.17 4.07 4.99 5.80 Note: Unit costs based on average day net plant output.
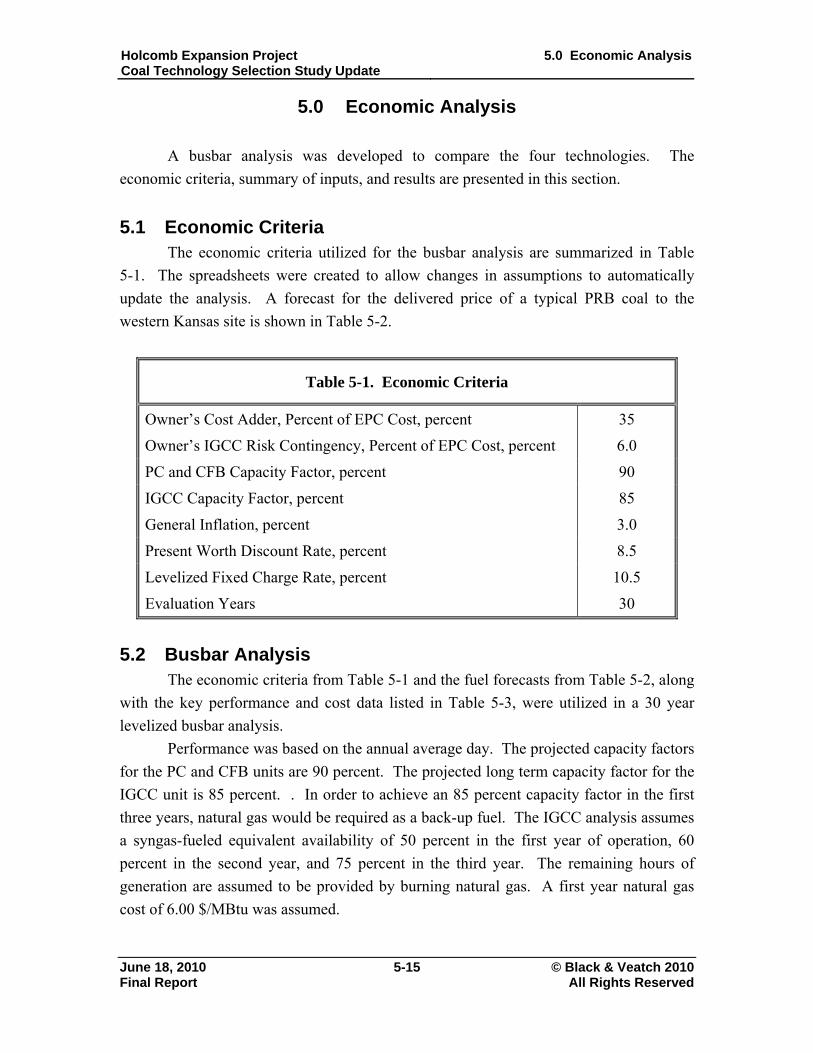
Holcomb Expansion Project Coal Technology Selection Study Update
5.0 Economic Analysis
June 18, 2010 5-15 © Black & Veatch 2010 Final Report All Rights Reserved
5.0 Economic Analysis
A busbar analysis was developed to compare the four technologies. The
economic criteria, summary of inputs, and results are presented in this section.
5.1 Economic Criteria The economic criteria utilized for the busbar analysis are summarized in Table
5-1. The spreadsheets were created to allow changes in assumptions to automatically
update the analysis. A forecast for the delivered price of a typical PRB coal to the
western Kansas site is shown in Table 5-2.
Table 5-1. Economic Criteria
Owner’s Cost Adder, Percent of EPC Cost, percent 35
Owner’s IGCC Risk Contingency, Percent of EPC Cost, percent 6.0
PC and CFB Capacity Factor, percent 90
IGCC Capacity Factor, percent 85
General Inflation, percent 3.0
Present Worth Discount Rate, percent 8.5
Levelized Fixed Charge Rate, percent 10.5
Evaluation Years 30
5.2 Busbar Analysis The economic criteria from Table 5-1 and the fuel forecasts from Table 5-2, along
with the key performance and cost data listed in Table 5-3, were utilized in a 30 year
levelized busbar analysis.
Performance was based on the annual average day. The projected capacity factors
for the PC and CFB units are 90 percent. The projected long term capacity factor for the
IGCC unit is 85 percent. . In order to achieve an 85 percent capacity factor in the first
three years, natural gas would be required as a back-up fuel. The IGCC analysis assumes
a syngas-fueled equivalent availability of 50 percent in the first year of operation, 60
percent in the second year, and 75 percent in the third year. The remaining hours of
generation are assumed to be provided by burning natural gas. A first year natural gas
cost of 6.00 $/MBtu was assumed.
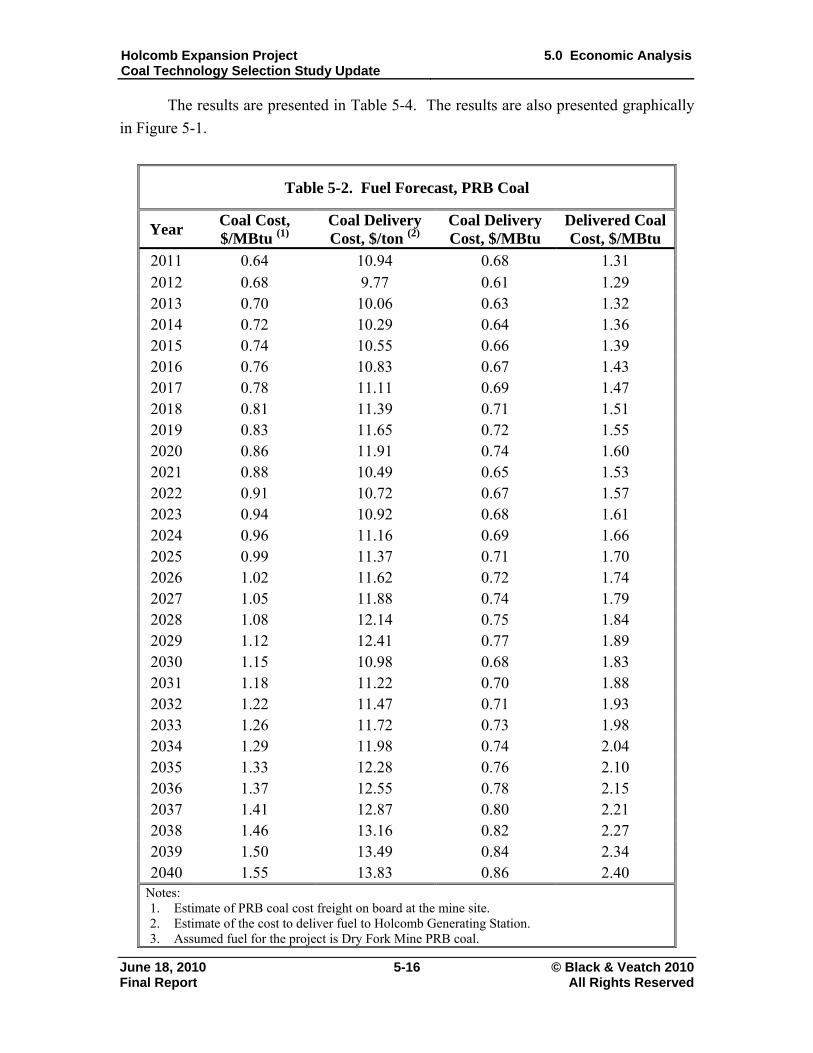
Holcomb Expansion Project Coal Technology Selection Study Update
5.0 Economic Analysis
June 18, 2010 5-16 © Black & Veatch 2010 Final Report All Rights Reserved
The results are presented in Table 5-4. The results are also presented graphically
in Figure 5-1.
Table 5-2. Fuel Forecast, PRB Coal
Year Coal Cost, $/MBtu (1)
Coal Delivery Cost, $/ton (2)
Coal Delivery Cost, $/MBtu
Delivered Coal Cost, $/MBtu
2011 0.64 10.94 0.68 1.31 2012 0.68 9.77 0.61 1.29 2013 0.70 10.06 0.63 1.32 2014 0.72 10.29 0.64 1.36 2015 0.74 10.55 0.66 1.39 2016 0.76 10.83 0.67 1.43 2017 0.78 11.11 0.69 1.47 2018 0.81 11.39 0.71 1.51 2019 0.83 11.65 0.72 1.55 2020 0.86 11.91 0.74 1.60 2021 0.88 10.49 0.65 1.53 2022 0.91 10.72 0.67 1.57 2023 0.94 10.92 0.68 1.61 2024 0.96 11.16 0.69 1.66 2025 0.99 11.37 0.71 1.70 2026 1.02 11.62 0.72 1.74 2027 1.05 11.88 0.74 1.79 2028 1.08 12.14 0.75 1.84 2029 1.12 12.41 0.77 1.89 2030 1.15 10.98 0.68 1.83 2031 1.18 11.22 0.70 1.88 2032 1.22 11.47 0.71 1.93 2033 1.26 11.72 0.73 1.98 2034 1.29 11.98 0.74 2.04 2035 1.33 12.28 0.76 2.10 2036 1.37 12.55 0.78 2.15 2037 1.41 12.87 0.80 2.21 2038 1.46 13.16 0.82 2.27 2039 1.50 13.49 0.84 2.34 2040 1.55 13.83 0.86 2.40
Notes: 1. Estimate of PRB coal cost freight on board at the mine site. 2. Estimate of the cost to deliver fuel to Holcomb Generating Station. 3. Assumed fuel for the project is Dry Fork Mine PRB coal.
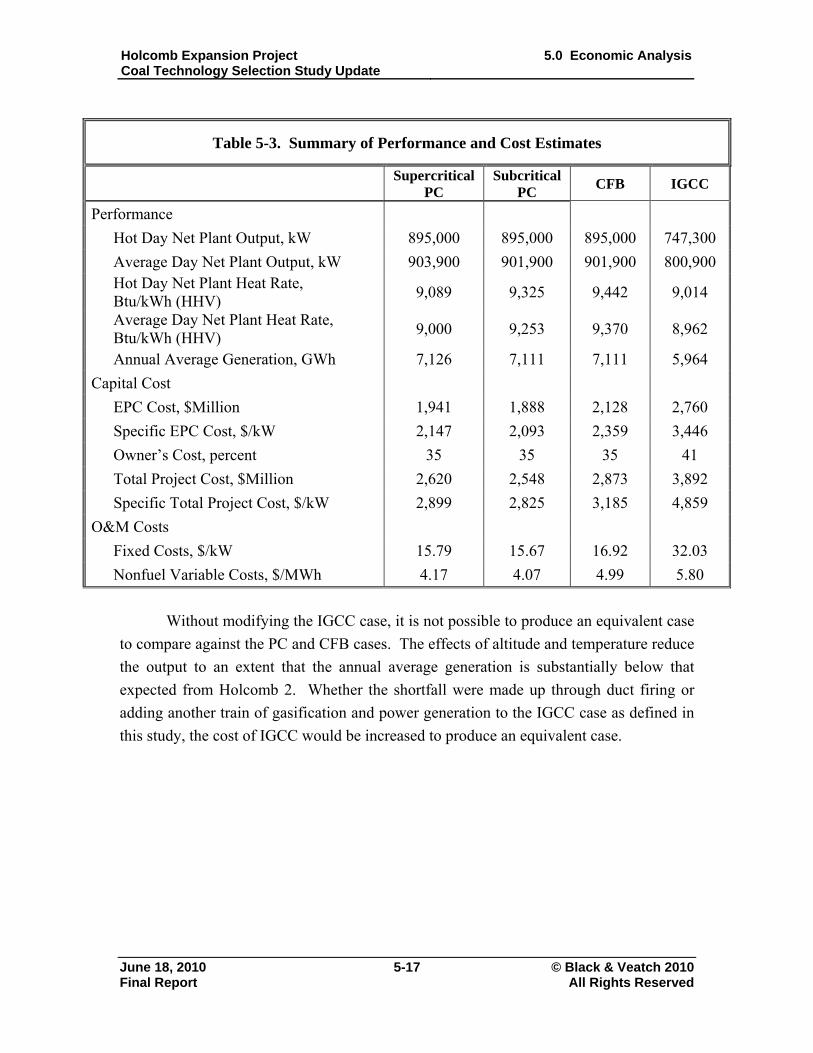
Holcomb Expansion Project Coal Technology Selection Study Update
5.0 Economic Analysis
June 18, 2010 5-17 © Black & Veatch 2010 Final Report All Rights Reserved
Table 5-3. Summary of Performance and Cost Estimates
Supercritical PC
Subcritical PC
CFB IGCC
Performance
Hot Day Net Plant Output, kW 895,000 895,000 895,000 747,300
Average Day Net Plant Output, kW 903,900 901,900 901,900 800,900 Hot Day Net Plant Heat Rate, Btu/kWh (HHV)
9,089 9,325 9,442 9,014
Average Day Net Plant Heat Rate, Btu/kWh (HHV)
9,000 9,253 9,370 8,962
Annual Average Generation, GWh 7,126 7,111 7,111 5,964
Capital Cost
EPC Cost, $Million 1,941 1,888 2,128 2,760
Specific EPC Cost, $/kW 2,147 2,093 2,359 3,446
Owner’s Cost, percent 35 35 35 41
Total Project Cost, $Million 2,620 2,548 2,873 3,892
Specific Total Project Cost, $/kW 2,899 2,825 3,185 4,859
O&M Costs
Fixed Costs, $/kW 15.79 15.67 16.92 32.03
Nonfuel Variable Costs, $/MWh 4.17 4.07 4.99 5.80
Without modifying the IGCC case, it is not possible to produce an equivalent case
to compare against the PC and CFB cases. The effects of altitude and temperature reduce
the output to an extent that the annual average generation is substantially below that
expected from Holcomb 2. Whether the shortfall were made up through duct firing or
adding another train of gasification and power generation to the IGCC case as defined in
this study, the cost of IGCC would be increased to produce an equivalent case.
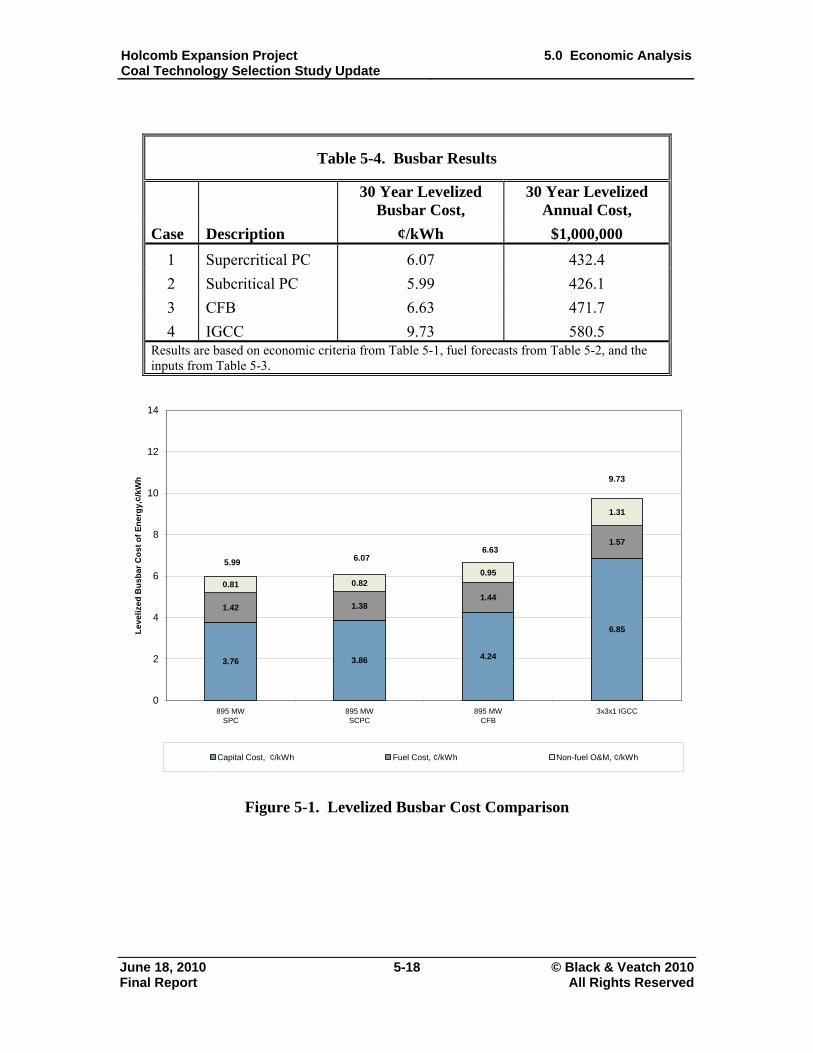
Holcomb Expansion Project Coal Technology Selection Study Update
5.0 Economic Analysis
June 18, 2010 5-18 © Black & Veatch 2010 Final Report All Rights Reserved
Table 5-4. Busbar Results
30 Year Levelized
Busbar Cost, 30 Year Levelized
Annual Cost,
Case Description ¢/kWh $1,000,000
1 Supercritical PC 6.07 432.4
2 Subcritical PC 5.99 426.1
3 CFB 6.63 471.7
4 IGCC 9.73 580.5 Results are based on economic criteria from Table 5-1, fuel forecasts from Table 5-2, and the inputs from Table 5-3.
3.76 3.86 4.24
6.85
1.381.44
1.57
0.81 0.820.95
1.31
1.42
0
2
4
6
8
10
12
14
895 MWSPC
895 MWSCPC
895 MWCFB
3x3x1 IGCC
Lev
eliz
ed B
usb
ar C
ost
of
En
erg
y,¢/
kWh
Capital Cost, ¢/kWh Fuel Cost, ¢/kWh Non-fuel O&M, ¢/kWh
5.99 6.076.63
9.73
Figure 5-1. Levelized Busbar Cost Comparison
Holcomb Expansion Project Coal Technology Selection Study Update
6.0 Recommendations and Conclusions
June 18, 2010 6-1 © Black & Veatch 2010 Final Report All Rights Reserved
6.0 Conclusions
The economic analysis, as provided in Table 1-3, indicates the lowest cost
technologies are the conventional PC and CFB units. The IGCC levelized busbar cost is
roughly 50 percent higher than those of the PC and CFB. The costs of emission
allowances were not included in the busbar cost analysis.
IGCC is not economically competitive with PC. The limited commercial and
operational experience of IGCC would make it a substantial operational and commercial
risk as a generating technology for the Expansion Project. IGCC, therefore, is not a
practical alternative for the Expansion Project.
The other two technologies evaluated, PC (either super or subcritical) and CFB,
are commercially available for consideration for a new 895 MW coal-fired generating
facility at Holcomb. The emissions of regulated pollutants from these two technologies
are very similar. The most fuel efficient technology is supercritical PC, whose heat rate
is approximately three percent better than the subcritical and CFB technologies. CFB is
expected to be slightly more expensive, as measured by the levelized busbar cost of
power, than PC.
Within the accuracy of the evaluation, the subcritical and supercritical PCs are
assumed to be equivalent. Supercritical PC is more efficient than the subcritical PC,
which reduces the coal consumption by roughly 2.5 percent which directly reduces the
total mass of the flue gas emissions by comparison.