Embed Size (px)
Citation preview

“Technologies for Generation, Transmission and Distribution -
Status & Performance Indicators”
Prof S.N. SinghDepartment of Electrical Engineering,Indian Institute of Technology, Kanpur
(Email: [email protected])
Department of Industrial and Management Engineering
Indian Institute of Technology Kanpur
4th Capacity Building Programme for Officers of Electricity Regulatory Commissions
18 – 23 July, 2011
Forum of Regulators
Evolution of Power SystemsLate 1870s Commercial use of electricity
1882 First Electric power system ( Gen., cable, fuse, load) by Thomas Edison at Pearl Street Station in NY.- DC system, 59 customers, 1.5 km in radius- 110 V load, underground cable, incandescent Lamps
18841886
1889
Motors were developed by Frank SpragueLimitation of DC become apparent
- High losses and voltage drop. - Transformation of voltage required.
Transformers and AC distribution (150 lamps) developed by William Stanley of Westinghouse First ac transmission system in USA between Willamette Falls and Portland, Oregon.- 1- phase, 4000 V, over 21 km

Evolution of Power Systems (Contd.)1888 N. Tesla developed poly-phase systems and
had patents of gen., motors, transformers, trans. Lines.Westinghouse bought it.
1890s Controversy on whether industry should standardize AC or DC. Edison advocated DC and Westinghouse AC.- Voltage increase, simpler & cheaper gen. and motors
1893 First 3-phase line, 2300 V, 12 km in California.ac was chosen at Niagara Falls ( 30 km)
1922192319351953196519661969
1990s
Early Voltage (Highest)165 kV220 kV287 kV330 kV500 kV735 kV765 kV1100 kVStandards are 115, 138, 161, 230 kV – HV
345, 400, 500 kV - EHV765, 1100 kV - UHV
Earlier Frequencies were 25, 50, 60, 125 and 133 Hz; USA - 60 Hz and some has 50 Hz, Which Frequency is better?
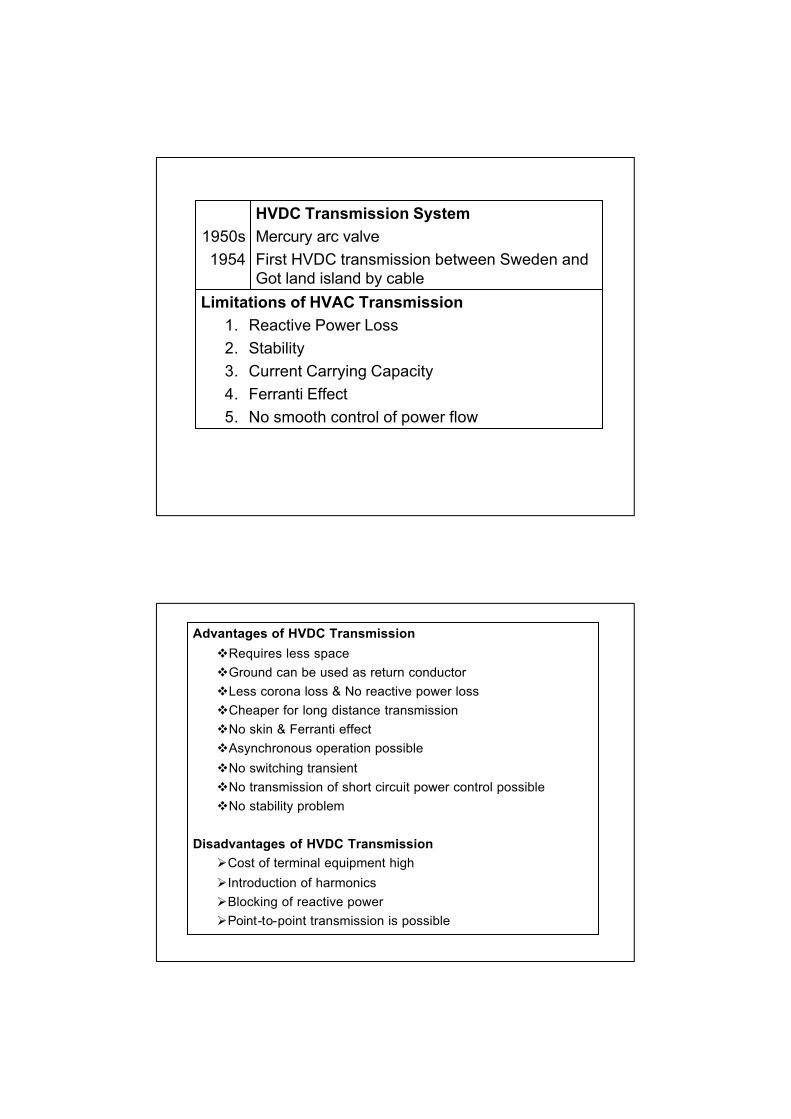
1950s1954
HVDC Transmission SystemMercury arc valveFirst HVDC transmission between Sweden and Got land island by cable
Limitations of HVAC Transmission1. Reactive Power Loss 2. Stability3. Current Carrying Capacity4. Ferranti Effect5. No smooth control of power flow
Advantages of HVDC Transmission�Requires less space�Ground can be used as return conductor�Less corona loss & No reactive power loss�Cheaper for long distance transmission�No skin & Ferranti effect�Asynchronous operation possible�No switching transient�No transmission of short circuit power control possible�No stability problem
Disadvantages of HVDC Transmission�Cost of terminal equipment high�Introduction of harmonics�Blocking of reactive power�Point-to-point transmission is possible

Key Drivers to Technological Changes in Power Sector
• Development of New Materials - Polymeric,Composite, Nano, Superconducting materials.
• Supply-demand gap and Environmental Concerns in Generation Sector
• Development of New Devices and Technologies- Power Electronic Devices, DSP, Sensors, Information & Communication Technology
• Maintaining Stable & Secure Operation of Large Interconnected Transmission System
• Increased losses and Poor Quality of Supply and Revenue Collection in Distribution Sector
• Regulatory Changes in the Electricity Sector
New Transmission Technologies
• High Voltage Overhead Transmission– Voltage up to 1200 kV ac, ± 800 kV DC– High EM radiation and noise– High corona loss– More ROW clearance
• Gas Insulated Cables/Transmission lines• HVDC-Light• Flexible AC Transmission Systems (FACTS)

Gas insulated Transmission Lines– For the transmission of high power over long distances GITLs
are a good technical solution as an alternative to O/H lines andin addition to cables.
– If the diameter of outer shield is more compared to core, it is called gas insulated transmission lines. Normally tunnels are used in GITL.
– GITLs are used since more than 35 years for linking power plants to transmission network. First was commissioned in 1975 in Germany of about 700m.
– First mixed GITL in the world successfully completed its field trials with an endurance test in 1999.
– In Japan, 275 kV , 3.3 km double circuit GITLs which can transport power of 300 MVA.
– The cost of GITL is 8-10 times those on overhead power lines which was earlier 30 times. The basis for reduction of cost is:
Gas insulated Transmission Lines• Adaptation of installation techniques are similar to
those used in laying pipelines.• Simplification and standardization of individual
components.• Use of SF6 (20%) and N2 (80%)gases mixture.
• Basic Design– Enclosing tube is made of aluminum alloy and designed to
be a pressure vessel as well as carrying mechanical load of conductors.
– Enclosing tube is also used for carrying the inductive return current which is same as rated current.
– The inner conductor is an aluminum tube held in place by bushings spaced at 100 m.
– Sliding-contact plugs and sockets accommodate the thermal expansion of the conductor.
– GITLs are installed in segments.

Gas insulated Transmission Lines• Benefits of GITL
– Low resistive losses (reduced by factor 4)– Low capacitive losses and less charging current– No external electromagnetic fields– No correction of phase angle is necessary even
for long distance transmission– No cooling needed– No danger of fire– Short repair time– No aging– Lower total life cycle costs.

HVDC-Light• Classical HVDC technology
– Mostly used for long distance point-to-pointtransmission
– Requires fast communication channels between two stations
– Large reactive power support at both stations– Thyristor valves are used.– Line or phase commutated converters are used.
• HVDC-Light– Power transmission through HVDC utilizing voltage
source converters with insulated gate bipolar transistors (IGBT) which extinguishes the current more faster and with less energy loss than GTOs.
HVDC-Light– It is economical even in low power range.– Real and reactive power is controlled independently
in two HVDC light converters.– Controls AC voltage rapidly.– There is possibility to connect passive loads.– No contribution to short circuit current.– No need to have fast communication between two
converter stations.– Operates in all four quadrants.– PWM scheme is used.– Opportunity to transmit any amount of current of
power over long distance via cables.

HVDC-Light
– Low complexity-thanks to fewer components– Small and compact– Useful in windmills– Offers asynchronous operation.
• First HVDC-Light pilot transmission for 3 MW, ±10kVin March, 1997 (Sweden)
• First commercial project 50 MW, 70 kV, 72 km, in 1999.
• Transmission system limitations:– System Stability
• Transient stability• Voltage stability• Dynamic Stability• Steady state stability• Frequency collapse• Sub-synchronous resonance
– Loop flows– Voltage limits– Thermal limits of lines– High short-circuit limits
FLEXIBLE AC TRANSMISSION SYSTEM (FACTS)

• Developments in Generation side– Powerformer Energy System– Distributed Generations
• Wind Power (upto 6 MW)• Fuel Cells• Biomass etc.
– Combined Cycle Power Plants
Powerformer Energy System

PowerformerTM Benefits• Higher performance (availability, overload)• Environmental improvement• Lower weight• Less total space requirement• Lower cost for Civil Works• Less maintenance• Reduced losses• Lower investment• Lower LCC
E (k
V/m
m)
3kV/mm
6-9kV/mm
E-field
non-uniformE-field
uniform
Bar Cable
Electrical Field Distribution

Stator winding
Conductor (1), Inner semi-conducting layer (2), Insulation (3) and an outer semi-conducting layer (4).
�DG includes the application of small generations in the range of 15 to 10,000 kW, scatteredthroughout a power system
�DG includes all use of small electric powergenerators whether located on the utility system atthe site of a utility customer, or at an isolated site not connected to the power grid.
�By contrast, dispersed generation (capacityranges from 10 to 250 kW), a subset of distributed generation, refers to generation that is located at customer facilities or off the utility system.
Distributed Generation/Dispersed Generation

�DG includes traditional -- diesel, combustionturbine, combined cycle turbine, low-head hydro,or other rotating machinery and renewable -- wind,solar, or low-head hydro generation.
�The plant efficiency of most existing large central generation units is in the range of 28 to 35%.
�By contrast, efficiencies of 40 to 55% are attributed to small fuel cells and to various hi-tech gas turbineand combined cycle units suitable for DGapplication.
�Part of this comparison is unfair. Modern DG utilize prefect hi-tech materials and incorporating advanced designs that minimize wear and required maintenance and include extensive computerized control thatreduces operating labor.DG “Wins” Not Because It is Efficient, But Because It Avoids T&D Costs
Operational Changes

• Power System Restructuring (Privatization or Deregulation)– But not only Privatization
• Deregulation is also known as
– Competitive power market– Re-regulated market– Open Power Market– Vertically unbundled power system– Open access
Transmission Business
DistributionBusiness
Generation Business
Verticalseparation
Horizontal separation or Vertical cut
Horizontal separation or Vertical cut

• Why Restructuring of Electric Supply Industries?– Better experience of other restructured market
such as communication, banking, oil and gas, airlines, etc.
– Competition among energy suppliers and wide choice for electric customers.
• Why was the electric utility industry regulated?– Regulation originally reduced risk, as it was
perceived by both business and government.– Several important benefits:
• It legitimized the electric utility business.
• It gave utilities recognition and limited support from the local Govt. in approving ROW and easements.
• It assured a return on the investment, regulated as that might be.
• It established a local monopoly in building the system and quality of supply without competitors.
• Simplified buying process for consumers.• Electricity of new and confusing to deal with the
conflicting claims, standards and offerings of different power companies.
• Least cost operation.• Meeting social obligations• Hugh investments with high risk

• Forces behind the Restructuring are– High tariffs and over staffing– Global economic crisis– Regulatory failure– Political and ideological changes– Managerial inefficiency– Lack of public resources for the future
development– Technological advancement– Rise of environmentalism– Pressure of Financial institutions– Rise in public awareness
– Some more …….
• Reasons why deregulation is appealing

• What will be the transformation ?
– Vertically integrated => vertically unbundled– Regulated cost-based ==> Unregulated price-
based– Monopoly ==> Competition– service ==> commodity– consumer ==> customer– privilege ==> choice– Engineers � Lawyer/Manager
• A number of questions to be answered– Is a Restructuring good for our society?– What are the key issues in moving towards the
restructuring ?– What are the implications for current industry
participants?– What type of new participants will be seen and
why ?– What should be structure of market and
operation?– What might an electricity transaction of future
look like?

• Electricity Market is very risky– Electricity is not storable in bulk quantity– End user demand is typically constant– Trading is directly related to the reliability of the grid– Demand and supply should be exact– Electricity prices are directly related with other
volatile market participants.– Cost of continuity is more than cost of electric.
� Electricity must be � Economical� Secure� Stable� Reliable� Good quality
� Power Quality is defined as "any power problem manifested in voltage, current, and/or frequency deviations that results in the failure and/or mal- operation of end user‛s equipment.
Electric Power

Quality of Supply?Refers to: Supply reliability + Voltage Quality• Supply Reliability : relates to the availability of
power at given point of system (continuity).• Voltage Quality: relates to the purity of the
characteristics of the voltage waveform including the absolute voltage level and frequency.QoS= “Uninterrupted supply of power with
sinusoidal voltage and current waveform at acceptable frequency and voltage magnitude.”
Quality of Service = Quality of Supply + Customer relations
Voltage or Power Quality
• Due to Disturbances e.g. transients (switching/lightning), faults etc. (resulting in voltage sag,swell, oscillatory and impulsive waveform,interruption)
• Due to Steady State Variations e.g. nonlinearcharacteristics of loads, furnace/inductionheating loads, switching of converters etc.(resulting in harmonics, notching and noise).

�Possible effects of poor power quality are:�Maloperation (of control devices, mains signaling
systems and protective relays)
�More loss (in electrical system)
�Fast aging of equipments.
�Loss of production
� Radio, TV and telephone interference
�Failure of equipments
Effects of Poor Power Quality
PQ Disturbances and their causes
PQ Disturbances� Transients� Short Duration Voltage Variations� Long Duration Voltage Variations� Interruptions� Waveform Distortion� Voltage Fluctuation (flicker)� Frequency Variation� Harmonics
Main causes of poor PQ�Nonlinear loads�Adjustable-speed drives�Traction drives� Start of large motor loads� Arc furnaces �Intermittent loads transients� Lightning�Switching, transients �Faults

Some typical PQ disturbances
Voltage Sag
Lightning Strike
Capacitor Switching
High Impedance Fault (RMS)
Harmonics
Voltage sagsMajor causes: faults, starting of large loads, and
Major consequences: shorts,accelerated aging, loss of data or stability, process interrupt, etc.
Capacitor switching transients
Major causes: a power factor correction method
Major consequences:insulation breakdown or sparkover, semiconductor device damage, shorts, accelerated aging, loss of data or stability
HarmonicsMajor causes: powerelectronic equipment, arcing, transformer saturation
Major consequences:equipment overheating, highvoltage/current, protective device operations
Lightning transientsMajor causes: lightning strikes
Major consequences: insulationbreakdown or sparkover,semiconductor device damage, shorts, accelerated aging, loss of data or stability
High impedance faults
(One of the most difficult power system protection problems)
Major causes: fallen conductors, trees (fail to establish a permanent return path)
Major consequences: fire, threats to personal safety
������� ��������� � �������
��������� �� ������ � � ���� �� � ��� ������� ��� ����� ������ �� ������� ��������� ����� ��
���� �� ����� ���� ��������� ������ �� �����
��� ���� ��������� ��� ��������� �� ������ � ������ � ������� � ��� ���������
��� ���� �� � ��������� ���� � ���
��� ����� ������ �� � ���������

� ������� ��� � ������ ������� ��
��� �� ������ ������ � ��������� ����� � ��!
"#� ����$ �������� � ���%
������ ������ ������ � ��������� ���&�� �� � ��!"� ��������� �$ ��������� ���%
����� ������ ������� ��������� � ��! "' �� ��%
Customersofno.Totalonsinterruptiofno.annualTotal
Customersofno.Total
onsinterruptiCustomersallofDuartion∑
8760Customersofno.Total
onsinterruptiCustomersallofDuartion)8760CustomersNo.of(
×
−× ∑
����� ������ ������� ( �������� � ��! )*+�����,-�� ������ , ���� -�� ��������"
� ������� ������ �� � ������� ��������
.�� �� .������� ������ � ��������� ����� � ��!-���� "#� ����$ ���%
.����� .������� ������ � ��������� ���&�� �� � ��!-����
CustomersofNumberSuppliedNotEnergy
=
onsInterruptiofno.Total
onsinterruptiCustomersallofDuartion∑=
affectedCustomersofNo.onsinterruptiofno.annualTotal
=
.��� �� .������� ���� ������ � ��������� ����� � ��! "#� ����$ ���%
#�.��� #!���� � ������� .������� � ��������� ���&�� �� "������� ��� $���%
#�.� � #!���� � ������� .������� � ��������� ����� "������� ��� $���%
#���� � #��� ��� ������ � ��������� ���&�� �� � ��!
affectedCustomersofno.Total
onsinterruptiCustomersallofDuartion∑=
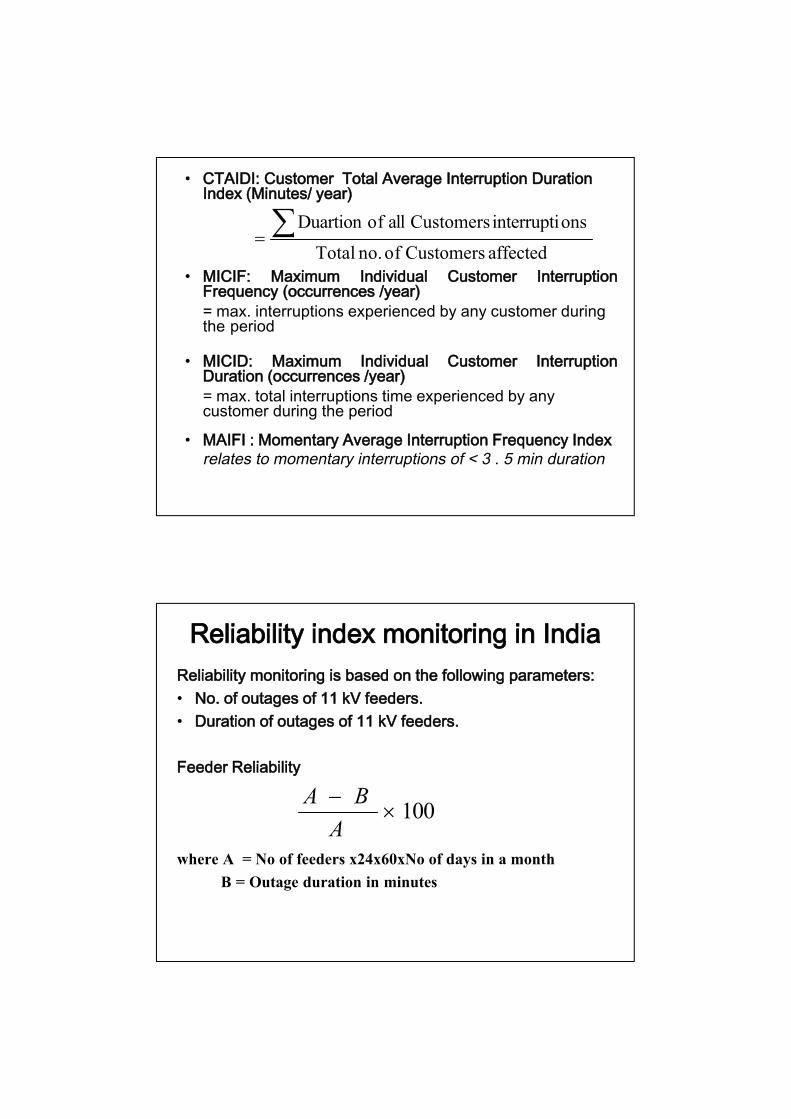
��������� � ��! �� ����� � � � ��
��������� �� ����� � �� ��� � ��� ������� � ���������
-�� �� ������ �� ** /0 ��������
����� �� ������ �� ** /0 ��������
������ ���������
where A = No of feeders x24x60xNo of days in a monthB = Outage duration in minutes
100×−A
BA

� Need for infusion of Intelligence in the Grid for :
� Knowing the state of the Grid
� Predict the catastrophic situation in advance
� Take corrective actions accordingly so as to protect the grid� Features of Intelligent Grid
� adoptive islanding,
� self-healing
� demand/generation management etc. � To Accomplish, need for Wide Area Monitoring System (WAMS).
� To gather and processing the data from any number of GPS-synchronized phasor measurement units (PMUs) along with a system monitoring centre and take corrective action through advance software and control system
Future Technologies - Intelligent Grid
Intelligent Grid - WAMS
Leader not a follower

Intelligent Grid to Smart Grid
Present Power System
-Heavily relying on fossil fuels-Generation follows load-Limited ICT use
Future Power System-More use of RES, clean coal, nuclear power-Load follows generation-More ICT & Smart meter use
Today’sElectricity …
Power park
HydrogenStorage
Industrial DG
Tomorrow’sChoices …
Combined Heat and Power
Fuel Celle -
e -
WindFarms
RooftopPhotovoltaics
RemoteLoads
Load as a resource
SMES
SmartSubstation
Fuel Cell

Future Grid – Smart(er)Grid
Extensive small, distributedgeneration close to end user
Harmonized legal framework allowing cross border power trading
Coordinated, full energy managementand full integration of DG with large central power generation
Wide area monitoring and control systems
Secure, reliable and green power supply
Customer driven value added services
What a Smart Grid would look like?Distributed, Networked
Controllable hydro plant
Source: Wikipedia

What a Smart Grid would look like?Green, Environment friendly
Source: European Technology Platform SmartGrids
What a Smart Grid would look like?Two-way integrated communication, adaptive, responsive, wider control

What a Smart Grid would look like?
Source: http://vtsenvirogroup.wordpress.com/2009/05/19/you-think-youre-so-smart-grid/
Sensors throughout, self healing & monitoring, remote check & test
Features of a Smart GridRef: DOE document at http://www.oe.energy.gov/smartgrid
Self-Healing to correct problems early
Interactive with consumers and markets
Optimized to make best use of resources
Predictive to prevent emergencies
Distributed assets and information
Integrated to merge all critical information
More Secure from threats from all hazards

Existing Grid Intelligent GridCentralized Generation Distributed GenerationOne-Way Communication Two-Way Communication
Electromechanical DigitalHierarchical NetworkedFew Sensors Sensors ThroughoutBlind Self-MonitoringManual Restoration Self-HealingFailures and Blackouts Adaptive and IslandingManual Check/Test Remote Check/TestLimited Control Pervasive/Wider Control
Ref: Hassan Farhangi, “The Path of the Smart Grid”, IEEE Power and Energy Magazine,Jan. 2010, pp.18-28
Merging Two Technologies
ElectricalElectricalInfrastructureInfrastructure
InformationInformationInfrastructureInfrastructure
The integration of two infrastructuresThe integration of two infrastructures…… securelysecurely……
Source: EPRI® Intelligrid at http://intelligrid.epri.com

SmartGrid
Operational Efficiency
Environmental ImpactCustomer Satisfaction
Energy EfficiencyReduced Onsite Premise Presence / Field Work Required
Shorter Outage Durations
Optimized Transformer Operation
Standards & Construction
Improved Network Operations
Reduce Integration & IT maintenance cost
Condition-based Asset Maintenance /Inspections
Reduced Energy Losses
Active/Passive Demand-side Management
Enable Customer Self-Service / ReduceCall Center Inquiries
Improved Revenue Collection
Reduced Greenhouse Gas Emissions
Delayed Generation & Transmission Capital Investments
Smart Grid Advantages
Smart Grid : Building Blocks• Advanced Metering & Communication
– Smart Meters (single phase & polyphase), 2-way communication, interface to enterprise applications, Wide Area Monitoring System
• Distribution Automation– Fault Detection, Isolation, Restoration (FDIR), Integrated Volt/VAR
management, including switched capacitors & voltage regulator
• Substation Automation/M&D– Substation controller and transformer monitoring and diagnostics
• Distribution Operations– DMS/OMS software and interface to existing applications, control center
digitization, and enterprise integration
• Utility Enterprise Applications– Electric, Gas & Telecommunications utility geospatial based applications,
DSM application, and advanced analytics & visualization

Smart Grid Environment
Source: Generation Dispatch, AREVA – IEEE Smart Grid Conference January 2010.
Smart Grid Architecture
Smartgrid
devices
WiMax / BPL /RF
LTC
VoltageRegulator
CapBank
RTU
M&PSensors
Relays& PMUs
Integrated Network Manager
OperationsOMS/DMS/DAUtility
Enterprise
BusinessApplications
GIS/Apps, CIS, ERP, Asset Mgmt.
Home area network • ZigBee®/ HomePlug
AMI, smart home & demand response
DistributedDistributedGeneration (DG)Generation (DG)
Communications Infrastructure
WAMSWAMS

Central Station
The overall power system is traditionally viewed in terms of 7 layers; each performing its function from central station generation supplying power out to customers.
Wind Energy
Solar Energy
Fuel Cells
Combustion Engines
MicroTurbines
Interconnecting Distributed Power Systems
62
Distributed Energy Resources
Modern InterconnectionTechnologies
Electric Power Systems
Fuel Cell PV
Microturbine Wind
Utility Grid Simulator
Generator
Inverter
Switchgear,Relays, & Controls
Functions
•Power Conversion
•Power Conditioning (PQ)
•Protection
•DER and Load Control
•Ancillary Services
•Communications
•Metering
Micro Grids
EnergyStorage
Loads
Local LoadsLoad Simulators
UtilityGrid

ThankYou .. ?