Embed Size (px)
Citation preview

Local Labour Market PlanMarch 2013
Four County Labour Market PLanning boardPo box 1078, 111 Jackson Street, Suite 1Walkerton, on n0g 2V0 tel: 519-881-2725Fax: 519-881-3661toll Free: 888-774-1468executivedirector@planningboard.cawww.planningboard.ca
this employment ontario project is funded by the ontario government.
a proud member of
Champions of Ontario’s Local Labour Market Solutions
Trends, Opportunities and Priorities For bruCe, grey, Huron, PertH
LocalLabourPlan_4C_g_final.indd 1 11/26/12 5:33:49 PM

FCLMPB
Four County Labour Market Planning Board Directors and StaffBusiness: Andrew Coghlin, Philip Maier, Jayne ParkerLabour: Dave Jasper, Steve Miller (Co-Chair)Equity: Deb HotchkissEducator/Trainer: Jesse WilkinsonCommunity: Jo-Anne Cameron, (Co-Chair)Executive Director: Gemma Mendez-SmithMTCU Consultant: Darlene BoisvenueStaff: Debbie Davidson, Sherry Wilson, Kay Uitvlugt, Margaret Wettlaufer
The material contained in this report has been prepared by Four County Labour Market Planning Board (Planning Board) and is drawn from a variety of sources considered to be reliable. We make no representation or warranty, express or implied, as to its accuracy or completeness. In providing this material, the Planning Board does not assume any responsibility or liability.
The Workforce Planning Boards of Ontario are funded by:
Employment Ontario programs are funded in part by the Government of Canada.
The views expressed in this document do not necessarily reflect those of the Government of Ontario.
This publication was prepared by:
Gemma Mendez-SmithExecutive Director, Four County LMPB
Trends, Opportunities and Priorities for Bruce, Grey, Huron and PerthLocal Labour Market Plan - March 2013
Trends, Opportunities and Priorities for Bruce, Grey, Huron and PerthLocal Labour Market Plan - March 2013
| 1FCLMPB
Table of ConTenTsOur Vision ...........................................................2
Our Mission ........................................................2
Our Mandate.......................................................2
Executive Summary............................................3
Introduction .........................................................5
Consultations ......................................................6
Labour Market Review........................................7
Bruce County ......................................................8
Migration .............................................................8
Business Review ................................................9
Highlighted Industry Profiles .............................11
Crop Production Profile NAICS 111 .........11
Animal Production Industry Profile NAICS 112 ...............................................11
Professional, Scientific & Technical Services Industry Profile NAICS 541 .......12
Ambulatory Health Care Services Industry Profile NAICS 621 ......................12
Nursing & Residential Care Facilities Industry Profile NAICS 623 ......................13
Social Assistance Industry Profile NAICS 624 ...............................................13
Grey County .....................................................14
Migration ...........................................................14
Business Review ..............................................15
Highlighted Industry Profiles .............................17
Crop Production Profile NAICS 111 .........17
Animal Production Industry Profile NAICS 112 ...............................................17
Professional, Scientific & Technical Services Industry Profile NAICS 541 .......18
Ambulatory Health Care Services Industry Profile NAICS 621 ......................18
Nursing & Residential Care Facilities Industry Profile NAICS 623 ......................19
Social Assistance Industry Profile NAICS 624 ...............................................19
Huron County ...................................................20
Migration ...........................................................20
Business Review ..............................................21
Highlighted Industry Profiles .............................23
Crop Production Profile NAICS 111 .........23
Animal Production Industry Profile NAICS 112 ...............................................24
Professional, Scientific & Technical Services Industry Profile NAICS 541 .......24
Ambulatory Health Care Services Industry Profile NAICS 621 ......................25
Nursing & Residential Care Facilities Industry Profile NAICS 623 ......................25
Social Assistance Industry Profile NAICS 624 ...............................................26
Perth County.....................................................27
Migration ...........................................................27
Business Review ..............................................28
Highlighted Industry Profiles .............................30
Crop Production Profile NAICS 111 .........30
Animal Production Industry Profile NAICS 112 ...............................................31
Professional, Scientific & Technical Services Industry Profile NAICS 541 .......31
Ambulatory Health Care Services Industry Profile NAICS 621 ......................32
Nursing & Residential Care Facilities Industry Profile NAICS 623 ......................32
Social Assistance Industry Profile NAICS 624 ...............................................33
Action Plan 2012-13 Report Card.....................34
Action Plan 2013-14 .........................................38
Trends, Opportunities and Priorities for Bruce, Grey, Huron and PerthLocal Labour Market Plan - March 2013
| 2FCLMPB
our VisionThe Four County Labour Market Planning Board envisions a skilled workforce with meaningful job opportunities and quality employment in a sustainable and prosperous economy.
our MissionThe Four County Labour Market Planning Board plans and promotes local labour market strategies to meet the challenges of a changing economy.
our MandaTeThe Four County Labour Market Planning Board plays a leadership role in the development of innovative labour market strategies by:
• Providing reliable research; • Identifying labour market challenges; • Targeting workforce opportunities; • Promoting skills development; and, • Raising public awareness of workforce issues.
The Board accomplishes its mandate by working collaboratively with business, workforce and community organizations to plan and initiate projects and programs that address the specific needs of workforce development in Bruce, Grey, Huron and Perth counties.
Trends, Opportunities and Priorities for Bruce, Grey, Huron and PerthLocal Labour Market Plan - March 2013
| 3FCLMPB
exeCuTiVe suMMaryAnnually, Workforce Planning Boards across Ontario engage in labour market improvement measures for their local community and produce a Local Labour Market Plan (LLMP). The Four County Labour Market Planning Board (Planning Board) serving Bruce, Grey, Huron and Perth counties is a community-based non-profit corporation in existence since September 1997.
The LLMP provides information that sets the tone for the types of labour market improvements undertaken by the Planning Board and its partners in a given year.
Population is an important consideration in any workforce strategy and is reflected in the observations for this plan. Statistics Canada 2011 Census showed the total population in Bruce, Grey, Huron and Perth counties remained relatively unchanged since the 2006 Census, with less than one percent growth. When compared to Ontario’s population growth of 5.7 percent, our level of population growth could be viewed as stable or stagnant, depending on your view.
While slower population growth has economic impacts for the region’s ability to remain vibrant and dynamic, the movement of residents in and out of a region is even more telling. One of the key challenges expressed by employers in our rural community is the availability of a skilled workforce. The four counties’ migration dynamics are being driven by shifting demand for skill. As a result, the population base of each county is renewing itself through migration. Overall, the four county region saw 58,567 people move into the area and 58,610 move out, leaving a net loss of 58 people between 2006 and 2011. This information points to an opportunity to explore how we could attract workers with the skills needed by businesses that continue to innovate and grow. This innovation and growth allows us an opportunity for increased marketability to increase employment numbers.
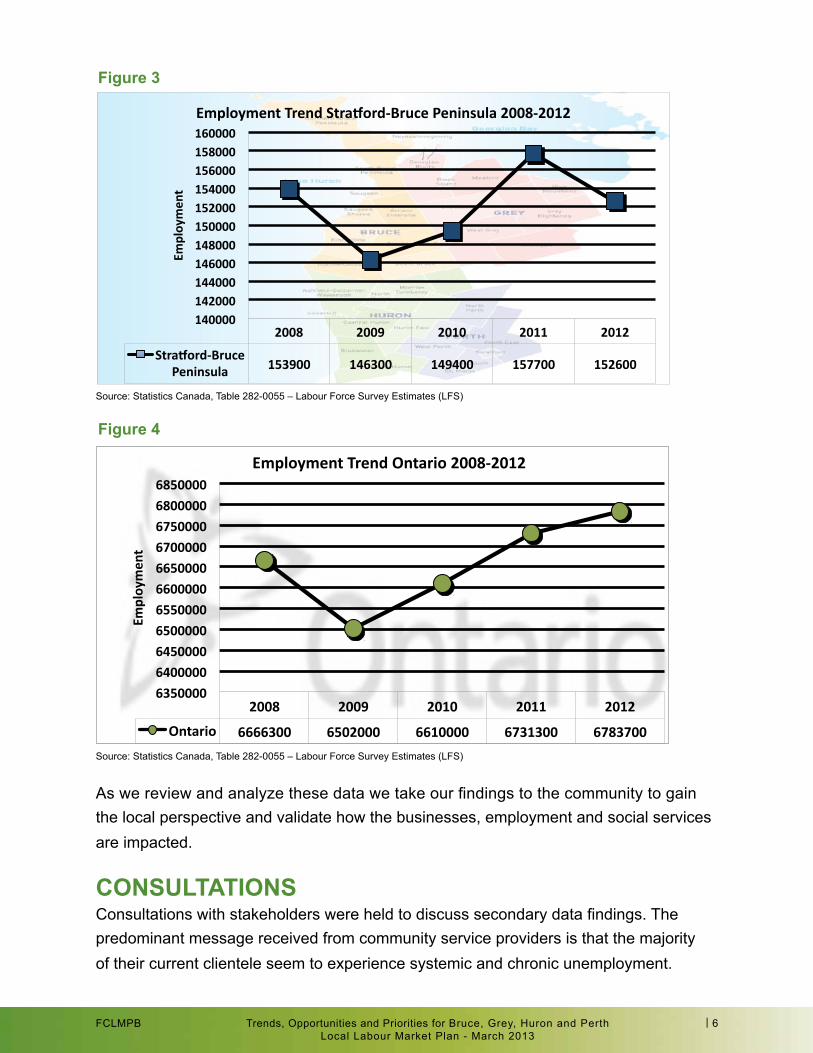
When reviewing the employment situation over the last five years Stratford-Bruce Peninsula economic region responded to the recession and rebounded quite well between 2008 and 2011. But between 2011 and 2012 the region saw a sharp decline of 5,100 in employment. This could, in-part, be a result of the tornado in Goderich and the time it takes to recover from the disaster. Some businesses did not reopen. This decline took the region below the starting number in 2008, but cannot be interpreted as an ongoing pattern.
Trends, Opportunities and Priorities for Bruce, Grey, Huron and PerthLocal Labour Market Plan - March 2013
| 4FCLMPB
0
500
1000
1500
2000
2500
3000
3500
4000
4500
Self-Employed
1-4 5-9 10-19 20-49 59-99 100-199 200-499 500+
Perth 4076 1503 643 390 244 87 34 19 7 Huron 3699 1300 539 306 179 60 20 6 1 Grey 3836 1656 689 404 195 65 38 24 3 Bruce 3143 1177 417 276 171 32 15 10 3
Region Employers by Employee Size Range June 2012
2012
2008 2009 2010 2011 2012
Ontario 6666300 6502000 6610000 6731300 6783700
6350000
6400000
6450000
6500000
6550000
6600000
6650000
6700000
6750000
6800000
6850000
Employmen
t
Employment Trend Ontario 2008-‐2012
2008 2009 2010 2011 2012
StraDord-‐Bruce Peninsula 153900 146300 149400 157700 152600
140000 142000 144000 146000 148000 150000 152000 154000 156000 158000 160000
Employmen
t
Employment Trend StraDord-‐Bruce Peninsula 2008-‐2012
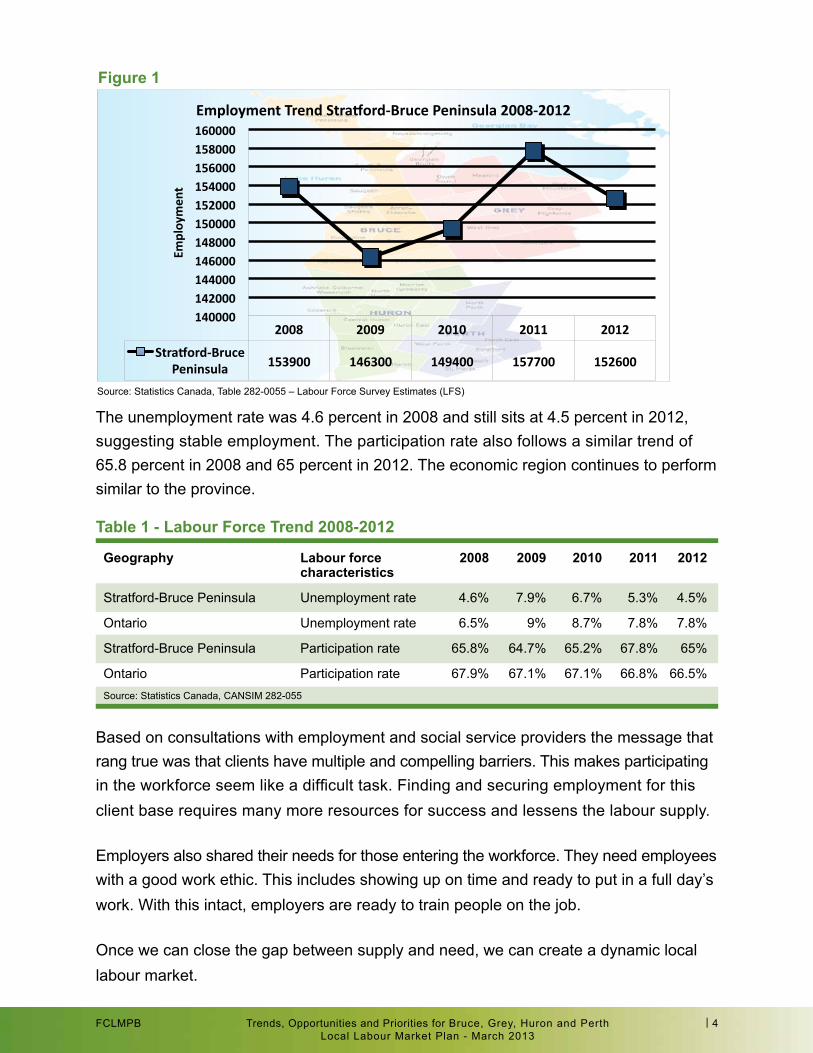
The unemployment rate was 4.6 percent in 2008 and still sits at 4.5 percent in 2012, suggesting stable employment. The participation rate also follows a similar trend of 65.8 percent in 2008 and 65 percent in 2012. The economic region continues to perform similar to the province.
Based on consultations with employment and social service providers the message that rang true was that clients have multiple and compelling barriers. This makes participating in the workforce seem like a difficult task. Finding and securing employment for this client base requires many more resources for success and lessens the labour supply.
Employers also shared their needs for those entering the workforce. They need employees with a good work ethic. This includes showing up on time and ready to put in a full day’s work. With this intact, employers are ready to train people on the job.
Once we can close the gap between supply and need, we can create a dynamic local labour market.
figure 1
Table 1 - labour force Trend 2008-2012
Geography labour force 2008 2009 2010 2011 2012 characteristics
Stratford-Bruce Peninsula Unemployment rate 4.6% 7.9% 6.7% 5.3% 4.5%
Ontario Unemployment rate 6.5% 9% 8.7% 7.8% 7.8%
Stratford-Bruce Peninsula Participation rate 65.8% 64.7% 65.2% 67.8% 65%
Ontario Participation rate 67.9% 67.1% 67.1% 66.8% 66.5%Source: Statistics Canada, CANSIM 282-055
Source: Statistics Canada, Table 282-0055 – Labour Force Survey Estimates (LFS)
Trends, Opportunities and Priorities for Bruce, Grey, Huron and PerthLocal Labour Market Plan - March 2013
| 5FCLMPB
0
500
1000
1500
2000
2500
3000
3500
4000
4500
Self-Employed
1-4 5-9 10-19 20-49 59-99 100-199 200-499 500+
Perth 4076 1503 643 390 244 87 34 19 7 Huron 3699 1300 539 306 179 60 20 6 1 Grey 3836 1656 689 404 195 65 38 24 3 Bruce 3143 1177 417 276 171 32 15 10 3
Region Employers by Employee Size Range June 2012
2012
2008 2009 2010 2011 2012
Ontario 6666300 6502000 6610000 6731300 6783700
6350000
6400000
6450000
6500000
6550000
6600000
6650000
6700000
6750000
6800000
6850000
Employmen
t
Employment Trend Ontario 2008-‐2012
2008 2009 2010 2011 2012
StraDord-‐Bruce Peninsula 153900 146300 149400 157700 152600
140000 142000 144000 146000 148000 150000 152000 154000 156000 158000 160000
Employmen
t
Employment Trend StraDord-‐Bruce Peninsula 2008-‐2012
inTroduCTionThe Planning Board region includes Bruce, Grey, Huron and Perth counties and serves a population base of 292,882 people in a predominantly rural area. Slower population growth and a negative net-migration regionally need to be addressed as we continue to engage in labour market planning.
The local labour market depends on several components. The two components we focus on in this report are business growth or decline and employment growth or decline.
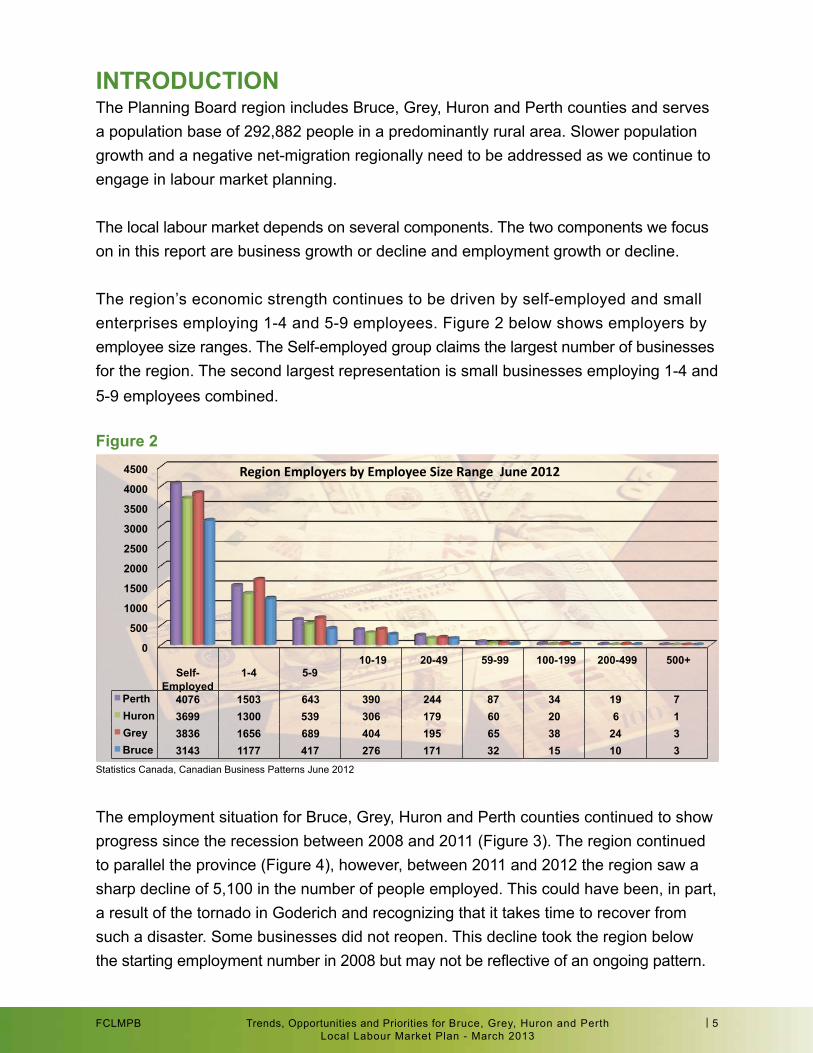
The region’s economic strength continues to be driven by self-employed and small enterprises employing 1-4 and 5-9 employees. Figure 2 below shows employers by employee size ranges. The Self-employed group claims the largest number of businesses for the region. The second largest representation is small businesses employing 1-4 and 5-9 employees combined.
figure 2
The employment situation for Bruce, Grey, Huron and Perth counties continued to show progress since the recession between 2008 and 2011 (Figure 3). The region continued to parallel the province (Figure 4), however, between 2011 and 2012 the region saw a sharp decline of 5,100 in the number of people employed. This could have been, in part, a result of the tornado in Goderich and recognizing that it takes time to recover from such a disaster. Some businesses did not reopen. This decline took the region below the starting employment number in 2008 but may not be reflective of an ongoing pattern.
Statistics Canada, Canadian Business Patterns June 2012
Trends, Opportunities and Priorities for Bruce, Grey, Huron and PerthLocal Labour Market Plan - March 2013
| 6FCLMPB
0
500
1000
1500
2000
2500
3000
3500
4000
4500
Self-Employed
1-4 5-9 10-19 20-49 59-99 100-199 200-499 500+
Perth 4076 1503 643 390 244 87 34 19 7 Huron 3699 1300 539 306 179 60 20 6 1 Grey 3836 1656 689 404 195 65 38 24 3 Bruce 3143 1177 417 276 171 32 15 10 3
Region Employers by Employee Size Range June 2012
2012
2008 2009 2010 2011 2012
Ontario 6666300 6502000 6610000 6731300 6783700
6350000
6400000
6450000
6500000
6550000
6600000
6650000
6700000
6750000
6800000
6850000
Employmen
t
Employment Trend Ontario 2008-‐2012
2008 2009 2010 2011 2012
StraDord-‐Bruce Peninsula 153900 146300 149400 157700 152600
140000 142000 144000 146000 148000 150000 152000 154000 156000 158000 160000
Employmen
t
Employment Trend StraDord-‐Bruce Peninsula 2008-‐2012
figure 3
figure 4
Source: Statistics Canada, Table 282-0055 – Labour Force Survey Estimates (LFS)
Source: Statistics Canada, Table 282-0055 – Labour Force Survey Estimates (LFS)
As we review and analyze these data we take our findings to the community to gain the local perspective and validate how the businesses, employment and social services are impacted.
ConsulTaTionsConsultations with stakeholders were held to discuss secondary data findings. The predominant message received from community service providers is that the majority of their current clientele seem to experience systemic and chronic unemployment.
Trends, Opportunities and Priorities for Bruce, Grey, Huron and PerthLocal Labour Market Plan - March 2013
| 7FCLMPB
They seem to have multiple and compelling barriers to employment. Most noteworthy were their lack of ability to function in a highly technological environment, their expectation of high wages and their unwillingness to take on part-time work. The third issue seemed to be most prevalent in young men 29 and younger.
Some employees are willing to continue to work and study part-time as long as there are options suitable to their demanding lifestyles. These options include online training. More flexible intake dates for online courses will help the local workforce to grow their skills. It is important to offer affordable internet access to residents as they continue to use online options to upgrade their skills. Another option for training could be more locally offered part-time studies.
Employers reported that finding more highly skilled professionals locally is a challenge. They have and continue to use several strategies to attract individuals, with the skills they need, to the community. This is time consuming and costly but necessary to introduce innovations and grow their business. Employers have a challenge to be strategic and anticipate their skills needs well in advance.
A new website, www.livegreybruce.ca, is one creative way of attracting those professionals. This tool is not a job bank, but a way to match employer skills requirements to those of skilled professionals looking to move to the area or change careers. It is a more long-term strategy.
Employers also indicated their willingness to employ people with basic skills and knowledge and most importantly, a good work ethic and problem-solving skills. Employers, primarily in manufacturing, indicated that they want people who have a theoretical knowledge of Lean Principles. This will help smooth workplace integration and shorten the learning curve while on the job.
labour MarkeT reViewThe labour market is made up of both demand (business) and supply (workforce) to function effectively. The following is a review by county of population, migration, business numbers and employment estimates for Small and Medium Enterprises (0-99 employees) changes over 2011 to 2012. It will also provide an update of business and employment changes for six industries profiled in the 2012 Local Labour Market Plan.
This information will provide a snapshot of what is happening in each county and could provide some perspective for economic development and training needs.
Trends, Opportunities and Priorities for Bruce, Grey, Huron and PerthLocal Labour Market Plan - March 2013
| 8FCLMPB
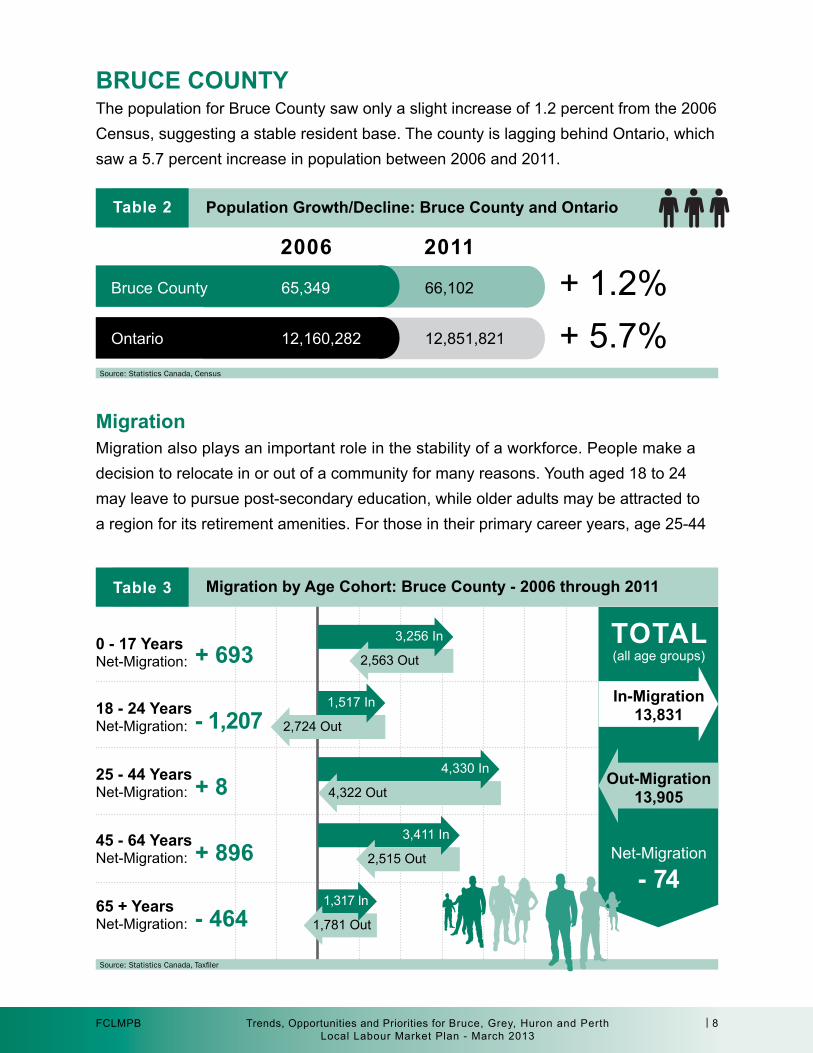
bruCe CounTyThe population for Bruce County saw only a slight increase of 1.2 percent from the 2006 Census, suggesting a stable resident base. The county is lagging behind Ontario, which saw a 5.7 percent increase in population between 2006 and 2011.
MigrationMigration also plays an important role in the stability of a workforce. People make a decision to relocate in or out of a community for many reasons. Youth aged 18 to 24 may leave to pursue post-secondary education, while older adults may be attracted to a region for its retirement amenities. For those in their primary career years, age 25-44
Bruce County 65,349 66,102
Ontario 12,160,282 12,851,821
2006 2011
+ 1.2%+ 5.7%
Table 2 Population Growth/decline: bruce County and ontario
Source: Statistics Canada, Census
+ 6930 - 17 years Net-Migration:
- 1,20718 - 24 years Net-Migration:
+ 825 - 44 years Net-Migration:
+ 89645 - 64 years Net-Migration:
- 46465 + years Net-Migration:
Table 3 Migration by age Cohort: bruce County - 2006 through 2011
Source: Statistics Canada, Taxfiler
3,256 In
2,563 Out
1,517 In
2,724 Out
4,330 In
4,322 Out
3,411 In
2,515 Out
1,317 In
1,781 Out
ToTal (all age groups)
in-Migration13,831
out-Migration13,905
Net-Migration
- 74
Trends, Opportunities and Priorities for Bruce, Grey, Huron and PerthLocal Labour Market Plan - March 2013
| 9FCLMPB
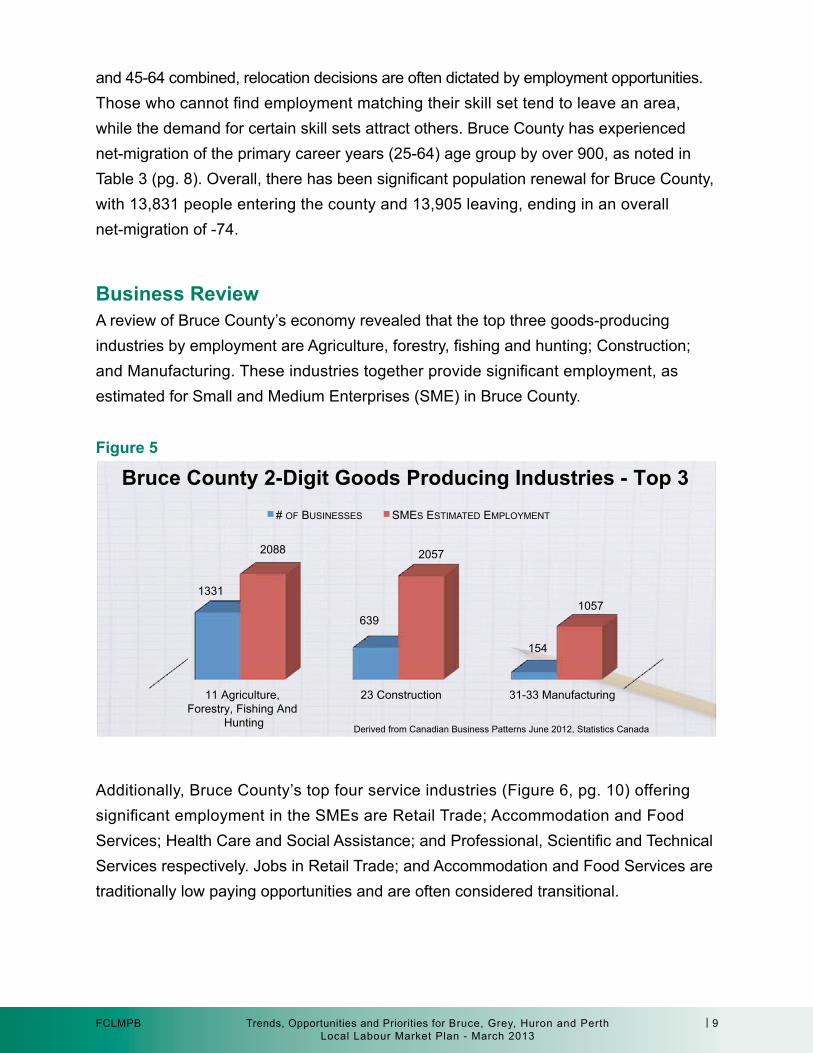
business reviewA review of Bruce County’s economy revealed that the top three goods-producing industries by employment are Agriculture, forestry, fishing and hunting; Construction; and Manufacturing. These industries together provide significant employment, as estimated for Small and Medium Enterprises (SME) in Bruce County.
1331
639
154
2088 2057
1057
# OF BUSINESSES SMES ESTIMATED EMPLOYMENT
Derived from Canadian Business Patterns June 2012, Statistics Canada
519 256 179
505
3118
2374
1372 1092
Bruce County 2-Digit Services Industries - Top 4 # OF BUSINESSES SMES ESTIMATED EMPLOYMENT
Derived from Canadian Business Patterns June 2012, Statistics Canada
Bruce County 2-Digit Goods Producing Industries - Top 3
11 Agriculture, Forestry, Fishing And
Hunting
23 Construction 31-33 Manufacturing
44-45 Retail Trade
72 Accommodation And Food Services
62 Health Care And Social Assistance
54 Professional, Scientific And
Technical Services
figure 5
and 45-64 combined, relocation decisions are often dictated by employment opportunities. Those who cannot find employment matching their skill set tend to leave an area, while the demand for certain skill sets attract others. Bruce County has experienced net-migration of the primary career years (25-64) age group by over 900, as noted in Table 3 (pg. 8). Overall, there has been significant population renewal for Bruce County, with 13,831 people entering the county and 13,905 leaving, ending in an overall net-migration of -74.
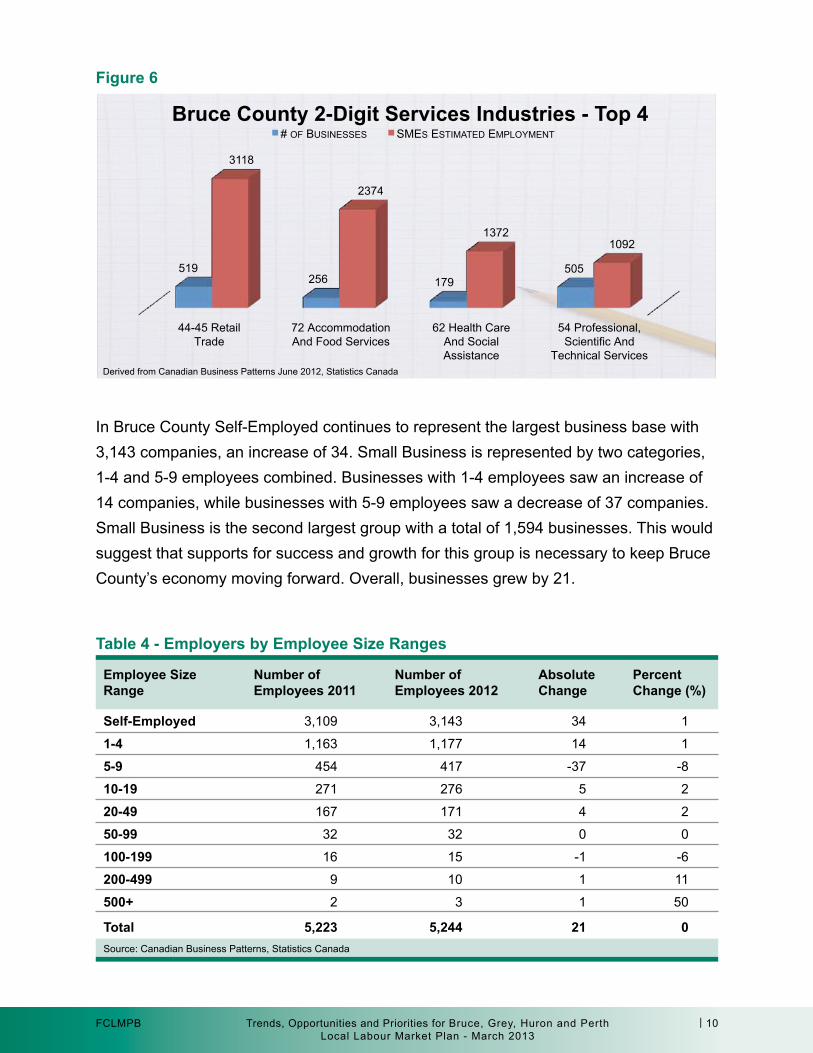
Additionally, Bruce County’s top four service industries (Figure 6, pg. 10) offering significant employment in the SMEs are Retail Trade; Accommodation and Food Services; Health Care and Social Assistance; and Professional, Scientific and Technical Services respectively. Jobs in Retail Trade; and Accommodation and Food Services are traditionally low paying opportunities and are often considered transitional.
Trends, Opportunities and Priorities for Bruce, Grey, Huron and PerthLocal Labour Market Plan - March 2013
| 10FCLMPB
In Bruce County Self-Employed continues to represent the largest business base with 3,143 companies, an increase of 34. Small Business is represented by two categories, 1-4 and 5-9 employees combined. Businesses with 1-4 employees saw an increase of 14 companies, while businesses with 5-9 employees saw a decrease of 37 companies. Small Business is the second largest group with a total of 1,594 businesses. This would suggest that supports for success and growth for this group is necessary to keep Bruce County’s economy moving forward. Overall, businesses grew by 21.
1331
639
154
2088 2057
1057
# OF BUSINESSES SMES ESTIMATED EMPLOYMENT
Derived from Canadian Business Patterns June 2012, Statistics Canada
519 256 179
505
3118
2374
1372 1092
Bruce County 2-Digit Services Industries - Top 4 # OF BUSINESSES SMES ESTIMATED EMPLOYMENT
Derived from Canadian Business Patterns June 2012, Statistics Canada
Bruce County 2-Digit Goods Producing Industries - Top 3
11 Agriculture, Forestry, Fishing And
Hunting
23 Construction 31-33 Manufacturing
44-45 Retail Trade
72 Accommodation And Food Services
62 Health Care And Social Assistance
54 Professional, Scientific And
Technical Services
figure 6
Table 4 - employers by employee size ranges
employee size number of number of absolute Percent range employees 2011 employees 2012 Change Change (%)
self-employed 3,109 3,143 34 1
1-4 1,163 1,177 14 1
5-9 454 417 -37 -8
10-19 271 276 5 2
20-49 167 171 4 2
50-99 32 32 0 0
100-199 16 15 -1 -6
200-499 9 10 1 11
500+ 2 3 1 50
Total 5,223 5,244 21 0Source: Canadian Business Patterns, Statistics Canada
Trends, Opportunities and Priorities for Bruce, Grey, Huron and PerthLocal Labour Market Plan - March 2013
| 11FCLMPB
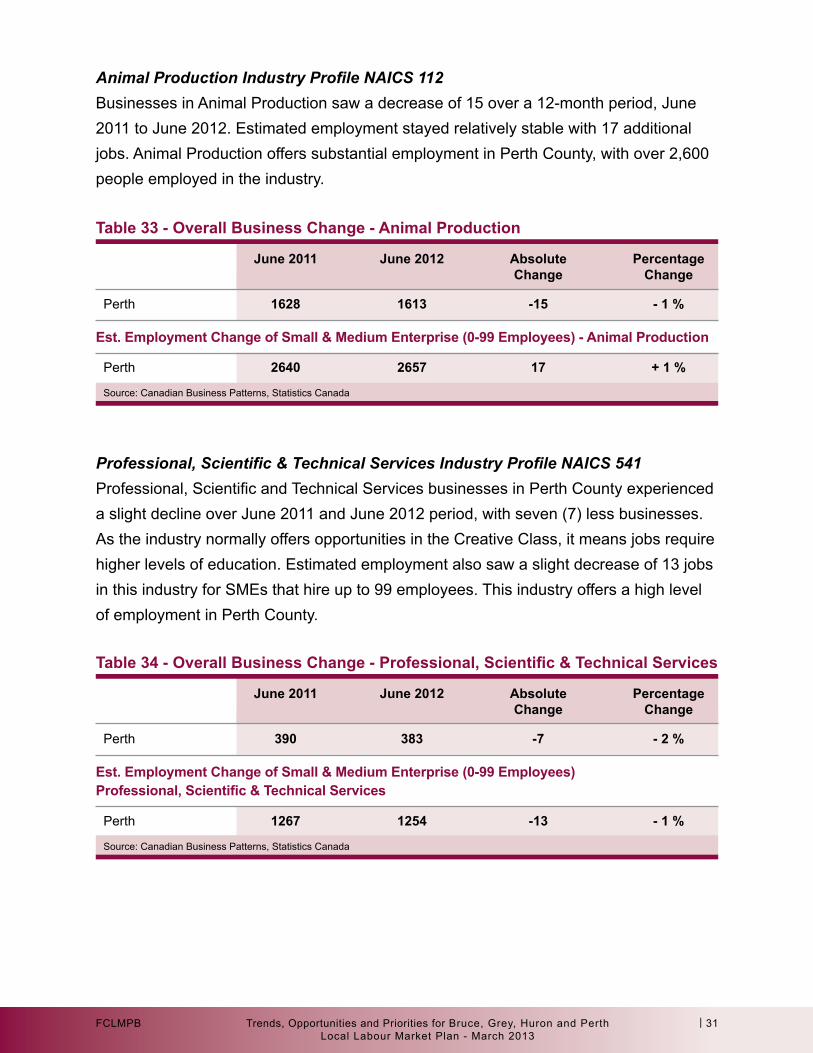
Animal Production Industry Profile NAICS 112 Animal Production saw an increase of 42 businesses over a 12-month period June 2011 to June 2012. Estimated employment stayed relatively stable with eight (8) additional jobs. Animal Production offers high employment in Bruce County with over 1,300 people employed in the industry.
Highlighted Industry ProfilesThe Agricultural sector continues to provide business and employment opportunities in Bruce County. Crop Production and Animal Production both show strongly in the county’s economy.
Crop Production Profile NAICS 111Crop Production posted an increase of 18 businesses, or eight (8) percent over a 12-month period. Employment was relatively stable showing a slight increase by 32 jobs from June 2011. Certification training particularly in Pesticide Use is very beneficial when working in this industry.
Table 5 - overall business Change - Crop Production
est. employment Change of small & Medium enterprise (0-99 employees) - Crop Production
June 2011 June 2012 absolute Percentage Change Change
Bruce 234 252 18 + 8 %
Bruce 539 571 32 + 6 %
Source: Canadian Business Patterns, Statistics Canada
Table 6 - overall business Change - animal Production
est. employment Change of small & Medium enterprise (0-99 employees) - animal Production
June 2011 June 2012 absolute Percentage Change Change
Bruce 999 1041 42 + 4 %
Bruce 1371 1379 8 + 1 %
Source: Canadian Business Patterns, Statistics Canada
Trends, Opportunities and Priorities for Bruce, Grey, Huron and PerthLocal Labour Market Plan - March 2013
| 12FCLMPB
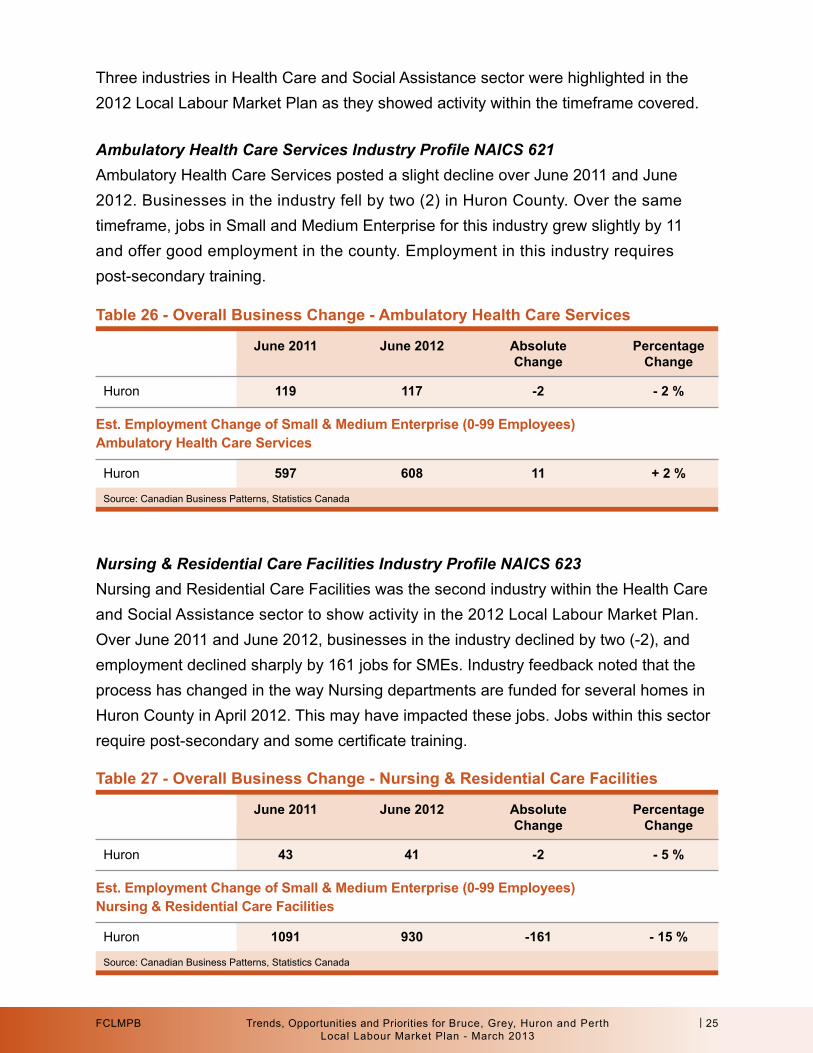
Three industries in Health Care and Social Assistance sector were highlighted in the 2012 Local Labour Market Plan, as they showed activity within the timeframe covered.
Ambulatory Health Care Services Industry Profile NAICS 621Ambulatory Health Care Services again showed growth over the June 2011 to June 2012 time period. Businesses in the industry grew by eight (8) in Bruce County. An increase in businesses does not necessarily mean job growth, as seen in the estimated employment numbers. SMEs saw a slight decline in jobs by 51 for the industry. Employment in this industry requires post-secondary training.
Professional, Scientific & Technical Services Industry Profile NAICS 541Professional, Scientific and Technical Services businesses in Bruce County remained stable over June 2011 to June 2012 period. The industry offers opportunities in the Creative Class and this usually means jobs that require higher levels of education. Estimated employment in this industry declined by 44 jobs, but still offers a high level of employment for Bruce County in SMEs that hire up to 99 employees.
Table 7 - Overall Business Change - Professional, Scientific & Technical Services
est. employment Change of small & Medium enterprise (0-99 employees) Professional, Scientific & Technical Services
June 2011 June 2012 absolute Percentage Change Change
Bruce 505 505 0 0 %
Bruce 1136 1092 - 44 - 4 %
Source: Canadian Business Patterns, Statistics Canada
Table 8 - overall business Change - ambulatory Health Care services
est. employment Change of small & Medium enterprise (0-99 employees) ambulatory Health Care services
June 2011 June 2012 absolute Percentage Change Change
Bruce 116 123 8 + 7 %
Bruce 502 451 - 51 - 10 %
Source: Canadian Business Patterns, Statistics Canada
Trends, Opportunities and Priorities for Bruce, Grey, Huron and PerthLocal Labour Market Plan - March 2013
| 13FCLMPB
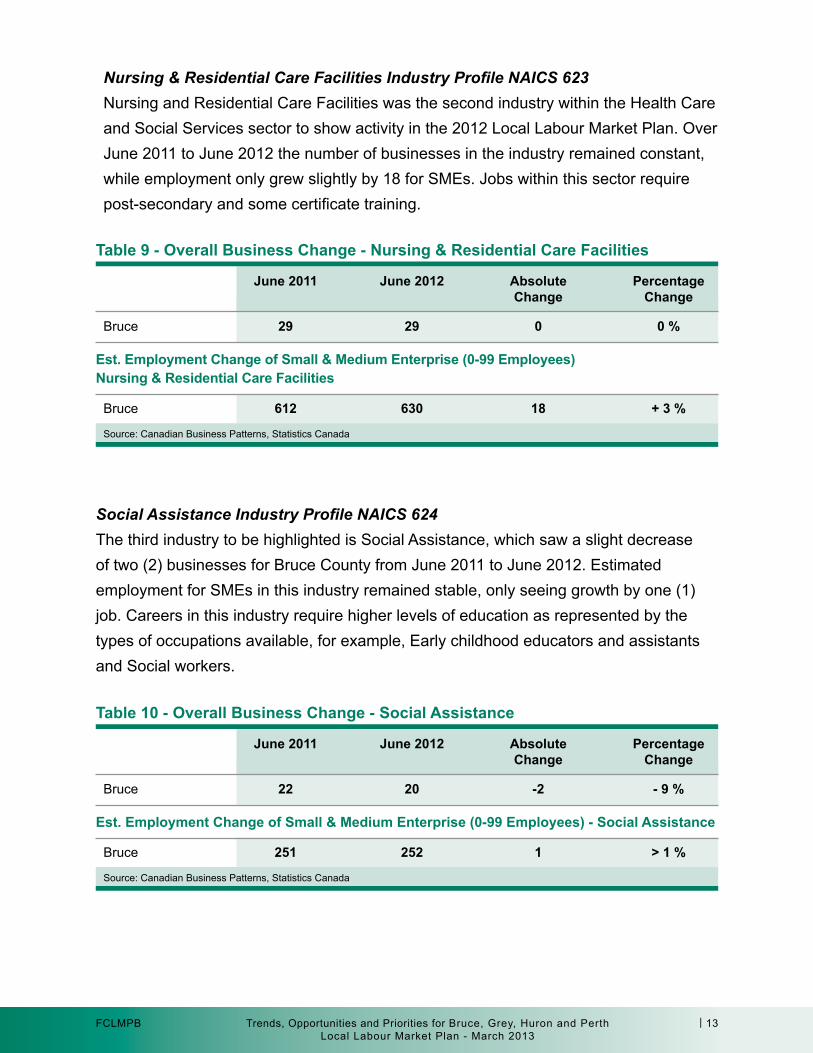
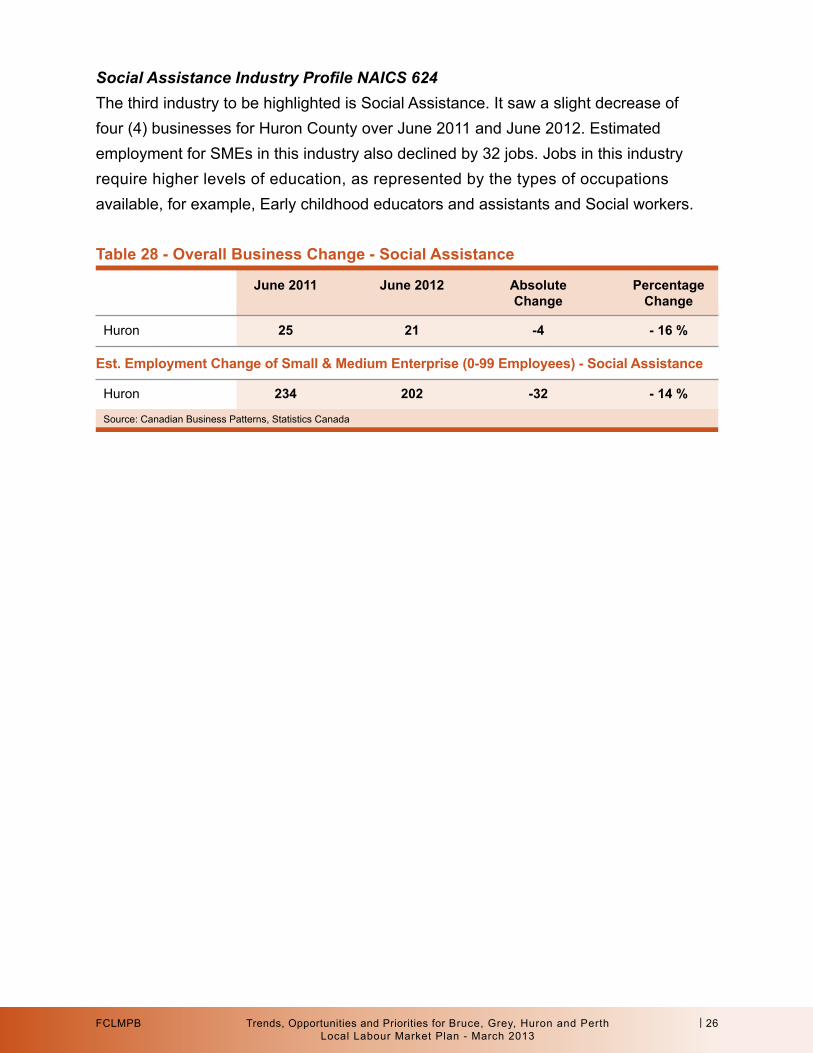
Social Assistance Industry Profile NAICS 624The third industry to be highlighted is Social Assistance, which saw a slight decrease of two (2) businesses for Bruce County from June 2011 to June 2012. Estimated employment for SMEs in this industry remained stable, only seeing growth by one (1) job. Careers in this industry require higher levels of education as represented by the types of occupations available, for example, Early childhood educators and assistants and Social workers.
Nursing & Residential Care Facilities Industry Profile NAICS 623Nursing and Residential Care Facilities was the second industry within the Health Care and Social Services sector to show activity in the 2012 Local Labour Market Plan. Over June 2011 to June 2012 the number of businesses in the industry remained constant, while employment only grew slightly by 18 for SMEs. Jobs within this sector require post-secondary and some certificate training.
Table 9 - overall business Change - nursing & residential Care facilities
est. employment Change of small & Medium enterprise (0-99 employees) nursing & residential Care facilities
June 2011 June 2012 absolute Percentage Change Change
Bruce 29 29 0 0 %
Bruce 612 630 18 + 3 %
Source: Canadian Business Patterns, Statistics Canada
Table 10 - overall business Change - social assistance
est. employment Change of small & Medium enterprise (0-99 employees) - social assistance
June 2011 June 2012 absolute Percentage Change Change
Bruce 22 20 -2 - 9 %
Bruce 251 252 1 > 1 %
Source: Canadian Business Patterns, Statistics Canada
Trends, Opportunities and Priorities for Bruce, Grey, Huron and PerthLocal Labour Market Plan - March 2013
| 14FCLMPB
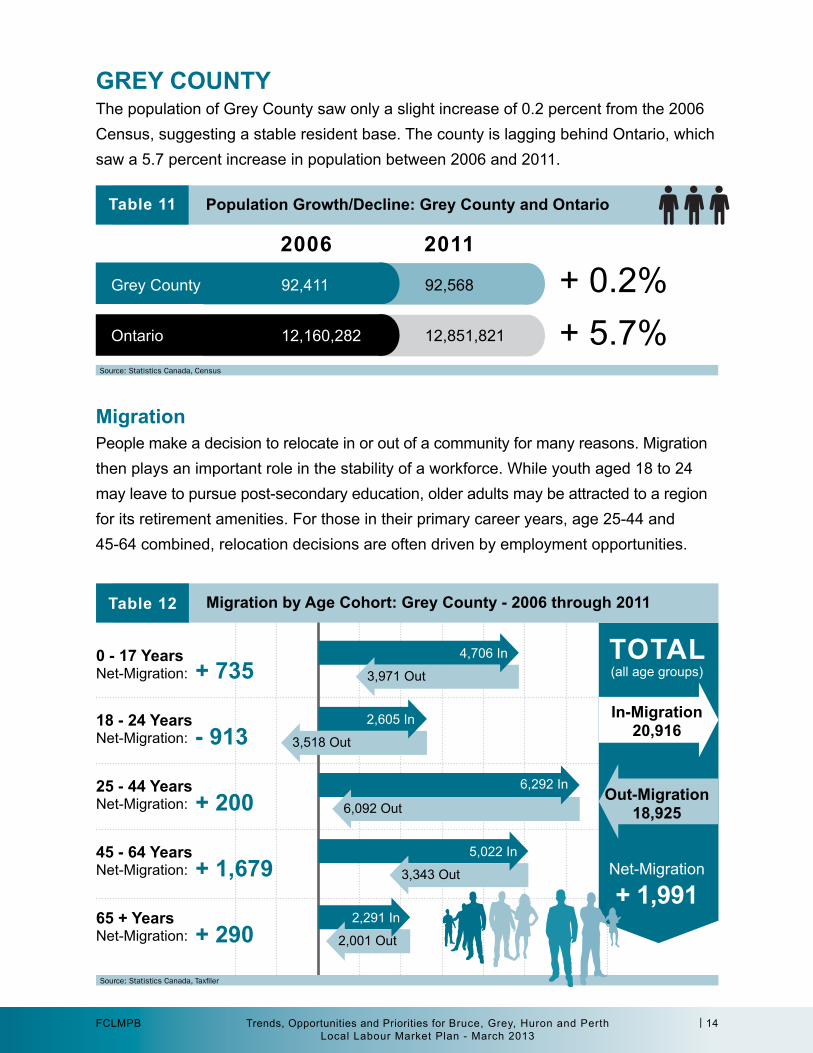
Grey CounTyThe population of Grey County saw only a slight increase of 0.2 percent from the 2006 Census, suggesting a stable resident base. The county is lagging behind Ontario, which saw a 5.7 percent increase in population between 2006 and 2011.
MigrationPeople make a decision to relocate in or out of a community for many reasons. Migration then plays an important role in the stability of a workforce. While youth aged 18 to 24 may leave to pursue post-secondary education, older adults may be attracted to a region for its retirement amenities. For those in their primary career years, age 25-44 and 45-64 combined, relocation decisions are often driven by employment opportunities.
Grey County 92,411 92,568
Ontario 12,160,282 12,851,821
2006 2011
+ 0.2%+ 5.7%
Table 11 Population Growth/decline: Grey County and ontario
Source: Statistics Canada, Census
+ 7350 - 17 years Net-Migration:
- 91318 - 24 years Net-Migration:
+ 20025 - 44 years Net-Migration:
+ 1,67945 - 64 years Net-Migration:
+ 29065 + years Net-Migration:
Table 12 Migration by age Cohort: Grey County - 2006 through 2011
Source: Statistics Canada, Taxfiler
2,605 In
3,518 Out
6,292 In
6,092 Out
5,022 In
3,343 Out
2,291 In
2,001 Out
ToTal (all age groups)
in-Migration20,916
out-Migration18,925
Net-Migration
+ 1,991
4,706 In
3,971 Out
Trends, Opportunities and Priorities for Bruce, Grey, Huron and PerthLocal Labour Market Plan - March 2013
| 15FCLMPB
Those who cannot find employment matching their skill set tend to leave an area, while the demand for certain skill sets attract others. Grey County has experienced net-migration of the primary career years (25-64) age group by over 1,800, as noted in Table 12 (pg. 14). Overall there has been significant population renewal, with 20,916 people moving into Grey County and 18,925 moving out. Grey County experienced a positive net-migration of 1,991 and the greatest among all four counties.
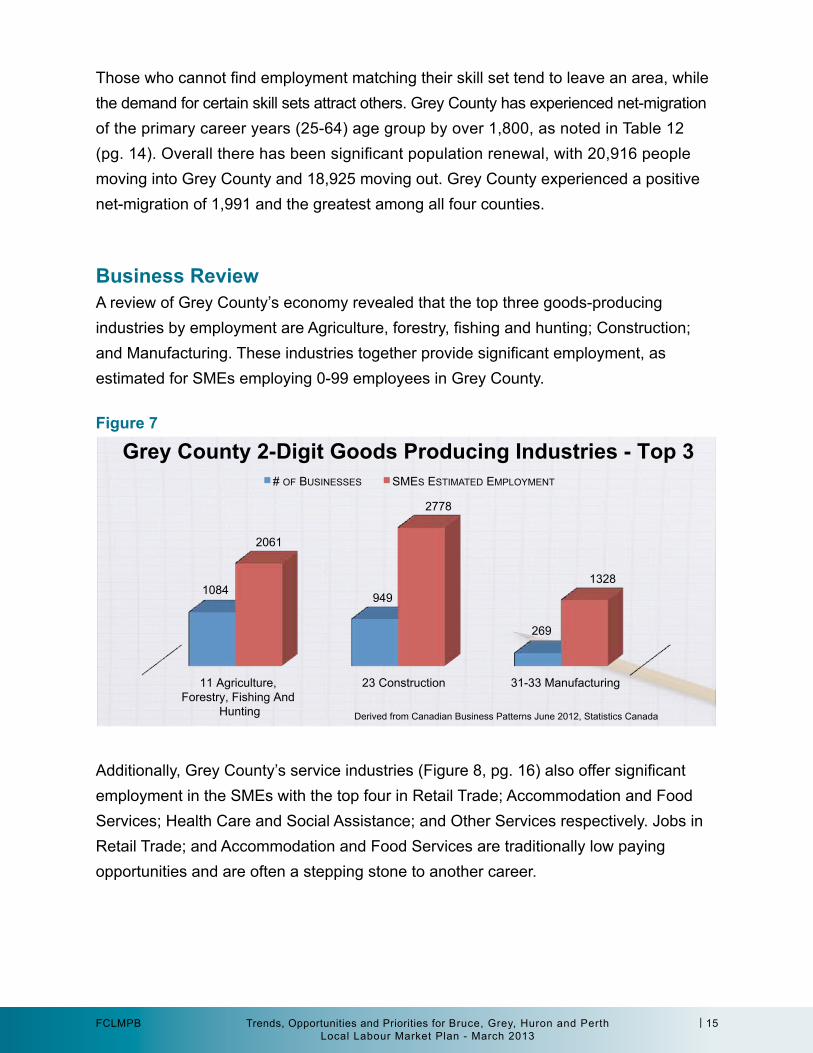
business reviewA review of Grey County’s economy revealed that the top three goods-producing industries by employment are Agriculture, forestry, fishing and hunting; Construction; and Manufacturing. These industries together provide significant employment, as estimated for SMEs employing 0-99 employees in Grey County.
Additionally, Grey County’s service industries (Figure 8, pg. 16) also offer significant employment in the SMEs with the top four in Retail Trade; Accommodation and Food Services; Health Care and Social Assistance; and Other Services respectively. Jobs in Retail Trade; and Accommodation and Food Services are traditionally low paying opportunities and are often a stepping stone to another career.
1084 949
269
2061
2778
1328
# OF BUSINESSES SMES ESTIMATED EMPLOYMENT
Derived from Canadian Business Patterns June 2012, Statistics Canada
11 Agriculture, Forestry, Fishing And
Hunting
23 Construction 31-33 Manufacturing
Grey County 2-Digit Goods Producing Industries - Top 3
717 244 359 375
4656
3232
2562
1658
# OF BUSINESESS SMES ESTIMATED EMPLOYMENT
Derived from Canadian Business Patterns June 2012, Statistics Canada
44-45 Retail Trade
72 Accommodation And Food Services
62 Health Care And Social Assistance
81 Other Services (except public administration)
Grey County 2-Digit Services Industries - Top 4
figure 7
Trends, Opportunities and Priorities for Bruce, Grey, Huron and PerthLocal Labour Market Plan - March 2013
| 16FCLMPB
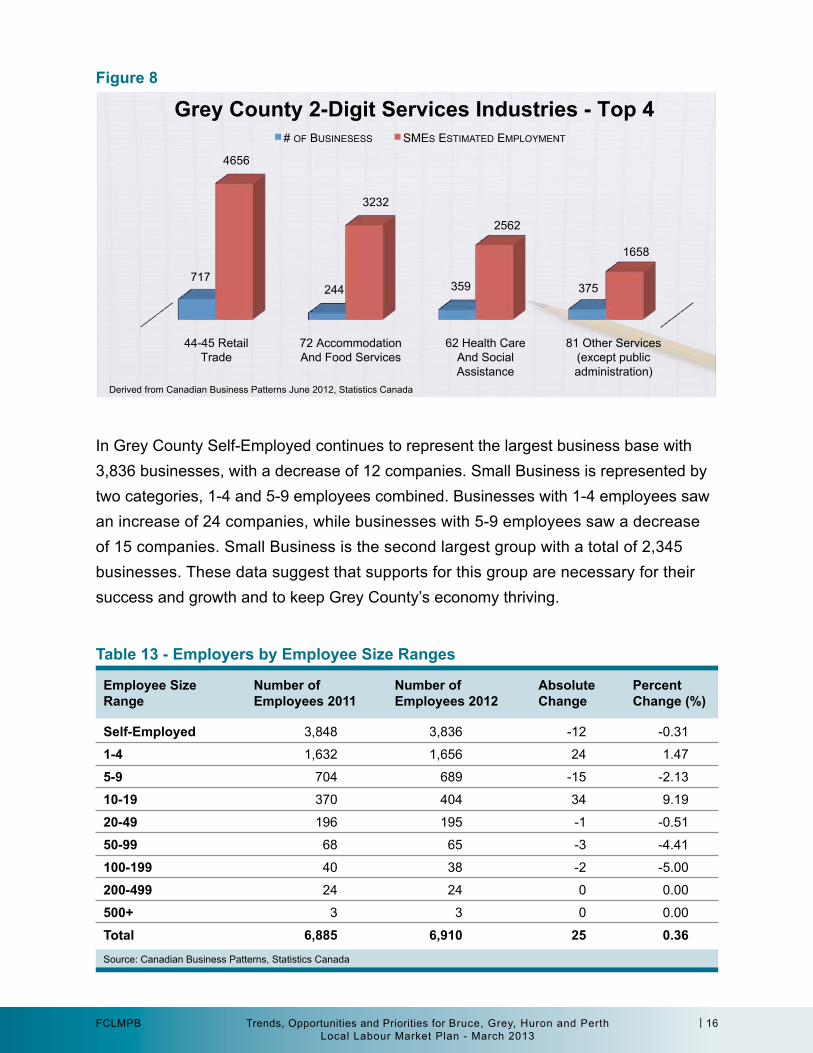
In Grey County Self-Employed continues to represent the largest business base with 3,836 businesses, with a decrease of 12 companies. Small Business is represented by two categories, 1-4 and 5-9 employees combined. Businesses with 1-4 employees saw an increase of 24 companies, while businesses with 5-9 employees saw a decrease of 15 companies. Small Business is the second largest group with a total of 2,345 businesses. These data suggest that supports for this group are necessary for their success and growth and to keep Grey County’s economy thriving.
Table 13 - employers by employee size ranges
employee size number of number of absolute Percent range employees 2011 employees 2012 Change Change (%)
self-employed 3,848 3,836 -12 -0.31
1-4 1,632 1,656 24 1.47
5-9 704 689 -15 -2.13
10-19 370 404 34 9.19
20-49 196 195 -1 -0.51
50-99 68 65 -3 -4.41
100-199 40 38 -2 -5.00
200-499 24 24 0 0.00
500+ 3 3 0 0.00
Total 6,885 6,910 25 0.36Source: Canadian Business Patterns, Statistics Canada
1084 949
269
2061
2778
1328
# OF BUSINESSES SMES ESTIMATED EMPLOYMENT
Derived from Canadian Business Patterns June 2012, Statistics Canada
11 Agriculture, Forestry, Fishing And
Hunting
23 Construction 31-33 Manufacturing
Grey County 2-Digit Goods Producing Industries - Top 3
717 244 359 375
4656
3232
2562
1658
# OF BUSINESESS SMES ESTIMATED EMPLOYMENT
Derived from Canadian Business Patterns June 2012, Statistics Canada
44-45 Retail Trade
72 Accommodation And Food Services
62 Health Care And Social Assistance
81 Other Services (except public administration)
Grey County 2-Digit Services Industries - Top 4 figure 8
Trends, Opportunities and Priorities for Bruce, Grey, Huron and PerthLocal Labour Market Plan - March 2013
| 17FCLMPB
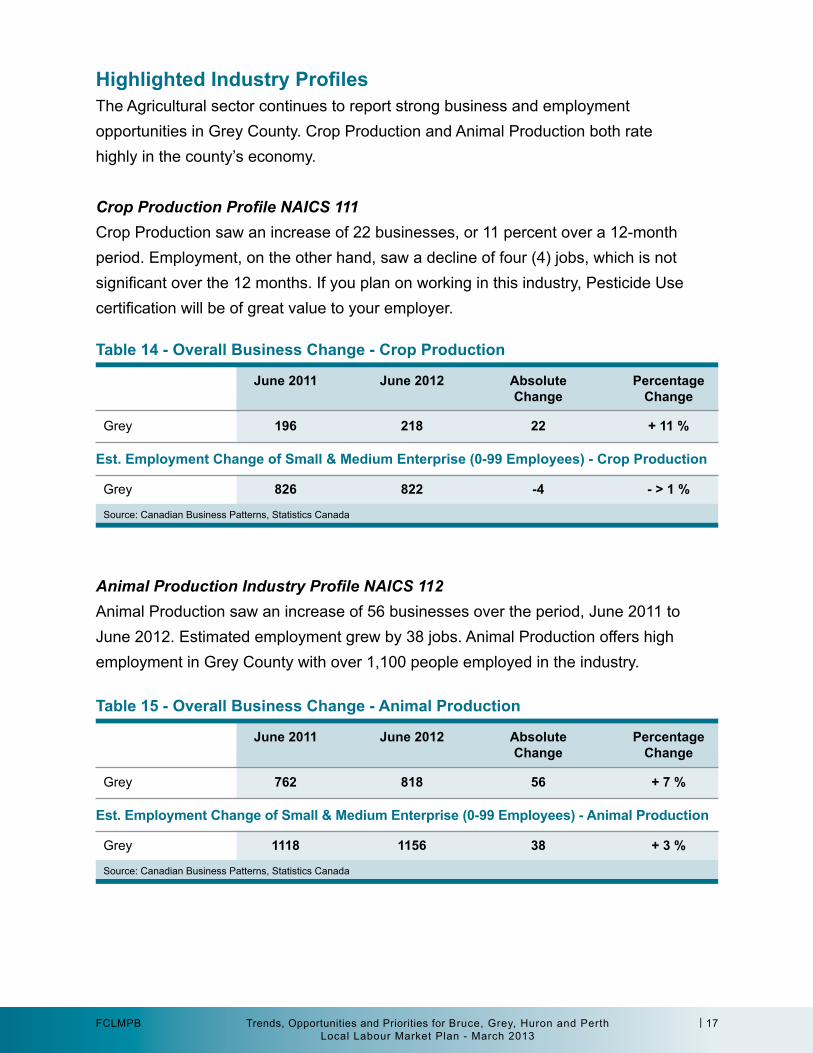
Highlighted Industry ProfilesThe Agricultural sector continues to report strong business and employment opportunities in Grey County. Crop Production and Animal Production both rate highly in the county’s economy.
Crop Production Profile NAICS 111Crop Production saw an increase of 22 businesses, or 11 percent over a 12-month period. Employment, on the other hand, saw a decline of four (4) jobs, which is not significant over the 12 months. If you plan on working in this industry, Pesticide Use certification will be of great value to your employer.
Animal Production Industry Profile NAICS 112Animal Production saw an increase of 56 businesses over the period, June 2011 to June 2012. Estimated employment grew by 38 jobs. Animal Production offers high employment in Grey County with over 1,100 people employed in the industry.
Table 15 - overall business Change - animal Production
est. employment Change of small & Medium enterprise (0-99 employees) - animal Production
June 2011 June 2012 absolute Percentage Change Change
Grey 762 818 56 + 7 %
Grey 1118 1156 38 + 3 %
Source: Canadian Business Patterns, Statistics Canada
Table 14 - overall business Change - Crop Production
est. employment Change of small & Medium enterprise (0-99 employees) - Crop Production
June 2011 June 2012 absolute Percentage Change Change
Grey 196 218 22 + 11 %
Grey 826 822 -4 - > 1 %
Source: Canadian Business Patterns, Statistics Canada
Trends, Opportunities and Priorities for Bruce, Grey, Huron and PerthLocal Labour Market Plan - March 2013
| 18FCLMPB
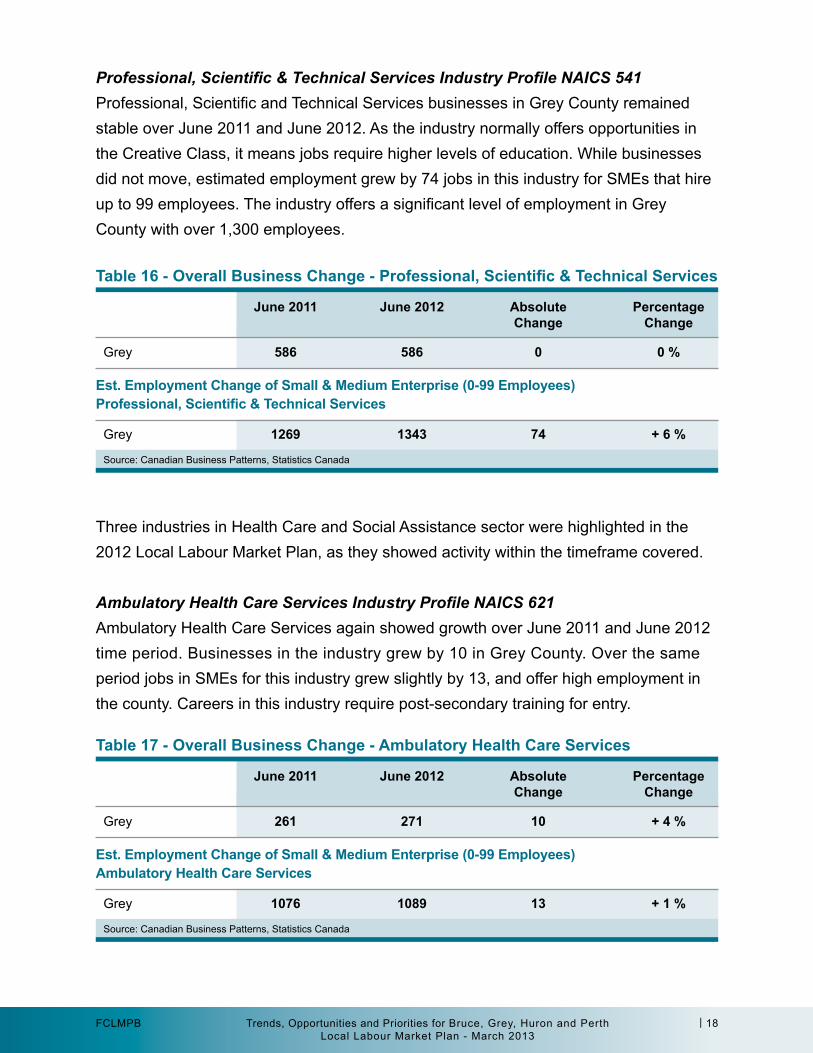
Professional, Scientific & Technical Services Industry Profile NAICS 541Professional, Scientific and Technical Services businesses in Grey County remained stable over June 2011 and June 2012. As the industry normally offers opportunities in the Creative Class, it means jobs require higher levels of education. While businesses did not move, estimated employment grew by 74 jobs in this industry for SMEs that hire up to 99 employees. The industry offers a significant level of employment in Grey County with over 1,300 employees.
Three industries in Health Care and Social Assistance sector were highlighted in the 2012 Local Labour Market Plan, as they showed activity within the timeframe covered.
Ambulatory Health Care Services Industry Profile NAICS 621Ambulatory Health Care Services again showed growth over June 2011 and June 2012 time period. Businesses in the industry grew by 10 in Grey County. Over the same period jobs in SMEs for this industry grew slightly by 13, and offer high employment in the county. Careers in this industry require post-secondary training for entry.
Table 16 - Overall Business Change - Professional, Scientific & Technical Services
Table 17 - overall business Change - ambulatory Health Care services
est. employment Change of small & Medium enterprise (0-99 employees) Professional, Scientific & Technical Services
est. employment Change of small & Medium enterprise (0-99 employees) ambulatory Health Care services
June 2011 June 2012 absolute Percentage Change Change
Grey 586 586 0 0 %
June 2011 June 2012 absolute Percentage Change Change
Grey 261 271 10 + 4 %
Grey 1269 1343 74 + 6 %
Grey 1076 1089 13 + 1 %
Source: Canadian Business Patterns, Statistics Canada
Source: Canadian Business Patterns, Statistics Canada
Trends, Opportunities and Priorities for Bruce, Grey, Huron and PerthLocal Labour Market Plan - March 2013
| 19FCLMPB
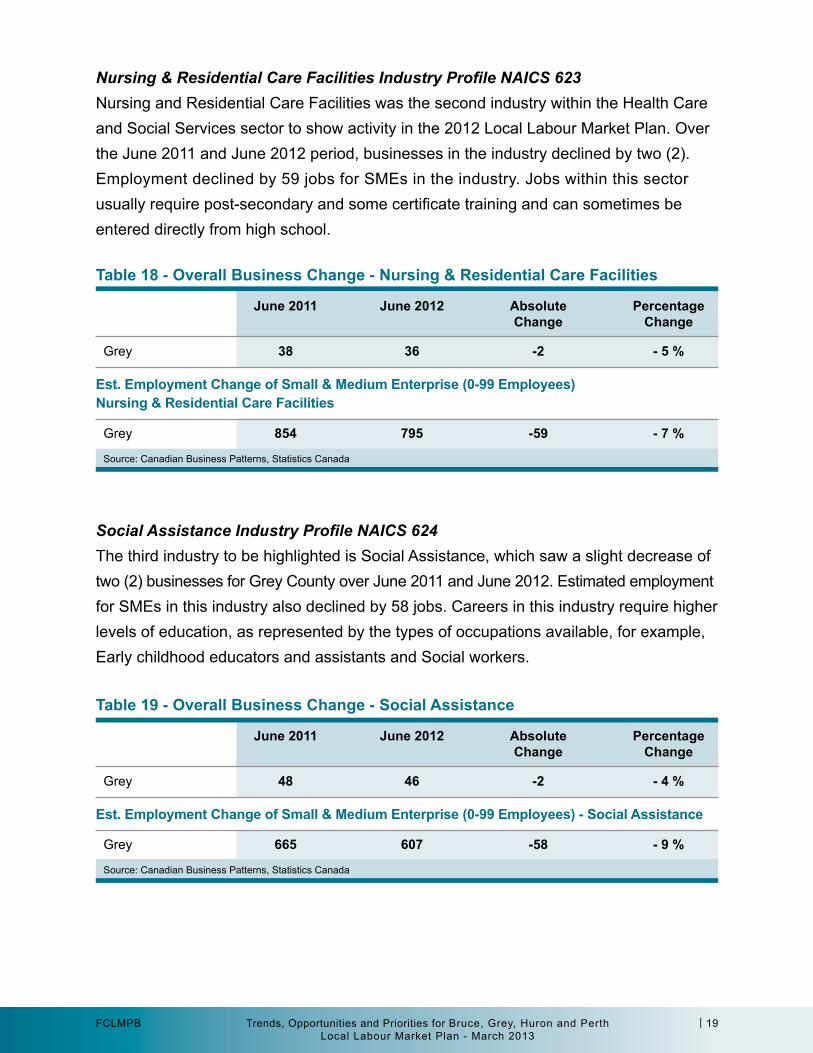
Nursing & Residential Care Facilities Industry Profile NAICS 623Nursing and Residential Care Facilities was the second industry within the Health Care and Social Services sector to show activity in the 2012 Local Labour Market Plan. Over the June 2011 and June 2012 period, businesses in the industry declined by two (2). Employment declined by 59 jobs for SMEs in the industry. Jobs within this sector usually require post-secondary and some certificate training and can sometimes be entered directly from high school.
Social Assistance Industry Profile NAICS 624The third industry to be highlighted is Social Assistance, which saw a slight decrease of two (2) businesses for Grey County over June 2011 and June 2012. Estimated employment for SMEs in this industry also declined by 58 jobs. Careers in this industry require higher levels of education, as represented by the types of occupations available, for example, Early childhood educators and assistants and Social workers.
Table 18 - overall business Change - nursing & residential Care facilities
est. employment Change of small & Medium enterprise (0-99 employees) nursing & residential Care facilities
June 2011 June 2012 absolute Percentage Change Change
Grey 38 36 -2 - 5 %
Grey 854 795 -59 - 7 %
Source: Canadian Business Patterns, Statistics Canada
Table 19 - overall business Change - social assistance
est. employment Change of small & Medium enterprise (0-99 employees) - social assistance
June 2011 June 2012 absolute Percentage Change Change
Grey 48 46 -2 - 4 %
Grey 665 607 -58 - 9 %
Source: Canadian Business Patterns, Statistics Canada
Trends, Opportunities and Priorities for Bruce, Grey, Huron and PerthLocal Labour Market Plan - March 2013
| 20FCLMPB
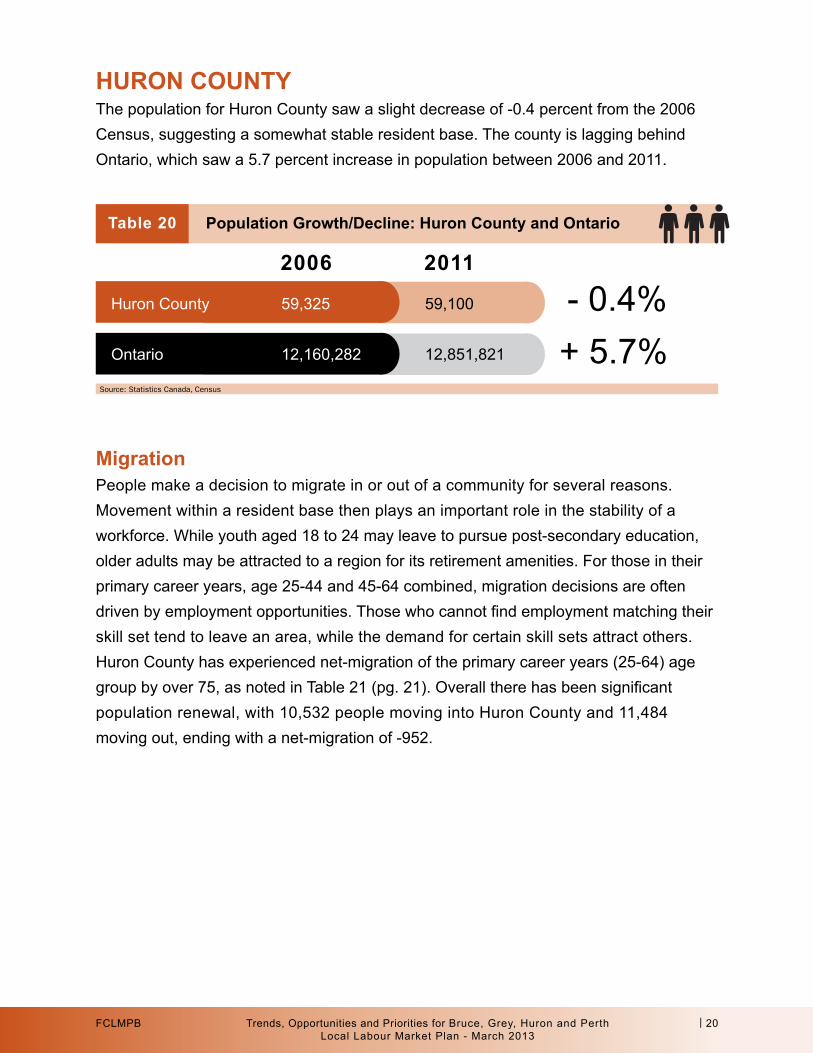
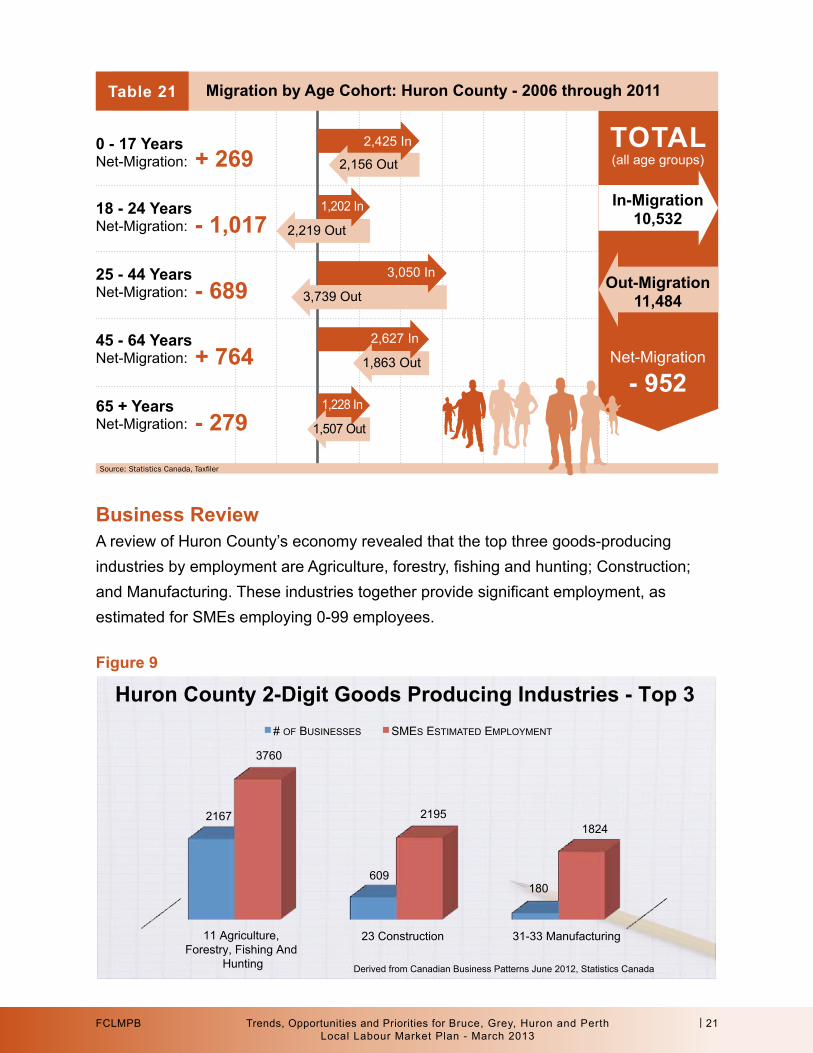
Huron CounTyThe population for Huron County saw a slight decrease of -0.4 percent from the 2006 Census, suggesting a somewhat stable resident base. The county is lagging behind Ontario, which saw a 5.7 percent increase in population between 2006 and 2011.
MigrationPeople make a decision to migrate in or out of a community for several reasons. Movement within a resident base then plays an important role in the stability of a workforce. While youth aged 18 to 24 may leave to pursue post-secondary education, older adults may be attracted to a region for its retirement amenities. For those in their primary career years, age 25-44 and 45-64 combined, migration decisions are often driven by employment opportunities. Those who cannot find employment matching their skill set tend to leave an area, while the demand for certain skill sets attract others. Huron County has experienced net-migration of the primary career years (25-64) age group by over 75, as noted in Table 21 (pg. 21). Overall there has been significant population renewal, with 10,532 people moving into Huron County and 11,484 moving out, ending with a net-migration of -952.
Huron County 59,325 59,100
Ontario 12,160,282 12,851,821
2006 2011
- 0.4%+ 5.7%
Table 20 Population Growth/decline: Huron County and ontario
Source: Statistics Canada, Census
Trends, Opportunities and Priorities for Bruce, Grey, Huron and PerthLocal Labour Market Plan - March 2013
| 21FCLMPB
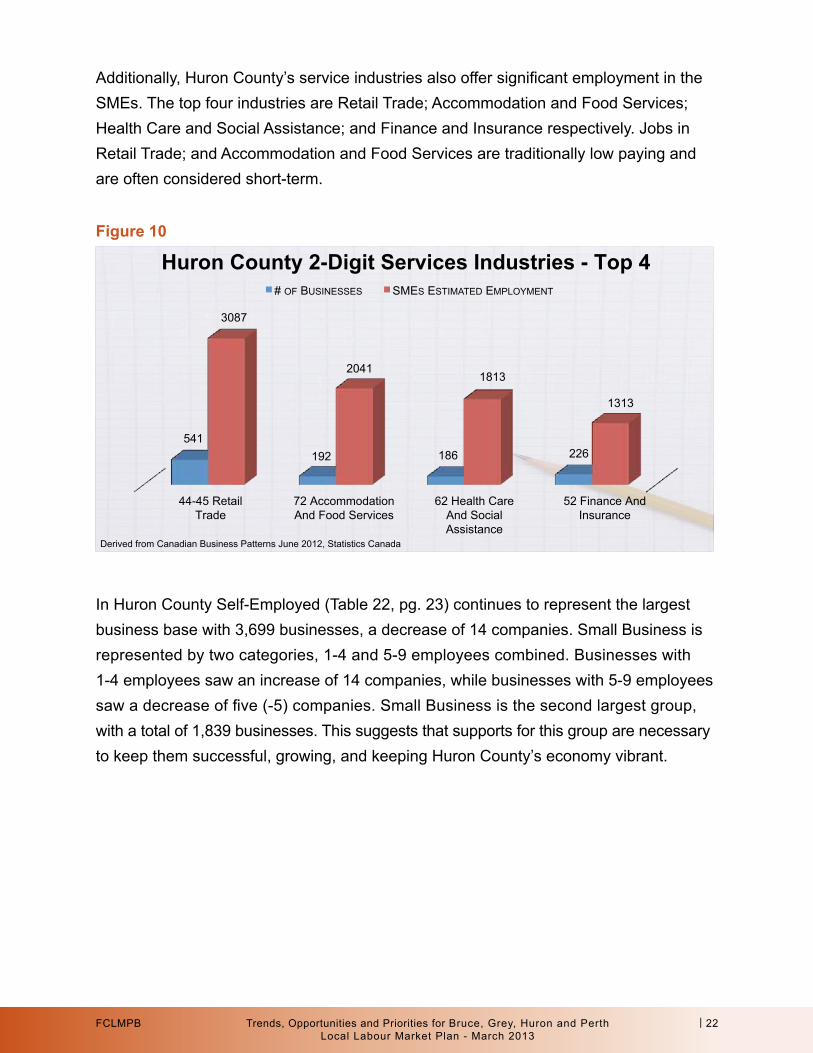
business reviewA review of Huron County’s economy revealed that the top three goods-producing industries by employment are Agriculture, forestry, fishing and hunting; Construction; and Manufacturing. These industries together provide significant employment, as estimated for SMEs employing 0-99 employees.
+ 2690 - 17 years Net-Migration:
- 1,01718 - 24 years Net-Migration:
- 68925 - 44 years Net-Migration:
+ 76445 - 64 years Net-Migration:
- 27965 + years Net-Migration:
Table 21 Migration by age Cohort: Huron County - 2006 through 2011
Source: Statistics Canada, Taxfiler
2,425 In
2,156 Out
1,202 In
2,219 Out
3,050 In
3,739 Out
2,627 In
1,863 Out
1,228 In
1,507 Out
ToTal (all age groups)
in-Migration10,532
out-Migration11,484
Net-Migration
- 952
2167
609 180
3760
2195 1824
# OF BUSINESSES SMES ESTIMATED EMPLOYMENT
Derived from Canadian Business Patterns June 2012, Statistics Canada
11 Agriculture, Forestry, Fishing And
Hunting
23 Construction 31-33 Manufacturing
541 192 186 226
3087
2041 1813
1313
# OF BUSINESSES SMES ESTIMATED EMPLOYMENT
Derived from Canadian Business Patterns June 2012, Statistics Canada
Huron County 2-Digit Services Industries - Top 4
Huron County 2-Digit Goods Producing Industries - Top 3
44-45 Retail Trade
72 Accommodation And Food Services
62 Health Care And Social Assistance
52 Finance And Insurance
figure 9
Trends, Opportunities and Priorities for Bruce, Grey, Huron and PerthLocal Labour Market Plan - March 2013
| 22FCLMPB
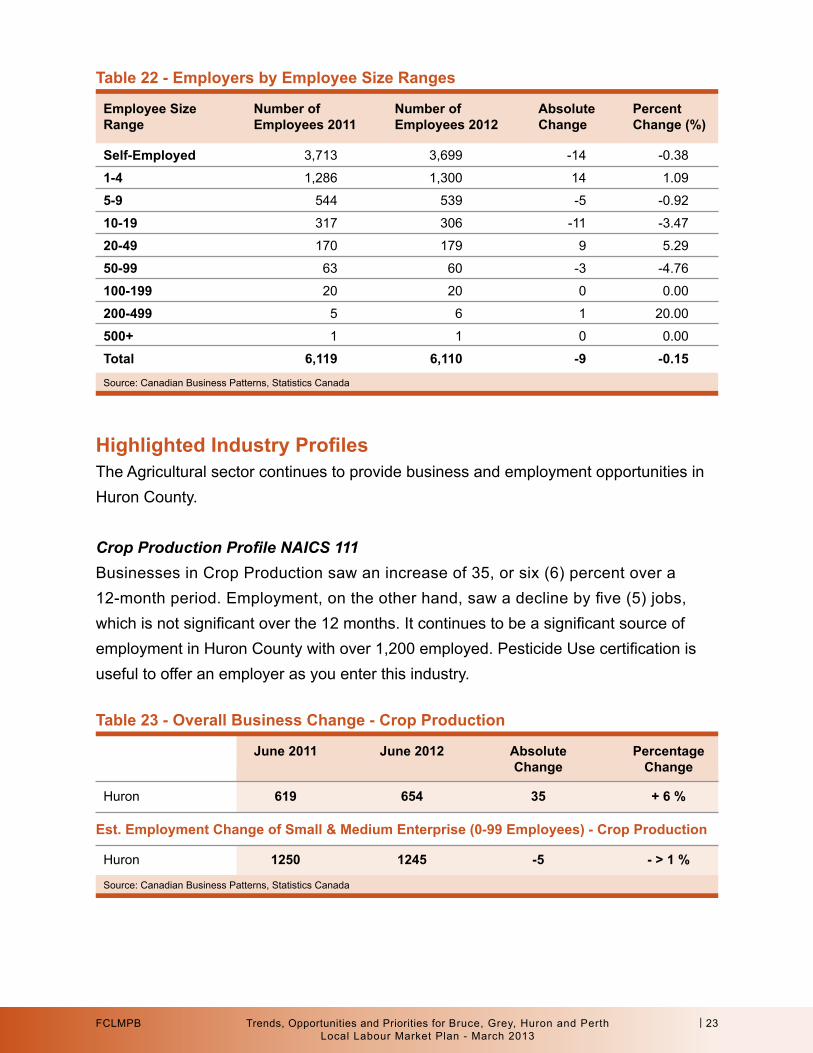
Additionally, Huron County’s service industries also offer significant employment in the SMEs. The top four industries are Retail Trade; Accommodation and Food Services; Health Care and Social Assistance; and Finance and Insurance respectively. Jobs in Retail Trade; and Accommodation and Food Services are traditionally low paying and are often considered short-term.
In Huron County Self-Employed (Table 22, pg. 23) continues to represent the largest business base with 3,699 businesses, a decrease of 14 companies. Small Business is represented by two categories, 1-4 and 5-9 employees combined. Businesses with 1-4 employees saw an increase of 14 companies, while businesses with 5-9 employees saw a decrease of five (-5) companies. Small Business is the second largest group, with a total of 1,839 businesses. This suggests that supports for this group are necessary to keep them successful, growing, and keeping Huron County’s economy vibrant.
2167
609 180
3760
2195 1824
# OF BUSINESSES SMES ESTIMATED EMPLOYMENT
Derived from Canadian Business Patterns June 2012, Statistics Canada
11 Agriculture, Forestry, Fishing And
Hunting
23 Construction 31-33 Manufacturing
541 192 186 226
3087
2041 1813
1313
# OF BUSINESSES SMES ESTIMATED EMPLOYMENT
Derived from Canadian Business Patterns June 2012, Statistics Canada
Huron County 2-Digit Services Industries - Top 4
Huron County 2-Digit Goods Producing Industries - Top 3
44-45 Retail Trade
72 Accommodation And Food Services
62 Health Care And Social Assistance
52 Finance And Insurance
figure 10
Trends, Opportunities and Priorities for Bruce, Grey, Huron and PerthLocal Labour Market Plan - March 2013
| 23FCLMPB
Highlighted Industry ProfilesThe Agricultural sector continues to provide business and employment opportunities in Huron County.
Crop Production Profile NAICS 111Businesses in Crop Production saw an increase of 35, or six (6) percent over a 12-month period. Employment, on the other hand, saw a decline by five (5) jobs, which is not significant over the 12 months. It continues to be a significant source of employment in Huron County with over 1,200 employed. Pesticide Use certification is useful to offer an employer as you enter this industry.
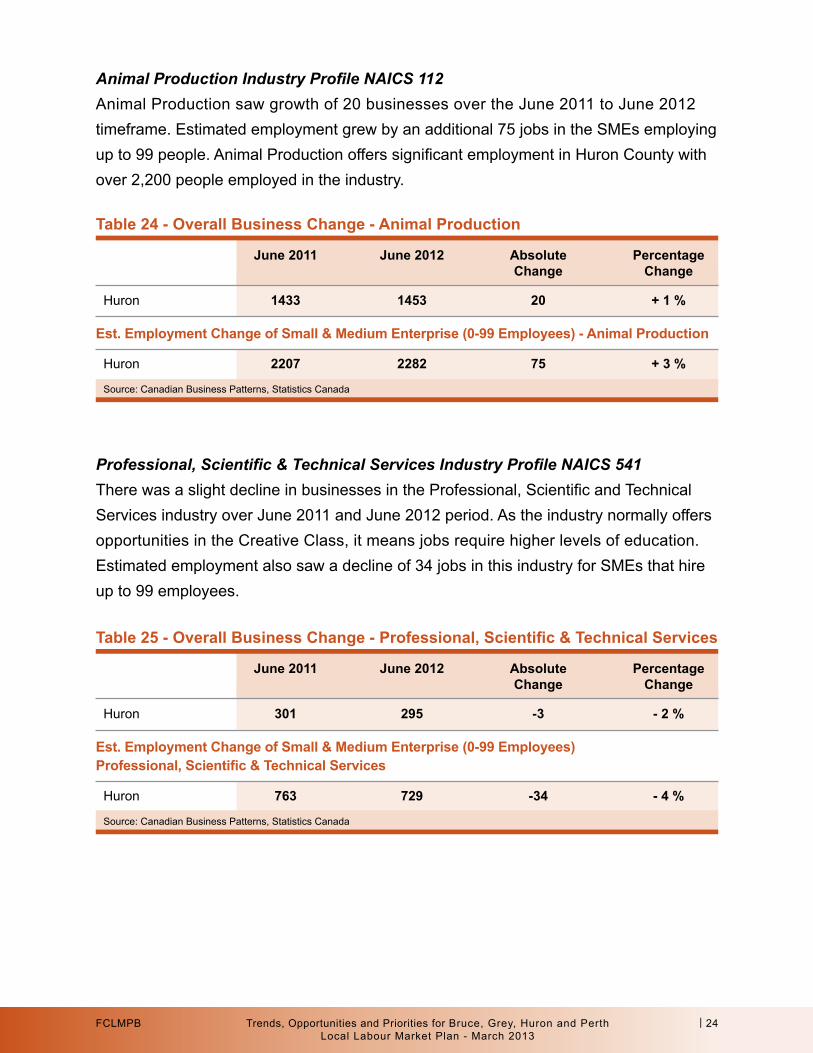
Table 22 - employers by employee size ranges
employee size number of number of absolute Percent range employees 2011 employees 2012 Change Change (%)
self-employed 3,713 3,699 -14 -0.38
1-4 1,286 1,300 14 1.09
5-9 544 539 -5 -0.92
10-19 317 306 -11 -3.47
20-49 170 179 9 5.29
50-99 63 60 -3 -4.76
100-199 20 20 0 0.00
200-499 5 6 1 20.00
500+ 1 1 0 0.00
Total 6,119 6,110 -9 -0.15Source: Canadian Business Patterns, Statistics Canada
Table 23 - overall business Change - Crop Production
est. employment Change of small & Medium enterprise (0-99 employees) - Crop Production
June 2011 June 2012 absolute Percentage Change Change
Huron 619 654 35 + 6 %
Huron 1250 1245 -5 - > 1 %
Source: Canadian Business Patterns, Statistics Canada
Trends, Opportunities and Priorities for Bruce, Grey, Huron and PerthLocal Labour Market Plan - March 2013
| 24FCLMPB
Animal Production Industry Profile NAICS 112Animal Production saw growth of 20 businesses over the June 2011 to June 2012 timeframe. Estimated employment grew by an additional 75 jobs in the SMEs employing up to 99 people. Animal Production offers significant employment in Huron County with over 2,200 people employed in the industry.
Professional, Scientific & Technical Services Industry Profile NAICS 541There was a slight decline in businesses in the Professional, Scientific and Technical Services industry over June 2011 and June 2012 period. As the industry normally offers opportunities in the Creative Class, it means jobs require higher levels of education. Estimated employment also saw a decline of 34 jobs in this industry for SMEs that hire up to 99 employees.
Table 24 - overall business Change - animal Production
est. employment Change of small & Medium enterprise (0-99 employees) - animal Production
June 2011 June 2012 absolute Percentage Change Change
Huron 1433 1453 20 + 1 %
Huron 2207 2282 75 + 3 %
Source: Canadian Business Patterns, Statistics Canada
Table 25 - Overall Business Change - Professional, Scientific & Technical Services
est. employment Change of small & Medium enterprise (0-99 employees) Professional, Scientific & Technical Services
June 2011 June 2012 absolute Percentage Change Change
Huron 301 295 -3 - 2 %
Huron 763 729 -34 - 4 %
Source: Canadian Business Patterns, Statistics Canada
Trends, Opportunities and Priorities for Bruce, Grey, Huron and PerthLocal Labour Market Plan - March 2013
| 25FCLMPB
Ambulatory Health Care Services Industry Profile NAICS 621Ambulatory Health Care Services posted a slight decline over June 2011 and June 2012. Businesses in the industry fell by two (2) in Huron County. Over the same timeframe, jobs in Small and Medium Enterprise for this industry grew slightly by 11 and offer good employment in the county. Employment in this industry requires post-secondary training.
Three industries in Health Care and Social Assistance sector were highlighted in the 2012 Local Labour Market Plan as they showed activity within the timeframe covered.
Nursing & Residential Care Facilities Industry Profile NAICS 623Nursing and Residential Care Facilities was the second industry within the Health Care and Social Assistance sector to show activity in the 2012 Local Labour Market Plan. Over June 2011 and June 2012, businesses in the industry declined by two (-2), and employment declined sharply by 161 jobs for SMEs. Industry feedback noted that the process has changed in the way Nursing departments are funded for several homes in Huron County in April 2012. This may have impacted these jobs. Jobs within this sector require post-secondary and some certificate training.
Table 26 - overall business Change - ambulatory Health Care services
est. employment Change of small & Medium enterprise (0-99 employees) ambulatory Health Care services
June 2011 June 2012 absolute Percentage Change Change
Huron 119 117 -2 - 2 %
Huron 597 608 11 + 2 %
Source: Canadian Business Patterns, Statistics Canada
Table 27 - overall business Change - nursing & residential Care facilities
est. employment Change of small & Medium enterprise (0-99 employees) nursing & residential Care facilities
June 2011 June 2012 absolute Percentage Change Change
Huron 43 41 -2 - 5 %
Huron 1091 930 -161 - 15 %
Source: Canadian Business Patterns, Statistics Canada
Trends, Opportunities and Priorities for Bruce, Grey, Huron and PerthLocal Labour Market Plan - March 2013
| 26FCLMPB
Social Assistance Industry Profile NAICS 624The third industry to be highlighted is Social Assistance. It saw a slight decrease of four (4) businesses for Huron County over June 2011 and June 2012. Estimated employment for SMEs in this industry also declined by 32 jobs. Jobs in this industry require higher levels of education, as represented by the types of occupations available, for example, Early childhood educators and assistants and Social workers.
Table 28 - overall business Change - social assistance
est. employment Change of small & Medium enterprise (0-99 employees) - social assistance
June 2011 June 2012 absolute Percentage Change Change
Huron 25 21 -4 - 16 %
Huron 234 202 -32 - 14 %
Source: Canadian Business Patterns, Statistics Canada
Trends, Opportunities and Priorities for Bruce, Grey, Huron and PerthLocal Labour Market Plan - March 2013
| 27FCLMPB
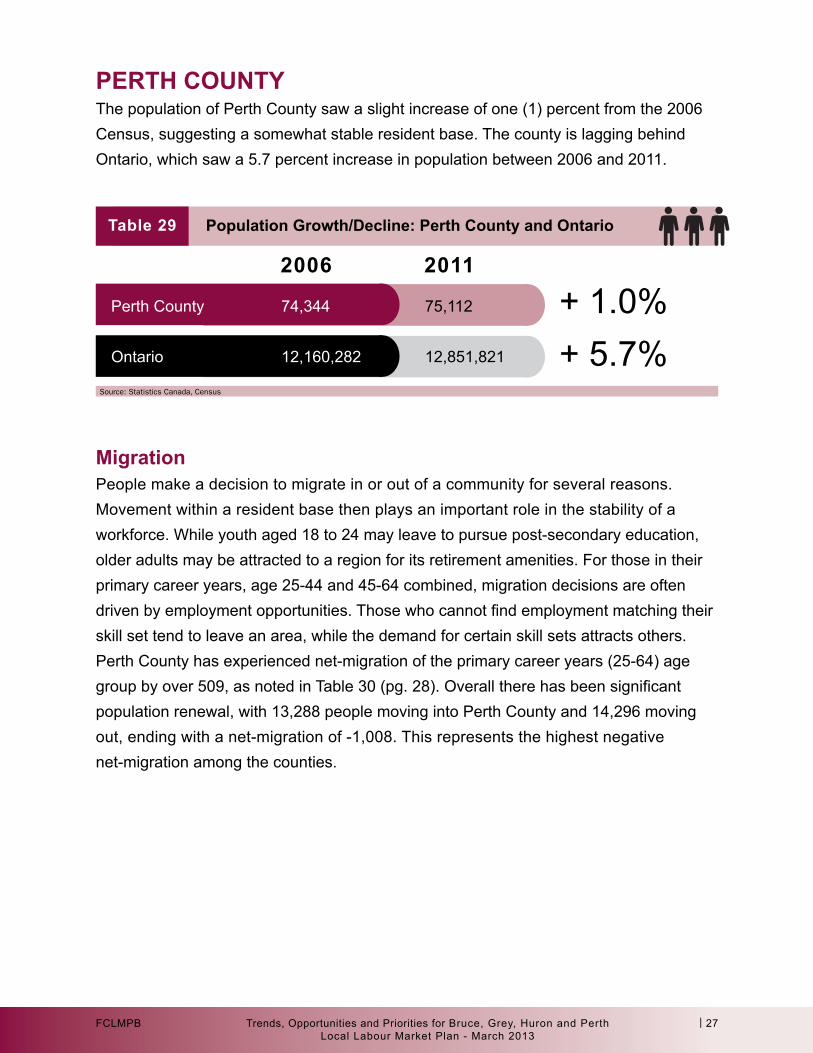
PerTH CounTyThe population of Perth County saw a slight increase of one (1) percent from the 2006 Census, suggesting a somewhat stable resident base. The county is lagging behind Ontario, which saw a 5.7 percent increase in population between 2006 and 2011.
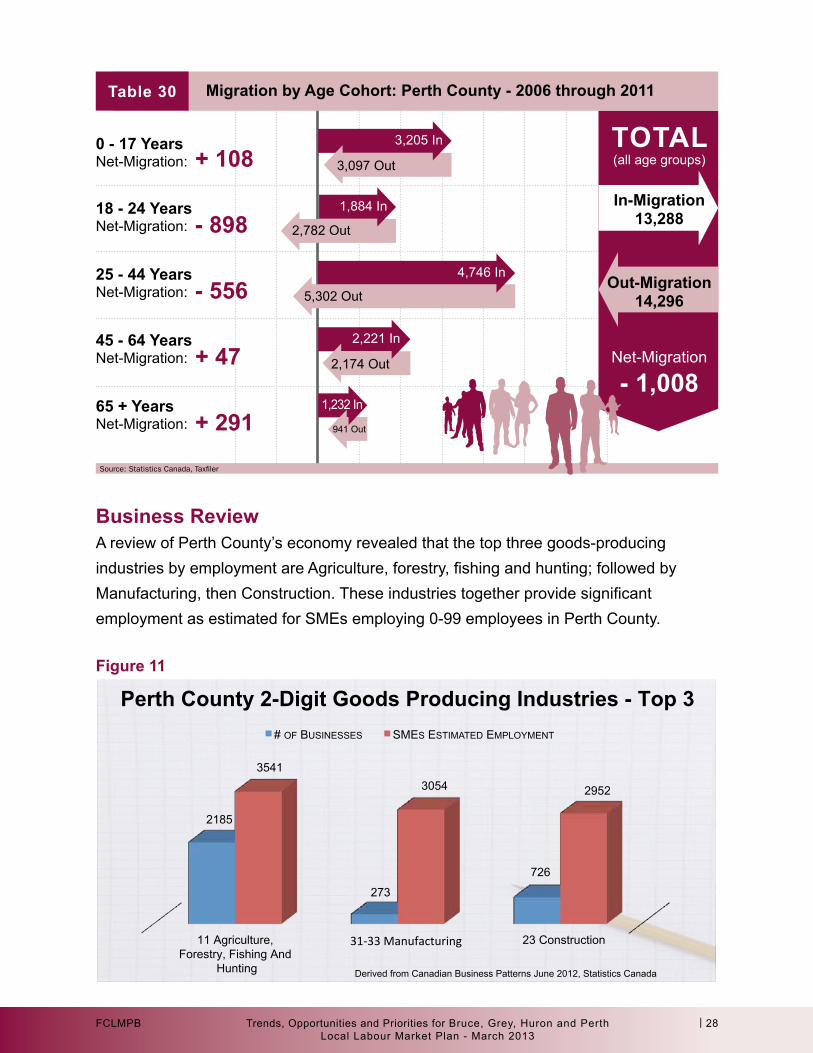
MigrationPeople make a decision to migrate in or out of a community for several reasons. Movement within a resident base then plays an important role in the stability of a workforce. While youth aged 18 to 24 may leave to pursue post-secondary education, older adults may be attracted to a region for its retirement amenities. For those in their primary career years, age 25-44 and 45-64 combined, migration decisions are often driven by employment opportunities. Those who cannot find employment matching their skill set tend to leave an area, while the demand for certain skill sets attracts others. Perth County has experienced net-migration of the primary career years (25-64) age group by over 509, as noted in Table 30 (pg. 28). Overall there has been significant population renewal, with 13,288 people moving into Perth County and 14,296 moving out, ending with a net-migration of -1,008. This represents the highest negative net-migration among the counties.
Perth County 74,344 75,112
Ontario 12,160,282 12,851,821
2006 2011
+ 1.0%+ 5.7%
Table 29 Population Growth/decline: Perth County and ontario
Source: Statistics Canada, Census
Trends, Opportunities and Priorities for Bruce, Grey, Huron and PerthLocal Labour Market Plan - March 2013
| 28FCLMPB
business reviewA review of Perth County’s economy revealed that the top three goods-producing industries by employment are Agriculture, forestry, fishing and hunting; followed by Manufacturing, then Construction. These industries together provide significant employment as estimated for SMEs employing 0-99 employees in Perth County.
+ 1080 - 17 years Net-Migration:
- 89818 - 24 years Net-Migration:
- 55625 - 44 years Net-Migration:
+ 4745 - 64 years Net-Migration:
+ 29165 + years Net-Migration:
Table 30 Migration by age Cohort: Perth County - 2006 through 2011
Source: Statistics Canada, Taxfiler
1,884 In
2,782 Out
4,746 In
5,302 Out
2,221 In
2,174 Out
1,232 In
941 Out
ToTal (all age groups)
in-Migration13,288
out-Migration14,296
Net-Migration
- 1,008
3,205 In
3,097 Out
2185
273
726
3541 3054 2952
# OF BUSINESSES SMES ESTIMATED EMPLOYMENT
Derived from Canadian Business Patterns June 2012, Statistics Canada
11 Agriculture, Forestry, Fishing And
Hunting
31-‐33 Manufacturing 23 Construction
567 241 298 319
3895
2800
2071 1795
# OF BUISNESSES SMES ESTIMATED EMPLOYMENT
Derived from Canadian Business Patterns June 2012, Statistics Canada
Perth County 2-Digit Services Industries - Top 4
44-45 Retail Trade
72 Accommodation And Food Services
62 Health Care And Social Assistance
52 Finance And Insurance
Perth County 2-Digit Goods Producing Industries - Top 3 figure 11
Trends, Opportunities and Priorities for Bruce, Grey, Huron and PerthLocal Labour Market Plan - March 2013
| 29FCLMPB
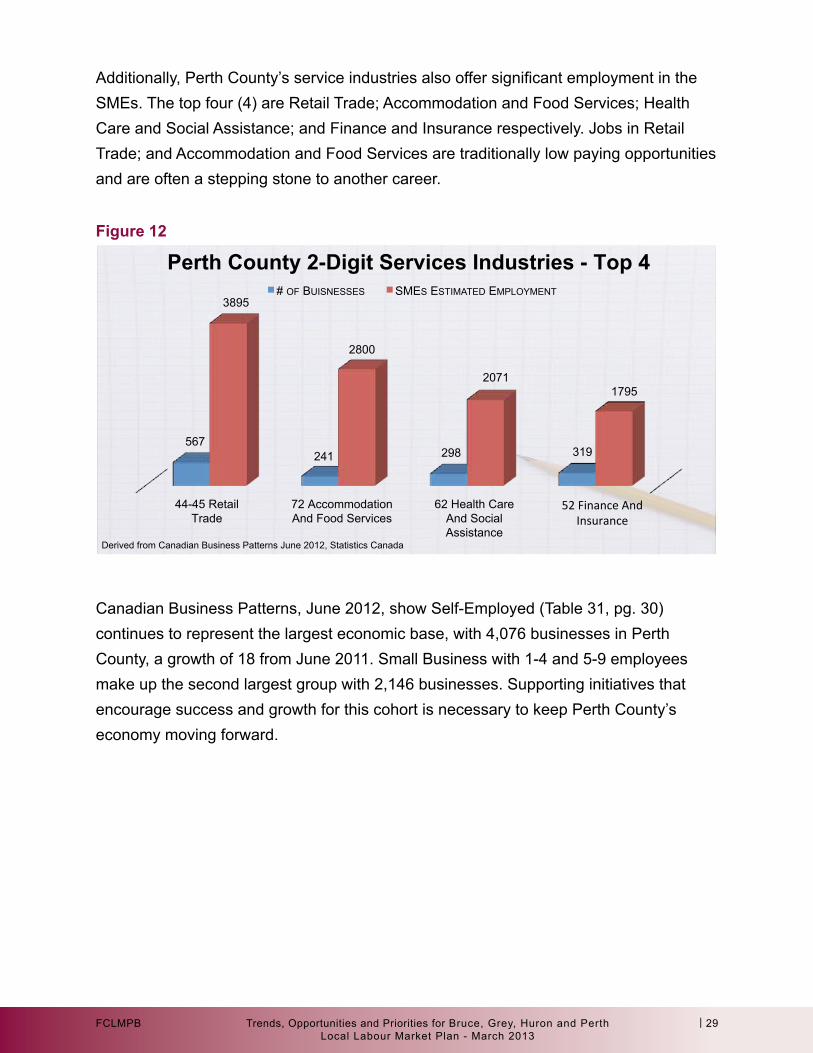
Additionally, Perth County’s service industries also offer significant employment in the SMEs. The top four (4) are Retail Trade; Accommodation and Food Services; Health Care and Social Assistance; and Finance and Insurance respectively. Jobs in Retail Trade; and Accommodation and Food Services are traditionally low paying opportunities and are often a stepping stone to another career.
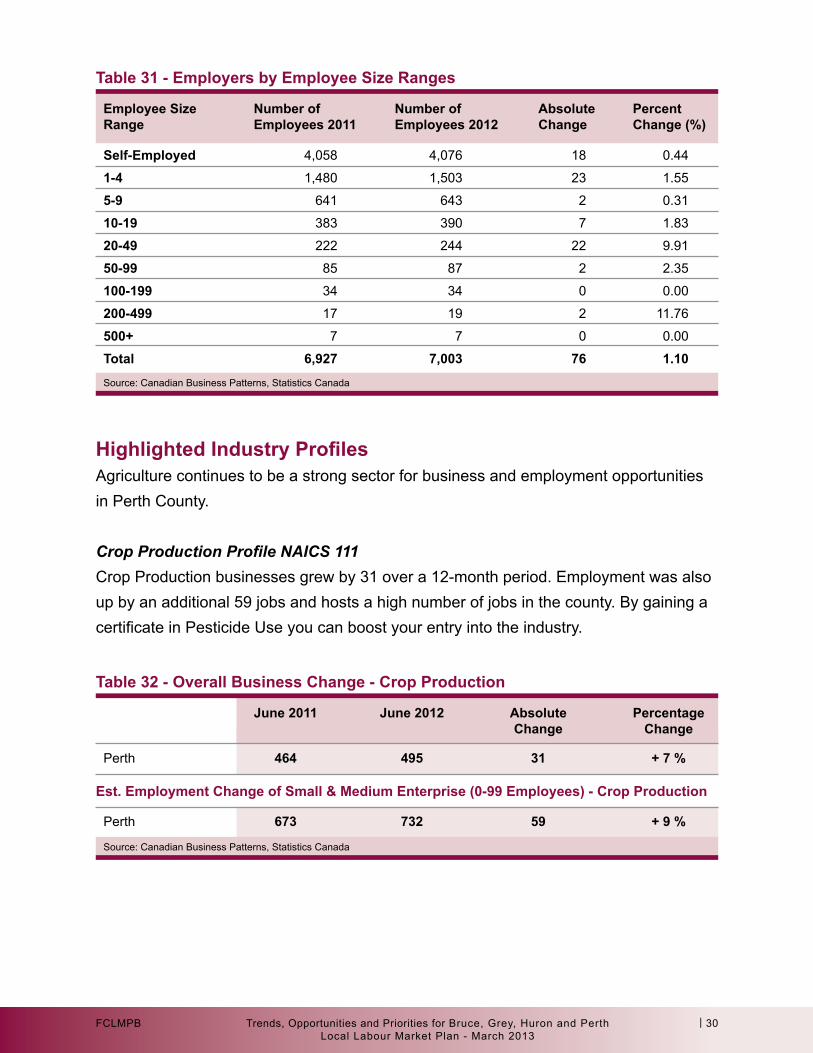
Canadian Business Patterns, June 2012, show Self-Employed (Table 31, pg. 30) continues to represent the largest economic base, with 4,076 businesses in Perth County, a growth of 18 from June 2011. Small Business with 1-4 and 5-9 employees make up the second largest group with 2,146 businesses. Supporting initiatives that encourage success and growth for this cohort is necessary to keep Perth County’s economy moving forward.
2185
273
726
3541 3054 2952
# OF BUSINESSES SMES ESTIMATED EMPLOYMENT
Derived from Canadian Business Patterns June 2012, Statistics Canada
11 Agriculture, Forestry, Fishing And
Hunting
31-‐33 Manufacturing 23 Construction
567 241 298 319
3895
2800
2071 1795
# OF BUISNESSES SMES ESTIMATED EMPLOYMENT
Derived from Canadian Business Patterns June 2012, Statistics Canada
Perth County 2-Digit Services Industries - Top 4
44-45 Retail Trade
72 Accommodation And Food Services
62 Health Care And Social Assistance
52 Finance And Insurance
Perth County 2-Digit Goods Producing Industries - Top 3
figure 12
Trends, Opportunities and Priorities for Bruce, Grey, Huron and PerthLocal Labour Market Plan - March 2013
| 30FCLMPB
Highlighted Industry ProfilesAgriculture continues to be a strong sector for business and employment opportunities in Perth County.
Crop Production Profile NAICS 111Crop Production businesses grew by 31 over a 12-month period. Employment was also up by an additional 59 jobs and hosts a high number of jobs in the county. By gaining a certificate in Pesticide Use you can boost your entry into the industry.
Table 31 - employers by employee size ranges
employee size number of number of absolute Percent range employees 2011 employees 2012 Change Change (%)
self-employed 4,058 4,076 18 0.44
1-4 1,480 1,503 23 1.55
5-9 641 643 2 0.31
10-19 383 390 7 1.83
20-49 222 244 22 9.91
50-99 85 87 2 2.35
100-199 34 34 0 0.00
200-499 17 19 2 11.76
500+ 7 7 0 0.00
Total 6,927 7,003 76 1.10Source: Canadian Business Patterns, Statistics Canada
Table 32 - overall business Change - Crop Production
est. employment Change of small & Medium enterprise (0-99 employees) - Crop Production
June 2011 June 2012 absolute Percentage Change Change
Perth 464 495 31 + 7 %
Perth 673 732 59 + 9 %
Source: Canadian Business Patterns, Statistics Canada
Trends, Opportunities and Priorities for Bruce, Grey, Huron and PerthLocal Labour Market Plan - March 2013
| 31FCLMPB
Animal Production Industry Profile NAICS 112Businesses in Animal Production saw a decrease of 15 over a 12-month period, June 2011 to June 2012. Estimated employment stayed relatively stable with 17 additional jobs. Animal Production offers substantial employment in Perth County, with over 2,600 people employed in the industry.
Professional, Scientific & Technical Services Industry Profile NAICS 541Professional, Scientific and Technical Services businesses in Perth County experienced a slight decline over June 2011 and June 2012 period, with seven (7) less businesses. As the industry normally offers opportunities in the Creative Class, it means jobs require higher levels of education. Estimated employment also saw a slight decrease of 13 jobs in this industry for SMEs that hire up to 99 employees. This industry offers a high level of employment in Perth County.
Table 33 - overall business Change - animal Production
est. employment Change of small & Medium enterprise (0-99 employees) - animal Production
June 2011 June 2012 absolute Percentage Change Change
Perth 1628 1613 -15 - 1 %
Perth 2640 2657 17 + 1 %
Source: Canadian Business Patterns, Statistics Canada
Table 34 - Overall Business Change - Professional, Scientific & Technical Services
est. employment Change of small & Medium enterprise (0-99 employees) Professional, Scientific & Technical Services
June 2011 June 2012 absolute Percentage Change Change
Perth 390 383 -7 - 2 %
Perth 1267 1254 -13 - 1 %
Source: Canadian Business Patterns, Statistics Canada
Trends, Opportunities and Priorities for Bruce, Grey, Huron and PerthLocal Labour Market Plan - March 2013
| 32FCLMPB
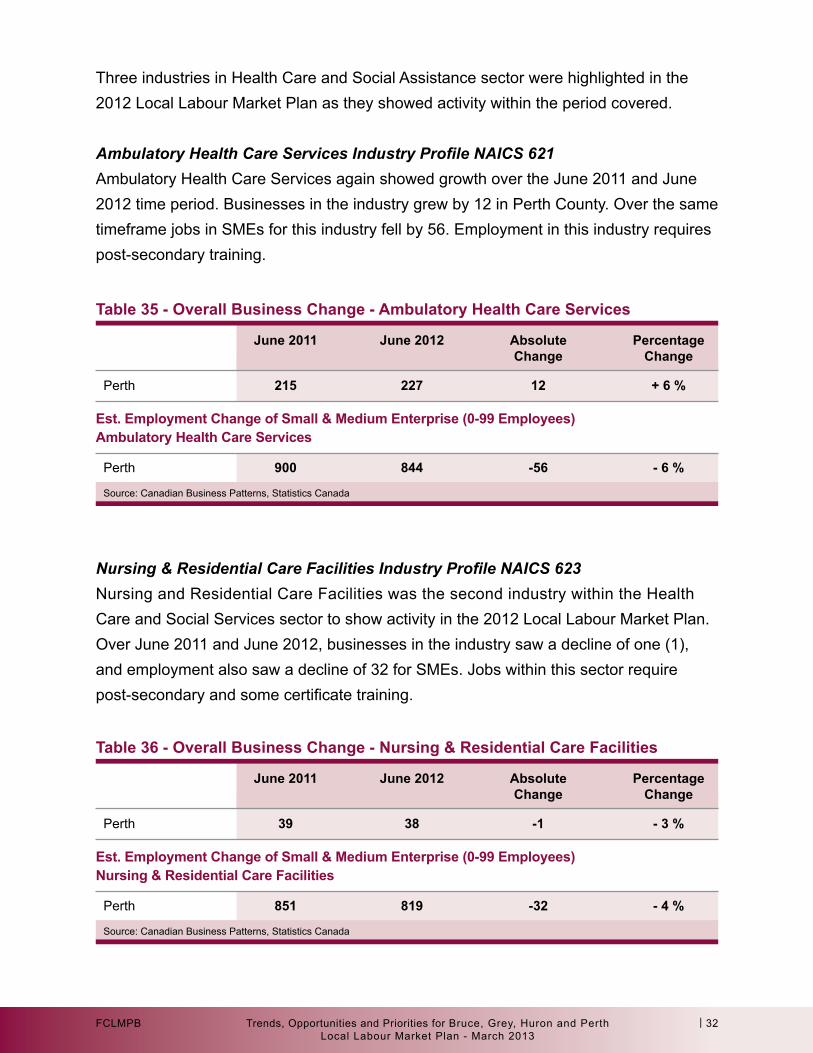
Three industries in Health Care and Social Assistance sector were highlighted in the 2012 Local Labour Market Plan as they showed activity within the period covered.
Ambulatory Health Care Services Industry Profile NAICS 621Ambulatory Health Care Services again showed growth over the June 2011 and June 2012 time period. Businesses in the industry grew by 12 in Perth County. Over the same timeframe jobs in SMEs for this industry fell by 56. Employment in this industry requires post-secondary training.
Nursing & Residential Care Facilities Industry Profile NAICS 623Nursing and Residential Care Facilities was the second industry within the Health Care and Social Services sector to show activity in the 2012 Local Labour Market Plan. Over June 2011 and June 2012, businesses in the industry saw a decline of one (1), and employment also saw a decline of 32 for SMEs. Jobs within this sector require post-secondary and some certificate training.
Table 35 - overall business Change - ambulatory Health Care services
Table 36 - overall business Change - nursing & residential Care facilities
est. employment Change of small & Medium enterprise (0-99 employees) ambulatory Health Care services
est. employment Change of small & Medium enterprise (0-99 employees) nursing & residential Care facilities
June 2011 June 2012 absolute Percentage Change Change
Perth 215 227 12 + 6 %
June 2011 June 2012 absolute Percentage Change Change
Perth 39 38 -1 - 3 %
Perth 900 844 -56 - 6 %
Perth 851 819 -32 - 4 %
Source: Canadian Business Patterns, Statistics Canada
Source: Canadian Business Patterns, Statistics Canada
Trends, Opportunities and Priorities for Bruce, Grey, Huron and PerthLocal Labour Market Plan - March 2013
| 33FCLMPB
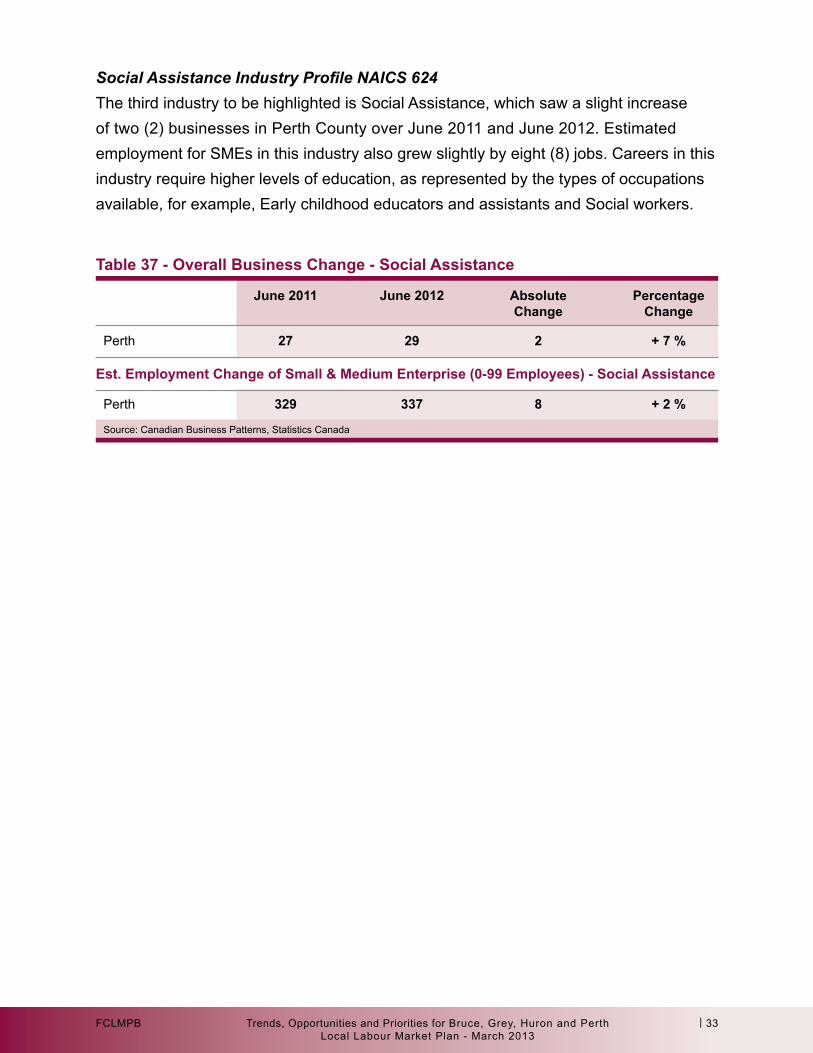
Social Assistance Industry Profile NAICS 624The third industry to be highlighted is Social Assistance, which saw a slight increase of two (2) businesses in Perth County over June 2011 and June 2012. Estimated employment for SMEs in this industry also grew slightly by eight (8) jobs. Careers in this industry require higher levels of education, as represented by the types of occupations available, for example, Early childhood educators and assistants and Social workers.
Table 37 - overall business Change - social assistance
est. employment Change of small & Medium enterprise (0-99 employees) - social assistance
June 2011 June 2012 absolute Percentage Change Change
Perth 27 29 2 + 7 %
Perth 329 337 8 + 2 %
Source: Canadian Business Patterns, Statistics Canada
Trends, Opportunities and Priorities for Bruce, Grey, Huron and PerthLocal Labour Market Plan - March 2013
| 34FCLMPB
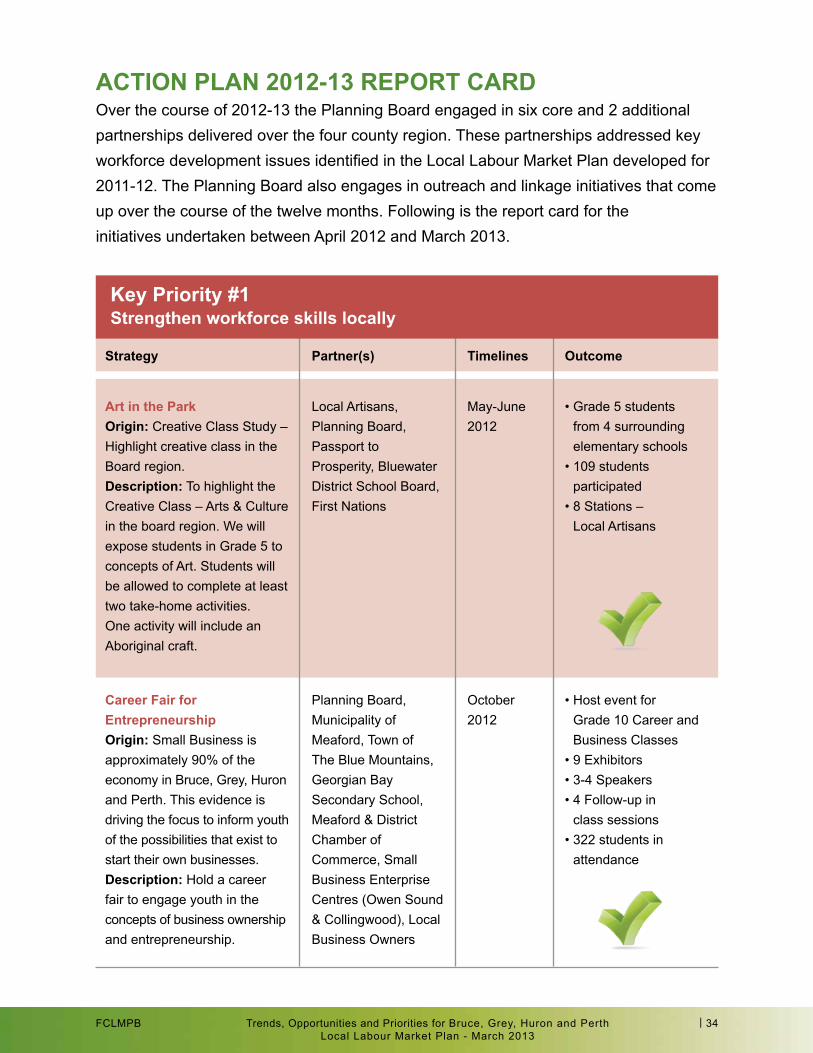
aCTion Plan 2012-13 rePorT CardOver the course of 2012-13 the Planning Board engaged in six core and 2 additional partnerships delivered over the four county region. These partnerships addressed key workforce development issues identified in the Local Labour Market Plan developed for 2011-12. The Planning Board also engages in outreach and linkage initiatives that come up over the course of the twelve months. Following is the report card for the initiatives undertaken between April 2012 and March 2013.
strategy
art in the Parkorigin: Creative Class Study – Highlight creative class in the Board region.description: To highlight the Creative Class – Arts & Culture in the board region. We will expose students in Grade 5 to concepts of Art. Students will be allowed to complete at least two take-home activities. One activity will include an Aboriginal craft.
Career fair for entrepreneurshiporigin: Small Business is approximately 90% of the economy in Bruce, Grey, Huron and Perth. This evidence is driving the focus to inform youth of the possibilities that exist to start their own businesses.description: Hold a career fair to engage youth in the concepts of business ownership and entrepreneurship.
Partner(s)
Local Artisans, Planning Board, Passport to Prosperity, Bluewater District School Board, First Nations
Planning Board, Municipality of Meaford, Town of The Blue Mountains, Georgian Bay Secondary School, Meaford & District Chamber of Commerce, Small Business Enterprise Centres (Owen Sound & Collingwood), Local Business Owners
Timelines
May-June 2012
October 2012
outcome
• Grade 5 students from 4 surrounding elementary schools
• 109 students participated
• 8 Stations – Local Artisans
• Host event for Grade 10 Career and Business Classes
• 9 Exhibitors• 3-4 Speakers• 4 Follow-up in
class sessions• 322 students in
attendance
key Priority #1strengthen workforce skills locally
Trends, Opportunities and Priorities for Bruce, Grey, Huron and PerthLocal Labour Market Plan - March 2013
| 35FCLMPB
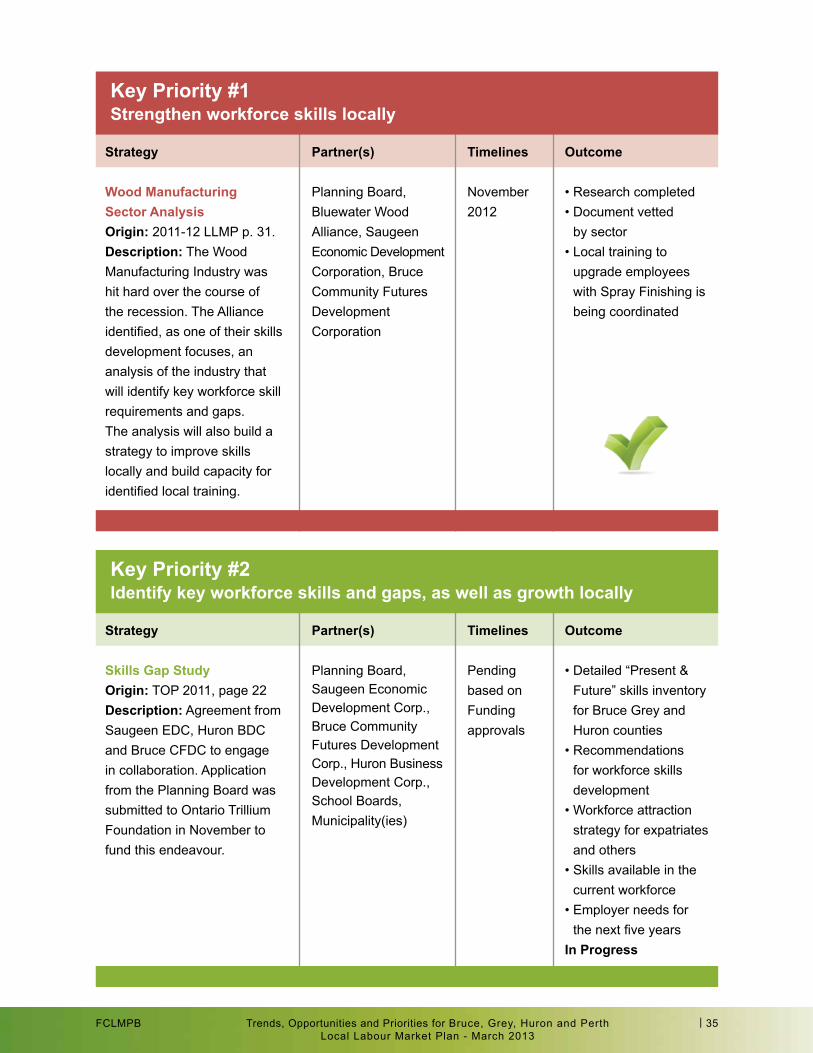
strategy
wood Manufacturing sector analysisorigin: 2011-12 LLMP p. 31.description: The Wood Manufacturing Industry was hit hard over the course of the recession. The Alliance identified, as one of their skills development focuses, an analysis of the industry that will identify key workforce skill requirements and gaps. The analysis will also build a strategy to improve skills locally and build capacity for identified local training.
strategy
skills Gap studyorigin: TOP 2011, page 22description: Agreement from Saugeen EDC, Huron BDC and Bruce CFDC to engage in collaboration. Application from the Planning Board was submitted to Ontario Trillium Foundation in November to fund this endeavour.
Partner(s)
Planning Board, Bluewater Wood Alliance, Saugeen Economic Development Corporation, Bruce Community Futures Development Corporation
Partner(s)
Planning Board, Saugeen Economic Development Corp., Bruce Community Futures Development Corp., Huron Business Development Corp., School Boards, Municipality(ies)
Timelines
November 2012
Timelines
Pending based on Funding approvals
outcome
• Research completed• Document vetted
by sector• Local training to
upgrade employees with Spray Finishing is being coordinated
outcome
• Detailed “Present & Future” skills inventory for Bruce Grey and Huron counties
• Recommendations for workforce skills development
• Workforce attraction strategy for expatriates and others
• Skills available in the current workforce
• Employer needs for the next five years
in Progress
key Priority #1strengthen workforce skills locally
key Priority #2identify key workforce skills and gaps, as well as growth locally
Trends, Opportunities and Priorities for Bruce, Grey, Huron and PerthLocal Labour Market Plan - March 2013
| 36FCLMPB
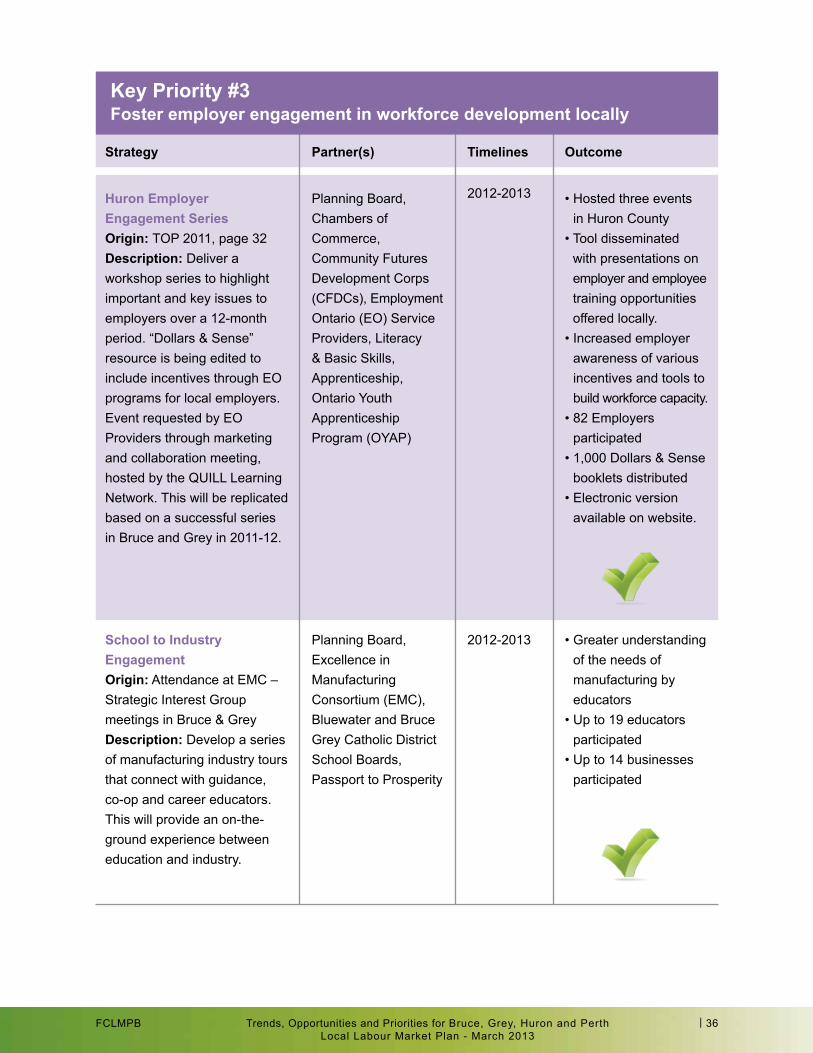
strategy
Huron employer engagement seriesorigin: TOP 2011, page 32description: Deliver a workshop series to highlight important and key issues to employers over a 12-month period. “Dollars & Sense” resource is being edited to include incentives through EO programs for local employers. Event requested by EO Providers through marketing and collaboration meeting, hosted by the QUILL Learning Network. This will be replicated based on a successful series in Bruce and Grey in 2011-12.
school to industry engagementorigin: Attendance at EMC – Strategic Interest Group meetings in Bruce & Greydescription: Develop a series of manufacturing industry tours that connect with guidance, co-op and career educators. This will provide an on-the-ground experience between education and industry.
Partner(s)
Planning Board, Chambers of Commerce, Community Futures Development Corps (CFDCs), Employment Ontario (EO) Service Providers, Literacy & Basic Skills, Apprenticeship, Ontario Youth Apprenticeship Program (OYAP)
Planning Board, Excellence in Manufacturing Consortium (EMC), Bluewater and Bruce Grey Catholic District School Boards, Passport to Prosperity
Timelines
2012-2013
2012-2013
outcome
• Hosted three events in Huron County
• Tool disseminated with presentations on employer and employee training opportunities offered locally.
• Increased employer awareness of various incentives and tools to build workforce capacity.
• 82 Employers participated
• 1,000 Dollars & Sense booklets distributed
• Electronic version available on website.
• Greater understanding of the needs of manufacturing by educators
• Up to 19 educators participated
• Up to 14 businesses participated
key Priority #3foster employer engagement in workforce development locally
Trends, Opportunities and Priorities for Bruce, Grey, Huron and PerthLocal Labour Market Plan - March 2013
| 37FCLMPB
strategy
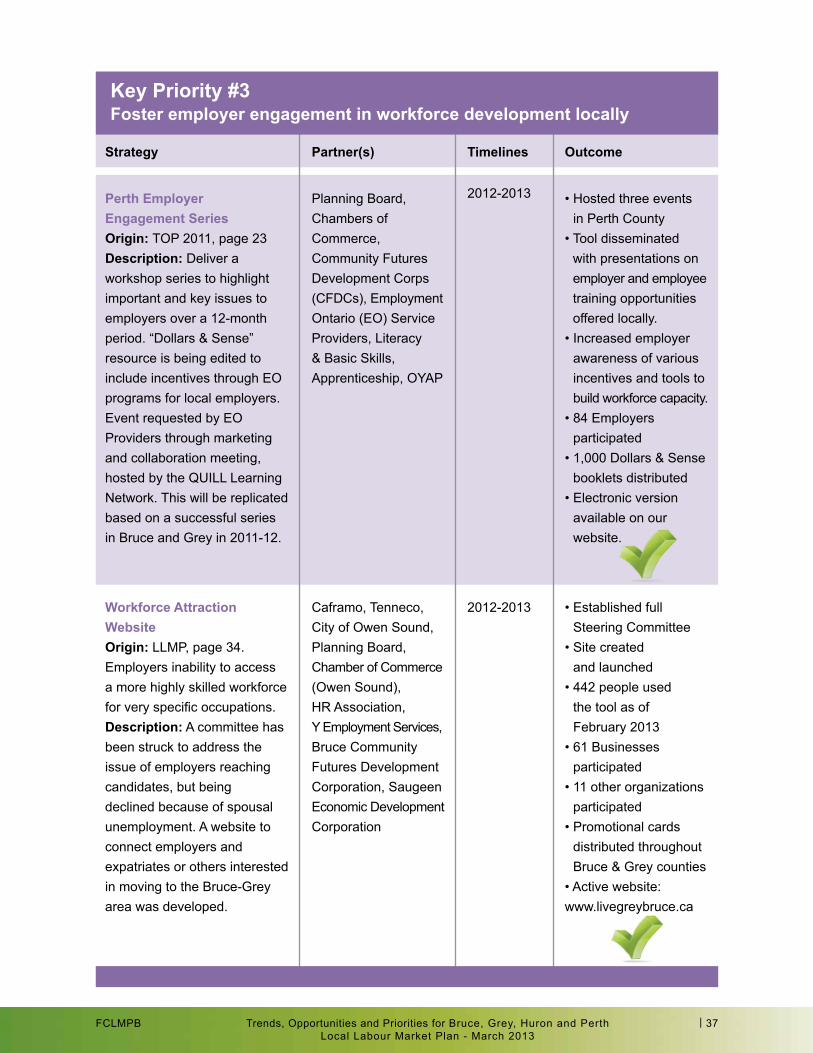
Perth employer engagement seriesorigin: TOP 2011, page 23description: Deliver a workshop series to highlight important and key issues to employers over a 12-month period. “Dollars & Sense” resource is being edited to include incentives through EO programs for local employers. Event requested by EO Providers through marketing and collaboration meeting, hosted by the QUILL Learning Network. This will be replicated based on a successful series in Bruce and Grey in 2011-12.
workforce attraction websiteorigin: LLMP, page 34. Employers inability to access a more highly skilled workforce for very specific occupations.description: A committee has been struck to address the issue of employers reaching candidates, but being declined because of spousal unemployment. A website to connect employers and expatriates or others interested in moving to the Bruce-Grey area was developed.
Partner(s)
Planning Board, Chambers of Commerce, Community Futures Development Corps (CFDCs), Employment Ontario (EO) Service Providers, Literacy & Basic Skills, Apprenticeship, OYAP
Caframo, Tenneco, City of Owen Sound, Planning Board, Chamber of Commerce (Owen Sound), HR Association, Y Employment Services, Bruce Community Futures Development Corporation, Saugeen Economic Development Corporation
Timelines
2012-2013
2012-2013
outcome
• Hosted three events in Perth County
• Tool disseminated with presentations on employer and employee training opportunities offered locally.
• Increased employer awareness of various incentives and tools to build workforce capacity.
• 84 Employers participated
• 1,000 Dollars & Sense booklets distributed
• Electronic version available on our website.
• Established full Steering Committee
• Site created and launched
• 442 people used the tool as of February 2013
• 61 Businesses participated
• 11 other organizations participated
• Promotional cards distributed throughout Bruce & Grey counties
• Active website:www.livegreybruce.ca
key Priority #3foster employer engagement in workforce development locally
Trends, Opportunities and Priorities for Bruce, Grey, Huron and PerthLocal Labour Market Plan - March 2013
| 38FCLMPB
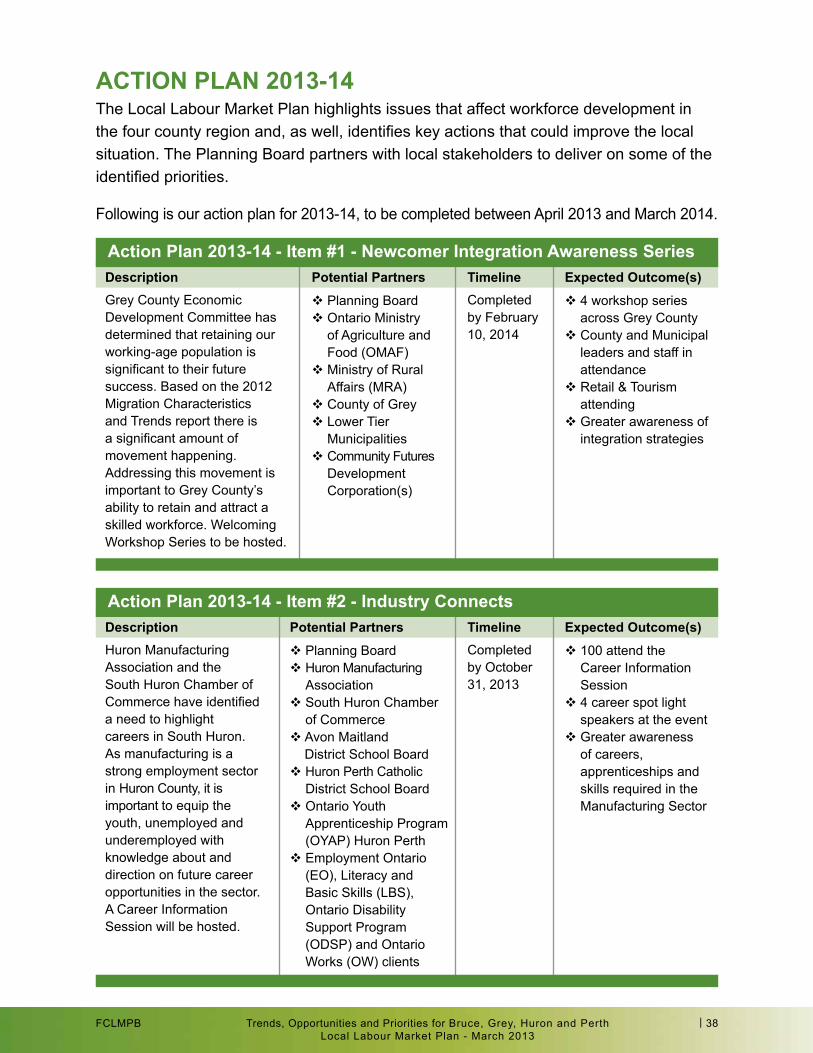
aCTion Plan 2013-14The Local Labour Market Plan highlights issues that affect workforce development in the four county region and, as well, identifies key actions that could improve the local situation. The Planning Board partners with local stakeholders to deliver on some of the identified priorities.
Following is our action plan for 2013-14, to be completed between April 2013 and March 2014.
descriptionGrey County Economic Development Committee has determined that retaining our working-age population is significant to their future success. Based on the 2012 Migration Characteristics and Trends report there is a significant amount of movement happening. Addressing this movement is important to Grey County’s ability to retain and attract a skilled workforce. Welcoming Workshop Series to be hosted.
Potential Partners
Planning Board Ontario Ministry
of Agriculture and Food (OMAF)
Ministry of Rural Affairs (MRA)
County of Grey Lower Tier
Municipalities Community Futures
Development Corporation(s)
TimelineCompleted by February 10, 2014
expected outcome(s)
4 workshop series across Grey County
County and Municipal leaders and staff in attendance
Retail & Tourism attending
Greater awareness of integration strategies
action Plan 2013-14 - item #1 - newcomer integration awareness series
descriptionHuron Manufacturing Association and the South Huron Chamber of Commerce have identified a need to highlight careers in South Huron. As manufacturing is a strong employment sector in Huron County, it is important to equip the youth, unemployed and underemployed with knowledge about and direction on future career opportunities in the sector. A Career Information Session will be hosted.
Potential Partners
Planning Board Huron Manufacturing
Association South Huron Chamber
of Commerce Avon Maitland
District School Board Huron Perth Catholic
District School Board Ontario Youth
Apprenticeship Program (OYAP) Huron Perth
Employment Ontario (EO), Literacy and Basic Skills (LBS), Ontario Disability Support Program (ODSP) and Ontario Works (OW) clients
TimelineCompleted by October 31, 2013
expected outcome(s)
100 attend the Career Information Session
4 career spot light speakers at the event
Greater awareness of careers, apprenticeships and skills required in the Manufacturing Sector
action Plan 2013-14 - item #2 - industry Connects
Trends, Opportunities and Priorities for Bruce, Grey, Huron and PerthLocal Labour Market Plan - March 2013
| 39FCLMPB
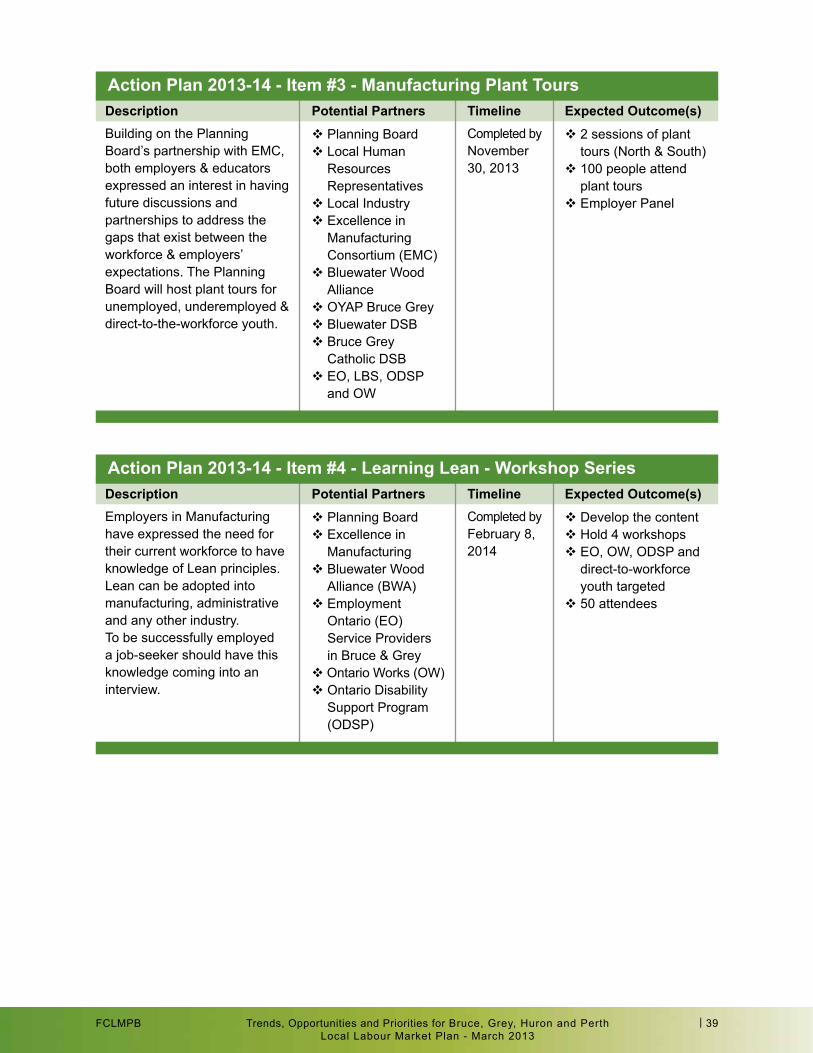
description
description
Building on the Planning Board’s partnership with EMC, both employers & educators expressed an interest in having future discussions and partnerships to address the gaps that exist between the workforce & employers’ expectations. The Planning Board will host plant tours for unemployed, underemployed & direct-to-the-workforce youth.
Employers in Manufacturing have expressed the need for their current workforce to have knowledge of Lean principles. Lean can be adopted into manufacturing, administrative and any other industry. To be successfully employed a job-seeker should have this knowledge coming into an interview.
Potential Partners
Potential Partners
Planning Board Local Human
Resources Representatives
Local Industry Excellence in
Manufacturing Consortium (EMC)
Bluewater Wood Alliance
OYAP Bruce Grey Bluewater DSB Bruce Grey
Catholic DSB EO, LBS, ODSP
and OW
Planning Board Excellence in
Manufacturing Bluewater Wood
Alliance (BWA) Employment
Ontario (EO) Service Providers in Bruce & Grey
Ontario Works (OW) Ontario Disability
Support Program (ODSP)
Timeline
Timeline
Completed by November 30, 2013
Completed by February 8, 2014
expected outcome(s)
expected outcome(s)
2 sessions of plant tours (North & South)
100 people attend plant tours
Employer Panel
Develop the content Hold 4 workshops EO, OW, ODSP and
direct-to-workforce youth targeted
50 attendees
action Plan 2013-14 - item #3 - Manufacturing Plant Tours
action Plan 2013-14 - item #4 - learning lean - workshop series
Trends, Opportunities and Priorities for Bruce, Grey, Huron and PerthLocal Labour Market Plan - March 2013
| 40FCLMPB
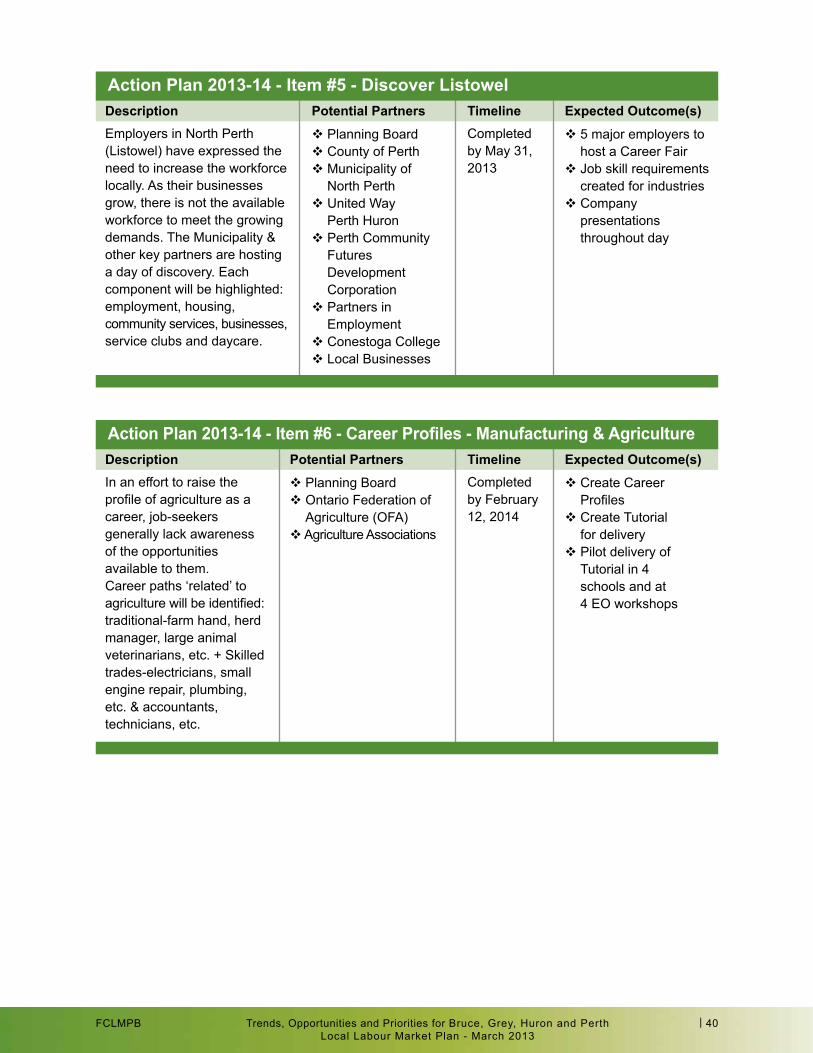
descriptionEmployers in North Perth (Listowel) have expressed the need to increase the workforce locally. As their businesses grow, there is not the available workforce to meet the growing demands. The Municipality & other key partners are hosting a day of discovery. Each component will be highlighted: employment, housing, community services, businesses, service clubs and daycare.
Potential Partners
Planning Board County of Perth Municipality of
North Perth United Way
Perth Huron Perth Community
Futures Development Corporation
Partners in Employment
Conestoga College Local Businesses
TimelineCompleted by May 31, 2013
expected outcome(s)
5 major employers to host a Career Fair
Job skill requirements created for industries
Company presentations throughout day
action Plan 2013-14 - item #5 - discover listowel
descriptionIn an effort to raise the profile of agriculture as a career, job-seekers generally lack awareness of the opportunities available to them. Career paths ‘related’ to agriculture will be identified: traditional-farm hand, herd manager, large animal veterinarians, etc. + Skilled trades-electricians, small engine repair, plumbing, etc. & accountants, technicians, etc.
Potential Partners
Planning Board Ontario Federation of
Agriculture (OFA) Agriculture Associations
TimelineCompleted by February 12, 2014
expected outcome(s)
Create Career Profiles
Create Tutorial for delivery
Pilot delivery of Tutorial in 4 schools and at 4 EO workshops
Action Plan 2013-14 - Item #6 - Career Profiles - Manufacturing & Agriculture

| 41FCLMPB
Local Labour Market PlanMarch 2013
Four County Labour Market PLanning boardPo box 1078, 111 Jackson Street, Suite 1Walkerton, on n0g 2V0 tel: 519-881-2725Fax: 519-881-3661toll Free: 888-774-1468executivedirector@planningboard.cawww.planningboard.ca
this employment ontario project is funded by the ontario government.
a proud member of
Champions of Ontario’s Local Labour Market Solutions
Trends, Opportunities and Priorities For bruCe, grey, Huron, PertH
LocalLabourPlan_4C_g_final.indd 1 11/26/12 5:33:49 PM