Embed Size (px)
Citation preview
Trends, Opportunities, and Challenges for Tall Wind Turbine and Tower Technologies
Eric Lantz, Owen Roberts, and Katherine Dykes
May 22, 2017 Presented at the American Wind Energy Association Wind Power 2017 Conference in Anaheim, California NREL/PR-6A20-68732
2
• The Value of Wind Innovation
• Wind Innovation and Tall Tower Potential
• Tall Tower Status in the United States (and Germany)
• Tower Innovation Alternatives and Pathways
• Key Conclusions
Overview
3
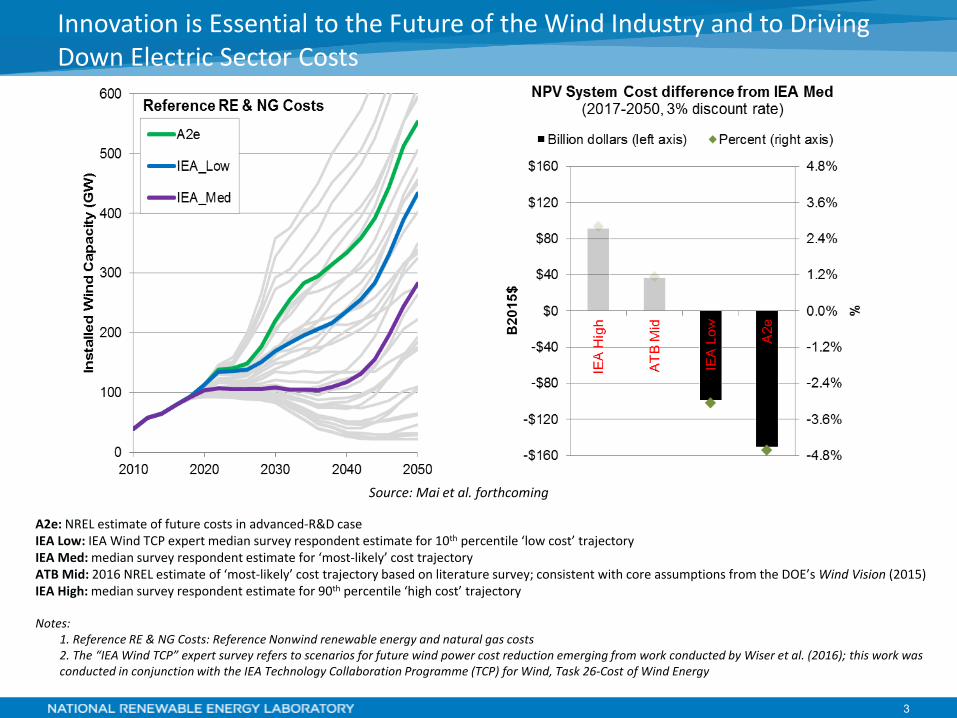
Innovation is Essential to the Future of the Wind Industry and to Driving Down Electric Sector Costs
A2e: NREL estimate of future costs in advanced-R&D case IEA Low: IEA Wind TCP expert median survey respondent estimate for 10th percentile ‘low cost’ trajectory IEA Med: median survey respondent estimate for ‘most-likely’ cost trajectory ATB Mid: 2016 NREL estimate of ‘most-likely’ cost trajectory based on literature survey; consistent with core assumptions from the DOE’s Wind Vision (2015) IEA High: median survey respondent estimate for 90th percentile ‘high cost’ trajectory Notes: 1. Reference RE & NG Costs: Reference Nonwind renewable energy and natural gas costs 2. The “IEA Wind TCP” expert survey refers to scenarios for future wind power cost reduction emerging from work conducted by Wiser et al. (2016); this work was
conducted in conjunction with the IEA Technology Collaboration Programme (TCP) for Wind, Task 26-Cost of Wind Energy
Source: Mai et al. forthcoming
4
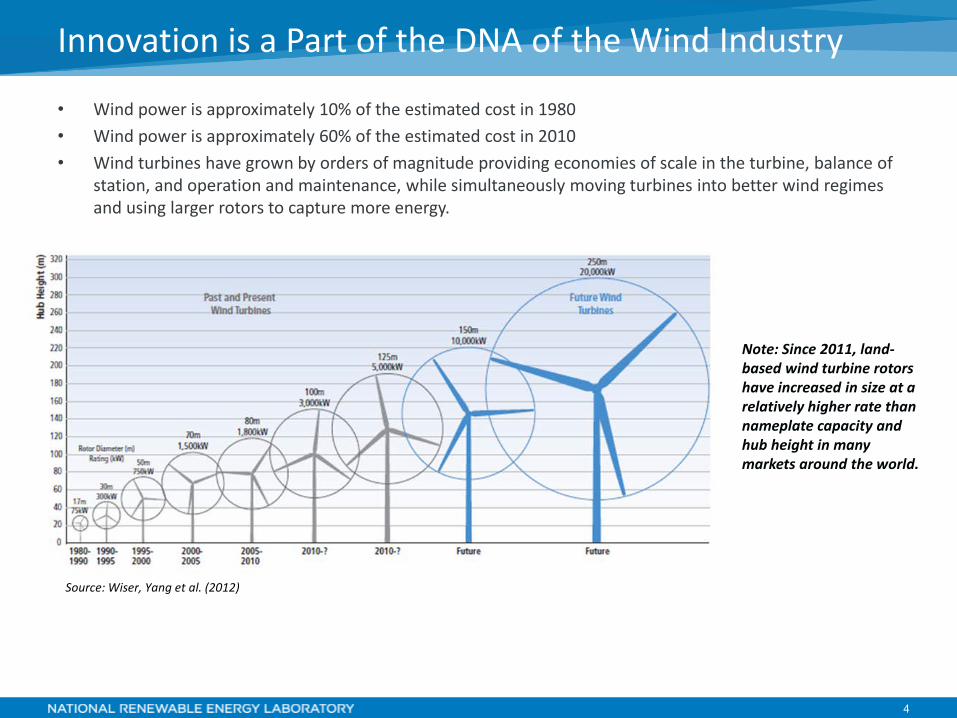
• Wind power is approximately 10% of the estimated cost in 1980 • Wind power is approximately 60% of the estimated cost in 2010 • Wind turbines have grown by orders of magnitude providing economies of scale in the turbine, balance of
station, and operation and maintenance, while simultaneously moving turbines into better wind regimes and using larger rotors to capture more energy.
Innovation is a Part of the DNA of the Wind Industry
Source: Wiser, Yang et al. (2012)
Note: Since 2011, land-based wind turbine rotors have increased in size at a relatively higher rate than nameplate capacity and hub height in many markets around the world.
5
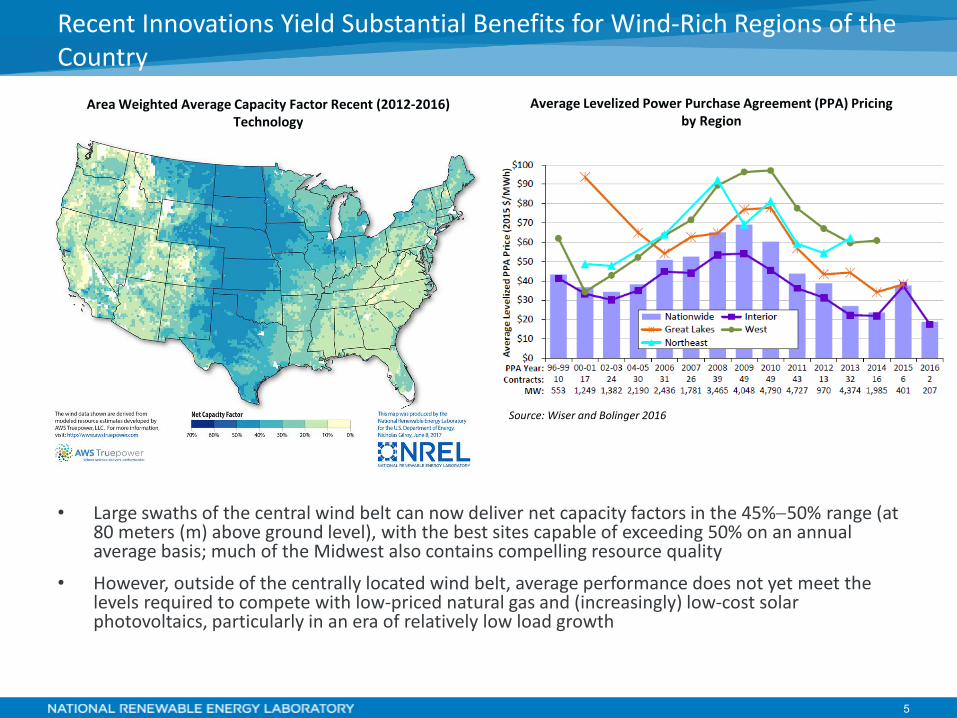
Recent Innovations Yield Substantial Benefits for Wind-Rich Regions of the Country
Source: Wiser and Bolinger 2016
Area Weighted Average Capacity Factor Recent (2012-2016) Technology
Average Levelized Power Purchase Agreement (PPA) Pricing by Region
• Large swaths of the central wind belt can now deliver net capacity factors in the 45%−50% range (at 80 meters (m) above ground level), with the best sites capable of exceeding 50% on an annual average basis; much of the Midwest also contains compelling resource quality
• However, outside of the centrally located wind belt, average performance does not yet meet the levels required to compete with low-priced natural gas and (increasingly) low-cost solar photovoltaics, particularly in an era of relatively low load growth
6
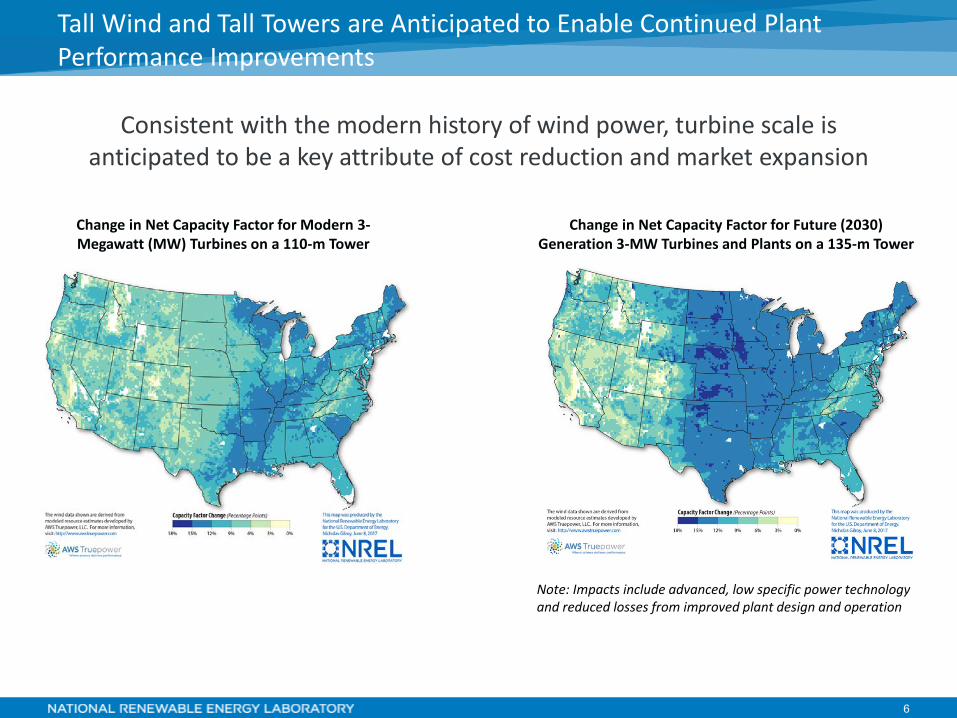
Consistent with the modern history of wind power, turbine scale is anticipated to be a key attribute of cost reduction and market expansion
Tall Wind and Tall Towers are Anticipated to Enable Continued Plant Performance Improvements
Change in Net Capacity Factor for Future (2030) Generation 3-MW Turbines and Plants on a 135-m Tower
Change in Net Capacity Factor for Modern 3-Megawatt (MW) Turbines on a 110-m Tower
Note: Impacts include advanced, low specific power technology and reduced losses from improved plant design and operation
7
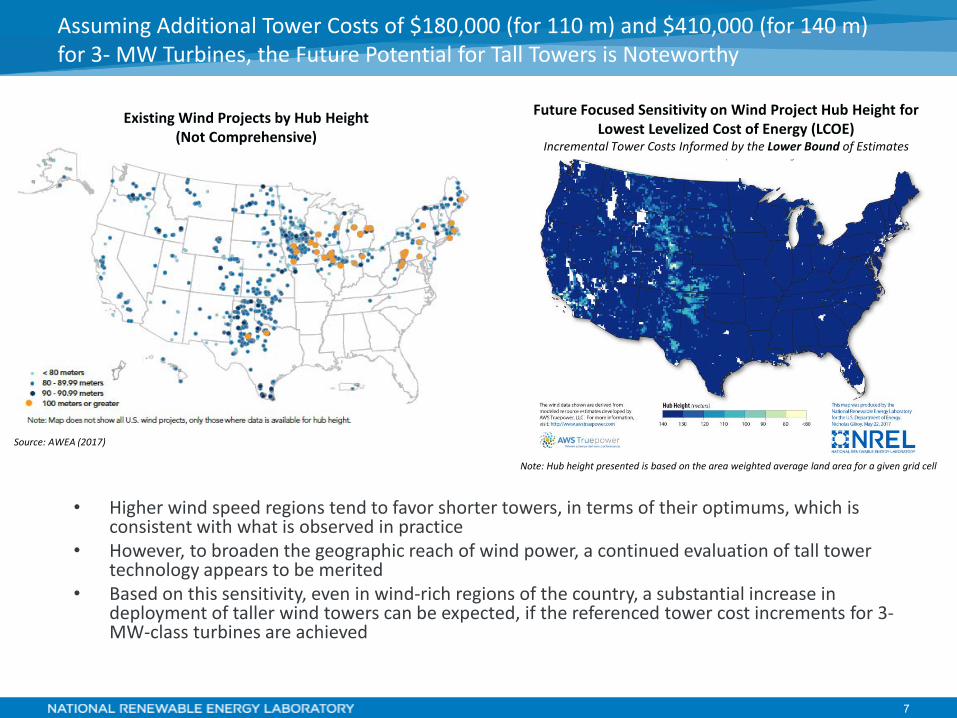
• Higher wind speed regions tend to favor shorter towers, in terms of their optimums, which is consistent with what is observed in practice
• However, to broaden the geographic reach of wind power, a continued evaluation of tall tower technology appears to be merited
• Based on this sensitivity, even in wind-rich regions of the country, a substantial increase in deployment of taller wind towers can be expected, if the referenced tower cost increments for 3- MW-class turbines are achieved
Assuming Additional Tower Costs of $180,000 (for 110 m) and $410,000 (for 140 m) for 3- MW Turbines, the Future Potential for Tall Towers is Noteworthy
Existing Wind Projects by Hub Height (Not Comprehensive)
Source: AWEA (2017)
Future Focused Sensitivity on Wind Project Hub Height for Lowest Levelized Cost of Energy (LCOE)
Incremental Tower Costs Informed by the Lower Bound of Estimates
Note: Hub height presented is based on the area weighted average land area for a given grid cell
8
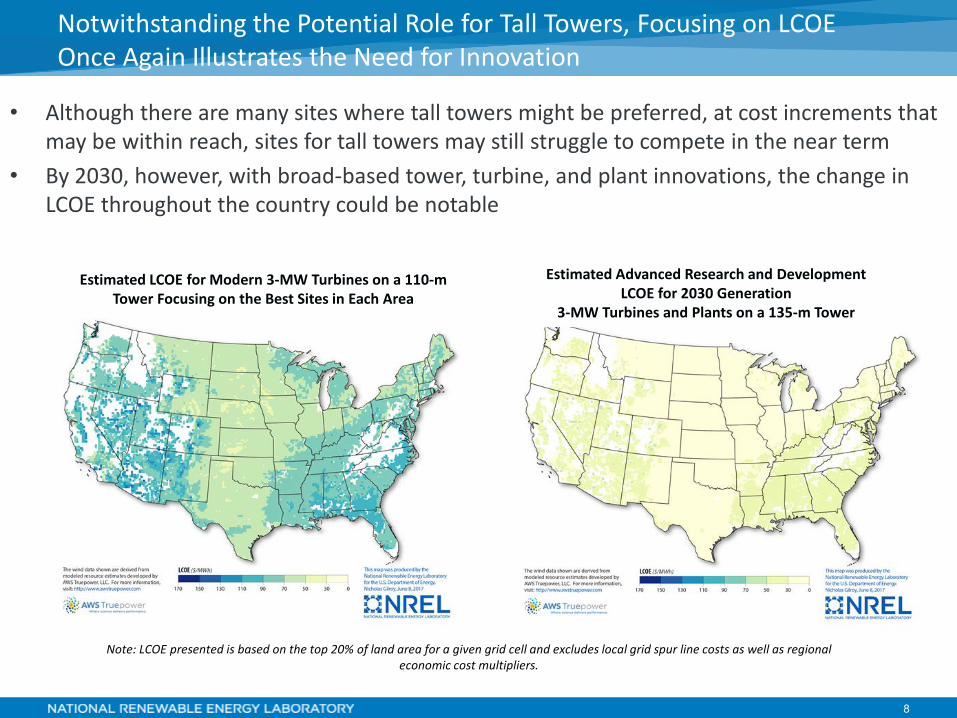
• Although there are many sites where tall towers might be preferred, at cost increments that may be within reach, sites for tall towers may still struggle to compete in the near term
• By 2030, however, with broad-based tower, turbine, and plant innovations, the change in LCOE throughout the country could be notable
Notwithstanding the Potential Role for Tall Towers, Focusing on LCOE Once Again Illustrates the Need for Innovation
Note: LCOE presented is based on the top 20% of land area for a given grid cell and excludes local grid spur line costs as well as regional economic cost multipliers.
Estimated Advanced Research and Development LCOE for 2030 Generation
3-MW Turbines and Plants on a 135-m Tower
Estimated LCOE for Modern 3-MW Turbines on a 110-m Tower Focusing on the Best Sites in Each Area
9
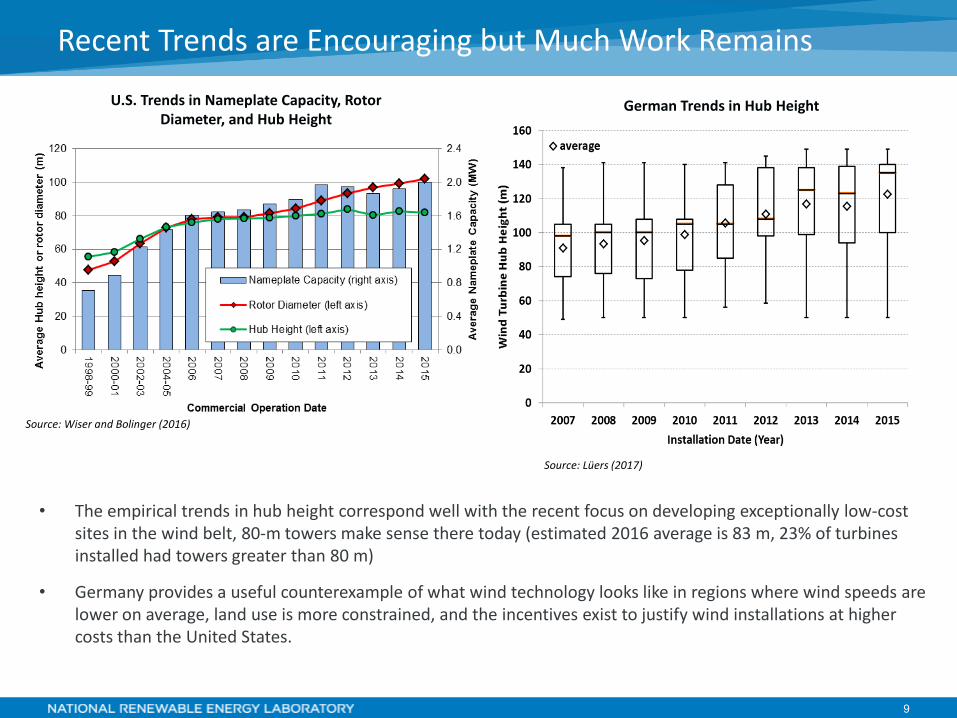
• The empirical trends in hub height correspond well with the recent focus on developing exceptionally low-cost sites in the wind belt, 80-m towers make sense there today (estimated 2016 average is 83 m, 23% of turbines installed had towers greater than 80 m)
• Germany provides a useful counterexample of what wind technology looks like in regions where wind speeds are lower on average, land use is more constrained, and the incentives exist to justify wind installations at higher costs than the United States.
Recent Trends are Encouraging but Much Work Remains
Source: Lüers (2017)
U.S. Trends in Nameplate Capacity, Rotor Diameter, and Hub Height
German Trends in Hub Height
Source: Wiser and Bolinger (2016)
10
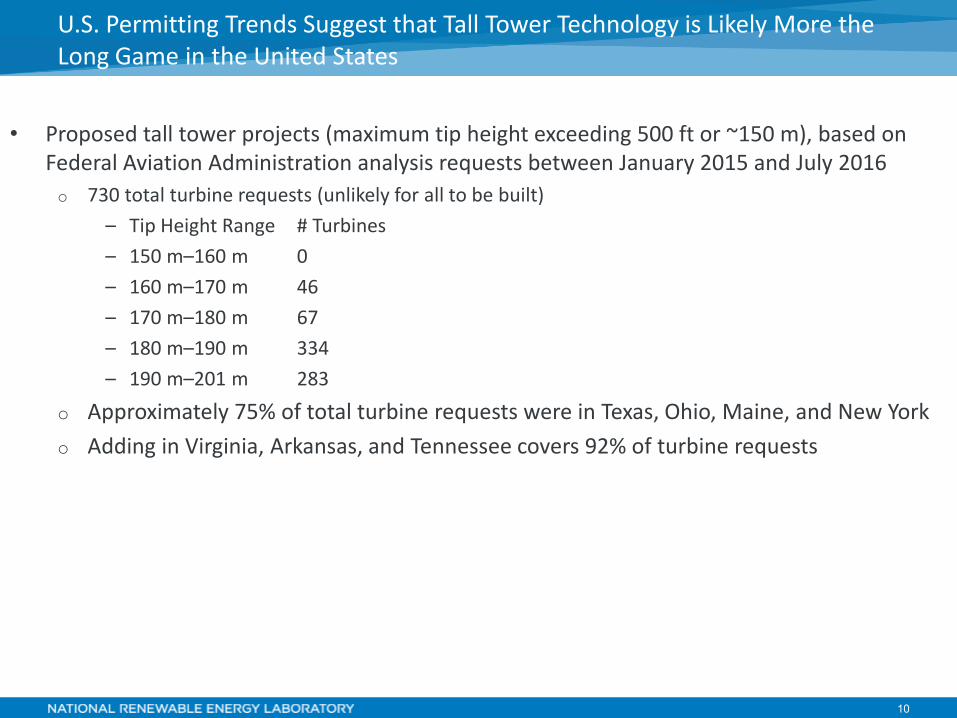
• Proposed tall tower projects (maximum tip height exceeding 500 ft or ~150 m), based on Federal Aviation Administration analysis requests between January 2015 and July 2016 o 730 total turbine requests (unlikely for all to be built)
– Tip Height Range # Turbines – 150 m–160 m 0 – 160 m–170 m 46 – 170 m–180 m 67 – 180 m–190 m 334 – 190 m–201 m 283
o Approximately 75% of total turbine requests were in Texas, Ohio, Maine, and New York o Adding in Virginia, Arkansas, and Tennessee covers 92% of turbine requests
U.S. Permitting Trends Suggest that Tall Tower Technology is Likely More the Long Game in the United States
11
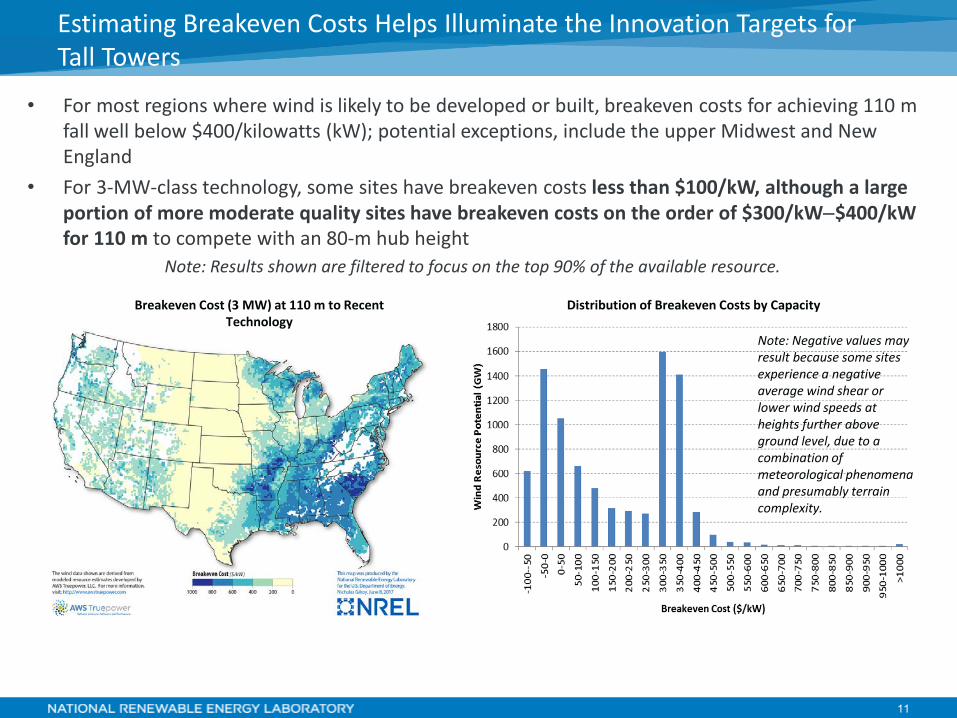
Estimating Breakeven Costs Helps Illuminate the Innovation Targets for Tall Towers
• For most regions where wind is likely to be developed or built, breakeven costs for achieving 110 m fall well below $400/kilowatts (kW); potential exceptions, include the upper Midwest and New England
• For 3-MW-class technology, some sites have breakeven costs less than $100/kW, although a large portion of more moderate quality sites have breakeven costs on the order of $300/kW−$400/kW for 110 m to compete with an 80-m hub height
Note: Results shown are filtered to focus on the top 90% of the available resource.
Breakeven Cost (3 MW) at 110 m to Recent Technology
Distribution of Breakeven Costs by Capacity
Note: Negative values may result because some sites experience a negative average wind shear or lower wind speeds at heights further above ground level, due to a combination of meteorological phenomena and presumably terrain complexity.
12
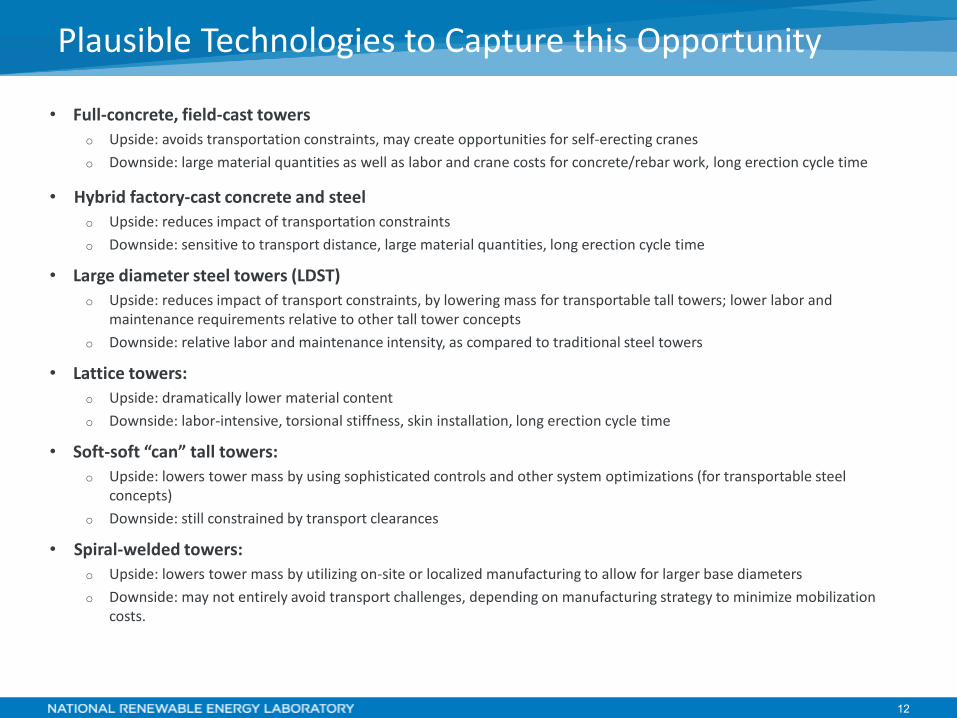
• Full-concrete, field-cast towers o Upside: avoids transportation constraints, may create opportunities for self-erecting cranes o Downside: large material quantities as well as labor and crane costs for concrete/rebar work, long erection cycle time
• Hybrid factory-cast concrete and steel o Upside: reduces impact of transportation constraints o Downside: sensitive to transport distance, large material quantities, long erection cycle time
• Large diameter steel towers (LDST) o Upside: reduces impact of transport constraints, by lowering mass for transportable tall towers; lower labor and
maintenance requirements relative to other tall tower concepts o Downside: relative labor and maintenance intensity, as compared to traditional steel towers
• Lattice towers: o Upside: dramatically lower material content o Downside: labor-intensive, torsional stiffness, skin installation, long erection cycle time
• Soft-soft “can” tall towers: o Upside: lowers tower mass by using sophisticated controls and other system optimizations (for transportable steel
concepts) o Downside: still constrained by transport clearances
• Spiral-welded towers: o Upside: lowers tower mass by utilizing on-site or localized manufacturing to allow for larger base diameters o Downside: may not entirely avoid transport challenges, depending on manufacturing strategy to minimize mobilization
costs.
Plausible Technologies to Capture this Opportunity
13
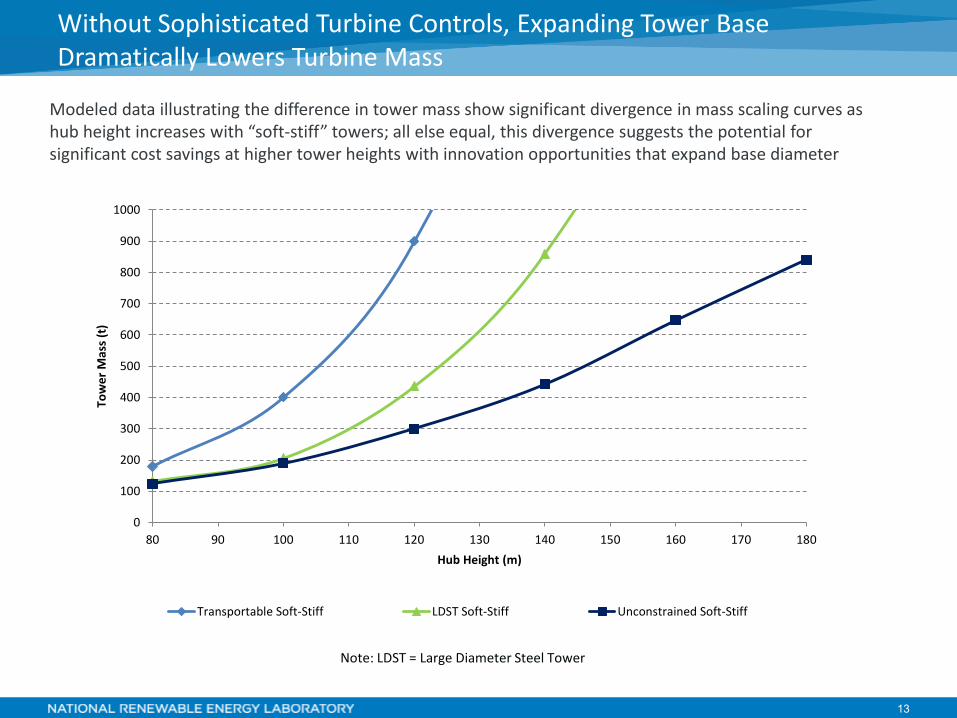
Modeled data illustrating the difference in tower mass show significant divergence in mass scaling curves as hub height increases with “soft-stiff” towers; all else equal, this divergence suggests the potential for significant cost savings at higher tower heights with innovation opportunities that expand base diameter
Without Sophisticated Turbine Controls, Expanding Tower Base Dramatically Lowers Turbine Mass
0
100
200
300
400
500
600
700
800
900
1000
80 90 100 110 120 130 140 150 160 170 180
Tow
er M
ass (
t)
Hub Height (m)
Transportable Soft-Stiff LDST Soft-Stiff Unconstrained Soft-Stiff
Note: LDST = Large Diameter Steel Tower
14
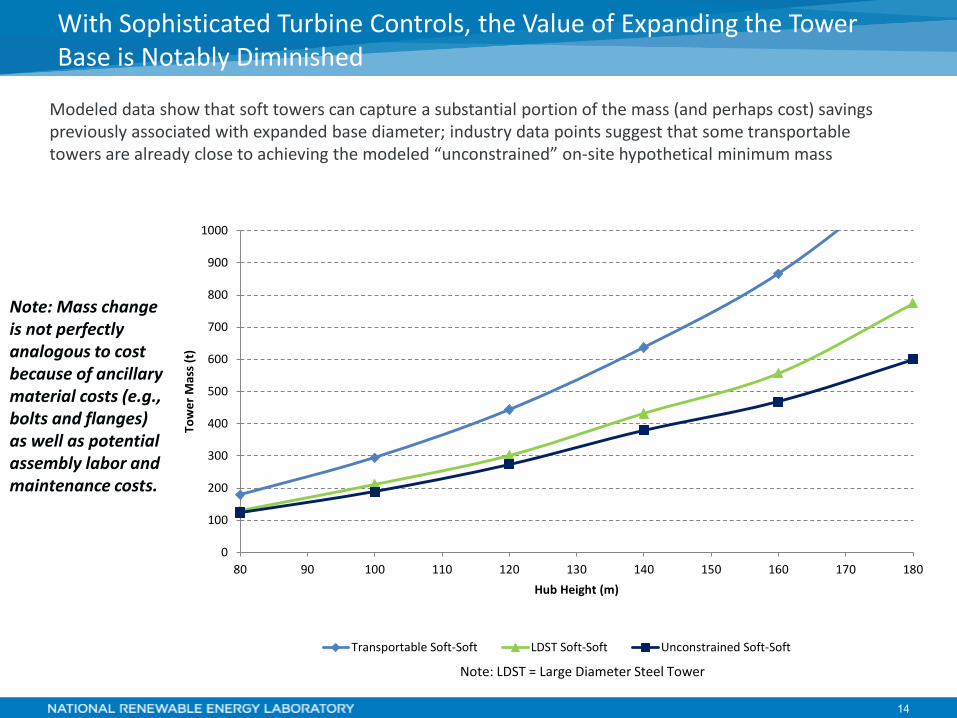
Modeled data show that soft towers can capture a substantial portion of the mass (and perhaps cost) savings previously associated with expanded base diameter; industry data points suggest that some transportable towers are already close to achieving the modeled “unconstrained” on-site hypothetical minimum mass
With Sophisticated Turbine Controls, the Value of Expanding the Tower Base is Notably Diminished
Note: Mass change is not perfectly analogous to cost because of ancillary material costs (e.g., bolts and flanges) as well as potential assembly labor and maintenance costs.
0
100
200
300
400
500
600
700
800
900
1000
80 90 100 110 120 130 140 150 160 170 180
Tow
er M
ass (
t)
Hub Height (m)
Transportable Soft-Soft LDST Soft-Soft Unconstrained Soft-Soft
Note: LDST = Large Diameter Steel Tower
15
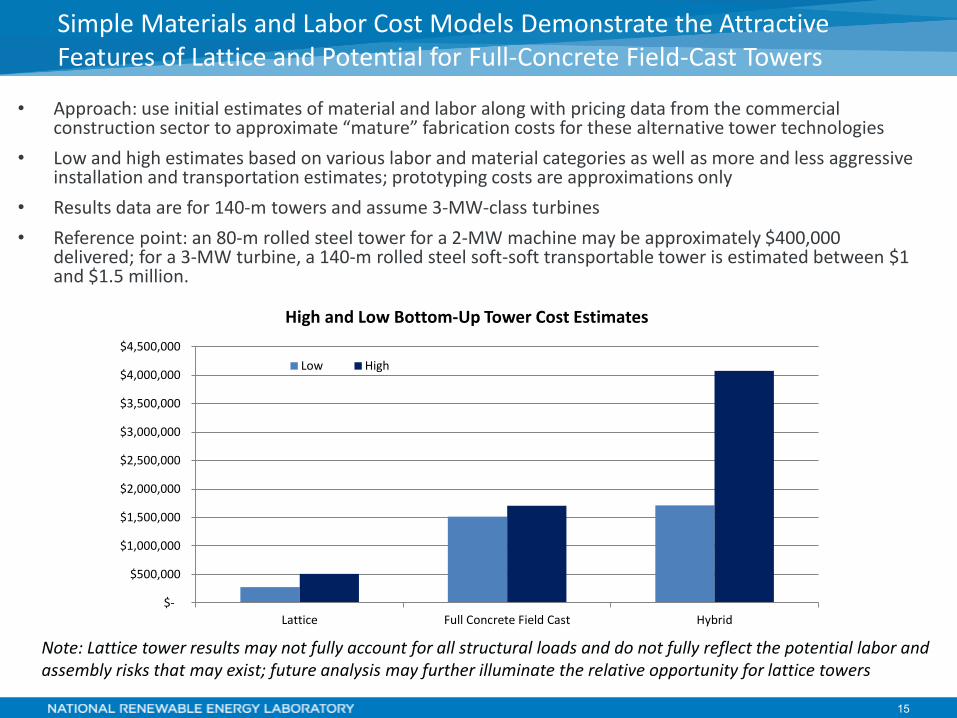
• Approach: use initial estimates of material and labor along with pricing data from the commercial construction sector to approximate “mature” fabrication costs for these alternative tower technologies
• Low and high estimates based on various labor and material categories as well as more and less aggressive installation and transportation estimates; prototyping costs are approximations only
• Results data are for 140-m towers and assume 3-MW-class turbines
• Reference point: an 80-m rolled steel tower for a 2-MW machine may be approximately $400,000 delivered; for a 3-MW turbine, a 140-m rolled steel soft-soft transportable tower is estimated between $1 and $1.5 million.
Simple Materials and Labor Cost Models Demonstrate the Attractive Features of Lattice and Potential for Full-Concrete Field-Cast Towers
$-
$500,000
$1,000,000
$1,500,000
$2,000,000
$2,500,000
$3,000,000
$3,500,000
$4,000,000
$4,500,000
Lattice Full Concrete Field Cast Hybrid
High and Low Bottom-Up Tower Cost Estimates
Low High
Note: Lattice tower results may not fully account for all structural loads and do not fully reflect the potential labor and assembly risks that may exist; future analysis may further illuminate the relative opportunity for lattice towers
16
• Innovation is critical to maintaining the continued growth of wind energy throughout the next decade
• Wind technology fundamental cost drivers persist, tall wind technology (e.g., rotors, nameplate capacity, and towers) innovation will be a key component to driving down future wind costs
• Achieving higher hub heights can still drive significant improvements in capacity factor throughout broad regions of the country
• By driving down the cost of taller towers, their presence in the United States could be broadly expanded, but actual market penetration may vary depending on turbine-specific power and targeted design conditions
• There are a variety of tall tower technology concepts in play with no clear winner established; at the same time, the increasing sophistication of turbine controllers is changing the game for turbine and tower designers.
Key Conclusions
17
• American Wind Energy Association. AWEA. 2017. AWEA U.S. Wind Industry Annual Market Report Year Ending 2016. Washington, D.C.
• AWS Truepower. 2012. Wind Resource of the United States: Mean Annual Wind Speed at 200m Resolution. https://www.awstruepower.com/assets/Wind-Resource-Map-UNITED-STATES-11x171.pdf.
• U.S. Department of Energy (DOE). 2015. Wind Vision: A New Era for Wind Power in the United States. U.S. Department of Energy Office
of Energy Efficiency and Renewable Energy. DOE/GO-102015-4557. Washington, D.C. Accessed May 2015.
• Lüers, S. 2017. Betreiber-Datenbasis: Database on German wind turbines (installation, configuration, production, etc.) since 1988. Compiled by Deutsche WindGuard.
• Mai, Trieu, Eric Lantz, Matthew Mowers, and Ryan Wiser. Forthcoming. The Power of R&D as a Means for Continued Growth in a Post-PTC World. National Renewable Energy Laboratory (NREL). Golden, CO (US).
• Wiser, Ryan, and Mark Bolinger. 2016. 2015 Wind Technologies Market Report. U.S. Department of Energy. DOE/GO-10216-4885.
• Wiser, R., K. Jenni, J. Seel, E. Baker, M. Hand, E. Lantz, A. Smith. 2016. “Expert Elicitation Survey on Future Wind Energy Costs.” Nature Energy. No: 16135. Accessed January 2017. doi:10.1038/NENERGY.2016.135.
• Wiser, R., Z. Yang, M. Hand, O. Hohmeyer, D. Infi eld, P. H. Jensen, V. Nikolaev, M. O’Malley, G. Sinden, A. Zervos. 2012: Wind Energy. In IPCC Special Report on Renewable Energy Sources and Climate Change Mitigation [O. Edenhofer, R. Pichs-Madruga, Y. Sokona, K. Seyboth, P. Matschoss, S. Kadner, T. Zwickel, P. Eickemeier, G. Hansen, S. Schlömer, C. von Stechow (eds)], Cambridge University Press, Cambridge, United Kingdom and New York, New York.
References
Eric Lantz National Renewable Energy Laboratory email: [email protected] Co-authors: Owen Roberts and Katherine Dykes
We thank George Scott, Tyler Stehly, Mike Maness, and Nicholas Gilroy (all of NREL) for providing supporting analysis. This work was supported by the Wind Energy Technologies Office, Office of Energy Efficiency and Renewable Energy of the U.S. Department of Energy under Contract No. DE-AC36-08GO28308.