Embed Size (px)
Citation preview

1
14th International Conference on Wind Engineering – Porto Alegre, Brazil – June 21-26, 2015
Measurements of wind-induced response of tall industrial chimney using GPS technology
Peter Breuer1, Tadeusz Chmielewski2, Piotr Górski3, Eduard Konopka1, Lesław Tarczyński2 1Department of Geomatics, Computer Science and Mathematics, Stuttgart University of Applied Sciences, Stuttgart, Germany
2Department of Structural Mechanics, Faculty of Civil Eng., Opole University of Technology, Opole, Poland 3Department of Road and Bridges, Faculty of Civil Eng., Opole University of Technology, Opole, Poland
email: [email protected], [email protected], [email protected], [email protected], [email protected]
ABSTRACT: Global Positioning System (GPS) dual-frequency receivers installed at three various levels were used in two field tests to record the response of the 300-m tall industrial chimney, located in the power station of Bełchatów (Poland), exposed to the light wind and temperature variations. The fast Fourier transformation and the peak-picking approach based on the band-pass filtering technique (a second-order Type 1 Chebyshev band-pass) were employed to detect dominant natural frequencies and relevant vibrations of the maximum displacements of the chimney. The damping ratios for both tests were also determined. The estimated first natural frequencies and mode shapes, using GPS measurements, matched well with predicted from a calculation of the finite element model, created for the chimney. The assessment of measurement errors caused by GPS system before and after filtering is also presented. This paper concludes that GPS is a viable tool for detecting the structural dynamic characteristics and that GPS is capable of tracking the vibrations of long-period structures to a few millimetres - in our tests to 2mm during short time intervals. These results were obtained by using the GPS 10 Hz filtered data.
KEY WORDS: Global Positioning System (GPS); Displacements Monitoring; Digital Signal Processing; Identification of Structural Dynamic Characteristics; Measurement Errors.
1 INTRODUCTION
This paper is focused on the algorithm for detecting the structural dynamic characteristics, that is, natural frequencies, mode shapes and damping ratios of two field tests conducted on the 300-m tall industrial chimney, located in the power station of Bełchatów (Poland). Precise detection of these dynamics is an important issue for the structural health monitoring (SHM). The GPS rover receivers were installed at three various levels of the chimney. Such vertical installations along the structure’s vertical facade often cause trouble by the effects of signal shielding and multipathing. Obviously, the consequences of these problems are explained in the paper. To the authors’ knowledge, this is the first temporary (two times for 3 days) deployment of the GPS receivers in the world at different levels for dynamic monitoring of the tall structures exposed to the light wind, a combined influence of solar radiation and the daily air-temperature variations. An approach to pick up the first natural frequency, the first mode shape and damping ratio are also presented. Some of these estimates (first natural frequency and mode shape) are compared with predicted the finite element model of the chimney. The results prove that the GPS measurements can be accurately used to detect the structural dynamic characteristics and extract dynamic displacements for flexible structures to a few millimetres - even to 1mm by using the GPS filtered data.
2 UNDAMPED FREE VIBRATIONS OF THE CHIMNEY – NUMERICAL RESULTS
2.1 Description of the chimney and data about its materials
The six-flue, 295 m tall, reinforced concrete industrial chimney considered in this article has one structural shaft with different thickness of the walls along the height. Inside the shaft, there are six internal steel flues and nine floors - mainly within 36 m distance along the height of the chimney. The floor system is formed by a system of steel beams. The chimney is placed on the circular foundation slab – 62 m in diameter (lying directly on the soil) that is 5.65 m high. The general view of the chimney with the longitudinal and cross sections and the most important dimensions is shown in Figure 1a and b.

2
14th International Conference on Wind Engineering – Porto Alegre, Brazil – June 21-26, 2015
Figure 1. Industrial chimney of Bełchatów power station: a) its view with a longitudinal section, b) cross-sections A-A and B-B,
c) subdivision of the chimney into elements with soil springs, d) description of the soil under foundation, e) model of the soil under foundation to evaluate soil springs, f) subdivision of the foundation slab.
The chimney was constructed in 1980. At the design stage, the concrete strength Rw=20 MPa (mean value) and the modulus of
elasticity of the shaft E=29000 MPa were assumed. The description of the soil under foundation slab is given in Figure 1d. Properties of the soil were tested in 1977 on the basis
of thirteen drillings taken around the designed foundation of the chimney and real geotechnical conditions from these tests were taken into account.
2.2 Calculation model with flexibility of soil and free vibrations of the chimney
The chimney was idealized as an elastic, linear, homogeneous beam connected to the foundation (treated as a 3-dimensional body) resting on a soil stratum of the finite depth over a rigid half space. The part of the chimney above the foundation was modeled as a 1-dimensional body divided into 26 beam elements undergoing axial deformation in order to formulate the stiffness element matrices. For these beam elements the mass element matrices were formulated by a lumped mass approach. In the system mass matrix, the mass of reinforced concrete shells, mass floors and six inner flues were included. The foundation of the chimney was divided into 26 space elements with 8 nodes for each element. The division into elements of the chimney and its foundation are shown in Figure 1c and f.
The description of the underlying soil (under a circular foundation slab of the chimney) is shown in Figure 1d. The model of soil that is given in paper [1] and is shown in Figure 1e was applied. For engineering purposes, in case of the circular foundation with the radius R0, resting on a soil stratum of the finite depth Hs over a rigid halfspace, Kausel [2] proposed the following approximate expressions for the soil spring constant – see Figure 1e (for Hs/R0 ≥ 2):
0 081
2 2xs
GR RK
Hν
= + − ,
+
−=
sH
RGRK
61
)1(3
8 030
νϕ (1)
where G is the shear modulus of soil and ν is the Poisson ratio.

3
14th International Conference on Wind Engineering – Porto Alegre, Brazil – June 21-26, 2015
Free vibrations of the linear multi-degree-of-freedom systems are governed as follows [3]:
Mq + Kq = 0ɺɺ (2)
where M, K, q are the system mass matrix, the system stiffness matrix and the displacement vector, respectively.
The differential equation (2) to be solved leads to the matrix eigenvalue problem of equation (3):
iii φωφ MK 2= (3)
where iφ is the i-th natural mode shape with the i-th natural frequency ),...,2,1( Nii =ω .
The system stiffness and the system mass matrices K and M were evaluated on the basis of the model of the chimney described previously. The first three natural frequencies and corresponding three natural mode shapes of the chimney with flexibility of the soil were calculated using SAP90+. The numerical results are given in Figure 2.
Figure 2. Sketch of the first three mode shapes with natural frequencies of the chimney.
3 MONITORING DISPLACEMENTS OF THE CHIMNEY’S VERTICAL AXIS – FUNDAMENTAL DATA
Two comparable GPS tests for monitoring a vertical profile of the tall industrial chimney were carried out in December 2008 (from the 1st to the 3rd ) and in May 2011 (from the 20th to the 24th). The common characteristics were the simultaneous use of 4 GPS units recording with the data frequency of 10 Hz and the installation of 3 rover antennas at the southern facade of the chimney at various levels above ground which are shown in Figure 3. The second test does not focus on the confirmation of the first test’s repeatability but on improving the conditions for signal reception. In the following subsections the distinct circumstances of both tests will be compared.
Figure 3. East Chimney: a) December 2008. The antenna is clamped to the gallery handrail at a distance of 1 m from the wall,
b) May 2011. The antenna is fixed on a wooden cantilever at a distance of 2.5 m from the wall.

4
14th International Conference on Wind Engineering – Porto Alegre, Brazil – June 21-26, 2015
3.1 The types of GPS receivers
Two types of the GPS receivers were used: Leica GPS500 and Leica GPS1200. From each type, two units were available. GPS1200 is the successor type of GPS500 and therefore, it is more sophisticated than the preceding type. One can assume that this type may eliminate partly reflected signals and reduce the influence of the multipath effects.
In December 2008 the GPS1200 units were installed as the reference stations on the ground and at the rover station on the chimney platform, whereas in May 2011, these units were mounted as rovers along the facade at the levels of 180 m and 251 m.
3.2 The position of the GPS rover receivers
The positions of the rover receivers were defined by their heights above ground and their distances from the chimney wall. In December 2008, the rover receivers were clamped to the handrails in the chimney galleries using specially designed U-shape clamps (Figure 3a). Therefore, the levels above ground were predefined to be 297 m, 293 m and 179 m. In the galleries, the distance from the rover receivers to the chimney wall was given by the width of the galleries which was about 1 m. The nearby chimney wall represented a handicap for the reception of satellite signals and brought about very likely the so-called multipath effects caused by the signal reflection.
In May 2011, the rigid order of the gallery levels for the rover stations could be abandoned by the use of wall openings in the chimney facade. There were several small windows in the chimney wall at a vertical distance of about 36 m, through which the rover antenna could be shifted. Two wooden beams with guidance for the antenna were constructed which allowed the shifting of the rover receivers at a distance of 2.5 m from the chimney wall (Figure 3b – the receivers were mounted on the rails installed inside the wooden beams). By the new arrangement, a more regular order of the height of the antennas could be achieved (H=297 m, H=251 m and H=180 m) and a better condition for the reception of satellite signals.
3.3 Observation intervals (the duration of sessions)
For the economical use of the available memory space, the data recording was not processed continuously but at intervals. Every 30 min, an observation interval was made for a period of several minutes. This period (the duration of a session) had to be long enough for a successful baseline solution in the static and in the kinematic GPS mode. We know from our experience that the session should last at least 3 min assuming the good GPS conditions [4]. In December 2008, the rough duration of a session was chosen to be 5 min, whereas in May 2011, it was increased to 10 min, in order to augment the probability of achieving a baseline resolution under poor conditions.
3.4 Software Systems for data processing
The almanac of satellite orbits and the later recorded satellite data are bases for the post processing. All evaluation concerning the solution of the GPS baselines was performed with the Leica Geosystems Office-Software (LGO) applying the static and kinematic modes. The LGO has been foreseen in order to visualize the data, quality check, processing, archiving and data export to other engineering software packages.
4 METEOROLOGICAL CONDITIONS
The meteorological data during both GPS tests were recorded locally on the chimney deck (H=297 m). The data from the meteorological station Pabianice (40 km north of Bełchatów) were available only in 2011 and were used for the acquisition of the global radiation (watt/m²). One should be aware that in this part of the chimney, the flow separation existed and the top of the chimney produced eddies. The measured wind velocity on the chimney deck was much bigger than the wind velocity which could be measured at a reference height of 10 m in an open terrain. The data on the chimney deck were needed to detect the time interval of the strongest local wind in order to allocate the corresponding GPS session for the evaluation of the chimney response to the maximum wind.
In December 2008, as can be seen in Figure 4, the changes in temperature during 2 days of observations were low. In the afternoon of the 1st of December, a temperature of about 10°C prevailed decreasing to 3°C during the night. Such a temperature maintained more or less to the end of the test. Because of the minor temperature variations, no significant displacement of the chimney was expected. The maximum wind velocity was about 21-27 m/s during the night from the 1st to 2nd of December 2008 whilst the wind azimuth was remarkably stable from the southeast.
In May 2011, the global radiation (refer to Figure 5) was recorded in Pabianice, indicating strong radiation every day between 10:00 and 16:00 h, bringing about a significant displacement of the chimney top in the east-west direction. During the test, the maximum wind velocity of 12-19 m/s occurred only in the early morning of the 23rd of May 2011 with a stable azimuth from the northwest.

5
14th International Conference on Wind Engineering – Porto Alegre, Brazil – June 21-26, 2015
Figure 4. 1st – 3rd of December 2008. Temperature and wind velocity recording at the chimney top.
Figure 5. 21st – 24th of May 2011. Meteorological data in Pabianice and at the chimney top.
5 SUCCESSFUL BASELINE SOLUTIONS FOR THE TESTS OF DECEMBER 2008 AND MAY 2011
The GPS data were recorded in situ at each of 4 receivers and were transferred later into the Leica GEO-Office Software (LGO) for post processing. The aim was to process the GPS data in two modes: static and kinematic ones. For the static mode, the success of an ambiguity solution for both tests is presented in Tables 1 and 2, which both have the same structure. They contain a summary of the baseline solutions in the static mode of simultaneous GPS observations at all 3 rover stations: the number of recorded baselines, the number of successful solutions by automatic system control, the number of deleted solutions afterwards, the number of later solutions by manual intervention, and the percentage of reliable resolved baselines. The number of reliable resolved baselines is based on those solutions that are clear from any signal distorsion.

6
14th International Conference on Wind Engineering – Porto Alegre, Brazil – June 21-26, 2015
The last line in both Tables shows the percentage of reliable solutions in relation to the number of observed baselines. The percentage of successful solutions depends on the levels of the rover receivers in the vertical profile. It increases from the lowest to the highest level. On the lowest balcony, the handicap is the biggest because of shielded satellite signals and because of not accepted the baseline solutions as a result of possible multipath effects.
While comparing the test of December 2008 with that of May 2011 and the progress in successful baseline solutions, one has to take into account the enlarged distance from the sensor to the chimney wall from 1.0 to 2.5 m, as well as the extension of the session epoch from 5 to 10 min. The increased number in solutions along the façade probably results also from an influence of the change in receiver generations. By the same reason, the number of successful ambiguity solutions on the chimney deck might have been decreased.
Table 1. Bełchatów, December 2008. Summary of the baseline resolution. Baseline = Reference - Rover 1201-502 1201-501 1202-1202 Leica Geosystems GPS Receiver Generation GPS500 GPS500 GPS1200 Height above ground 179 m 290 m 297 m Observation period with 5-min-sessions for post processing 20.5 h 42.5 h 43 h
Number of Baselines
Recorded Baselines 42 86 87 Ambiguity = YES (system controlled resolutions) 11 52 78 Deleted solutions afterwards 2 3 1 Resolved Ambiguity afterwards by intervention 4 3 2
Reliable resolved
Number 13 52 79 Percentage 31% 54% 90%
Table 2. Bełchatów, May 2011. Summary of the baseline resolution.
Baseline = Reference – Rover 501-1202 501-1201 501-502 Leica Geosystems GPS Receiver Generation GPS1200 GPS1200 GPS500 Height above ground 180 m 251 m 297 m Observation period with 10-min-sessions for post processing 65.5 h 65.5 h 65.5 h
Number of Baselines
Recorded Baselines 132 132 132 Ambiguity = YES (system controlled resolutions) 110 119 111 Deleted solutions afterwards 6 7 4 Resolved Ambiguity afterwards by intervention 5 6 0
Reliable resolved
Number 109 118 107 Percentage 83% 89% 81%
6 DYNAMIC WIND RESPONSE CHARACTERISTICS IN DECEMBER 2008
6.1 Examples of vibrations of the chimney due to the wind and an analysis of the first natural frequency
GPS processing in the kinematic (dynamic) mode aims to achieve a x/y/z position for each recorded data set, in this case, one single GPS position every 0.1 s. Because the original recorded data focused on post processing in the static mode, for this change in processing the mode, a manual intervention was necessary to convert the recorded parameters from the static mode to the kinematic mode. This transformation was performed making use of the editable RINEX-format.
In December 2008, at all three rover levels at time mark 1-21:00 h, a simultaneous period of GPS monitoring was achieved and processed successfully. The quality of the geometric conditions for the baseline solutions decreased with a decreasing height above ground (satellites available=7/6/5, GDOP=2/4/11). The processed simultaneous time interval for all 3 rovers was about 4 min. During this short time interval, the geometrical constellation of satellite availability was stable at all three observation levels, even if the number of available satellites was different at three levels. The reason for this stability was the individual constant number of satellites without satellite change in every rover position. The consequence of these stable geometrical conditions is a constant GDOP value during the observation interval and a regular vibration band versus the time axis as is shown in Figure 6a. A presentation of the belonging sky plot or the presentation of the diagram of satellite availability has been omitted because of the limited space. During this session, the wind velocity of about 24 m/s was measured at the top of the chimney. Data recording was performed with a raw session lasting 5 min. The exact common time interval for all three baselines was 3 min and 50 s, providing 2300 GPS positions every 0.1 s (the data frequency of 10 Hz).

7
14th International Conference on Wind Engineering – Porto Alegre, Brazil – June 21-26, 2015
Figure 6. a) Response of the chimney during the southeast wind of 24 m/s at the levels of H=297 m, 293 m and 179 m, along
and cross-wind components over 3 min and 50 s (2.300 GPS positions in 5 s intervals) and b) the power spectral densities for the cross wind components at the same three levels.
Figure 7. 1st December 2008. a) The noisy and b) de-noised along and cross-wind components of vibrations of the chimney
during the 30 s interval from 21:03:00 to 21:03:30 at three levels.

8
14th International Conference on Wind Engineering – Porto Alegre, Brazil – June 21-26, 2015
The recorded GPS antenna positions were transformed into the prevailing the southeast wind azimuth axis. In Figure 6a, every diagram shows an example for the along and cross vibration components versus the time axis for each of the three receivers. To diminish the voluminous presentation, the along-wind component as well as the cross-wind component, were combined into one single diagram. Both components can easily be distinguished in the diagrams because the amplitude of the cross-wind component is systematically larger than the amplitude of the along-wind component.
The time series of recorded displacements are undisturbed and showed no low-frequency trend. The signal noise shows its usual magnitude, and it increases with the decreasing height above ground following the previously mentioned variation of GDOP=2/4/11. The rover antennas were tightly clamped on the handrails, as shown in Figure 3a. The free vibrations of these handrails were measured during the test in December 2008 and found to have the first natural frequency of about 11 Hz. That frequency is of a different order from the first frequency of the chimney which is approximately equal to 0.2 Hz. Therefore, possible vibrations of these handrails had no influence in our interpretation of the chimney wind response. The spectral characteristics of the vibration can be identified with high accuracy. Thus, at each of the 3 levels, the Fast Fourier Analysis (FFT) was executed (see Figure 6b), i.e. the first natural frequency of the first mode of the chimney was determined which for all three levels was exactly the same (f=0.215 Hz). The total duration of the time interval presented in Figure 6 is equal to 3 min and 50 s. The recorded displacements during 30 s from the centre of this session were isolated and presented on a larger scale in Figure 7a.
The displacements in Figure 7a were filtered by using the second-order Type 1 Chebyshev band-pass filter with pass-band 0.205–0.225 Hz and pass-band ripple 1 dB and they are shown in Figure 7b. The main reason for filtering of the GPS recordings was to de-noise displacement records. The efficiency of the used filter processing was also confirmed in the papers [5-7].
The maximum displacements after filtering for both components are given in Figure 7b. The phases of vibrations are the same in all 3 diagrams. This occurrence indicates that at all three levels, the vibrations proceed in an identical phase.
6.2 Evaluation of the damping ratios for the first test (December 2008)
In order to analyse the modal damping ratios, the following assumption was made: the observation period of two hours with the sampling rate equalled 10 sps, it might be regarded as a sufficiently long period of time for their evaluation. Because of the limited volume of the available memory cards, these two-hour-observations were made only with the GPS units 1200 mounted as the reference (1201) and the rover (1202). To visualize the vibrations in two directions during one full 2-hour-period, the diagrams were drawn, as shown in Figure 8a and b. The diagram bases on the recorded x/y/z coordinates. Within the diagram, the values are defined in relation to the x/y gravity centre of the GPS session. The double diagram contains the vibrations of two components, i.e. the north and east components for the observation period of 2 h and 4 min (7440 s). The GPS time series that are shown in Figure 8a and b are contaminated as usual by a signal noise and small long-period (low frequency) trends which are typical and inherent when GPS is applied and show the limits of the GPS accuracy. On the other hand, the mentioned systematic trend can also be caused by a variation in the quasi-static component. A regular parallelism of the vibration band as opposed to the zero axis indicated a change in the wind response and a change in the wind azimuth.
The noise of both components shown in Figure 8a and b was removed by filtering. This procedure also eliminates any trends. The cross section of the chimney is bisymmetrical. In order to make a reliable evaluation of the damping ratio, the vibrations
of the chimney were analyzed in two symmetry axes, i.e. xI and yI (see Figure 1b) of the chimney in which the isolated first natural frequencies of the chimney appeared. In this case, the transformation of coordinates is needed as follows:
cos sinIx E Nα α= ⋅ − ⋅ ,
sin cosIy E Nα α= ⋅ + ⋅
(4)
where E, N are the east and north components of the vibrations of the chimney, respectively, a = 300.
The Random Decrement method [8, 9] was used to determine the values of the damping ratios of the chimney. The Random Decrement method is a time-domain method in which the structural response is transformed into a random decrement signature proportional to the correlation functions of the system operational response. The random decrement signature can be ranked by the peak amplitude as follows:
( ) ( ) ( ) ( ) ( )0,1
1; sgn
i i
N
i i x t x t Ri
a R x t x tN
τ τ = ∈=
= + ∑ ɺ
(5)
where x(t) is the response of the structure; sgn[x] is the sign of x; N is the number of ranks; R is the range of the peak value of x(t).
In order to evaluate the damping ratios for structures with the multiple closely spaced vibration modes, the random decrement signature a(τ) is approximated by superimposing different damped free oscillations as follows [8]:

9
14th International Conference on Wind Engineering – Porto Alegre, Brazil – June 21-26, 2015
Figure 8. 1st December 2008. Vibrations of the top of the chimney during the southeast wind of 19-21 m/s over 2 h and 4 min
from 14:31:00 to 16:35:00 before and after filtering, a) the east component, b) the north component.
10
14th International Conference on Wind Engineering – Porto Alegre, Brazil – June 21-26, 2015
( ) ( )1
N
ii
a a mτ τ=
= +∑ (6)
where
( ) ( )20
2cos 1
1i ii
i i i i
i
xa e ξ ω ττ ξ ωτ φ
ξ−= − −
−
(7)
and ai(τ) is the the random decrement signature for the ith mode component; x0i is the the initial value of ith mode component;
ωi is the the ith circular natural frequency; is the the phase shift; m is the the mean value correction of the random decrement
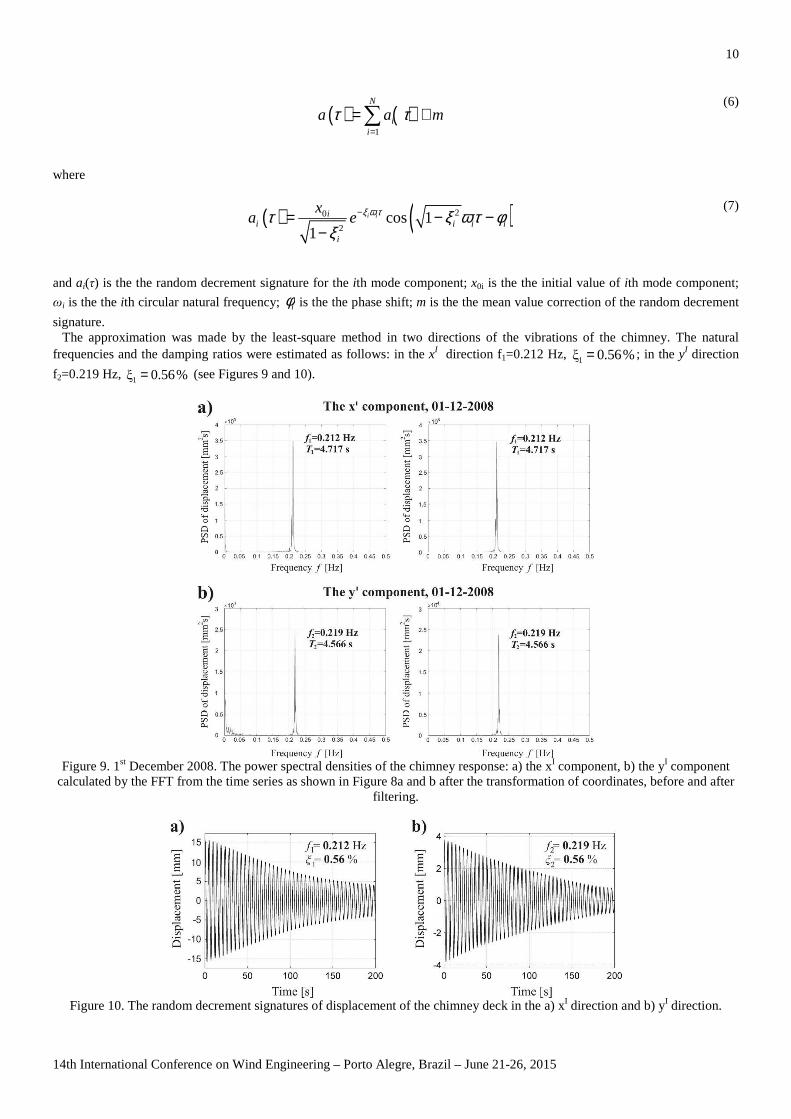
signature. The approximation was made by the least-square method in two directions of the vibrations of the chimney. The natural
frequencies and the damping ratios were estimated as follows: in the xI direction f1=0.212 Hz, ; in the yI direction
f2=0.219 Hz, (see Figures 9 and 10).
Figure 9. 1st December 2008. The power spectral densities of the chimney response: a) the xI component, b) the yI component
calculated by the FFT from the time series as shown in Figure 8a and b after the transformation of coordinates, before and after filtering.
Figure 10. The random decrement signatures of displacement of the chimney deck in the a) xI direction and b) yI direction.
iφ
1ξ 0.56%=1ξ 0.56%=

11
14th International Conference on Wind Engineering – Porto Alegre, Brazil – June 21-26, 2015
7 THE DYNAMIC WIND RESPONSE CHARACTERISTICS IN MAY 2011
7.1 Assessment of the GPS accuracy by a measurement of a zero-displacement, elimination of signal noise by filtering
Before the field measurement in May 2011, a test with the Leica units GPS 1200 was carried out to estimate the borders of possible accuracy achievable by the GPS kinematic baseline method. The idea of the test was to assess the background noise of GPS system during the test measurement of the so-called zero displacement.
The reference and rover receivers were mounted in a stable position on concrete pillars at a distance of exactly 5 m. In situ, there was a clear sight of the sky, and errors caused by the falsified or reflected satellite signals (multipath effects) did not occur. The kinematic observation mode was carried out during 8 min with the data rate of 10 sps. During the interval there was the permanent availability of 7 satellites, providing the GDOP=3 what corresponds with good GPS conditions and this constellation of satellites did not change much.
The theoretical 3D vector of the measured baseline should be invariant all the time. In reality, because of the limited scale grating of any measuring equipment, for fine reading certain inaccuracy and variations occur. In the present test, only the horizontal components of the apparent displacements were taken into account, namely the components in the direction of East-West (the east component) and North-South (the north component).
The time records in Figure 11 have a random character and may be described as the stationary and ergodic processes for which the mean values and root mean squares were calculated. They are given in Figure 11. Both components were analysed by the FFT with time interval of 120 s, and they are presented in Figure 12. The spectral densities are flat in the frequency over 1.0 Hz, i.e. the GPS system error has a white noise type spectrum in this higher frequency range.
The apparent displacements in Figure 11 were filtered by using the second-order and the eighth-order Type 1 Chebyshev band-pass digital filter with pass-band 0.205 – 0.225 Hz and pass-band ripple 1 dB and they are shown in Figure 13. The main reason for filtering of the GPS system error was to de-noise apparent displacement records.
Based on the analysis described in subsection 7.1, the following conclusion may be formulated: the order Type 1 Chebyshev filtering has a significant influence on the value of measured displacements after removing of the noise component. The accuracy of the eighth-order Type 1 Chebyshev band-pass digital filter (about 0.5 mm) is twice better than the second-order Type 1 Chebyshev band-pass digital filter (about 1.0 mm). It is a progress in the assessment accuracy of horizontal displacements of tall structures in relation to the tests (±5÷10 mm) described in the papers [4, 10-12]. Currently, similar estimation has been performed by Moschas and Stiros for 50÷100 Hz GPS receivers [13].
Figure 11. Time records of 8-min measurements of a permanent point.
Figure 12. The power spectral densities of measured errors: a) the east component, b) the north component.

12
14th International Conference on Wind Engineering – Porto Alegre, Brazil – June 21-26, 2015
Figure 13. The apparent displacements shown in Figure 11 after filtering using (a), (b) the second-order and (c), (d) the eighth-
order Type 1 Chebyshev band-pass digital filter with pass-band 0.205–0.225 Hz.
7.2 Estimation of the maximum displacements and the frequency of vibrations
During the test conducted in May 2011, data recording was performed with a raw session lasting 10 min. Over a period of 65.5 h, the baseline observations were carried out simultaneously at three rover stations at different altitudes (H=297 m, H=251 m and H=180 m). Of particular interest obviously are periods of the maximum wind velocity, which are documented in Figure 5. For example, the relative local maximum of the wind velocity which occurred on the 23rd of May 2011 at 6:00 h was the wind speed of up to 19 m/s. This period is marked in Figure 5. During the mentioned period of time, the wind came from the west-northwest (292.5°) and was relatively stable. Fitting into the hours (5:30, 6:00 and 6:30 h), there were available three simultaneously successfully resolved baselines in the static mode. During these epochs, a favourable GPS condition was prevailing, with 7 to 8 available satellites and the GDOP of 1.8-2.0 even at the lowest level H=180 m. Because of these excellent conditions all baselines could also be resolved in the static and kinematic modes.
Because of the short session length of the simultaneous observed kinematic chain and the prevailing excellent satellite availability, the GDOP value at every rover station was constant during the observation interval. The available satellites at every observation level did not change during the session. Therefore, in Figure 14a, the band of vibrations will oscillate around the time axis except some small deviations due to the inevitable signal noise.
The analysis of observations was subsequently restricted to the middle of the wind period at 6 o’clock. At 6:00 h, in all 3 levels the kinematic chains were completely and successfully resolved. In the subsequent vibration diagrams, the common starting point was set to 6:02 h (zero point of the time axis). This fixation created a common eight-minute-interval (6:02 to 6:10 h) for all three data sets containing 4800 individual GPS positions. Thus, the axis of vibrations within all diagrams is consistent and comparable. The following diagrams of vibrations are restricted to the component in the north-south direction because this coordinate axis is very close to the expected main vibration direction which is at a right angle to the prevailing wind direction (292.5°).
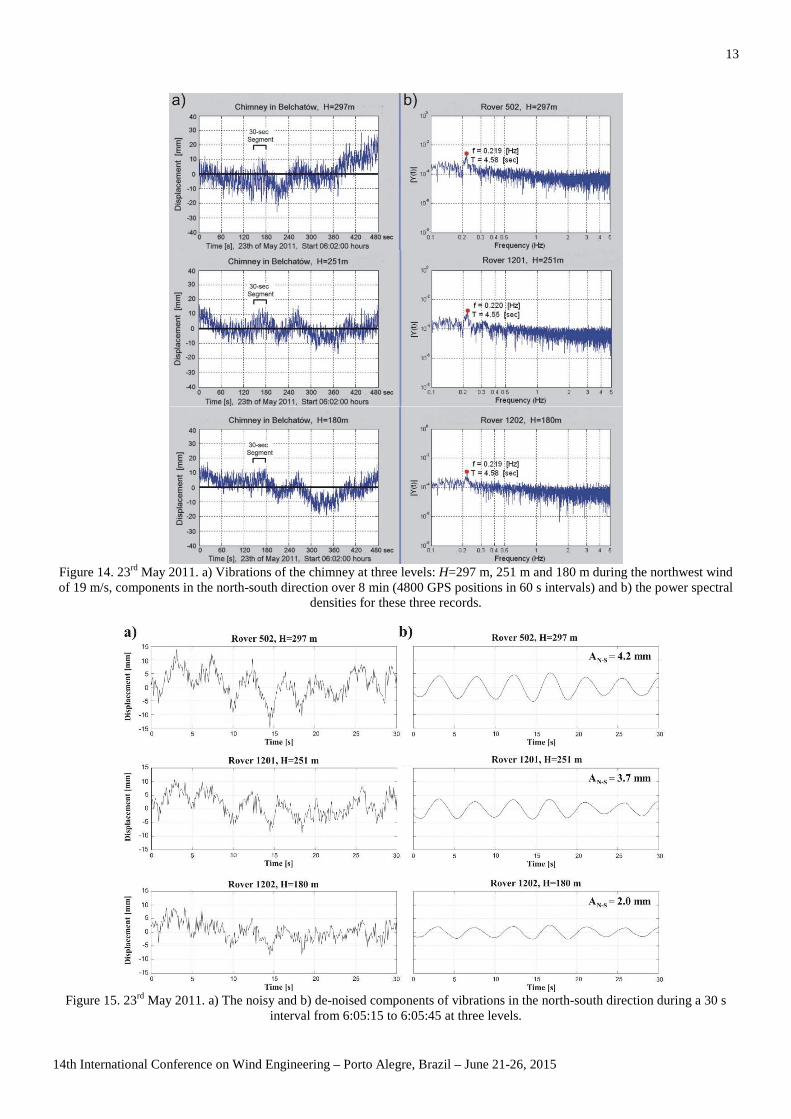
Figure 14a (left column) shows three records of vibrations for each of the 3 GPS observation levels. A significant correlated long-period trend can be observed for all three baselines as regards the systematic deviation from the zero axis. Figure 14b (right column) shows the results of the Fast Fourier Transformation (frequency analysis) with the clearly pronounced maxima. The calculated frequencies of all three baselines match very well. There is only a frequency deviation of 0.001 Hz in the middle of rover station 1201 (H=251 m) towards the two other stations. Comparing the assumed average value (f=0.219 Hz) with the previous result (f=0.215 Hz) obtained in 2008, there occurs a deviation of only about 2%.
The 30-s segments marked in Figure 14a were used for estimating the vibrations in all 3 different levels (Figure 15a). In this test, the rover antennas were mounted on the rails inside the wooden beams for which the first horizontal natural frequency was calculated of about 2 Hz. Also, in this case, this frequency is of different order from the first frequency of the chimney and possible vibrations of these beams had no influence on our interpretation of the chimney wind response. The vibrations shown in Figure 15a are noisy displacement records at three various levels within the vertical GPS profile. In order to reconstruct the waveform of vibrations, the digital filtering of high-frequency (10 Hz) GPS recordings of vibrations were made. It was performed by applying of the second-order Type 1 Chebyshev band-pass digital filter – type of filter to de-noise GPS recordings in the critical interval around the natural frequency in order to produce the reconstructed minimum bias vibrations of the chimney. The GPS recordings of the chimney response after filtering are shown in Figure 15b.
The maximum displacements after filtering for the north-south components at three levels are given in Figure 15b. The phases of vibrations are the same in all 3 diagrams. This occurrence indicates that in all three levels, the vibrations proceed in an identical phase.
13
14th International Conference on Wind Engineering – Porto Alegre, Brazil – June 21-26, 2015
Figure 14. 23rd May 2011. a) Vibrations of the chimney at three levels: H=297 m, 251 m and 180 m during the northwest wind of 19 m/s, components in the north-south direction over 8 min (4800 GPS positions in 60 s intervals) and b) the power spectral
densities for these three records.
Figure 15. 23rd May 2011. a) The noisy and b) de-noised components of vibrations in the north-south direction during a 30 s
interval from 6:05:15 to 6:05:45 at three levels.
14
14th International Conference on Wind Engineering – Porto Alegre, Brazil – June 21-26, 2015
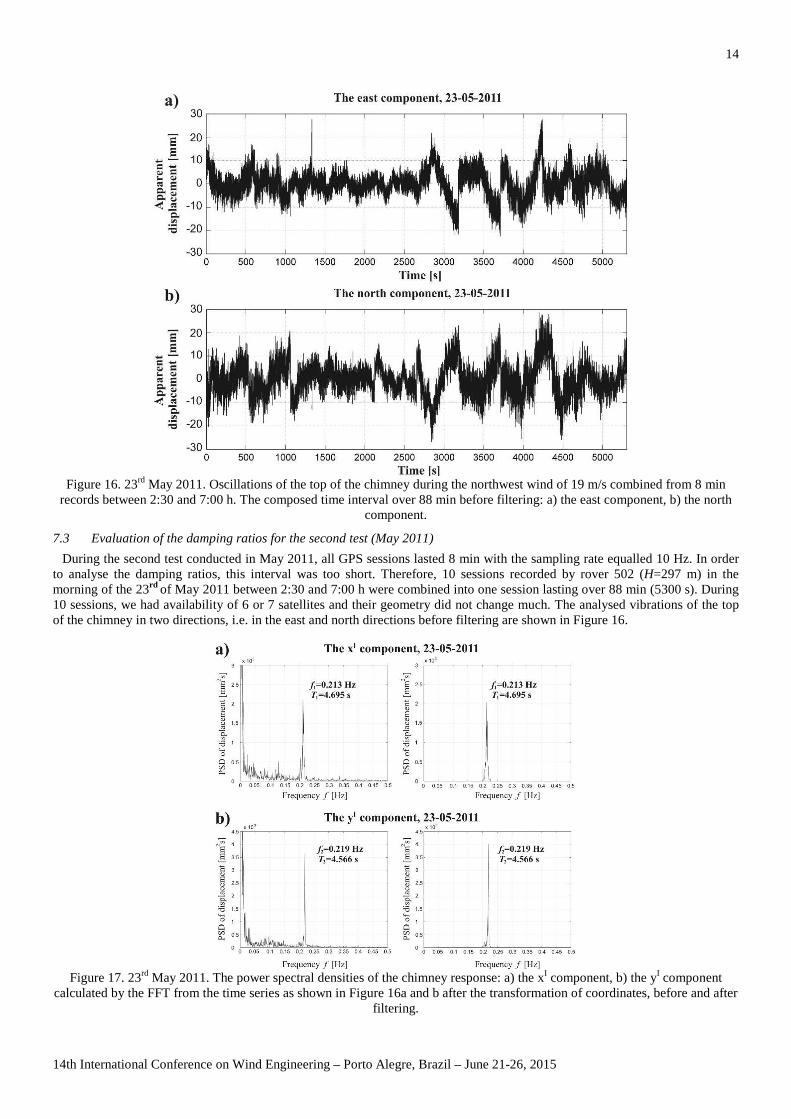
Figure 16. 23rd May 2011. Oscillations of the top of the chimney during the northwest wind of 19 m/s combined from 8 min
records between 2:30 and 7:00 h. The composed time interval over 88 min before filtering: a) the east component, b) the north component.
7.3 Evaluation of the damping ratios for the second test (May 2011)
During the second test conducted in May 2011, all GPS sessions lasted 8 min with the sampling rate equalled 10 Hz. In order to analyse the damping ratios, this interval was too short. Therefore, 10 sessions recorded by rover 502 (H=297 m) in the morning of the 23rd of May 2011 between 2:30 and 7:00 h were combined into one session lasting over 88 min (5300 s). During 10 sessions, we had availability of 6 or 7 satellites and their geometry did not change much. The analysed vibrations of the top of the chimney in two directions, i.e. in the east and north directions before filtering are shown in Figure 16.
Figure 17. 23rd May 2011. The power spectral densities of the chimney response: a) the xI component, b) the yI component
calculated by the FFT from the time series as shown in Figure 16a and b after the transformation of coordinates, before and after filtering.

15
14th International Conference on Wind Engineering – Porto Alegre, Brazil – June 21-26, 2015
Figure 18. The random decrement signatures of displacements of the chimney deck in the a) xI direction and b) yI direction (an
explanation about its stability is given in subsection 7.3).
Based on the Random Decrement method, the natural frequencies and the damping ratios of the chimney were evaluated as follows: in the xI direction f1=0.213 Hz, ; in the yI direction f2=0.219 Hz, (Figures 17 and 18). The
stability of the plot in Figure 18b may be questioned, because it is caused by measured small displacements and the noise of GPS signals.
8 COMPARISON OF THE THEORETICAL AND EXPERIMENTAL RESULTS
The comparison between the first natural frequency and the first mode shape from the numerical solutions of the undamped free vibrations given in section 2 with those determined from measurements in December 2008 and May 2011 is given in Table 3 and Figure 19. Table 3 contains also the estimated modal damping ratios for both tests.
In GPS studies, with the sampling rate of 10 Hz, typically only the first natural frequency is identified. One should be aware that the environmental effects produce instability of up to 0.1 Hz of this frequency [14].
Table 3. Comparison of computed and measured the first natural frequency for the first test (December 2008) and the second
test (May 2011).
Dir
ectio
n The modal
damping ratio
x [%]
The first frequency f1 [Hz]
Values from measurements in xI and yI directions
Calculation value
xI 0.56 0.212 (Dec. 2008)
0.236 yI 0.56 0.219 (Dec. 2008) xI 0.64 0.213 (May 2011) yI 0.73 0.219 (May 2011)
Figure 19. Comparison of computed the first mode shapes and measured horizontal displacements in the vertical profile for a)
the first test (December 2008) and b) the second test (May 2011) simultaneously at 3 different levels.
1ξ 0.64%= 1ξ 0.73%=

16
14th International Conference on Wind Engineering – Porto Alegre, Brazil – June 21-26, 2015
9 CONCLUSIONS
From our tests, we can draw the following conclusions: 1. This paper demonstrates how to use GPS data to extract the natural frequencies, mode shapes, maximum displacements and damping ratios of the tall industrial chimney exposed to the light wind, where three rover units were temporally installed at three various levels above ground. 2. In order to support the GPS data analysis, an FFT algorithm and a frequency peak-picking approach consisting of band-pass filtering were applied. If a proper algorithm is applied to the field testing data, the dynamic characteristics (mentioned previously) can be precisely determined with tracking small vibration displacements to a few millimetres - in our second test to 2.0 mm, which was obtained by using the GPS 10 Hz filtered data. 3. The estimated dynamic characteristics for both tests, December 2008 and May 2011, match well. The estimated first natural frequencies and the mode shapes, using GPS measurements, match also well with predicted from a calculation of the FE model created for the chimney. 4. The conditions for GPS monitoring owing to the satellite availability and receivers arrangement, in May 2011, were more favourable than in December 2008. In 2011, shielding satellite signals along the vertical profile was decreased by a larger distance between the antennas. Whilst comparing the number of the solved baselines, it was possible to notice that the solutions achieved in May 2011 were more successful than those reached in 2008 because of better conditions for signal reception. 5. The order Type 1 Chebyshev filtering has a significant influence on the value of measured displacements after removing of the noise component. The accuracy of the eighth-order Type 1 Chebyshev band-pass digital filter (about 0.5 mm) is twice better than the second-order Type 1 Chebyshev band-pass digital filter (about 1.0 mm). 6. The collected information on the dynamic characteristics of the chimney has been used to prepare the documentation and programme for the SHM purpose for the following years.
REFERENCES [1] T. Chmielewski, P. Górski, B. Beirow, J. Kretzschmar, Theoretical and experimental free vibrations of tall industrial chimney with flexibility of soil. Eng
Struct, 27, 25-34, 2005. [2] E. Kausel. Res. Rep. R74-11, Dept. Civ. Eng. M.I.T., Cambridge, 1974. [3] A.K. Chopra, Dynamics of structures. Prentice Hall International, Inc. 1995. [4] P. Breuer, T. Chmielewski, P. Górski, E. Konopka, L. Tarczynski, The Stuttgart TV Tower - displacement of the top caused by the effects of sun and wind.
Eng Struct 30(10), 2771-81, 2008. [5] G. Mollova, F. Scherbaum, Influence of parameters selection in Chebyshev filters on strong motion data processing. Bull of Earth Eng, 5, 609-627, 2007. [6] X. Meng, A.H. Dodson, G.W. Roberts, Detecting bridge dynamics with GPS and triaxial accelerometers. Eng Struct, 29, 3178–84, 2007. [7] F. Moschas, S.C. Stiros, Three dimensional deflections and natural frequencies of a stiff footbridge based on measurements of collocated sensors. Struct
Control and Health Mon, 21, 23-42, 2014. [8] Y. Tamura, S. Suganuma, Evaluation of amplitude-dependent damping and natural frequency of buildings during strong winds. Journal of Wind
Engineering and Industrial Aerodynamics, 59(2-3), 115–30, 1996. [9] Y. Tamura, A. Yoshida, L. Zhang, Damping in buildings and estimation techniques. In: Proc. 6th Asia-Pacific Conference on Wind Engineering, South
Korea, Sept. 12-14, 193-214, 2005. [10] M. Celebi, GPS in dynamic monitoring of long-period structures. Soil Dyn Earthq Eng, 20(5-8), 477-83, 2000. [11] A. Nickitopoulou, K. Protopsalti, S. Stiros, Monitoring dynamic and quasi-static deformations of large flexible engineering structures with GPS:
Accuracy, limitations and promises. Eng Struct, 28(10), 1471–82, 2006. [12] Y. Tamura, M. Matsui, L.-C. Pagnini, R. Ishibashi, A. Yoshida, Measurement of wind-induced response of buildings using RTK-GPS. J Wind Eng Ind
Aerodyn, 90(12-15), 1783–1793, 2002. [13] F. Moschas, S. Stiros, PLL bandwidth and noise in 100 Hz GPS measurements. GPS Solut, 19, 173-85, 2015. [14] B. Peeters, G. De Roeck, One-year monitoring of the Z24-Bridge: environmental effects versus damage events. Earthq Eng Struct Dyn, 30, 149–71, 2001.


![Wind-induced Vibration Control of Tall Timber Buildingslnu.diva-portal.org/smash/get/diva2:1010231/FULLTEXT01.pdfwhen designing ''Treet'' to counter the wind-induced vibrations [6]](https://img.pdfslide.us/doc/110x75/60474c18ae5d72238933bee6/wind-induced-vibration-control-of-tall-timber-1010231fulltext01pdf-when-designing.jpg)


![Consider... [[Tall(John) Tall(John)]] [[Tall(John)]] = undecided, therefore [[Tall(John) Tall(John)]] = undecided](https://img.pdfslide.us/doc/110x75/5515d816550346cf6f8b4964/consider-talljohn-talljohn-talljohn-undecided-therefore-talljohn-talljohn-undecided.jpg)