Embed Size (px)
Citation preview
Trends in Higher Education Series
Trends in Student Aid 2018
See the Trends in Higher Education website at trendscollegeboardorg for figures and tables in this report and for more information and data
About the College Board The College Board is a mission-driven not-for-profit organization that connects
students to college success and opportunity Founded in 1900 the College
Board was created to expand access to higher education Today the membership
association is made up of over 6000 of the worldrsquos leading educational institutions
and is dedicated to promoting excellence and equity in education Each year the
College Board helps more than seven million students prepare for a successful
transition to college through programs and services in college readiness and
college successmdashincluding the SATreg and the Advanced Placement Programreg
The organization also serves the education community through research and
advocacy on behalf of students educators and schools For further information
visit wwwcollegeboardorg
Trends in Higher Education The Trends in Higher Education publications include the annual Trends in College
Pricing and Trends in Student Aid reports and the Education Pays series along with
other research reports and topical analysis briefs These reports are designed to
provide a foundation of evidence to strengthen policy discussions and decisions
The tables supporting all of the graphs in this report a PDF version of the report and
a PowerPoint file containing individual slides for all of the graphs are available on
our website trendscollegeboardorg
Please feel free to cite or reproduce the data in this report for noncommercial purposes with proper attribution
For inquiries or requesting hard copies please contact trendscollegeboardorg
copy 2018 The College Board College Board Advanced Placement Program SAT and the acorn logo are registered
trademarks of the College Board All other marks are the property of their respective owners
Visit the College Board on the web collegeboardorg
Colleges and universities increased their grant aid for undergraduate and graduate students by 24 from $484 billion (in 2017 dollars) in 2012-13 to $600 billion in 2017-18 Over these five years federal grant aid declined by 12 and grant aid from states and from employers and other private sources rose by less than 10 (Figure 5)
Highlights Trends in Student Aid 2018 reveals a continuing decline in total annualeducation borrowing which fell (in inflation-adjusted dollars) in 2017-18 for the seventh consecutive year Federal education loans per full-time equivalent (FTE) undergraduate fell from a peak of $5830 (in 2017 dollars) in 2010-11 to $4510 in 2017-18 However the average amountborrowed by graduate students increased for the third year in a rowmdashto $17990 (Figure 1)
This report also documents some of the variation in student loan repayment patterns Although 29 of federal borrowers in repayment are now in income-driven repayment plans 17 of all borrowers are in default (Figures 13A 13B) About 11 of those who entered repayment in FY14 defaulted within three years (US Department of Education) Just two-thirds of federal student loan borrowers who entered repayment in 2009-10 and 2010-11 after earning a degree or certificatemdashand less than half of those who left school without a credentialmdashhad paid down at least one dollar of their loan principal after five years In addition to noncompleters the problem is particularly severe for those who attended for-profit institutions and for independent students (Figures 14A 14B)
The focus on student debt sometimes obscures the importance of grant aid which has grown much more rapidly for undergraduate than for graduate students in recent years Between 2007-08 and 2012-13 grant aid from all sources grew rapidly However institutional grant aidmdashaid awarded by colleges and universities as a discount from published pricesmdashis the only type of grant aid that increased significantly in the last five years
TYPES OF STUDENT AID In 2017-18 undergraduate students received an average of $14790 per FTE student in financial aid $8970 in grants $4510 in federal loans $1240 in education tax credits and deductions and $70 in Federal Work-Study (FWS) (Figure 1 Table 3)
Graduate students received an average of $27230 per FTE student in financial aid $8460 in grants $17990 in federal loans $730 in tax credits and deductions and $50 in FWS (Figure 1 Table 3)
Grant aid per FTE undergraduate rose by 42 between 2007-08and 2012-13 from $5560 (in 2017 dollars) to $7890 and by another 14 to $8970 by 2017-18 (Figure 1)
Grant aid per graduate student rose by 10 ($740 in 2017 dollars)between 2007-08 and 2012-13 and by another 6 ($490) between2012-13 and 2017-18 Federal loans per graduate student rose by13 ($2110) over the first five years of the decade and fell by $30 over the next five years (Figure 1)
Undergraduate and graduate students received $2413 billion in grants from all sources FWS federal loans and federal tax credits and deductions in 2017-18 In addition students borrowed about $12 billion from nonfederal sources (Table 1)
Total federal grant aid increased by 88 in inflation-adjusted dollars between 2007-08 and 2017-18 Pell Grants increased
by 64 veterans benefits which rose by 282 grew from 15 of federal grants in 2007-08 to 31 in 2017-18 (Table 1)
Federal loans to undergraduates increased by 9 between2007-08 and 2017-18 rising by 41 over the first five years but declining by 23 between 2012-13 and 2017-18 (Figure 3)
FWS and Federal Supplemental Educational Opportunity Grants (FSEOG) combined provided $16 billion to undergraduate students in 2017-18mdash1 of the total aid (Figure 3)
SOURCES OF GRANT AID Between 2012-13 and 2017-18 institutional grant aid for undergraduate students increased by $104 billion in 2017 dollars (27) rising from 37 to 44 of total grants (and from 20 to 26 of total financial aid) to undergraduates (Figure 3)
In 2015-16 low-income students enrolled full time at private nonprofit four-year colleges and universities received 63 of their total grant aid from their institutionsmdashan average of $16590 perstudent out of a total of $26220 (Figure 19)
In 2015-16 full-time students received an average of $7300 in grant aid at public four-year institutions and $4680 at public two-year institutions (Figure 18)
State grant aid per FTE undergraduate student rose for the fifth consecutive year in 2016-17 to $820mdashan increase of $120 (17) since 2011-12 State grant aid per student ranged from under $200 in nine states to over $1000 in 13 states (Figures 23A 24A)
PELL GRANTS Pell Grant expenditures rose from $172 billion (in 2017 dollars) in 2007-08 to $401 billion in 2010-11 but declined to $282 billion by 2017-18 (Figure 20B)
The number of Pell Grant recipients fell in 2017-18 for the sixth consecutive year but the 70 million recipients represented a 27 increase from 55 million in 2007-08 (Figure 20B)
The number of undergraduate students rose by 290000 between2007-08 and 2017-18 The number of Pell Grant recipients increased by 15 million The share of undergraduates receivingPell Grants rose from 25 to 32 over the decade (Figure 20A)
The average Pell Grant per recipient was $2590 (in 2017 dollars)in 1997-98 It increased to $3110 in 2007-08 peaked at $4300 in2010-11 and fell to $4010 in 2017-18 (Figure 21A)
The maximum Pell Grant covered 60 of average public four-year tuition and fees and 17 at private nonprofit four-year institutions in 2018-19 (Figure 21B)
3
The share of federal loans going to graduate students increased from 32 to 40 between 2002-03 and 2017-18 The percentage of FTE postsecondary students who were graduate students increased from 13 to 14 over these 15 years (Figure 9A)
The number of parents borrowing PLUS Loans in 2017-18 was12 of the number of undergraduates taking subsidized and unsubsidized Direct Loans but the average parent loan was $16450 25 times as much as the average undergraduate student loan (Figure 9B)
After seven years 41 of borrowers from for-profit institutions had reduced their loan balances by at least one dollar This repayment rate was lower than the one-year repayment rates in all other sectors (Figure 14B)
DISTRIBUTION OF STUDENT AID In 2016-17 49 of Pell Grant recipients were dependent students Seventy-three percent of this group came from families with incomes below $40000 (Figure 22B)
In 2016-17 20 of Pell Grant recipients were over the age of 30 (Figure 22A)
The share of the savings from education tax credits and deductions going to households with adjusted gross income (AGI) below $25000 rose from 14 in 2006 to 22 in 2016 The share going to those with AGI over $100000 rose from 1 to 24 (Figure 26A)
In 1981-82 and before virtually all state grant aid was based on studentsrsquo financial circumstances The share that was need-based declined gradually to a low of 71 in 2010-11 From2013-14 through 2016-17 76 of state grant aid was need-based (Figure 23A)
In 2016-17 half of the states considered studentsrsquo financial circumstances in allocating at least 95 of their state grant aid Fifteen states considered studentsrsquo financial circumstances when awarding less than half of their state grant aid (Figure 23B)
In 2015-16 private nonprofit four-year institutions with tuition and fees of $45000 or higher awarded on average about twoand a half times as much grant aid to dependent students fromfamilies with incomes below $35000 as to those from familieswith incomes of $120000 or higher ($33260 vs $12840) Atinstitutions with tuition and fees of less than $25000 studentsfrom families with incomes of $70000 or higher received moreinstitutional grant aid on average than those from families with lower incomes (Figure 25A)
In 2015-16 public doctoral universities distributed 62 of their institutional grant aid without regard to studentsrsquo financial need at public masterrsquos universities it was 71 (Figure 25B)
STUDENT BORROWING In 2017-18 annual education borrowing declined for the seventh consecutive year Students and parents borrowed $1055 billion down from $1277 billion (in 2017 dollars) in 2010-11 (Figure 6)
Federal loans per FTE undergraduate student declined in 2017-18 for the seventh consecutive yearmdashfrom $5830 (in 2017 dollars) in 2010-11 to $4510 in 2017-18 (Figure 1)
Federal loans per FTE graduate student declined from a peak of$19180 in 2010-11 to $17340 in 2014-15 before rising to $17990 in 2017-18 (Figure 1)
In 2017-18 29 of undergraduates borrowed an average of $6570 in subsidized and unsubsidized Direct Loans a decline from 37 borrowing an average of $6790 in 2012-13 in 2007-08 30 of undergraduates borrowed an average of $6360 (Figures 9B 12)
Borrowing through the Grad PLUS program rose by 27 ($22 billion in 2017 dollars) between 2012-13 and 2017-18 (Figure 6)
Nonfederal education loans fell from about $26 billion (in 2017 dollars) in 2007-08 to $9 billion from 2009-10 through 2011-12 and rose to about $12 billion in 2017-18 (Figure 6)
STUDENT DEBT As of March 2018 52 of the outstanding federal education loan debt was held by the 14 of borrowers owing $60000 or more 56 of borrowers with outstanding debt owed less than $20000 (Figure 11)
The share of 2015-16 bachelorrsquos degree recipients who borrowed $50000 or more for their undergraduate studies ranged from 7 of those who earned their degrees at public institutions to 32 of those who graduated from for-profit institutions Overall 11 borrowed this much (Figure 16)
In 2015-16 5 of masterrsquos degree recipients 20 of doctoral degree recipients and 50 of professional degree recipients borrowed $100000 or more to fund their graduate school study (Figure 17)
In 2016-17 the 59 of bachelorrsquos degree recipients from public and private nonprofit institutions who borrowed graduated with an average of $28500 in debt (Figure 15)
Average debt among public four-year college graduate borrowersrose by 16 ($3700 in 2017 dollars) between 2006-07 and 2011-12and by 3 ($700) between 2011-12 and 2016-17 Among private nonprofit bachelorrsquos degree recipients the increases were 6 ($1700) between 2006-07 and 2011-12 and 3 ($900) between2011-12 and 2016-17 (Figure 15)
In 2015-16 parents of 9 of dependent undergraduate students borrowed through the Parent PLUS program (Figure 10A)
The share of undergraduate students taking private student loans fell from 14 in 2007-08 to 6 in both 2011-12 and 2015-16 (Figure 10B)
Sixty-seven percent of federal student loan borrowers whoentered repayment in 2009-10 and 2010-11 after earning adegree or certificate had paid down at least one dollar of their loan principal after five years This repayment rate was 41 for noncompleters (Figure 14A)
4
Contents 3 Highlights
7 Introduction
9 Total Student Aid TABLE 1 Total Student Aid and Nonfederal Loans in 2017 Dollars over Time
TABLE 2 Total Student Aid and Nonfederal Loans in Current Dollars over Time
10 Aid per Student FIGURE 1 Average Aid per Student over Time
TABLE 3 Average Aid per Student over Time All Postsecondary Students Undergraduate
Students and Graduate Students
11 Grants Loans and Other Aid FIGURE 2 Composition of Total Aid and Nonfederal Loans over Time
TABLE 4 Total Aid and Nonfederal Loans in Current and Constant Dollars over Time All Students Undergraduate Students and Graduate Students
12 Total Undergraduate Student Aid by Type
13 Total Graduate Student Aid by Type
FIGURE 3 Total Undergraduate Student Aid by Source and Type over Time
FIGURE 4 Total Graduate Student Aid by Source and Type over Time
TABLE 1 Total Undergraduate and Graduate Student Aid by Source and Type over Time
14 Sources of Grant Aid FIGURE 5 Total Grant Aid by Source over Time
15 Types of Loans FIGURE 6 Total Federal and Nonfederal Loans by Type over Time
16 Federal Aid FIGURE 7 Number of Recipients by Federal Aid Program 2017-18
FIGURE 8 Percentage Distribution of Federal Aid Funds by Sector 2016-17
TABLE 5 Federal Aid per Recipient by Program over Time in Current and Constant Dollars
TABLE 7 Percentage Distribution of Federal Aid Funds by Sector over Time
17 Federal Loans FIGURE 9A Total Annual Amount Borrowed in Federal Loans over Time
Annual Borrowing FIGURE 9B Average Annual Amount Borrowed in Federal Loans over Time
TABLE 6 Federal Loans in Current and Constant Dollars over Time All Postsecondary Students Undergraduate Students and Graduate Students
18 Annual UndergraduateBorrowing Parent PLUS andPrivate Loans
FIGURE 10A
FIGURE 10B Share of Undergraduate Students with Private Loans over Time
Share of Dependent Undergraduate Students with Parent PLUS Loans over Time
19 Federal Loans Borrowingand Balances
FIGURE 11 Distribution of Borrowers and Debt by Outstanding Balance 2018
FIGURE 12 Percentage of Undergraduates Borrowing Federal Loans over Time
FIGURE 2016_11A Median Debt by Institution Type 2013-14
20 Outstanding Federal Loans FIGURE 13A Distribution of Outstanding Federal Direct Loan Dollars and Borrowers by
Repayment Plan
FIGURE 13B Repayment Status of Federal Education Loan Portfolio
21 Federal Loans Repayment Rates
FIGURE 14A
FIGURE 14B
Federal Student Loan Repayment Rate by Completion Status and by Dependency Status
Federal Student Loan One-Year Three-Year Five-Year Seven-Year Repayment Rate by Sector
Default Rates FIGURE 2016_11B Five-Year Student Loan Default Rates by Institution Type over Time
FIGURE 2016_12A Two-Year Default Rates by Sector and Completion Status
FIGURE 2016_12B Share of Defaulters and Three-Year Default Rates by Loan Balance
22 Cumulative Debt Bachelorrsquos Degree Recipients
FIGURE 15 Average Cumulative Debt of Bachelorrsquos Degree Recipients at Four-Year Institutions
over Time
Figures and tables that are only available online at trendscollegeboardorg Additional figures on student debt and grant aid from the 2014 and 2015 reports are available online
5
ContentsmdashContinued 23
24
25
Cumulative Debt Undergraduate DegreeRecipients Cumulative Debt Graduate Degree Recipients Sources of Grant Aid
FIGURE 16 Distribution of 2015-16 Degree or Certificate Completers by Cumulative Amount Borrowed for Undergraduate Study
FIGURE 17 Distribution of 2015-16 Advanced Degree Recipients by Cumulative Amount Borrowed for Graduate Study
FIGURE 18 Sources of Grant Aid in 2015-16 Public Institutions
Public Institutions 26 Sources of Grant Aid FIGURE 19 Sources of Grant Aid in 2015-16 Private Institutions
Private Institutions 27 Pell Grants FIGURE 20A Undergraduate Enrollment and Percentage Receiving Pell Grants over Time
FIGURE 20B Total Pell Grant Expenditures and Number of Recipients over Time
28 Pell Grants FIGURE 21A Maximum and Average Pell Grants over Time
FIGURE 21B Maximum Pell Grant and Published Prices at Four-Year Institutions over Time
TABLE 8 Federal Pell Grant Awards in Current and Constant Dollars over Time
29 Pell Grants FIGURE 22A Distribution of Pell Grant Recipients by Age 2016-17
FIGURE 22B Distribution of Pell Grant Recipients by Dependency Status and Family Income 2016-17
30 State Grants FIGURE 23A Need-Based and Non-Need-Based State Grants per Undergraduate Student over Time
FIGURE 23B Percentage of State Grant Based on Need by State 2016-17
31 State Grants FIGURE 24A State Grant Aid per Undergraduate Student by State 2016-17
FIGURE 24B State Grant Expenditures as a Percentage of Total State Support for Higher Education byState 2016-17
32 Institutional Grants FIGURE 25A Average Institutional Grant Aid per Student in 2015-16 Private Nonprofit Four-Year Institutions
FIGURE 25B Average Institutional Grant Aid per Student in 2015-16 Public Doctoral and Masterrsquos
Institutions
FIGURE 2017_21 Average Institutional Grant Aid per First-Time Full-Time Undergraduate Student over Time
33 Education Tax Credits FIGURE 26A Distribution of Education Tax Credits by Income over Time
and Tuition Deductions FIGURE 26B Total Education Tax Credits and Tuition Deductions over Time
TABLE A1 Consumer Price Index over Time 34 Notes and Sources
Figures and tables that are only available online at trendscollegeboardorg Additional figures on student debt and grant aid from the 2014 and 2015 reports are available online
6
Introduction Trends in Student Aid 2018 provides detailed information about the different types and amounts of financial aid awarded to both undergraduate and graduate students over time Some of the indicators in the report focus on total amounts of aid others focus on aid per student Both of these perspectives are importantmdashas is distinguishing between them
Total amounts of aid disbursed can capture attention because of the large numbers This phenomenon explains the widespread attention paid to the total amount of outstanding student debt since it passed the $1 trillion mark Similarly when total Pell Grant expenditures increased from $204 billion (in 2017 dollars) in 2008-09 to $401 billion in 2010-11 members of Congress and others focused on federal spending became concerned about the trajectory of the program
However changes over time in enrollment levels and patterns can make it difficult to interpret these aggregate numbers Even if the typical student gets the same amount of aid if enrollment grows total spending on aid will grow The number of Pell Grant recipients increased by more than 50 between 2008-09 and 2010-11mdashfrom 62 million to 93 million This change combined with a 30 increase in the average award from $3310 (in 2017 dollars) to $4300 generated a doubling of total Pell expenditures As the economy recovered from the Great Recession total enrollment declined and the financial circumstances of students became stronger diminishing their financial need As a result Pell expenditures declined to $282 billion in 2017-18
Understanding student debt and its impact requires knowing how much students are borrowing in the aggregate each year That total rose from $493 billion (in 2017 dollars) in 1997-98 to $1070 billion in 2007-08 and to $1277 billion in 2010-11 but declined in each of the next seven years reaching $1055 billion in 2017-18 But it also requires taking into account enrollment changes The rise and fall of total annual borrowing during and after the Great Recession does reveal a real change in studentsrsquo borrowing behavior but also results from fluctuations in the number of students going to school Total borrowing per full-time equivalent student (including both federal and nonfederal loans for borrowers and nonborrowers) rose from $4720 (in 2017 dollars) in 1997-98 to $7870 in 2007-08 and to $8120 in 2010-11 before declining for seven years to $7250 in 2017-18 Total borrowing was more than two and a half times as high in 2010-11 as in 1997-98 But borrowing per student was about 70 higher as enrollment rose by 50 over these years Because enrollment has fallen since 2010-11 the 11 decline in borrowing per FTE student between 2010-11 and 2017-18 is smaller than the 17 decline in total borrowing over these years
Institutional grant aid in the form of discounts to students is most closely linked with tuition prices The data in this report reveal that institutional grant aid rose from 40 of total grant aid in 2012-13 to 46 in 2017-18 This means on one hand that the increases in published prices have less impact than they otherwise would and on the other hand that the increases in grant aid do less to diminish financial barriers than they would in a stable price environment
The purpose of student aid is to increase educational opportunities for individual students Keeping this goal in mind helps to interpret and evaluate the information in Trends in Student Aid which is more meaningful if viewed together with the companion publication Trends in College Pricing The rapid upward trend in published prices reported there makes increases in student aid more critical
THE DISTRIBUTION OF STUDENT AID
The effectiveness of student aid in increasing educational opportunities depends largely on how the funds are distributed to students in different financial circumstances For students with limited resources grant aid makes pursuing postsecondary education possible For others grant aid makes going to a particular institution or type of institution feasible For the remaining students aid is a pure transfer reducing the price of the educational paths they would take even without assistance
Federal Pell Grants are carefully targeted to low- and moderate-income students However this aid declined from 53 to 47 of non-loan federal aid over the decade from 2007-08 to 2017-18 as aid to veterans has grown Tax benefits a much less targeted form of aid that disburses about a quarter of its funds to students from households with incomes between $100000 and $180000 account for more than one quarter of non-loan federal aid
More than three-quarters of state grant dollars are allocated on the basis of financial need but patterns vary considerably across states Half of all states considered studentsrsquo financial circumstances in allocating at least 95 of their state grant aid in 2016-17 while 15 states considered these circumstances for less than half of their aid Data from the 2016 National Postsecondary Student Aid Study included in this report show that in 2015-16 public doctoral universities distributed 62 of their institutional grant aid without regard to studentsrsquo financial need at public masterrsquos universities it was 71 Monitoring the use of need-based and non-need-based grant aid by states and institutions is critical to ensuring the effectiveness of these funds in increasing educational opportunities and attainment
THE STUDENT AID SYSTEM
Trends in Student Aid reports on a complex array of grant loan tax-based and work programs that support postsecondary students Grant aid and tax benefits lower the overall price of education for students and families making the net price of college less than the published price Education loans do not lower the price but they do make it possible to spread payments out over time The Federal Work-Study program is small relative to other federal programs only 601000 students benefited from the $960 million federal allocation to this program in 2017-18 From the student perspective these dollars are compensation for their work not financial assistance Work-Study earnings frequently replace earnings from other work but may increase the employment opportunities available for students
7
Understanding how these forms of fundingmdashgrants loans tax benefits and work-study aidmdashare distributed and how the distribution has changed over time is critical to understanding the effectiveness of the student aid system and evaluating potential changes
The student aid system is continually evolving In 2017-18 federal funding available to support studentsrsquo postsecondary pursuits totaled $1535 billion Monitoring potential policy changes is vital to the future of the federal funding available to support studentsrsquo postsecondary pursuits
Similarly state and institutional policies change over time These sources provided $112 billion and $600 billion respectively in grant aid in 2017-18 If well designed and targeted these funds can go a long way toward diminishing financial barriers to educational attainment
Much of the data on which Trends in Student Aid is based come from the Federal Student Aid office of the US Department of Education which provides precise information about the volume of federal student aid disbursed The figures for 2016-17 in Trends in Student Aid 2018 are revisions of the numbers published last year based on the US Department of Educationrsquos updated data Next year we will revise the 2017-18 figures in accordance with their updates
Some of the other figures reported here are less precise For example the latest data on federal tax credits and deductions are for calendar year 2016 We have developed a methodology to translate IRS data into estimates of these policiesrsquo benefits for tax filers Similarly our estimate of the volume of nonfederal student loans is based on reports from MeasureOne and estimates of their share of the market We base our current estimate of private grant aid on information from the 2016 National Postsecondary Student Aid Study and more recent information from the College Boardrsquos Annual Survey of Colleges These and other figures represent best estimates of the amount of aid that students receive rather than exact reporting Each year we review our data sources and methodology and make some modifications
The tables supporting all of the graphs in the Trends publications PDF versions of the publications PowerPoint files containing individual slides for all of the graphs and other detailed data on student aid and college pricing are available on our website at trendscollegeboardorg Please feel free to cite or reproduce the data in Trends for noncommercial purposes with proper attribution
8
The share of federal student aid in the form of grants increased from 20 in 2007-08 to 27 in 2017-18
In 2017-18 undergraduate students received 76 ($1841 billion) of total student aid including 95 of federal grants and 60 of federal loans They received 86 of total grant aid from all sources and 63 of all loans including nonfederal loans The remainder of the aid funded graduate students (Table 1 online)
Total Student Aid In 2017-18 undergraduate and graduate students received a total of $2413 billion in student aid in the form of grants from all sources Federal Work-Study (FWS) federal loans and federal tax credits and deductions
TABLE 1 Student Aid and Nonfederal Loans in 2017 Dollars (in Millions) Undergraduate and Graduate Students Combined 2007-08 to 2017-18
Academic Year
Preliminary 10-Year
Pell Grants $17247 $20355 $34092 $40059 $36379 $34255 $32985 $31467 $29293 $27356 $28232 64FSEOG $906 $843 $836 $850 $797 $783 $768 $753 $752 $746 $733 ndash19LEAP $76 $71 $72 $69 mdash mdash mdash mdash mdash mdash mdash mdash
mdashmdash
282 88
Academic Competitiveness Grants $363 $378 $544 $621 mdash mdash mdash mdash mdash mdash mdash SMART Grants $241 $222 $408 $486 mdash mdash mdash mdash mdash mdash mdash Veterans $3334 $3827 $8799 $11037 $10894 $12466 $12581 $12694 $12952 $12252 $12723Total Federal Grants $22167 $25696 $44751 $53122 $48070 $47504 $46333 $44914 $42996 $40354 $41688
ndash51Perkins Loans $1626 $1070 $930 $962 $1028 $1079 $1228 $1192 $1072 $902 $803Subsidized Stafford $34195 $36756 $43274 $45599 $43962 $29704 $27709 $25338 $23545 $22026 $21005 ndash39Unsubsidized Stafford $32187 $44986 $52933 $52976 $50878 $60361 $57975 $54175 $52027 $50778 $48959 52
07-08 08-09 09-10 10-11 11-12 12-13 13-14 14-15 15-16 16-17 17-18 Change
Federal Aid
Grants
Loans
Parent PLUS $9043 $8556 $10120 $11892 $12001 $10493 $10776 $11010 $12269 $12784 $12817 42Grad PLUS $3618 $4815 $6461 $7814 $8104 $8124 $8496 $8580 $9070 $9811 $10319 185Total Federal Loans $80669 $96182 $113717 $119243 $115974 $109762 $106185 $100296 $97983 $96300 $93903 16
Federal Work-Study $1144 $1084 $1105 $1094 $1054 $1031 $1028 $1008 $1007 $976 $960 ndash16Education Tax Benefits $9060 $13770 $21370 $24120 $21850 $19680 $19350 $18510 $17610 $17000 $16990 88
Total Federal Aid $113040 $136732 $180944 $197579 $186947 $177978 $172896 $164728 $159596 $154630 $153540 36
State Grants $9458 $9530 $10088 $10378 $10182 $10248 $10414 $10796 $11014 $11178 $11178 18Institutional Grants $33543 $35257 $39842 $43032 $45140 $48362 $50632 $53199 $56064 $58269 $60033 79Private and Employer Grants $13540 $13830 $14140 $14920 $15270 $15410 $15470 $15520 $15870 $16130 $16540 22Total Federal State
Institutional and Other Aid $169581 $195349 $245014 $265909 $257539 $251998 $249412 $244243 $242544 $240207 $241291 42Nonfederal Loans $26300 $12900 $9200 $8500 $8800 $9800 $10000 $10500 $10600 $11200 $11600 ndash56Total Student Aid and
Nonfederal Loans $195881 $208249 $254214 $274409 $266339 $261798 $259412 $254743 $253144 $251407 $252891 29
NOTES Table 1 excludes a variety of small federal grant and loan programs as well as some small programs for veterans and members of the military Federal Supplemental Educational Opportunity Grant (FSEOG) and Federal Work-Study (FWS) funds reflect federal allocations and do not include the required matching funds from institutions 2017-18 FSEOG FWS tax benefits state grants institutional grants private and employer grants and nonfederal loans are estimated from earlier data Components may not sum to totals because of rounding
SOURCES See page 34 for a list of sources for data included in Table 1
The federal governmentrsquos share of total student aid increased from 67 in 2007-08 to 74 in 2010-11 but fell to 64 in 2017-18 ALSO IMPORTANT
Loans made up 71 of federal student aid in 2007-08 but fell to 61 of the total in 2017-18
Nonfederal loans fell from 25 of all education loans in 2007-08 to 7 in 2009-10 In 2017-18 11 of total loans were nonfederal loans
Total federal grant aid rose by 88 in inflation-adjusted dollars between 2007-08 and 2017-18 During this 10-year periodveterans benefits nearly quadrupled and Pell Grants increasedby 64 in inflation-adjusted dollars Over the decade Pell Grants fell from 78 to 68 as a share of federal grant aid and veteransbenefits increased from 15 to 31 of the total
For detailed data behind the graphs and additional information please visit trendscollegeboardorg 9
In 2017-18 95 of the ldquoOther Aidrdquo for undergraduate students and 94 of the ldquoOther Aidrdquo for graduate students were from education tax credits and deductions The remainder was from FWS
Undergraduate Students $18000
$16000
$14000
$12000
$10000 $8970
$8000
$6000
$4000 $3890
$5560
$7890
$4380
$5450
$4510
Average Grant Aid
$3540 Average Federal Loans $2000 $1410 $1310
Average Other Aid $730 $350
$0
97-98 99-00 01-02 03-04 05-06 07-08 09-10 11-12 13-14 15-16 17-18
Graduate Students
Ave
rage
Aid
in 2
017
Dol
lars
A
vera
ge A
id in
201
7 D
olla
rs
$18000
$16000
$14000
$12000
$10000 Average Federal Loans
$18020 $17990 $15910
$10010 $8460 $7970
$8000 $7230
$6000
Average Grant Aid$5200
$4000
$2000 Average Other Aid $880 $910 $780
$340 $0
97-98 99-00 01-02 03-04 05-06 07-08 09-10 11-12 13-14 15-16 17-18
ALSO IMPORTANT
Aid per Student Federal loans per full-time equivalent (FTE) undergraduate student declined in 2017-18 for the seventh consecutive year Loans per student declined from $5830 (in 2017 dollars) in 2010-11 to $4510 in 2017-18
FIGURE 1 Average Aid per Full-Time Equivalent (FTE) Student in 2017 Dollars 1997-98 to 2017-18
NOTES Loans reported here include only federal loans to students and parents Grants from all sources are included ldquoOther Aidrdquo includes federal education tax credits and deductions and Federal Work-Study (FWS) Undergraduate and graduate shares of some forms of aid were estimated using NPSAS data and were updated Dollar values are rounded to the nearest $10
SOURCE Trends in Student Aid website (trendscollegeboardorg) Table 3
Federal loans per FTE graduate student declined from a peak of $19180 in 2010-11 to $17340 in 2014-15 before rising to $17990 in 2017-18
Grant aid per FTE undergraduate rose by 42between 2007-08 and 2012-13 from $5560(in 2017 dollars) to $7890 and by another 14to $8970 by 2017-18
Grant aid per FTE graduate student rose by 10 from $7230 (in 2017 dollars) in 2007-08 to $7970 in2012-13 and by another 6 to $8460 in 2017-18
In 2017-18 undergraduates received an average of $14790 in financial aid per FTE student an increase from $7780 (in 2017 dollars) in 1997-98 and from $10670 in 2007-08
In 2017-18 graduate students received an average of $27230 in financial aid per FTE student an increase from $15550 (in 2017 dollars) in 1997-98 and from $24020 in 2007-08
For detailed data behind the graphs and additional information please visit trendscollegeboardorg 10
11 For detailed data behind the graphs and additional information please visit trendscollegeboardorg
2 3
31 28
30
3
67 69 67
4 6 8
34
57
47 44
49 50
Grants
Loans
Undergraduate Students
Graduate Students
Perc
enta
ge o
f Tot
al F
unds
0
20
40
60
80
100
Loans
Grants
17-1815-16 13-14 11-12 09-10 07-08 05-06 03-04 01-02 99-00 97-98
Perc
enta
ge o
f Tot
al F
unds
20
40
60
80
100
Other
Other
097-98 99-00 01-02 03-04 05-06 07-08 09-10 11-12 13-14 15-16 17-18
FIGURE 2 Composition of Total Aid and Nonfederal Loans 1997-98 to 2017-18
Grants Loans and Other Aid Between 2007-08 and 2017-18 loans (including both federal and nonfederal borrowing) fell from 50 to 34 of the funds used by undergraduate students to supplement their own and their family resources Grants rose from 44 to 57 of total funding over the decade
In contrast between 1997-98 and 2017-18 loans consistently made up about two-thirds of the funds used by graduate students to supplementtheir own resources to finance their studies
In 2017-18 the combination of federal tax credits and deductions and Federal Work-Study (FWS) made up 8 of all student aid and nonfederal loans for undergraduate students and 3 for graduate students
ALSO IMPORTANT
For undergraduate students total grant aid increased by 71 and total loan volume fell by 10 between 2007-08 and 2017-18 after adjusting for inflation (Table 1 online)
For graduate students total grant aid increased by 34 and total loan volume increased by 19 between 2007-08 and 2017-18 (Table 1 online)
NOTES Nonfederal loans are included to show the total education borrowing by students and parents ldquoOther Aidrdquo includes Federal Work-Study (FWS) and federal education tax credits and deductions Percentages may not sum to 100 because of rounding
SOURCE Trends in Student Aid website (trendscollegeboardorg) Table 4
Billi
ons
of 2
017
Dol
lars
$2067 $2008
$1965$200 $1936$1896 $1897 $1874
$1838 $1841
14 14 13 14 15 16 15 15 14 13 14 14 18 19 18 17 17 17 16 15 15
4 5
5 6 6 6 6 6 6
7 7 7 8 8 8 7 7 7 8 7
6
5
5 5 5 5 6 6 6 6
20 20 21 21 19
18 19 19 20 21 21 19
16
16 18 20 21 23 24 26 26
6 7 7 7
7 7 7 7 7
7 6
5
5 5 5 6 6 6 7 7
46 42 41 40
40 40
41 42 42 41
41
44
41
39 38 37 36 34 33 32
6 7 7
7
7
7 7 7 6
6
8
10
10 10
9 9 9 9 8 8
30
FWS and FSEOG Federal Education Tax Benefits
$150 $1474
Federal Loans $1248
$1154 $1174 $1173 $1101
$998 Private and $100 Employer Grants $902
$835$809$774
$706 Institutional Grants
$50 State Grants Federal Veterans Benefits
6
Federal Pell Grants
97-98 98-99 99-00 00-01 01-02 02-03 03-04 04-05 05-06 06-07 07-08 08-09 09-10 10-11 11-12 12-13 13-14 14-15 15-16 16-17 17-18
Total Undergraduate Student Aid by TypeBetween 2012-13 and 2017-18 institutional grant aid for undergraduate students increased by $104 billion in 2017 dollars (27) rising from 20 to 26 of total financial aid to undergraduates
FIGURE 3 Total Undergraduate Student Aid in 2017 Dollars by Source and Type (in Billions) 1997-98 to 2017-18
NOTE Percentages may not sum to 100 because of rounding
SOURCE Trends in Student Aid website (trendscollegeboardorg) Table 1 online
Total institutional grant aid to undergraduates rose by 48($124 billion in 2017 dollars) between 2007-08 and 2012-13 and by another 27 ($104 billion) between 2012-13 and 2017-18
Pell Grants rose by 99 ($170 billion in 2017 dollars) over the first half of the past decade and then declined by 18 ($60 billion)
Federal loans rose by 41 ($211 billion in 2017 dollars) between 2007-08 and 2012-13 before declining by 23 ($164 billion) over the next five years Federal loans declined from 41 to 30 of total aid to undergraduates over the decade
The largest percentage growth in aid to undergraduates between2007-08 and 2017-18 was in veterans benefits which more than tripled from $30 billion (in 2017 dollars) in 2007-08 to $108 billion in 2017-18 Federal tax credits and deductions doubled from $76 to $155 billion
ALSO IMPORTANT
Figure 3 reports total aid amounts to undergraduate students The 47 increase ($586 billion in 2017 dollars) in total financial aid to undergraduates between 2007-08 and 2017-18 supported enrollment growth of 6 from 118 million to 124 million full-time equivalent (FTE) undergraduate students yielding an increase of 39 ($4120) in total aid per FTE student
For detailed data behind the graphs and additional information please visit trendscollegeboardorg 12
$60
$212 $230
$246 $249 $260
$286
$317
$343 $360
$394
$441
$473
$544 $555
$546 $552
23 23 23 24 22 20 18 18 19 18 17 17 16 16 17 18
3 3
18 19 19 20 20
64 62
61 60 61 65
66 66
65
65
66 67
68
68 68 67 67 66 66 67 66
4 4 4
4
3
$50
$40
$30
$20
$10
$0 97-98 98-99 99-00 00-01 01-02 02-03 03-04 04-05 05-06 06-07 07-08
Billi
ons
of 2
017
Dol
lars
$581 $567 $572 Federal $564 $558 Work-Study
Federal Education Tax Benefits
Federal Loans
Private and Employer Grants
Institutional Grants
State Grants Federal Veterans
08-09 09-10 10-11 11-12 12-13 13-14 14-15 15-16 16-17 17-18 Benefits
Total Graduate Student Aid by TypeGrant aid increased from 27 of total aid for graduate students in 2010-11 to 31 in 2017-18 Loans declined from 68 to 66 of the total
FIGURE 4 Total Graduate Student Aid in 2017 Dollars by Source and Type (in Billions) 1997-98 to 2017-18
NOTE Percentages may not sum to 100 because of rounding
SOURCE Trends in Student Aid website (trendscollegeboardorg) Table 1 online
Grant aid made up 35 of graduate student aid in 1999-00 and 2000-01 when loans were between 60 and 61 of the total
Between 2012-13 and 2017-18 institutional grants to graduate students rose by $13 billion in 2017 dollars (13) Federal loans rose by $589 million (2) and veterans benefits rose by $432 million (30)
Between 1997-98 and 2007-08 federal loans for graduate studentsmore than doubled increasing from $136 billion to $292 billion in2017 dollars Federal loans for these students grew by another 29over the next decade to $378 billion in 2017-18
Between 1997-98 and 2007-08 institutional grants for graduate students rose by 55 from $49 billion to $76 billion in 2017 dollars Institutional grants grew by another 49 over the next decade to $113 billion in 2017-18
ALSO IMPORTANT
Figure 4 reports total aid amounts to graduate students The 30 increase ($131 billion in 2017 dollars) in total financial aid to graduate students between 2007-08 and 2017-18 supported enrollment growth of 14 from 18 million to 21 million full-time equivalent (FTE) graduate students yielding an increase of 13 ($3210) in total aid per FTE student
For detailed data behind the graphs and additional information please visit trendscollegeboardorg 13
4
4
4 4
4
3
4
5
5 3
3 3 3 3 3
9 10 10 11 10 10 9 10 11 11 12 11 9
9 9 9 8 8 7 7 7
3 3 3 3
$1294
Gra
nts
in B
illio
ns o
f 201
7 D
olla
rs
$120
$90
$60
$30
$0
$425 $467
$496 $520
$563 $610
$659 $688 $707
$735
$787
$843
$1088
$1215 $1187
$1215 $1228 $1244 $1259 $1259
29 29 27 27 30 32 32 31 29 28 28 30
41 44
41 39 38 36 34 32 32 45 45 45 44 42
39 40 41 42 43
43 42
37
35 38 40 41 43 45 46
46
14 15
16 16 16
16 16
16 17 17
17
16
13
12 13
13 13 12 13 13 13
12 12
12 13
13 13
12 13 12
13
12
11
9
9 9
8 8 9 9 9 9 State Grants
Private and EmployerGrants
Institutional Grants
Federal Grants
97-98 98-99 99-00 00-01 01-02 02-03 03-04 04-05 05-06 06-07 07-08 08-09 09-10 10-11 11-12 12-13 13-14 14-15 15-16 16-17 17-18
Sources of Grant Aid The total amount of grant aid supporting postsecondary students increased by 85 (after adjusting for inflation) between 1997-98 and 2007-08 and by another 64 between 2007-08 and 2017-18 reaching a total of $1294 billion
FIGURE 5 Total Grant Aid in 2017 Dollars by Source of Grant 1997-98 to 2017-18
NOTE Percentages may not sum to 100 because of rounding
SOURCES See page 34 for a list of sources for grants included in Figure 5
Almost all of the growth in total grant aid over the last decade occurred between 2007-08 and 2012-13 as full-time equivalent (FTE) enrollment increased by 13 Between 2012-13 and 2017-18 FTE enrollment declined by 5 and total grant aid increased by 7
Federal grants fluctuated between 27 and 32 of all grant aid for undergraduate and graduate students between 1997-98 and 2007-08 This share rose to 44 in 2010-11 but declined to 32 in 2017-18
Institutional aid is the only type of grant aid that grew rapidly between 2012-13 and 2017-18 Colleges and universities increased their aid by 24 from $484 billion (in 2017 dollars) in 2012-13 to $600 billion in 2017-18
From 1997-98 to 2007-08 state grant aid was between 12 and 13 of all grant aid From 2009-10 to 2017-18 it was between8 and 9 of all grant aid Total state grant aid grew by 83 (afteradjusting for inflation) between 1997-98 and 2007-08 and byanother 18 over the decade ending in 2017-18
Grants from employers and other private sources were between 12 and 17 of total grant aid to postsecondary students for the entire two decades from 1997-98 through 2017-18 and were13 of the total in 2017-18
ALSO IMPORTANT
Grant aid for veterans which grew from $33 billion (in 2017 dollars) to $127 billion over the decade increased from 15 of federal grant aid in 2007-08 to 31 in 2017-18 At the same time Pell Grants which rose from $172 billion to $282 billion declined from 78 to 68 of the total (Table 1)
The composition of grant aid for graduate students is quite different from that for undergraduate studentsmdashand from the totals in Figure 5 In 2017-18 11 of graduate student grant aid came from the federal government (including aid to veterans) 64 from institutions 24from employers and other private sources and 2 from states Forundergraduate students the percentages were 36 44 11 and10 respectively (Table 1 online)
For detailed data behind the graphs and additional information please visit trendscollegeboardorg 14
Loan
s in
Bill
ions
of 2
017
Dol
lars
$1248$1229 $1196
$120 $1162
$1108$1091 $1086 $1075$1070 $1055
$979
8
7 9
8 9
12
9
50 48 43 42 40
31 32 33 33
13
34
9
14
38
33
10
16
37 35 33 31
32
10
18
32 32 30
11
20
11
23
10
25
32
30
8
3
25
34
41
8
4
12
35
43
8
5
7
36
41
9
6
7
35
41
10
6
7
25
50
9
7
8
24
50
9
7
9
23
49
10
8
9
22
48
11
8
10
20
47
12
9
10
20
46
12
10
11 Nonfederal Loans $938
$889 Perkins Loans $90 Grad PLUS Loans
$803
Parent PLUS $694 Loans
$602 $60 $558
$512 $548
$493
Federal Unsubsidized Loans
$30
Federal Subsidized Loans
$0 97-98 98-99 99-00 00-01 01-02 02-03 03-04 04-05 05-06 06-07 07-08 08-09 09-10 10-11 11-12 12-13 13-14 14-15 15-16 16-17 17-18
$1277
In 1997-98 61 of Stafford Loans were subsidized loansmdashthe interest is paid by the government while students are in school This percentage declined to 52 in 2007-08 and to 33 in 2012-13 when graduate students were no longer eligible for the program In 2017-18 30 of Stafford Loans were subsidized
Types of LoansTotal annual student and parent borrowing for postsecondary education declined (in inflation-adjusted dollars) for the seventh consecutive year to $1055 billion in 2017-18
FIGURE 6 Total Federal and Nonfederal Loans in 2017 Dollars by Type of Loan 1997-98 to 2017-18
NOTES Nonfederal loans include loans to students from states and institutions in addition to private loans issued by banks credit unions and other lenders Values fornonfederal loans are best estimates and are less precise than federal loan amounts
SOURCES See page 34 for a list of sources for loans included in Figure 6
Between 2012-13 and 2017-18 total annual borrowing from the subsidized and unsubsidized Direct Loan programs declined by 22 to $700 billion Total annual borrowing from the Parent PLUSLoan program increased by 22 to $128 billion and borrowing from the Grad PLUS program increased by 27 to $103 billion
Students borrow nonfederal education loans from banks creditunions and other private lenders including some states and postsecondary institutions These loans which are not part of the student aid system and typically do not involve subsidies fellfrom about $26 billion (in 2017 dollars) in 2007-08 to $9 billion in 2009-10 but increased to almost $12 billion by 2017-18 when theyaccounted for about 11 of all education loans
ALSO IMPORTANT
There are no credit requirements for subsidized and unsubsidizedDirect Loans or Perkins Loans To qualify for PLUS loans borrowers cannot have an ldquoadverse credit historyrdquo defined as being 90 days or more delinquent on any debts greater than $2085 or being the subject of default determination bankruptcy discharge foreclosure repossession tax lien wage garnishment or write-off of a federal education debt during the five years preceding the date of the credit report
For detailed data behind the graphs and additional information please visit trendscollegeboardorg 15
Federal Aid Federal education tax credits and deductions reached an estimated 120 million students in 2016-17 50 million more than the 70 million Pell Grant recipients in 2017-18
FIGURE 7 Number of Recipients by Federal Aid Program (with Average Aid
Received) 2017-18
120
Num
ber o
f Rec
ipie
nts
(in M
illio
ns) million
12
10 79
70 million 688 million million
55 6 million
4
14 2 million
601000 767000 286000
0 Federal Federal Direct Direct Direct FSEOG Federal Post9-11 Perkins
Education Pell Subsidized Subsidized Unsubsidized ($530) Work-Study GI Bill Loan Tax Benefits Grant or Loans Loans ($1600) Veterans ($2810)
($1390) ($4010) Unsubsidized ($3850) ($7220) Benefits Loans ($15310)
($8800)
Federal Aid Programs (with Average Aid per Recipient)
NOTES Data on tax benefits are estimated for 2016-17 FSEOG and FWS amounts represent federal funds only Institutions provide matching funds so the awards that students receive under these programs are larger than these federal aid amounts Perkins Loans are made from revolving funds on campus No new federal outlays have been provided since 2005-06 but originally the funds came partly from the federal government and partly from institutional sources
SOURCES See page 34 for a list of sources of data on federal aid programs
FIGURE 8 Percentage Distribution of Federal Aid Funds by Sector 2016-17
Public Two-Year Public Four-Year Private Nonprofit For-Profit
Pell Grants
FSEOG
Federal Work-Study
Perkins Loans
Direct Subsidized Loans
Direct Unsubsidized Loans
Parent PLUS Loans
Grad PLUS Loans
34 35
31
36
1 2
33
41
12
16 15
5
24
18
50 48
13 45
6 41
1
26
38
16
16
50
26
42
68
7
6
Percentage of Aid
NOTES Excludes aid to students enrolled in public less-than-two-year colleges and to studentsenrolled in foreign institutions Percentages may not sum to 100 because of rounding
SOURCES See page 34 for a list of sources of data on federal aid programs
In 2017-18 an estimated 601000 students receivedFederal Work-Study (FWS) funding
In 2017-18 the total number of borrowers in the subsidized and unsubsidized Direct Loan programs was 79 millionmdashless than the sum of the number of recipients in each program because about two-thirds of all borrowers participated in both programs
In 2016-17 public two-year college students who made up 32 of full-time equivalent (FTE) undergraduate enrollment received 34 of Pell Grant funds Students in this sector received less than their proportionate share of funds from all other federal student aid programs
In 2016-17 students in the private nonprofit sectoraccounted for 18 of undergraduate and 22 oftotal postsecondary FTE enrollment They received 68 of Grad PLUS 48 of Perkins Loans and 41of FWS funds
ALSO IMPORTANT
Pell Grants FSEOG and Direct Subsidized Loans are for undergraduates only Grad PLUS Loans are for graduate students only Parent PLUS Loans are for parents of undergraduate students FWS PerkinsLoans Direct Unsubsidized Loans and Post-911 GI Bill benefits are available to both undergraduate and graduate students
The number of students receiving FWS funds declined from 698000 in 2007-08 to 601000 in 2017-18 (Table 5 online)
In 2012-13 41 of Post-911 GI Bill veterans benefits went to students in the for-profit sector (US Senate HELP Committee 2014 ldquoIs the New GI Bill Workingrdquo) In 2017 Congress passed legislation known as the ldquoForever GI Billrdquo increasing the generosity of education benefits for veterans
Distribution of Fall 2016 Enrollment by Sector
FTE Undergraduate Students
All FTE Students
Public Two-Year 32 27
Public Four-Year 42 43
Private Nonprofit Four-Year
For-Profit
18
ensp7
22
ensp7
SOURCE NCES IPEDS Enrollment data
For detailed data behind the graphs and additional information please visit trendscollegeboardorg 16
Federal Loans Annual BorrowingAfter a decade of rapid growth in annual borrowing total federal loans to undergraduate students declined by 23 between 2012-13 and 2017-18 after adjusting for inflation and federal loans to graduate students rose by 2
FIGURE 9A Total Annual Amount Borrowed from Federal Subsidized Unsubsidized and PLUS Loans in Millions of 2017 Dollars 2002-03 to 2017-18 Selected Years
$80000 PLUS $71730
Tota
l Ann
ual A
mou
nt B
orro
wed
in M
illio
ns o
f 201
7 D
olla
rs
$60000
$40000
$20000
$0
$38200
$50210 $55520
$18050
$28820
$36940 $37580
2002-03 2007-08 2012-13 2017-18 2002-03 2007-08 2012-13 2017-18
Undergraduate Graduate
Unsubsidized
Subsidized
FIGURE 9B Average Annual Amount Borrowed in Federal Subsidized Unsubsidized and PLUS Loans in 2017 Dollars 2002-03 to 2017-18 Selected Years
$6320
$19820 $20490
$6360
$19280
$6790
$18860
$6570
Graduate
Undergraduate
2017-18
2012-13
2007-08
2002-03
$11750
$19960
$13480
$23480
$16090
$24810
$16450
Undergraduate
$0
PLUS
Su
bsid
ized
and
Unsu
bsid
ized
Graduate
$0 $5000 $10000 $15000 $20000 $25000 $30000
Average Annual Amount Borrowed in 2017 Dollars per Borrower
Number of Borrowers (in Thousands) 2002-03 to 2017-18 Selected Years
2002-03 2007-08 2012-13 2017-18
Subsidized and Unsubsidized Undergraduate 5003 6473 9024 6504
Graduate 881 1272 1495 1446
Total 5884 7745 10519 7950
PLUS
Undergraduate 563 671 652 779
Graduate 0 181 346 416
Total 563 852 998 1195
The share of federal education loans going to graduate students (who constitute about 14 of all postsecondary students) rose from 32 ($181 billion out of $563 billion in 2017 dollars) in 2002-03 to 40 ($376 billion out of $931 billion) in 2017-18
In 2017-18 undergraduates taking subsidized andor unsubsidized Direct Loans borrowed an average of $6570mdash$210 more (in 2017 dollars) than a decade earlier and $220 less than in 2012-13
The number of parents borrowing Parent PLUS Loans in 2017-18 was 12 of the number of undergraduates taking subsidized and unsubsidized Direct Loans (779000 vs 65 million) However the average parent loan was $16450 25 times as much as the average undergraduate student loan
In 2017-18 416000 graduate students borrowed through the Grad PLUS program 14 million borrowed unsubsidized Direct Loans The average amount borrowed through the PLUS program was $5950 higher than the average Direct Loan ($24810 vs $18860)
ALSO IMPORTANT
The aggregate federal student loan limit for dependent undergraduate students is $31000 No more than $23000 can be subsidized loans Independent students and dependent students whose parents are not eligible for Parent PLUS Loans can borrow an additional $26500 in unsubsidized loans
Graduate and professional students can borrow up to a lifetime total of $138500 from the subsidized and unsubsidized loan programs including their undergraduate borrowing Each year students are enrolled they can borrow up to the full cost of attendance including living expenses and books and supplies in addition to tuition and fees through the Grad PLUS program
Like the Grad PLUS program the Parent PLUS program allows borrowing to cover studentsrsquo entire budgets less other aid received for an unlimited number of years of enrollment
NOTE Graduate students became eligible to borrow PLUS Loans in 2006-07
SOURCE Trends in Student Aid website (trendscollegeboard org) Table 6
For detailed data behind the graphs and additional information please visit trendscollegeboardorg 17
Annual Undergraduate Borrowing Parent PLUS and Private Loans In 2015-16 parents of 9 of dependent undergraduate students borrowed through the Parent PLUS program The shares of parents taking these loans ranged from less than 1 of dependent public two-year college students to 21 of dependent for-profit college students
FIGURE 10A Share of Dependent Undergraduate Students with Parent PLUS Loans 1999-00 to 2015-16
1999-00 2003-04 2007-08 2011-12 2015-16
0
10
20
Shar
e of
Dep
ende
nt U
nder
grad
uate
sw
ith P
aren
t PLU
S Lo
ans
6 7 9 97 86 9 12
12
13
12
14
19
17
05
03
04 1 06
24
29
21
25
21
30
All Public Four-Year Private Nonprofit Public Two-Year For-Profit Four-Year
Average Parent PLUS Loans Among Borrowers (2016 Dollars)
1999-00 2003-04 2007-08 2011-12 2015-16
All $9800 $11300 $11700 $12700 $14000
Public Four-Year $8600 $9800 $10500 $11700 $12800
Private Nonprofit Four-Year $12100 $14300 $15300 $15500 $17500
Public Two-Year mdash $6900 $5100 $9100 $7700
For-Profit $8200 $11000 $9900 $11900 $12600
FIGURE 10B Share of Undergraduate Students with Private Loans 1999-00 to 2015-16
1999-00 2003-04 2007-08 2011-12 2015-16 40
Shar
e of
Und
ergr
adua
tes
with
Pr
ivat
e Lo
ans
30
20
10
3 14
6 65 53 14
7 8 11
8 25
12
12
12
5 40
12
642 2106
0 All Public Four-Year Private Nonprofit Public Two-Year For-Profit
Four-Year
Average Private Loans Among Borrowers (2016 Dollars)
1999-00 2003-04 2007-08 2011-12 2015-16
All $7000 $7500 $7000 $6100 $8700
Public Four-Year $5400 $6800 $6700 $5700 $7800
Private Nonprofit Four-Year $8400 $10000 $10100 $8200 $12400
Public Two-Year $5500 $4100 $3800 $3300 $4100
For-Profit $8400 $7000 $6600 $6300 $8100
SOURCES NCES NPSAS 2000 2004 2008 2016 calculations by the authors
For detailed data behind the graphs and additional information please visit trendscollegeboardorg
The average annual amount borrowed through the Parent PLUS program has increased over time in all sectors except public two-year colleges At private nonprofit colleges and universities these loan amounts rose from an average of $12100 (in 2016 dollars) for 12 of dependent students in 1999-00 to $15300 for 14 of dependent students in 2007-08 and to $17500 for 17 of dependent students in 2015-16
The share of undergraduate students taking private student loans fell from 14 in 2007-08 to 6 in both 2011-12 and 2015-16
In 2007-08 40 of undergraduates at for-profit institutions took private student loans but that share had fallen to 6 by 2015-16mdashlower than the 12 at private nonprofit four-year and the 8 at public four-year colleges in 2015-16
In 2015-16 the average size of private student loans among the students who used them ranged from $4100 for 2 of public two-year college students to $12400 for 12 of private nonprofit four-year college students
ALSO IMPORTANT
Among 2015-16 bachelorrsquos degree recipients 20 of dependent studentsrsquo parents had borrowed PLUS loans at some point during the studentsrsquo undergraduate study Of those who borrowed Parent PLUS Loans the average cumulative amount borrowed was $36800 (NPSAS 2016 calculations by the authors)
Among 2015-16 bachelorrsquos degree recipients 16 had borrowed private loans at some point during their undergraduate study Of those who borrowed private loans the average cumulative amount borrowed was $21300 (NPSAS 2016 calculations by the authors)
In addition to using Parent PLUS Loans parents may borrow through home equity loans credit cards or other sources of credit This borrowing is not reflected in the data reported here
Private student loans do not carry the borrower protections included in federal student loan programs including the option of repaying through income-driven plans that base monthly payments on earnings Like federal student loans private loans are more difficult to discharge in bankruptcy than other personal loans
18
Federal Loans Borrowing and BalancesAs of March 2018 40 of the outstanding federal education loan debt was held by the 9 of borrowers owing $80000 or more
FIGURE 11 Distribution of Borrowers and Debt by Outstanding Balance 2018
18 PercentageLess than $5000
1 of Borrower
17 Percentage$5000 to $9999
4 of Debt
Out
stan
ding
Bor
row
er D
ebt B
alan
ce 21 $10000 to $19999
10
21$20000 to $39999
19
9$40000 to $59999
14
5$60000 to $79999
12
3$80000 to $99999
7
4 $100000 to $199999
19
2$200000 or More 14
s
NOTE Includes both loans made under the Federal Direct Loan Program (FDLP) and loans made under the Federal Family Education Loan (FFEL) Program which ended in 2009-10 Data were as of March 31 2018 the end of the second quarter of FY18
SOURCE US Department of Education Federal Student Aid Center Federal Student Loan Portfolio
FIGURE 12 Percentage of Undergraduate Students Borrowing Federal Subsidized and Unsubsidized Student Loans 2007-08 2012-13 and 2017-18
No Stafford Subsidized Unsubsidized Both Subsidized and Loans Only Only Unsubsidized Loans
2017-18
ar
eYc i
me
2012-13
adcA
2007-08
Percentage of Undergraduate Students
NOTES IPEDS headcount enrollments are adjusted for the difference between total headcount which counts students more than once if they are enrolled in more than one institution at the same time and unduplicated headcount reported by the National Student Clearinghouse (NSC) Twelve-month undergraduate headcount for 2017-18 is estimated from NSC data Percentages may not sum to 100 because of rounding
SOURCES NCES Postsecondary Institutions and Cost of Attendance in 2017-18 Degrees and Other Awards Conferred 2016-17 and 12-Month Enrollment 2016-17 First Look (Preliminary Data) and earlier editions National Student Clearinghouse Current Term Enrollment Estimates Spring 2018US Department of Education Federal Student Aid Data Center Title IV Program Volume Reports and Aid Recipients Summary calculations by the authors
For detailed data behind the graphs and additional information please visit trendscollegeboardorg
As of March 2018 56 of borrowers owed less than $20000 These borrowers held 15 of the outstanding federal debt
In 2017-18 71 of undergraduates did not borrow either subsidized or unsubsidized Stafford Loans That percentage was 70 in 2007-08 and 63 in 2012-13
In 2017-18 5 of undergraduate students borrowed subsidized loans only 5 borrowed unsubsidized loans only and 19 borrowed from both programs In other words two-thirds of the 29 who borrowed Stafford Loans took both subsidized and unsubsidized loans
A decade earlier in 2007-08 12 of undergraduates borrowed only subsidized loans Among the 29 who borrowed less than half of the students borrowed both subsidized and unsubsidized loans
ALSO IMPORTANT
Figure 12 shows that 29 of undergraduates took federal student loans in 2017-18 This percentage is lower than the share of students who graduate with debt for a number of reasons Many students who borrow do not borrow every year In 2015-16 among enrolled students who had borrowed at some point as undergraduates 70 borrowed federal student loans (NPSAS 2016)
Part-time students borrow at lower rates than full-time students In 2015-16 half of all full-time undergraduates used federal student loans compared with just 18 of those who were enrolled exclusively part time (NPSAS 2016)
19
5 5 19
7 9
71
63
70
22
12 4 13
In March 2018 borrowers in IDR plans held 49 of the outstanding debt in repayment under the federal
Direct Loan program up from 27 in 2014
Outstanding Federal LoansParticipation in Income-Driven Repayment (IDR) plans for federal student loans has grown dramatically in recent years In March 2018 29 of the borrowers in repayment on federal Direct Loans were in programs limiting their payments to an affordable percentage of their discretionary incomes up from 13 in 2014
FIGURE 13A Distribution of Outstanding Federal Direct Loan Dollars and Borrowers by Repayment Plan Second Quarter 2014 2016 and 2018
60
40
20
0
2014 2016 2018
911
10
13
13
12
14
12
14
27
41
49
13
23
29
42
33
26
64
54
47
13
18
13
Dollars Borrowers Dollars Borrowers Dollars Borrowers Dollars Borrowers Income Driven Level Payments Level Payments Graduated Payments
10 Years or Less More Than 10 Years or Alternative
Repayment Plan
NOTES Includes Direct Loan borrowers in repayment deferment and forbearance Because some borrowers have multiple loans recipients may be counted multiple times across varying loan statuses Income-driven plans include REPAYE Pay As You Earn Income-Contingent Repayment and Income-Based Repayment Level payment plans require monthly payments that are the same over a fixed period of time Alternative repayment plans are customized to borrowersrsquo circumstances Under the graduated payment plan monthly payments increase over time The second quarter of FY18 ended on March 31 2018 Percentages may not sum to 100 because of rounding
SOURCE US Department of Education Federal Student Aid Data Center Federal Student Loan Portfolio
FIGURE 13B Repayment Status of Federal Education Loan Portfolio Second Quarter FY18
45
54
18
12
9
11
7
10
3
2
17
11
Percentage of BorrowersPercentage of Dollars
Default
Grace
Forbearance
Deferment
Repa
ymen
t Sta
tus
In-School
Repayment
NOTES Includes both loans made under the Federal Direct Loan Program and loans made under the Federal Family Education Loan Program (FFEL) and held by the US Department of Education Excludes the $200 billion in outstanding FFEL loans not held by the federal government The second quarter of FY18 ended on March 31 2018
SOURCE US Department of Education Federal Student Aid Data Center Federal Student Loan Portfolio
In March 2018 17 of borrowersmdashbut 11 of outstanding dollarsmdashwere in default The average balance on defaulted loans was $18600 compared with $29200 for all outstanding loans
ALSO IMPORTANT
Borrowers in IDR plans have higher average balances than those in other repayment plansmdash$56200 vs $24000 in March 2018
There are several IDR plans Just over 40 of borrowers in IDR plans are in the Income-Based Repayment plan which after July 2014 limits payments for new borrowers to 10 of income above 150 of the poverty line and forgives remaining debt after 20 years of eligible payments Earlier borrowers pay 15 of income above 150 of the poverty line for 25 years
Revised Pay As You Earn (REPAYE) launched in 2015makes all federal Direct Loan borrowers eligible for IDR plans In March 2018 among IDR plans about30 of borrowers and 30 of the dollars were in the REPAYE plan
Average Federal Loan Balance Number of Borrowers andTotal Balance by Repayment Status Second Quarter 2018
Repayment
In-School
Average Balance
$34600
$19800
Number of Borrowers (in Millions)
186
72
Total Balance (in Billions)
$6430
$1425
Deferment $33200 38 $1263
Forbearance $42600 28 $1193
Grace $19300 13 $251
Default $18600 70 $1303
Other $32000 03 $96
Total $29200 410 $11961
NOTE Repayment in active repayment status In-School borrower is still enrolled never entered repayment Deferment payments postponed because of economic hardship military service or returning to school Forbearance payment temporarily suspended or reduced because of financial hardships Grace six-month period after borrower is no longer enrolled at least half time Default more than 360 days delinquent ldquoOtherrdquo category includes loans that are in non-defaulted bankruptcy and in a disability status
For detailed data behind the graphs and additional information please visit trendscollegeboardorg 20
Completers had higher repayment rates than noncompleters in all sectors but completers from the for-profit sector had lower repayment rates than noncompleters from the public and private nonprofit four-year sectors
In all sectors dependent students had higher repayment rates than independent students Repayment rates ranged from 30 for independent students from the for-profit sector and 38 for those from publi c two-year colleges to 67 for dependent students from the private nonprofit four-year sector and 69 for those from the public four-year sector
Borrowers can be in good standing without paying down the principal owed They may be enrolled in an Income-Driven Repayment (IDR) plan Some may have no requ ired payments and for others the required payments may be too small to cover the interest charged leading to increases in the balance owed In addition borrowers may be in deferment or forbearance and not required to make payments in their current circumstances
Completers Noncompleters
68 Public Two-Year
39
79Public Four-Year
54
Sect
or
Sect
or 80Private NonprofitFour-Year 54
43For-Profit 26
67All 41
Dependent Independent
52Public Two-Year
38
69Public Four-Year 55
67Private NonprofitFour-Year 52
41For-Profit 30
65All 46
0 20 40 60 80 Repayment Rate
Federal Student Loan Five-Year Repayment Rate by Completion Status and by Dependency Status Borrowers Entering Repayment in 2009-10 and 2010-11
FIGURE 14B Federal Student Loan One-Year Three-Year Five-Year and Seven-Year Repayment Rates by Sector Borrowers Entering Repayment in 2007-08 and 2008-09
1-Year 3-Year 5-Year 7-Year
45 47
50 53
62
65 68
71
63
31
33 36
41
50 53
57 62
66 69
72
0
20
40
60
Repa
ymen
t Rat
e
Public Public Private Nonprofit For-Profit All Two-Year Four-Year Four-Year
Federal Loans Repayment RatesSixty-seven percent of federal student loan borrowers who entered repayment in 2009-10 and 2010-11 after earning a degree or certificate had paid down at least one dollar of their loan principal after five years This repayment rate was 41 for noncompleters
FIGURE 14A
In all sectors the share of borrowers who have made some progress paying down their student debt increases as time in repayment increases The largest increments are for borrowers from for-profit institutions where the repayment rate for borrowers who entered repayment in 2007-08 and 2008-09 rose from 31 after one year to 41 after seven years
After seven years 41 of borrowers from for-profitinstitutions had reduced their loan balances by at least one dollar This repayment rate was lower thanthe one-year repayment rates in all other sectorsincluding public two-year colleges where therepayment rate rose from 45 after one year to53 after seven years
ALSO IMPORTANT
NOTES The repayment rate is defined as the percentage of borrowers in each repayment cohort whose payments reduced the loan principal by at least one dollar after the specified number of years Repayment status on each loan is attributed to the school for which the loan was taken Therefore a student can be counted in the repayment cohorts of more than one institution
SOURCES US Department of Education College Scorecard data calculations by the authors
For detailed data behind the graphs and additional information please visit trendscollegeboardorg 21
In 2016-17 average debt per bachelorrsquos degree recipient including both those who borrowed and those who did not was $16700 for the two sectors combined 1 higher than in 2011-12
Students who earn their bachelorrsquos degrees at for-profit institutions not included in Figure 15 are more likely to borrow and accumulate higher average levels of debt than those who graduate from public and private nonprofit four-year colleges (Figure 16)
Figure 15 includes only students who earned their bachelorrsquos degrees at the institutions in which they first enrolled Students who attend two or more institutions may have different borrowing patterns
$15
200
$26
200
$15
500
$26
900
$11
200
$21
600
$12
400
$22
500
Private Nonprofit Four-Year
162
00
254
00
199
00
300
00
203
00
317
00
326
00
$20
000
Per Borrower Per Degree Recipient
Public Four-Year
Aver
age
Cum
ulat
ive
Deb
t in
2017
Dol
lars
Av
erag
e Cu
mul
ativ
e D
ebt i
n 20
17 D
olla
rs
$30000
$20000
$10000
$0 2001-02 (52) 2006-07 (55) 2011-12 (58) 2016-17 (58)
Academic Year (Percentage of Graduates Who Borrowed)
$30000
$20000
$10000
$$ $$ $$ $$0 2001-02 (64) 2006-07 (66) 2011-12 (64) 2016-17 (61)
Academic Year (Percentage of Graduates Who Borrowed)
Average Cumulative Debt Levels in 2017 Dollars Bachelorrsquos Degree Recipients at Public and Private Nonprofit Four-Year Institutions 2001-02 to 2016-17 Selected Years
Cumulative Debt Bachelorrsquos Degree RecipientsIn 2016-17 the 59 of bachelorrsquos degree recipients from public and private nonprofit institutions who borrowed graduated with an average of $28500 in debt an increase of 3 in inflation-adjusted dollars over the average amount borrowed in 2011-12
FIGURE 15
Average debt among public four-year college graduate borrowers rose by 3 ($700 in 2017 dollars) between 2011-12 and 2016-17 following a 16 ($3700) increase over the previous five years Average debt per graduate (including those who did not borrow) increased by 23 ($2800) between 2006-07 and 2011-12 and by 2 ($300) between 2011-12 and 2016-17
Borrowing among private nonprofit four-year college graduates rose rapidly between 2001-02 and 2006-07 but slowed over the next 10 years Average debt per borrower increased by 6 ($1700 in 2017 dollars) between 2006-07 and 2011-12 and by 3 ($900) between 2011-12 and 2016-17 Average debt per graduate rose by 2 ($400) between 2006-07 and 2011-12 and fell by 1 ($300) between 2011-12 and 2016-17
The share of public four-year college bachelorrsquos degree recipients graduating with debt rose from 52 in 2001-02 to 58 in 2011-12 but remained at 58 in 2016-17 The share of private nonprofit four-year college bachelorrsquos degree recipients graduating with debt rose from 64 in 2001-02 to 66 in 2006-07 but fell to 61 over the following decade
ALSO IMPORTANT
NOTES Figures include federal and nonfederal loans taken by students who began their studies at the institution from which they graduated Parent PLUS loans are not included The orange bars represent the average cumulative debt levels of bachelorrsquos degree recipients who took student loans The blue bars represent the average debt per bachelorrsquos degree recipient including those who graduated without student debt Calculations are based on the number of bachelorrsquos degrees awarded which typically exceeds the number of students receiving degrees The available data are not adequate to allow comparable calculations for for-profit institutions
SOURCES College Board Annual Survey of Colleges 2002 to 2017 calculations by the authors
Average Cumulative Debt in 2017 Dollars Bachelorrsquos Degree Recipients at Public and Private Nonprofit Four-Year Institutions 2001-02 to 2016-17 Selected Years
Percentage with Debt
Average Debt per Borrower
Average Debt per Graduate
2001-02 56 $23000 $12800
2006-07 58 $25000 $14600
2011-12 60 $27800 $16600
2016-17 59 $28500 $16700
For detailed data behind the graphs and additional information please visit trendscollegeboardorg 22
Half of the students who completed associate degrees in 2015-16 graduated without taking student loans This included 59 of those who graduated from public two-year colleges and 12 of those who earned their degrees from for-profit institutions
In 2015-16 non-degree-granting for-profit institutions granted 30 of all undergraduate certificates Among students completing these programs 15 did not take student loans and 17 borrowed $20000 or more More than half of certificate completers who attended public two-year institutions graduated without debt and 15 borrowed $20000 or more
Undergraduate certificate programs are short-term programs that prepare students for gainful employment in a recognized occupation To qualify for federal financial aid they must meet program hour specifications
In 2015-16 24 of the 39 million undergraduate credentials conferred were certificates 26 were associate degrees and 50 were bachelorrsquos degrees (NCES Digest of Education Statistics 2017Table 31840)
Bachelorrsquos Degree Recipients
No Debt $1 to $10000 to $20000 to $30000 to $40000 to $50000
All
Public Four-Year (60)
Private NonprofitFour-Year (27)
For-Profit (9)
All
Public Two-Year (82)
For-Profit (11)
All
Public Two-Year (33)
Public Non-Degree-Granting (9)
Private Nonprofit Two-Year or Less (6)
For-Profit Two-Year or More (19)
For-Profit Non-Degree-Granting (30)
$9999 $19999 $29999 $39999 $49999 or More
29 11 13 17 12 8 11
31 11 14 18 12 6 7
13 8 11 15
28 12 19 9 12 8 12
7 14 32
Associate Degree Recipients
No Debt $1 to $10000 to $20000 to $30000 to $40000 $9999 $19999 $29999 $39999 or More
51 13 5 5 17 10
3
1859 12
3
7
12 12 19 25 17 16
Certificate Recipients
No Debt $1 to $10000 to $20000 to $30000 $9999 $19999 $29999 or More
33 21
8
8 30 9
52 22 11 7
3
19
3
69 6
17 32
17 29
29 14
34 11
15 38 30 10 7
9
8
Cumulative Debt Undergraduate Degree RecipientsThe share of 2015-16 bachelorrsquos degree recipients who borrowed $50000 or more for their undergraduate studies ranged from 7 of those who earned their degrees at public four-year colleges and universities to 32 of those who graduated from for-profit institutions
FIGURE 16 D istribution of 2015-16 Degree or Certificate Completers by Cumulative Amount Borrowed for Undergraduate Study
ALSO IMPORTANT
Average debt by type of degree conceals considerable variation across borrowers of different backgrounds For example among bachelorrsquos degree recipients 11 of dependent students borrowed $40000 or more while 28 of independent students borrowed this much And among dependent students the share of students borrowing to fund their bachelorrsquos degrees goes down as family incomes go up
NOTES Percentages in parentheses on vertical axes represent the share of students earningtheir credentials in the specified sectors These percentages do not sum to 100 because a smallpercentage of students earn degrees at institutions not included in the sectors reported Forexample the bachelorrsquos degree graph excludes students who earned their bachelorrsquos degrees at public and private nonprofit two-year schools and the associate degree and certificate graphsexclude students who earned their credentials at public and private nonprofit four-year schools
SOURCES NCES National Postsecondary Student Aid Study (NPSAS) 2016 calculations by the authors
For detailed data behind the graphs and additional information please visit trendscollegeboardorg 23
The share of masterrsquos degree recipients who did not borrow for graduate school ranged from a low of 21 at for-profit institutions to a high of 42 at public universities
More than half of public university doctoral degree recipients avoided borrowing for graduate school while 12 borrowed $100000 or more
Sixteen percent of 2015-16 doctoral degree recipients earned their degrees at for-profit institutions 51 of these students borrowed $100000 or more for graduate school
More than one-quarter of students who earned professional degrees at private nonprofit universities in 2015-16 borrowed $200000 or more for graduate study as did 9 of those who graduated with professional degrees from public universities
In 2016 median earnings among adults 25 and older were $91600 for those with doctoral degrees and $100100 for those with professional degrees (US Census Bureau Table PINC-03)
All
Public (47)
Private Nonprofit (43)
For-Profit (10)
All
Public (52)
Private Nonprofit (32)
For-Profit (16)
All
Public (42)
Private Nonprofit (53)
For-Profit (4)
Masterrsquos Degree Recipients
No Debt $1 to $25000 to $50000 to $75000 to $100000 $24999 $49999 $74999 $99999 or More
38 21 20 12 4 5
42
3
24 19 10
2
38 18 19 14 5 6
21 31 7 8 20 13
Doctoral Degree Recipients
No Debt $1 to $50000 to $100000 to $150000 $49999 $99999 $149999 or More
42 21 16 13
55
7
6
6 19 14 6
35 30 18 11
15 13 21 38 13
Professional Degree Recipients
No Debt $1 to $50000 to $100000 to $150000 to $200000$49999 $99999 $149999 $199999 or More
21 13 15 16 14 20
20 17 20 23 10 9
24 10 11 10 17 28
7 12 13 18 22 28
Cumulative Debt Graduate Degree RecipientsIn 2015-16 5 of masterrsquos degree recipients 20 of doctoral degree recipients and 50 of professional degree recipients borrowed $100000 or more to fund their graduate school study
Distribution of 2015-16 Advanced Degree Recipients by Cumulative Amount Borrowed for Graduate Study
ALSO IMPORTANT
Almost three-quarters of graduate-level credentials earned are masterrsquos degrees 12 are professional degrees 5 are research doctoral degrees and the remaining credentials are post-baccalaureate certificates (NPSAS 2016)
Professional degrees include those in chiropractic medicine dentistry law medicine optometry osteopathic medicine pharmacy podiatry and veterinary medicine
NOTES Includes all loans borrowed for graduate study Percentages on the vertical axis represent shares of graduates from each sector Percentages may not sum to 100 because of rounding
SOURCES NCES National Postsecondary Student Aid Study (NPSAS) 2016 calculations by the authors
For detailed data behind the graphs and additional information please visit trendscollegeboardorg 24
FIGURE 17
Federal VeteransDepartment State Institutional Private and (Nonmilitary) of Defense Employer
Public Four-Year
All Full-Time 7 20 31 13 $7300Students
Independent 21 13 17 9 $8460Students (17)
Dependent 14 $7060Students (83)
3
Less than 25 20 8 $11700$35000 (26)
$35000 to 25 33 11 $8280$69999 (21)
7 3 $70000 to
21 $4830$119999 (25)
39
27 21 35
46
28
17 53
57
30
3 10 $120000 or
25 $3810Higher (28) 7
$0 $2000 $4000 $6000 $8000 $10000 $12000
Public Two-Year
8 All Full-Time
$4680Students 10
4 Independent
27 $5750Students (34)
56 12 14
54 10
57 17 14
75 14
53 19 15
45
11 4 Dependent
$4130Students (66)
6 Less than
$6550$35000 (36) 11 5
$35000 to $3710$69999 (29)
3 $70000 to
27 37 26 $1980$119999 (24) 7 14$120000 or
36 $2140Higher (12) 4
$0 $2000 $4000 $6000 $8000 $10000 $12000
Dep
ende
nt S
tude
nts
D
epen
dent
Stu
dent
s
Pare
ntsrsquo
Inco
me
Pare
ntsrsquo
Inco
me
Sources of Grant Aid Public Institutions In 2015-16 full-time students received an average of $7300 in grant aid at public four-year institutions and $4680 at public two-year institutions
FIGURE 18 Sources of Grant Aid Full-Time Students at Public Institutions 2015-16
NOTES Includes full-time undergraduate students who were US citizens or permanent residents Percentages may not sum to 100 because of rounding
SOURCES NCES NPSAS 2016 calculations by the authors
At both public four-year and public two-yearinstitutions full-time independent studentsreceived more grant aid on average than dependentstudents Independent students received lessfunding from state institutional and private and employer grants but more from federal grants andparticularly veterans and military grants
At public four-year colleges and universitiesdependent students from families with incomes lessthan $35000 received almost half of their grant aid from the federal government Those from familieswith incomes of $70000 or more received very little federal aid more than half of the grant aid these students received came from their institutions
At public two-year colleges dependent students from families with incomes less than $35000 received three-quarters of their grant aid from the federal government Institutional grant aid in this sector was skewed toward more affluent students with average grants ranging from $230 per independent student and $380 per dependent student from families with incomes less than $35000 to $970 for those from families with incomes of $120000 or higher
ALSO IMPORTANT
In 2015-16 public doctoral universities awarded institutional aid averaging $5750 to 43 of their full-time domestic undergraduate studentsmdashanaverage of $2490 per student Public nondoctoral universities awarded institutional aid averaging $3730 to 30 of their full-time domestic undergraduatestudentsmdashan average of $1110 per student
Students from higher-income families attending public four-year institutions are more likely than those from lower-income families to attend doctoral universities In 2015-16 76 of dependent students from thelowest family income quartile attended doctoral universities and 24 attended non-doctoral-grantinginstitutions Among those from the highest income quartile these shares were 85 and 15 respectively
For detailed data behind the graphs and additional information please visit trendscollegeboardorg 25
Average total grant aid for independent students at private nonprofit institutions was only about 60 of the average amount received by dependent students in 2015-16 Independent students received more funding from federal grants including aid to veterans and the military but less from states from private sources and employers and particularly from institutions
Federal VeteransDepartment State Institutional (Nonmilitary) of Defense
Private Nonprofit Four-Year
3 All Full-Time
10 5 74 8 $19050Students
6 Independent
24 19 43 8 $11890Students (20)
Dependent8 5 78 8 $20780Students (80)
Less than 22 8 63
Private and Employer
6 $26220$35000 (19)
$35000 to10 7 77 6 $24710$69999 (20) 2
$70000 to86 7 $20900$119999 (23)
4 $120000 or
85 11 $15860Higher (38) 2
$0 $5000 $10000 $15000 $20000 $25000 $30000
For-Profit
4 All Full-Time 33 6 $8400Students
Independent40 6 $8820Students (75)
3 Dependent
8 $7160Students (25)
4 Less than
6 $8940$35000 (49)
$35000 to9 $6650$69999 (28)
2 4$70000 to
19 58 17 $5070$119999 (14)
42 15
41 10
45 7 9 31
9 21
34 10 10 38
78
59
7 13 $120000 or
$2490Higher (9) 2
$0 $2000 $4000 $6000 $8000 $10000
Dep
ende
nt S
tude
nts
D
epen
dent
Stu
dent
s
Pare
ntsrsquo
Inco
me
Pare
ntsrsquo
Inco
me
FIGURE 19 Sources of Grant Aid Full-Time Students at Private Institutions 2015-16
Sources of Grant Aid Private Institutions In 2015-16 low-income students enrolled full time at private nonprofit four-year colleges and universities received 63 of their total grant aid from their institutionsmdashan average of $16590 per student out of a total of $26220 of grant aid from all sources
NOTES Includes full-time undergraduate students who were US citizens or permanent residents Percentages may not sum to 100 because of rounding
SOURCES NCES NPSAS 2016 calculations by the authors
Students from families with incomes of $120000 or higher received 85 of their total grant aid from their institutionsmdashan average of $13510 per student out of a total of $15860
In 2015-16 full-time students at for-profit institutions received 42 of their grant aid from federal nonmilitary grants 33 from veterans and military grants and 15 from their institutions
Average institutional grant aid per student in thefor-profit sector ranged from $910 for independentstudents and $1920 for dependent students fromfamilies with incomes below $35000 to $2920 for those with incomes between $70000 and $120000
ALSO IMPORTANT
In 2015-16 very selective private nonprofit four-year institutions awarded 73 of their full-time domestic students an average of $24340 in grant aidmdashan average of $17670 per student Forty-five percentof dependent students from families with incomes of $120000 or more enrolled in the private nonprofit sector attended these very selective institutions as did 25 to 30 of those from lower-income families and 21 of independent students (Selectivity is defined by NPSAS based on the share of students admitted and SATregACT scores)
Minimally selective and open admission four-year private nonprofit institutions awarded 43 of their full-time students an average of $11450 in grant aidmdashan average of $4910 per student Four percent of dependent students from families with incomes of $120000 or more enrolled in the private nonprofit sector attended these institutions compared with 20 of those from the lowest-income families and 34 of independent students in this sector
For detailed data behind the graphs and additional information please visit trendscollegeboardorg 26
The number of undergraduates declined by26 million (10) between 2011-12 and 2017-18 The number of Pell Grant recipients declined by24 million (26) over these six years
Number of Recipients (in Millions)
Total Pell Expenditures (in Billions) $50 10
Tota
l Pel
l Exp
endi
ture
s in
Bill
ions
of 2
017
Dol
lars
Num
ber of Pell Recipients (in Millions)$10
$20
$30
$40$40
2
4
6
8
$61
20
$61 $81
$108 $97
$158 $172
$343
$282
25 29
40 37
48
55
90
70
$0 0 77-78 82-83 87-88 92-93 97-98 02-03 07-08 12-13 17-18
Year
1977-78
Percentage of Recipients Who Were Independent
39
1987-88 58
1997-98 57
2007-08 58
2012-13 58
2013-14 56
2014-15 55
2015-16 53
2016-17 51
12-Month Undergraduate Headcount Enrollment Pell Recipients
252246 24725
0
10
219 232
241 236 232 227 224 222
17-1816-1715-1614-1513-1412-1311-1210-1109-1008-0907-08
25 26 33 37 38 37 37 36 34 32 32
5
20
Mill
ions
of S
tude
nts
15
Pell Grants The share of undergraduate students receiving Pell Grants rose from 25 in 2007-08 to a peak of 38 in2011-12 It then declined steadily to 32 in 2017-18
FIGURE 20A Undergraduate Enrollment and Percentage of UndergraduateStudents Receiving Pell Grants 2007-08 to 2017-18
NOTES IPEDS headcount enrollments are adjusted for the difference between total headcount which counts students more than once if they are enrolled in more than one institution at the same time and unduplicated headcount reported by the National Student Clearinghouse (NSC) Twelve-month undergraduate headcount for 2017-18 is estimated from NSC data
SOURCES NCES Postsecondary Institutions and Cost of Attendance in 2017-18 Degrees and Other Awards Conferred 2016-17 and 12-Month Enrollment 2016-17 First Look (Preliminary Data) and earlier editions National Student Clearinghouse Current Term Enrollment Estimates Spring 2018 US Department of Education Federal Pell Grant Program End-of-Year Report 2016-17US Department of Education Federal Student Aid Data Center Title IV Program Volume Reports and Aid Recipients Summary calculations by the authors
FIGURE 20B Total Pell Grant Expenditures and Number of Recipients 1977-78 to 2017-18
Total Pell Grant expenditures increased from $61 billion (in 2017 dollars) in 1977-78 to $97 billion in 1997-98 and to $282 billion in 2017-18 Over the decade from 2007-08 to 2017-18 expenditures spiked from $172 billion in 2007-08 to $401 billion in 2010-11 before falling back to $282 billion in 2017-18
The percentage of Pell Grant recipients who are independent students with eligibility determined bytheir own financial circumstances rather than those of their parents increased from 39 in 1977-78 to 57 in 1997-98 This percentage declined from 58 in 2007-08 and 2012-13 to 51 in 2016-17
ALSO IMPORTANT
Changes in Pell Grant expenditures result from changes in the legislated maximum grant the formula for determining expected family contributions the number of enrolled students the share of students enrolling full time and the financial circumstances of students and families
Percentage of Recipients Who Were Independent 1977-78to 2016-17 Selected Years
SOURCES US Department of Education Federal Pell Grant Program End-of-Year Report 1977-78 through 2016-17US Department of Education Federal Student Aid Data Center Title IV Program Volume Reports and Aid Recipients Summary calculations by the authors
For detailed data behind the graphs and additional information please visit trendscollegeboardorg 27
FIGURE 21A Maximum and Average Pell Grants in 2017 Dollars 1977-78 to 2017-18
Max
imum
and
Ave
rage
Gra
nt in
201
7 D
olla
rs
$3000
$4000
$5000
$6000
Maximum Pell Grant
Average Pell Grant per Recipient
$5620
$3040
$4520
$4120
$5060
$5920
$2800 $2590
$3110
$4010
$2000
$1000
$0 77-78 82-83 87-88 92-93 97-98 02-03 07-08 12-13 17-18
FIGURE 21B Inflation-Adjusted Maximum Pell Grant and Published Prices at Public and Private Nonprofit Four-Year Institutions in 2018 Dollars 1998-99 to 2018-19
$48510 $50000
Public Four-Year Tuition and Fees and Room and
Board
Private Nonprofit Four-Year Tuition and Fees and Room and Board
Private Nonprofit Four-Year Tuition and Fees
$22710
$28430
$35830
$31600
$38720
$21370
$40000
$30000
Public Four-Year Tuition and Fees
$5010 $7560
$10230 $12000
$16470
$5420 $6100
$20000
$10000
$4630 Maximum Pell Grant $0
98-99 00-01 02-03 04-05 06-07 08-09 00-11 12-13 14-15 16-17 18-19
The maximum Pell Grant is the most frequently cited measure of per-student subsidies provided by the program However most students receive smaller grants because they are enrolled part time or because their family incomes and assets reduce their aid eligibility In 2017-18 when the maximum Pell Grant was $5920 the average grant was $4010
The percentage of average public four-year in-state published tuition and fees covered by the maximum Pell Grant declined from 92 in 1998-99 to 72 in 2008-09 and to 60 in 2018-19
In 2016-17 27 of recipients received the maximum grant of $5815 (US Department of Education Federal Pell Grant Program End-of-Year Report 2016-17Table 3A)
Between 2008-09 and 2018-19 published tuition and fees increased by 31 per year at public four-year institutions and by 23 per year at private nonprofit institutions while the maximum Pell Grant increased by 12 per year after adjusting for inflation
Pell Grants The maximum Pell Grant amount which is legislated by Congress has fluctuated over time The $5920 maximum Pell Grant in 2017-18 was 44 higher in inflation-adjusted dollars than it was 20 years earlier but only 5 higher than it was 40 years earlier in 1977-78
The percentage of average private nonprofit four-year published tuition and fees covered by the maximum Pell Grant declined from 20 in 1998-99 to 19 in 2008-09 and to 17 in 2018-19
ALSO IMPORTANT
The maximum Pell Grant for 2018-19 is $6095 about the same as in 2017-18 after adjusting for the 30 increase in the Consumer Price Index
SOURCES US Department of Education Federal Pell Grant Program End-of-Year Report 1977-78 through 2016-17 US Department of Education Federal Student Aid Data Center Title IV Program Volume Reports and Aid Recipients Summary calculations by the authors
2018
Dol
lars
Maximum Pell Grant as a Percentage of Published Prices in 2018 Dollars 1998-99 to 2018-19 Selected Years
Public Four-Year In-State Private Nonprofit Four-Year
Tuition and Fees
Tuition and Fees and
Room and Board
Tuition and Fees
Tuition and Fees and
Room and Board
98-99 92 39 20 15
03-04 87 38 21 16
08-09 72 33 19 14
13-14 64 31 19 14
18-19 60 29 17 13 SOURCES The College Board Trends in College Pricing 2018 Table 2 online US Department of Education Federal Student Aid Data Center
For detailed data behind the graphs and additional information please visit trendscollegeboardorg 28
Distribution of Pell Grant Recipients by Dependency Status and Family Income 2016-17
Independent Without Dependents (21)
Independent with Dependents (30)
Dependent (49)
$9000 or $9001 to $20001 to $40001 to $50001 or Less $20000 $40000 $50000 Higher
53 35 11
21 26
16
32 9
36 12
12
21 15
Percentage of Pell Grant Recipients
41 and Older (7) 517400
31 to 40 (13) 924300
24 to 30 (23) 1678000
20 to 23 (33) 2396600
19 or Younger (23) 1678500
0 05 10 15 20 25 30
Number of Pell Grant Recipients (Millions)(Total = 72 Million)
Pell Grants In 2016-17 56 of Pell Grant recipients were younger than 24 23 were between 24 and 30 and 20 were older than 30
FIGURE 22A Distribution of Pell Grant Recipients by Age 2016-17
NOTES Percentages on the vertical axis represent percentages of recipients in each age groupPercentages may not sum to 100 because of rounding
SOURCE US Department of Education 2016-17 Federal Pell Grant Program End-of-Year ReportTable 11A
FIGURE 22B
NOTES Percentages on the vertical axis represent percentages of recipients in each group Percentages may not sum to 100 because of rounding
SOURCE US Department of Education 2016-17 Federal Pell Grant Program End-of-Year ReportTable 2
In 2016-17 49 of Pell Grant recipients were dependent students 37 of these students camefrom families with incomes of $20000 or less andanother 36 came from families with incomes between $20000 and $40000
Fifty-one percent of 2016-17 Pell Grant recipients were independent students 30 had dependentsof their own and 21 were independent studentswithout dependents
Among independent Pell Grant recipients withdependents 47 had family incomes of $20000or less and another 32 had incomes between$20000 and $40000
Fifty-three percent of independent Pell Grantrecipients without dependents had family incomesof $9000 or less another 35 had incomesbetween $9000 and $20000
ALSO IMPORTANT
The age distribution of Pell Grant recipients in 2016-17 was similar to the age distribution in 1996-97 In both years 56 of recipients were 23 or younger and 20were over age 30 However between 2009-10 and2011-12 about one-quarter of Pell Grant recipients were over the age of 30 (Federal Pell Grant Program End-of-Year Reports 1996-97 and 2016-17)
In 2016-17 63 of Pell Grant recipients had zero expected family contribution (EFC) This included 51 of dependent recipients 63 of independent recipients without dependents and 81 ofindependent recipients with dependents (2016-17 Federal Pell Grant Program End-of-Year Report Table 2)
In 2016-17 12 of dependent recipients received a Pell Grant of less than $1500 and 38 received$5400 or more (2016-17 Federal Pell Grant ProgramEnd-of-Year Report Table 3B)
For detailed data behind the graphs and additional information please visit trendscollegeboardorg 29
FIGURE 23B Need-Based State Grant Aid as a Percentage of Total Undergraduate State Grant Aid by State 2016-17
$820 $800 $750
Non-Need-Based $700$670
$0 76-77 81-82 86-87 91-92 96-97 01-02 06-07 11-12 16-17
Aver
age
Stat
e G
rant
per
FTE
Unde
rgra
duat
e St
uden
t
100
100
100
100
100
100
91
90
91
91
91
90
90
89
88
89
90
90
87
86
85
Need-Based $600
$520
$430 $390$400 $380
$320
$200
83
82
78
76
76
77
74
73
72
72
73
72
73
71
74
75
76
76
76
76
95 99100 100
80 76
60
46
40
20 17
Geo
rgia
Sout
h Da
kota
Arka
nsas
Loui
sian
aSo
uth
Caro
lina
Utah
New
Mex
ico
Neva
daTe
nnes
see
Mon
tana
Alas
kaFl
orid
aW
est V
irgin
iaKe
ntuc
kyM
issi
ssip
piDe
law
are
Mis
sour
iNo
rth
Dako
taO
hio
Unite
d St
ates
Vi
rgin
iaO
klah
oma
Nebr
aska
Iow
aAl
abam
aCo
lora
doNe
w Yo
rkW
ashi
ngto
nM
assa
chus
etts
Wis
cons
inNo
rth
Caro
lina
Indi
ana
Idah
oNe
w J
erse
yM
ichi
gan
Mar
ylan
dCo
nnec
ticut
Min
neso
taPe
nnsy
lvan
iaVe
rmon
tIlli
nois
Calif
orni
aAr
izona
Haw
aii
Kans
asM
aine
Ore
gon
Rhod
e Is
land
Texa
sW
yom
ing
00
Perc
enta
ge o
f Sta
te G
rant
sBa
sed
on F
inan
cial
Nee
d
In 1981-82 and earlier years virtually all state grant aid was based on studentsrsquo financial circumstances The share that was need-based declined gradually to a low of 71 in 2010-11 From 2013-14 through 2016-17 76 of state grant aid was need-based
In 2016-17 half of the states considered studentsrsquo financial circumstances in allocating at least 95 of their state grant aid Fifteen states considered studentsrsquo financial circumstances when awarding less than half of their state grant aid
Need-Based and Non-Need-Based State Grants per Full-Time Equivalent Undergraduate Student in 2016 Dollars 1976-77 to 2016-17
State Grants State grant aid per full-time equivalent undergraduate student rose for the fifth consecutive year in 2016-17 to $820mdashan increase of $120 (17) since 2011-12
FIGURE 23A
NOTE Percentages displayed represent percentages of total undergraduate state grant aid for which studentsrsquo financial circumstances were considered
SOURCE National Association of State Student Grant and Aid Programs (NASSGAP) Annual Survey 1976-77 to 2016-17 Tables 1 and 12
NOTES Need-based aid includes any grants for which financial circumstances contribute to eligibility Non-need-based aid refers to grants for which financial circumstances have no influence on eligibility New Hampshire did not award state grant aid to undergraduate students in 2016-17
SOURCE NASSGAP Annual Survey 2016-17 Table 1
ALSO IMPORTANT
Total spending on state grant aid increased from $9 billion (in 2016 dollars) in 2006-07 to $10 billion in 2011-12 and to $11 billion in 2016-17 (NASSGAP Annual Survey 2006-07 2011-12 and 2016-17)
For detailed data behind the graphs and additional information please visit trendscollegeboardorg 30
$2190
Stat
e G
rant
Aid
per
FTE
Stu
dent
$1000
$500
$0
New
Ham
pshi
reM
onta
naAr
izona
Utah
Haw
aii
Kans
asId
aho
Sout
h Da
kota
Rhod
e Is
land
Nebr
aska
Conn
ectic
utM
issi
ssip
piM
ichi
gan
Ohi
oM
assa
chus
etts
Alab
ama
Mai
neIo
wa
Mar
ylan
dO
rego
nNo
rth
Dako
taM
isso
uri
Colo
rado
Wis
cons
inNe
vada
Flor
ida
Dela
war
eO
klah
oma
Verm
ont
Illino
isW
yom
ing
Nort
h Ca
rolin
a Un
ited
Stat
esPe
nnsy
lvan
iaTe
xas
Min
neso
taAl
aska
Arka
nsas
Virg
inia
New
York
Indi
ana
Wes
t Virg
inia
Calif
orni
a W
ashi
ngto
nNe
w M
exic
oLo
uisi
ana
Kent
ucky
Ne
w J
erse
y Te
nnes
see
$0 $150
$390 $550
$820
$2000
$1500 $1290
$1110
Geo
rgia
Sout
h Ca
rolin
a
Gra
nt A
id a
s a
Perc
enta
geof
Fis
cal S
uppo
rt
30
20
10
0
13
0
36
New
Ham
pshi
reHa
wai
iM
onta
naUt
ahId
aho
Kans
asSo
uth
Dako
taAr
izona
Nebr
aska
Co
nnec
ticut
Mis
siss
ippi
Wyo
min
gNo
rth
Dako
taRh
ode
Isla
ndM
aryl
and
Alas
kaAl
abam
aO
hio
Mic
higa
nM
assa
chus
etts
Mai
neNe
vada
Illino
isNo
rth
Caro
lina
Iow
aW
isco
nsin
Flor
ida
Ore
gon
Dela
war
eO
klah
oma
Arka
nsas
Texa
s Ne
w M
exic
oUn
ited
Stat
esM
inne
sota
Mis
sour
i Ca
lifor
nia
Colo
rado
New
York
Indi
ana
Was
hing
ton
Kent
ucky
New
Jer
sey
Loui
sian
aW
est V
irgin
ia
Geo
rgia
Ve
rmon
t Vi
rgin
ia
Tenn
esse
e Pe
nnsy
lvan
iaSo
uth
Caro
lina
In 2016-17 four states provided 42 of all state grant aid dollars with California accounting for 18 of the total
Some state-funded grant aid is in the form of ldquotuition set-asiderdquo programs through which a portion of tuition revenues at public institutionsmdashor of increases in tuitionmdashis dedicated to grant aid Some of these funds are included in reported state grant aid but others are not Tuition remission dollars not always reported as state grant aid are sizable in several states
State Grants In 2016-17 state grant aid per full-time equivalent (FTE) undergraduate student ranged from under $200 in nine states to over $1000 in 13 states
FIGURE 24A State Grant Aid per Full-Time Equivalent (FTE) Undergraduate Student 2016-17
NOTE State grant expenditures include funding for both undergraduate and graduate students
SOURCE NASSGAP Annual Survey 2016-17 Table 14
South Carolina with the highest grant aid per FTE undergraduate student considered the financial circumstances of recipients for only 17 of state grant funds in 2016-17 Georgia the second most generous state allocates its grant funds without regard to studentsrsquo financial circumstances (Figure 23B)
ALSO IMPORTANT
Overall state grant expenditures constituted 13 of total state
support for higher education in 2016-17 Thirteen states devoted less than 5 of their higher education funding to grant aid for students nine states directed more than 20 of their funding to individual students rather than to institutions
For detailed data behind the graphs and additional information please visit trendscollegeboardorg 31
NOTES Full-time equivalent students include both state residents and out-of-state students States do not award grant aid to nonresidents
SOURCES NASSGAP Annual Survey 2016-17 Tables 1 and 12 calculations by the authors
FIGURE 24B State Grant Expenditures as a Percentage of Total State Support for Higher Education by State 2016-17
On average dependent students from families with incomes below $35000 received more than five times as much institutional grant aid at high-tuition private colleges in 2015-16 as similar students at low-tuition private colleges ($33260 vs $6160) Students from families with incomes of $120000 or higher recei ved on average about 50 more grant aid at high-tuition colleges than similar students at low-tuition colleges ($12840 vs $8660)
In 2015-16 public doctoral universities distributed 62 of their institutional grant aid without regard to studentsrsquo financial need at public masterrsquos universities it was 71
Average Institutional Grant Aid Full-Time Undergraduates at Private Nonprofit Four-Year Institutions 2015-16
Average Institutional Grant Aid Full-Time Undergraduates at Public Doctoral and Master rsquos Insti tutions 2015-16
Tuition and Fees
Need-Based $45000 or Higher
Tuition and Fees
15
85 54
35
65
35
65
23
77
82
18
74
26
69
31
52
48
46$13900
$19740 $21160 $20280
$15640
$33260 $33120
$25730
Between $35000 and $44999
Tuition and Fees Between $30000
$25000 and $34999
Tuition and Fees Less than $25000
Aver
age
Inst
itutio
nal G
rant
Aid
$20000
37
63
$14270
33
67
$15350
25
75
$16340
$12840
$9550
71 81
$8660$10000 $7850 $6160
76
46 54
29 2419$0 Less than $35000 $70000 $120000 Less than $35000 $70000 $120000 Less than $35000 $70000 $120000 Less than $35000 $70000 $120000 $35000 to to or Higher $35000 to to or Higher $35000 to to or Higher $35000 to to or Higher
$69999 $119999 $69999 $119999 $69999 $119999 $69999 $119999
Parentsrsquo Income of Dependent Students
Non-Need-Based Need-Based
$3570
45
45
74
$3310 $3110
Aver
age
Inst
itutio
nal G
rant
Aid
$3000
$2000
$1000
$0
$2900
38
62
$2490
15
85
55
$1490 $1460
63
$1410$1360$1330
8855
16
84
36
64
29
71
26
12 37
All Less than $35000 $70000 $120000 All Less than $35000 $70000 $120000 $35000 to to or Higher $35000 to to or Higher
$69999 $119999 $69999 $119999
Public Doctoral Public Masterrsquos
Parentsrsquo Income of Dependent Students
Institutional Grants In 2015-16 private nonprofit four-year institutions with tuition and fees of $45000 or higher awarded on average about two and a half times as much grant aid to dependent students from families with incomes below $35000 as to those from families with incomes of $120000 or higher ($33260 vs $12840)
FIGURE 25A
Non-Need-Based
FIGURE 25B Lower-price private nonprofit four-year institutions tend to award larger shares of their grant aid without regard to the financial circumstances of recipients In 2015-16 the lowest-price institutions (those with tuition and fees of less than $25000) awarded more institutional grant aid on average to students from families with incomes of $70000 or higher than to those from families with lower incomes
NOTES Includes full-time undergraduates who were US citizens or permanent residents Averages are across all full-time students enrolled for the full year at one institution including those who did not receive institutional grant aid Non-need-based aid is based entirely on merit or other circumstances not related to need and includes athletic and merit scholarships tuition waivers of all kinds and other categories of institutional awards Each tuition and fee category in Figure 25A includes about one-quarter of full-time undergraduates in the sector Public bachelorrsquos colleges which enroll about 5 of undergraduates in the public sector are not included in Figure 25B
SOURCES NCES NPSAS 2016 calculations by the authors
In 2015-16 the lowest-income dependent students at public doctoral universities received about 25 more institutional grant aid on average than those from families with incomes of $120000 or higher ($3110 vs $2490) At public masterrsquos universities average institutional grants were similar for students from all income groups
For detailed data behind the graphs and additional information please visit trendscollegeboardorg 32
Tax savings for students and parents who claimed education tax credits averaged about $1500 in 2016
The American Opportunity Tax Credit which accounts for most of the total credits and deductions is available to taxpayers with adjusted gross incomes as high as $180000 The maximum benefit per filer is $2500 with up to $1000 of that amount available as a refund to filers with no tax liability
Distribution of Education Tax Credits by Adjusted Gross Income 2006 2011 and 2016
Less than $25000 to $50000 to $75000 to $100000 to $25000 $49999 $74999 $99999 $180000
2016 (Average = $1500) 24 24
2011 (Average = $1500) 25 19
1
2006 (Average = $1100) 34
22 16 14
14
16 13
26 25
27
Total DeductionsTotal Credits
2016 $160 $166
2014 $180 $185
2012 $185 $191
2010 $224 $229
2008 $71 $87
2006 $72 $88
2004 $66 $87
2002 $59 $73
2000 $63 $63
1998 $47 $47
$0 $5 $10 $15 $20 $25
Total Savings in Billions of Dollars
Education Tax Credits and Tuition Deductions The implementation of the American Opportunity Tax Credit in 2009 shifted the benefits of the education tax credits from filers with incomes between $25000 and $100000 to those with lower and higher incomes
FIGURE 26B Total Education Tax Credits and Savings from Tuition Deductions in Billions of 2016 Dollars 1998 to 2016 Selected Years
NOTES The total and average values of tax credits and deductions are best estimates based on data from the Internal Revenue Service A portion of nonrefundable dollars claimed on nontaxable returns is excluded to account for credits and deductions that do not reduce tax liability The value of tax deductions is estimated based on applicable marginal tax rates Percentages may not sum to 100 because of rounding
SOURCES Internal Revenue Service Statistics of Income 1998 to 2016 Tables 13 14 33 calculations by the authors
In 2016 about a quarter of the benefits of the federal education tax credits went to tax filers with incomes between $100000 and $180000 a slightly smallershare went to filers with incomes of $25000 orless and just over half went to those with incomes between $25000 and $100000
In 2016 students and parents saved about $166 billion on their federal income taxes through taxcredits and deductions for higher education expenses This form of subsidy was $88 billion (in 2016 dollars) in 2006 and $229 billion in 2010
ALSO IMPORTANT
Education tax credits and deductions are ldquotax expendituresrdquo They reduce federal income tax liabilities and federal tax revenues and have the same impact on the federal budget as direct expenditures such asPell Grants
Because the credit is only partially refundable manylow-income filers who have low or no tax liabilitiesreceive smaller credits than higher-income filers whocan subtract the full credit from the amount they owe
About one quarter of undergraduates are ineligible foreducation tax credits because they do not pay tuition out of pocket Many low-income students receive federal and state grant aid that covers tuition and feesliving costs are not qualifying expenses for educationtax credits and deductions (Delisle and Dancy ldquoA New Look at Tuition Tax Benefitsrdquo 2015)
In 2016 124 million taxpayers deducted $134 billion in student loan interest generating about $2 billion in tax savings for those borrowers (Internal Revenue Service Statistics of Income 2016 Table 14 Fiscal Year 2017 Analytical Perspectives Budget of the US Government FY18 Table 13-1)
For detailed data behind the graphs and additional information please visit trendscollegeboardorg 33
FIGURE 26A
Notes and Sources
Campus-Based Aid (FWS Perkins and FSEOG) Iraq and Afghanistan Service Grants and ACGSMART Grants US Department of Education Annual Federal Program Data Books Federal Work-Study (FWS) and Federal Supplemental Educational Opportunity Grant (FSEOG) amounts include allocated federal funds only Institutional matching funds required since 1989-90 for FSEOG are reported under institutional grants No funds have been appropriated for new federal capital contributions to the Perkins Loan program since FY06 and the program is funded from past federal and institutional capital contributions as well as collections from borrowers
Education Tax Benefits Income Tax Returns All Returns Tables 13 14 2 and 33 Data on education tax credits are authorsrsquo estimates based on IRS data on the volume of Hope Lifetime Learning and American Opportunity credits for tax years 1998 and later A portion of nonrefundable dollars claimed on nontaxable returns is excluded to account for credits that do not reduce tax liability Tax deductions are based on IRS Statistics of Income Table 14 with associated savings estimated by the authors based on the marginal tax rates applied to the taxable income of the taxpayers in each income bracket claiming the deduction on taxable returns Calendar year amounts are split between the two associated academic years
Federal Subsidized and Unsubsidized Student Loans 2009-10 and prior unpublished data provided by the US Department of Education staff 2010-11 and after Federal Student Aid Data Center Title IV Program Volume Reports Because the Federal Student Aid Data Center will continue to update the loan volume after each academic year ends we adjusted the 2017-18 data (released in September 2018) using the average of the percentage change between July 2015 and July 2016 in the reported 2014-15 loan volume the percentage change between July 2016 and July 2017 in the reported 2015-16 loan volume and the percentage change between July 2017 and July 2018 in the reported 2016-17 loan volume
Prior to 1993-94 federal Subsidized and Unsubsidized Loans for students were made by banks and other private lenders and guaranteed by the federal government From 1994-95 through 2009-10 the guaranteed loan program known as the Federal Family Education Loan Program (FFELP) continued alongside the Federal Direct Loan Program (FDLP) which lends federal funds to students Beginning in 2010-11 all of the loans are Federal Direct Subsidized or Unsubsidized Loans
Subsidized Loans are need-based student loans for which the federal government pays the interest while the student is in school and during a six-month grace period thereafter Prior to June 2012 these loans were available to both undergraduate and graduate students but the Budget Control Act of 2011 eliminated the program for graduate students whose federal loans are now all Unsubsidized or Grad PLUS loans Interest accrues on Unsubsidized Loans from the time they are disbursed
Institutional Grants 2015-16 and prior IPEDS Finance data Estimated for 2016-17 and 2017-18 Estimated figures represent best approximations and are updated each year as additional information becomes available
Nonfederal Loans Estimates of nonfederal borrowing rely on data from MeasureOne Between 2011-12 and 2016-17 we supplemented these data with information from the Consumer Bankers Association and the Consumer Financial Protection Bureau Earlier data are based on information provided by lenders supplemented by data from annual reports and from NPSAS Estimates of institutional lending are based on NPSAS as well as a survey of institutions conducted for the College Board by the National Association of Student Financial Aid Administrators (NASFAA) We no longer report state and institutional loans separately from private loans because of changes in MeasureOnersquos methodology and data availability issues
Pell Grant Program 2016-17 and prior Federal Pell Grant Program End-of-Year Report 2017-18 Federal Student Aid Data Center Title IV Program Volume Reports
Private and Employer Grants Estimates are based on data included in NPSAS and on National Scholarship Providers Association surveys of major private student grant providers supplemented by information from annual reports of selected scholarship providers data from institutional financial aid offices and the College Boardrsquos Annual Survey of Colleges
State Grant Programs 20th through 48th Annual Survey Reports of the National Association of State Student Grant and Aid Programs (NASSGAP) for 1988-89 to 2016-17 and estimated for 2017-18
Veterans Benefits Benefits Program series (annual publication for each fiscal year) US Department of Veterans Affairs Office of Budget and Finance Veterans benefits are payments for postsecondary education and training to veterans and their dependents including the Post-911 Veterans Educational Assistance Program established in 2009-10 and all programs established earlier The Iraq and Afghanistan Service Grants program begun in 2010-11 provides non-need-based grants for students whose parent or guardian was a member of the Armed Forces who died in Iraq or Afghanistan as a result of performing military service after Sept 11 2001 Estimates include benefits for active duty military members
34
Trends in Student Aid was authored by Sandy Baum nonresident fellow at the Urban Institute Jennifer Ma senior policy research scientist at the College Board Matea Pender policy research scientist at the College Board and CJ Libassi senior policy research analyst at the College Board
CONTACT INFORMATION FOR THE AUTHORS
sandybaum73gmailcomtrendscollegeboardorg
Trends in Student Aid and its companion report Trends in College Pricing are supplemented by a website that makes detailed data available for reference and downloading The PDF versions of these reports along with PowerPoint slides of all the graphs are available on the web trendscollegeboardorg
Hard copies may be requested by contacting trendscollegeboardorg
Tables graphs and data in this report or excerpts thereof may bereproduced or cited for noncommercial purposes only provided that the following attribution is included
Source Baum Sandy Jennifer Ma Matea Pender and CJ Libassi (2018) Trends in Student Aid 2018 New York The College Board
copy 2018 The College Boardwwwcollegeboardorg
ACKNOWLEDGMENTS
Anthony LaRosa and Edward Lu provided critical support for this publication We also benefited from comments from Dean Bentley Jessica Howell Michael Hurwitz and Melanie Storey Sandy Alexander provided expert graphic design work The publication would not have been possible without the cooperation and support of many individuals at the College Board including Connie Betterton Robert Gordon Karen Lanning Alejandro Leal George Lilas Robert Majoros Jose Rios and Matt Walsh
We thank all of those who contributed to the data collection for this publication especially Charlotte Etier of the National Association of Student Financial Aid Administrators (NASFAA) and Mike Solomon of the Illinois Student Aid Commission
36
collegeboardorgtrendscollegeboardorg
00947-055
October 2018
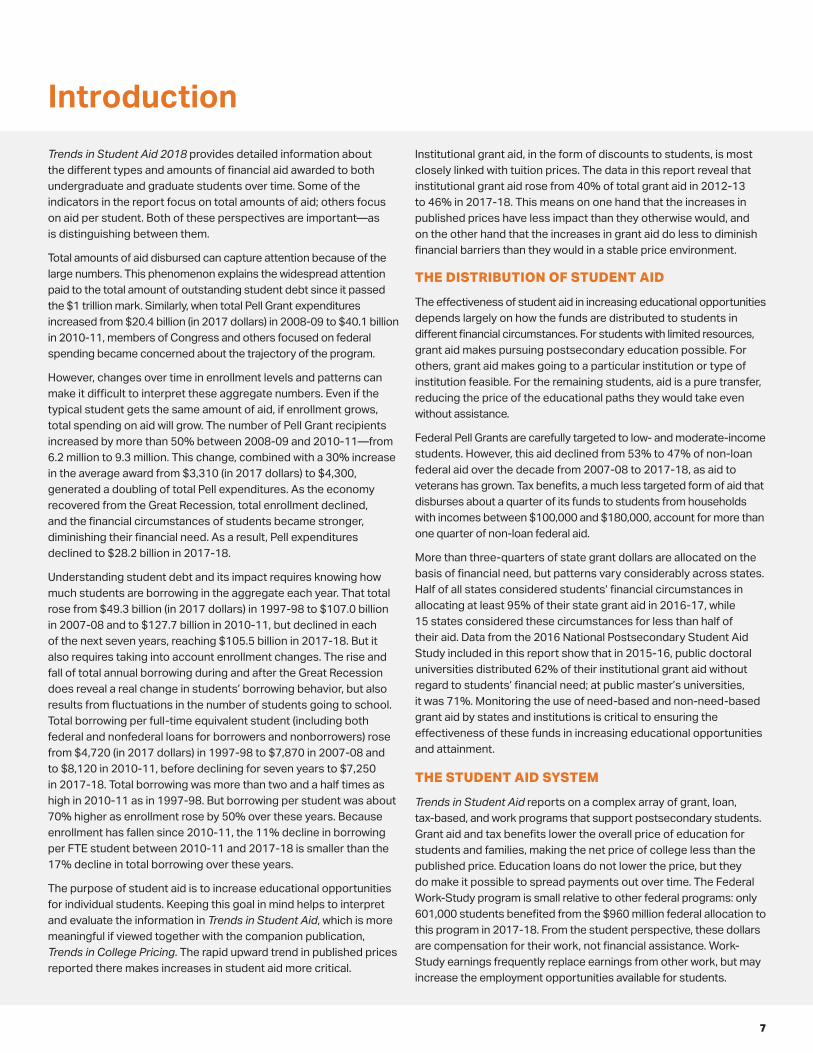
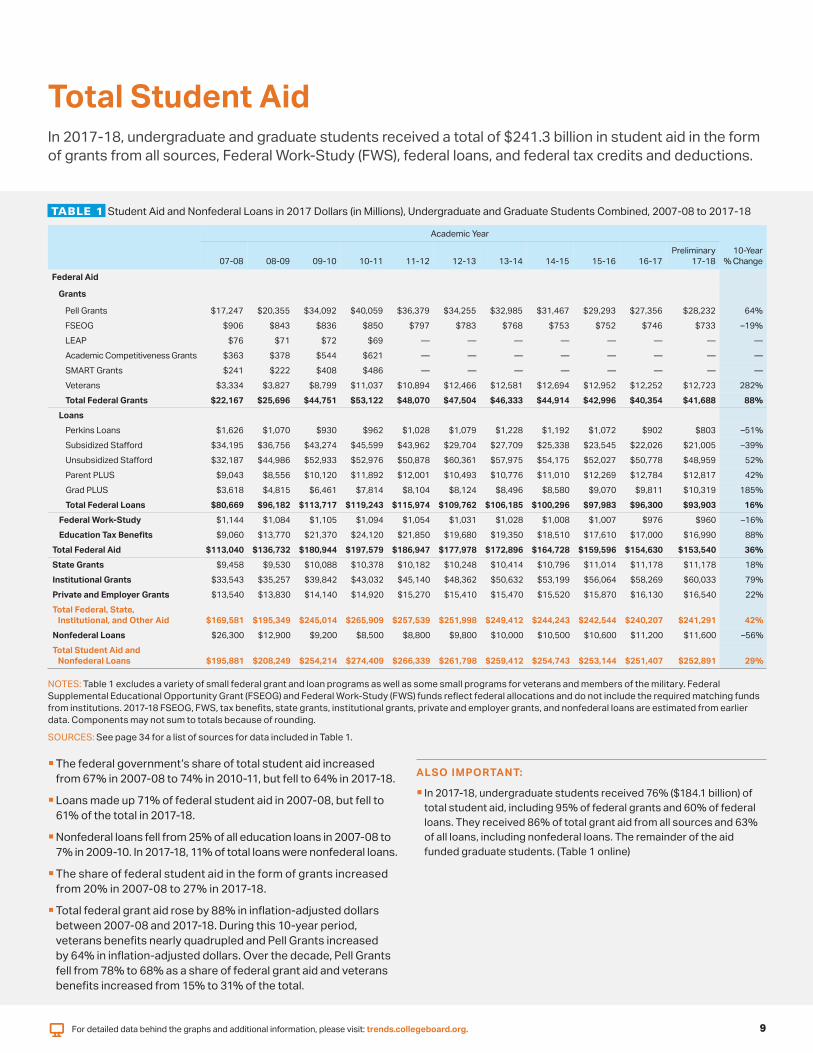
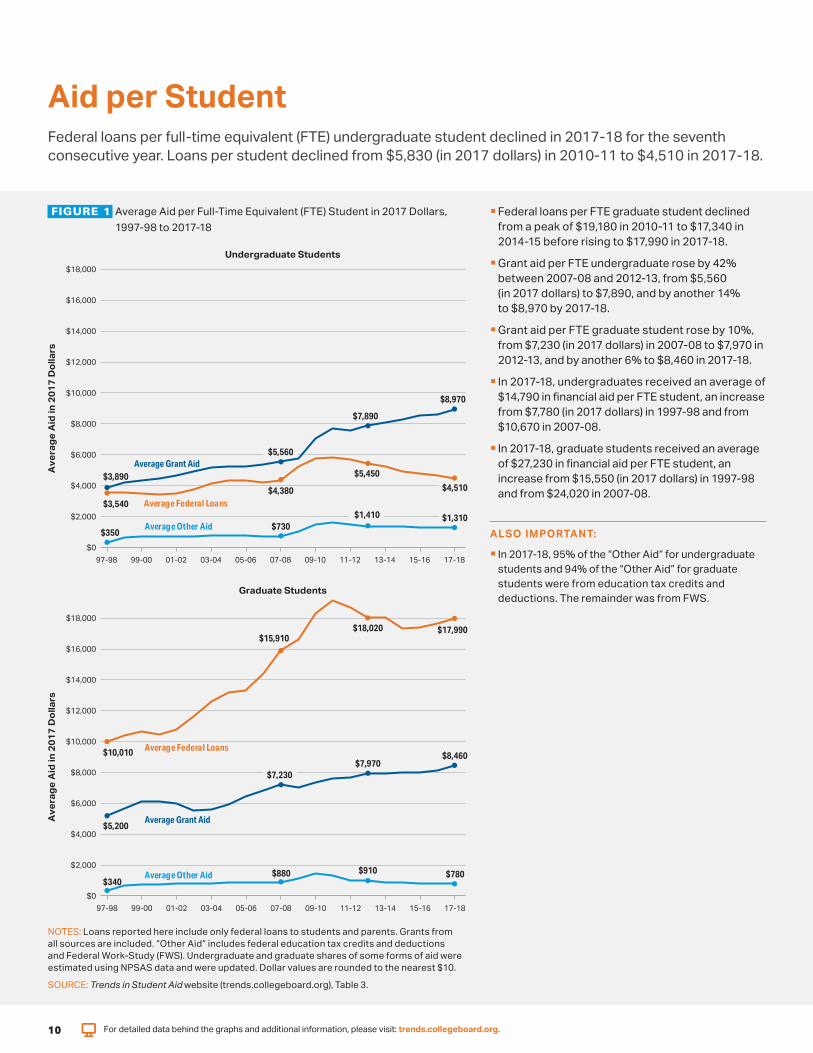
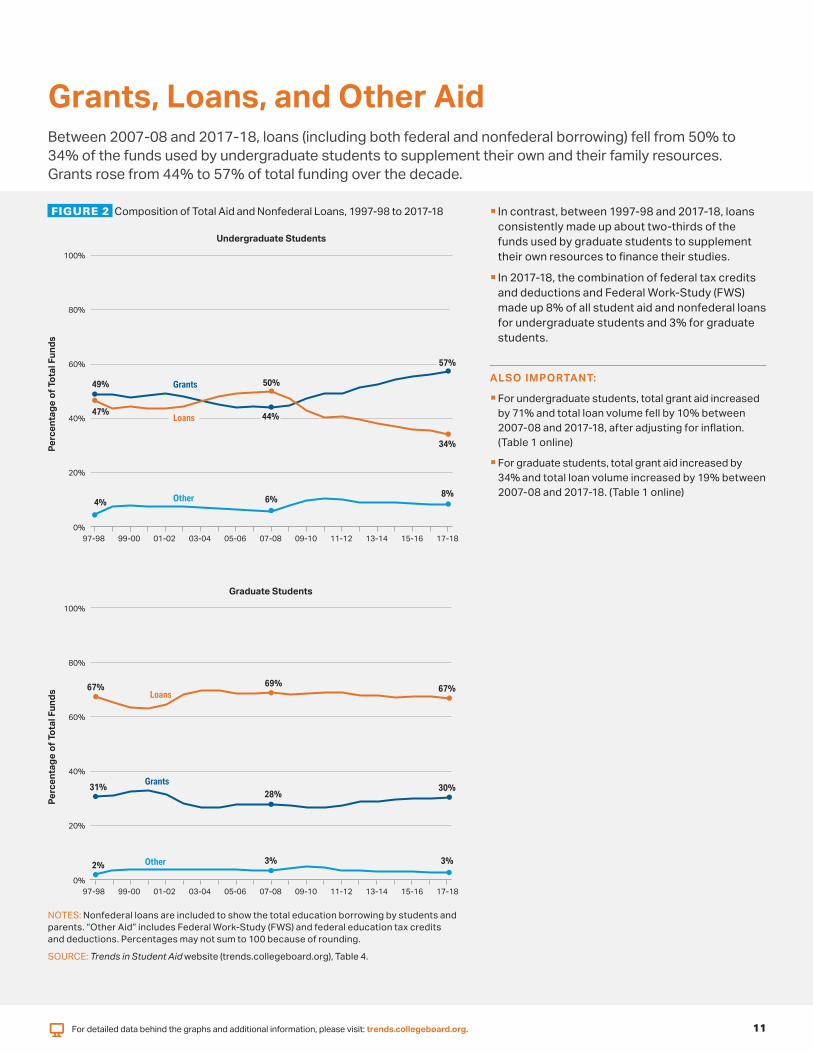
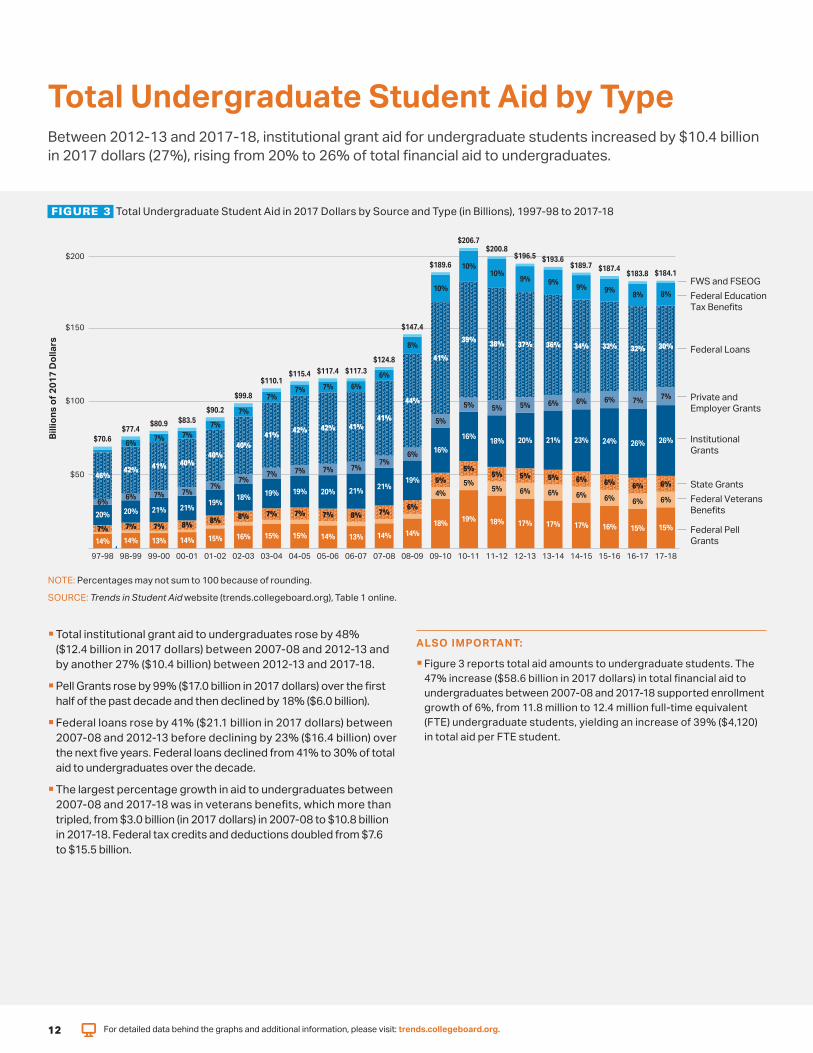
Billi
ons
of 2
017
Dol
lars
$2067 $2008
$1965$200 $1936$1896 $1897 $1874
$1838 $1841
14 14 13 14 15 16 15 15 14 13 14 14 18 19 18 17 17 17 16 15 15
4 5
5 6 6 6 6 6 6
7 7 7 8 8 8 7 7 7 8 7
6
5
5 5 5 5 6 6 6 6
20 20 21 21 19
18 19 19 20 21 21 19
16
16 18 20 21 23 24 26 26
6 7 7 7
7 7 7 7 7
7 6
5
5 5 5 6 6 6 7 7
46 42 41 40
40 40
41 42 42 41
41
44
41
39 38 37 36 34 33 32
6 7 7
7
7
7 7 7 6
6
8
10
10 10
9 9 9 9 8 8
30
FWS and FSEOG Federal Education Tax Benefits
$150 $1474
Federal Loans $1248
$1154 $1174 $1173 $1101
$998 Private and $100 Employer Grants $902
$835$809$774
$706 Institutional Grants
$50 State Grants Federal Veterans Benefits
6
Federal Pell Grants
97-98 98-99 99-00 00-01 01-02 02-03 03-04 04-05 05-06 06-07 07-08 08-09 09-10 10-11 11-12 12-13 13-14 14-15 15-16 16-17 17-18
Total Undergraduate Student Aid by TypeBetween 2012-13 and 2017-18 institutional grant aid for undergraduate students increased by $104 billion in 2017 dollars (27) rising from 20 to 26 of total financial aid to undergraduates
FIGURE 3 Total Undergraduate Student Aid in 2017 Dollars by Source and Type (in Billions) 1997-98 to 2017-18
NOTE Percentages may not sum to 100 because of rounding
SOURCE Trends in Student Aid website (trendscollegeboardorg) Table 1 online
Total institutional grant aid to undergraduates rose by 48($124 billion in 2017 dollars) between 2007-08 and 2012-13 and by another 27 ($104 billion) between 2012-13 and 2017-18
Pell Grants rose by 99 ($170 billion in 2017 dollars) over the first half of the past decade and then declined by 18 ($60 billion)
Federal loans rose by 41 ($211 billion in 2017 dollars) between 2007-08 and 2012-13 before declining by 23 ($164 billion) over the next five years Federal loans declined from 41 to 30 of total aid to undergraduates over the decade
The largest percentage growth in aid to undergraduates between2007-08 and 2017-18 was in veterans benefits which more than tripled from $30 billion (in 2017 dollars) in 2007-08 to $108 billion in 2017-18 Federal tax credits and deductions doubled from $76 to $155 billion
ALSO IMPORTANT
Figure 3 reports total aid amounts to undergraduate students The 47 increase ($586 billion in 2017 dollars) in total financial aid to undergraduates between 2007-08 and 2017-18 supported enrollment growth of 6 from 118 million to 124 million full-time equivalent (FTE) undergraduate students yielding an increase of 39 ($4120) in total aid per FTE student
For detailed data behind the graphs and additional information please visit trendscollegeboardorg 12
$60
$212 $230
$246 $249 $260
$286
$317
$343 $360
$394
$441
$473
$544 $555
$546 $552
23 23 23 24 22 20 18 18 19 18 17 17 16 16 17 18
3 3
18 19 19 20 20
64 62
61 60 61 65
66 66
65
65
66 67
68
68 68 67 67 66 66 67 66
4 4 4
4
3
$50
$40
$30
$20
$10
$0 97-98 98-99 99-00 00-01 01-02 02-03 03-04 04-05 05-06 06-07 07-08
Billi
ons
of 2
017
Dol
lars
$581 $567 $572 Federal $564 $558 Work-Study
Federal Education Tax Benefits
Federal Loans
Private and Employer Grants
Institutional Grants
State Grants Federal Veterans
08-09 09-10 10-11 11-12 12-13 13-14 14-15 15-16 16-17 17-18 Benefits
Total Graduate Student Aid by TypeGrant aid increased from 27 of total aid for graduate students in 2010-11 to 31 in 2017-18 Loans declined from 68 to 66 of the total
FIGURE 4 Total Graduate Student Aid in 2017 Dollars by Source and Type (in Billions) 1997-98 to 2017-18
NOTE Percentages may not sum to 100 because of rounding
SOURCE Trends in Student Aid website (trendscollegeboardorg) Table 1 online
Grant aid made up 35 of graduate student aid in 1999-00 and 2000-01 when loans were between 60 and 61 of the total
Between 2012-13 and 2017-18 institutional grants to graduate students rose by $13 billion in 2017 dollars (13) Federal loans rose by $589 million (2) and veterans benefits rose by $432 million (30)
Between 1997-98 and 2007-08 federal loans for graduate studentsmore than doubled increasing from $136 billion to $292 billion in2017 dollars Federal loans for these students grew by another 29over the next decade to $378 billion in 2017-18
Between 1997-98 and 2007-08 institutional grants for graduate students rose by 55 from $49 billion to $76 billion in 2017 dollars Institutional grants grew by another 49 over the next decade to $113 billion in 2017-18
ALSO IMPORTANT
Figure 4 reports total aid amounts to graduate students The 30 increase ($131 billion in 2017 dollars) in total financial aid to graduate students between 2007-08 and 2017-18 supported enrollment growth of 14 from 18 million to 21 million full-time equivalent (FTE) graduate students yielding an increase of 13 ($3210) in total aid per FTE student
For detailed data behind the graphs and additional information please visit trendscollegeboardorg 13
4
4
4 4
4
3
4
5
5 3
3 3 3 3 3
9 10 10 11 10 10 9 10 11 11 12 11 9
9 9 9 8 8 7 7 7
3 3 3 3
$1294
Gra
nts
in B
illio
ns o
f 201
7 D
olla
rs
$120
$90
$60
$30
$0
$425 $467
$496 $520
$563 $610
$659 $688 $707
$735
$787
$843
$1088
$1215 $1187
$1215 $1228 $1244 $1259 $1259
29 29 27 27 30 32 32 31 29 28 28 30
41 44
41 39 38 36 34 32 32 45 45 45 44 42
39 40 41 42 43
43 42
37
35 38 40 41 43 45 46
46
14 15
16 16 16
16 16
16 17 17
17
16
13
12 13
13 13 12 13 13 13
12 12
12 13
13 13
12 13 12
13
12
11
9
9 9
8 8 9 9 9 9 State Grants
Private and EmployerGrants
Institutional Grants
Federal Grants
97-98 98-99 99-00 00-01 01-02 02-03 03-04 04-05 05-06 06-07 07-08 08-09 09-10 10-11 11-12 12-13 13-14 14-15 15-16 16-17 17-18
Sources of Grant Aid The total amount of grant aid supporting postsecondary students increased by 85 (after adjusting for inflation) between 1997-98 and 2007-08 and by another 64 between 2007-08 and 2017-18 reaching a total of $1294 billion
FIGURE 5 Total Grant Aid in 2017 Dollars by Source of Grant 1997-98 to 2017-18
NOTE Percentages may not sum to 100 because of rounding
SOURCES See page 34 for a list of sources for grants included in Figure 5
Almost all of the growth in total grant aid over the last decade occurred between 2007-08 and 2012-13 as full-time equivalent (FTE) enrollment increased by 13 Between 2012-13 and 2017-18 FTE enrollment declined by 5 and total grant aid increased by 7
Federal grants fluctuated between 27 and 32 of all grant aid for undergraduate and graduate students between 1997-98 and 2007-08 This share rose to 44 in 2010-11 but declined to 32 in 2017-18
Institutional aid is the only type of grant aid that grew rapidly between 2012-13 and 2017-18 Colleges and universities increased their aid by 24 from $484 billion (in 2017 dollars) in 2012-13 to $600 billion in 2017-18
From 1997-98 to 2007-08 state grant aid was between 12 and 13 of all grant aid From 2009-10 to 2017-18 it was between8 and 9 of all grant aid Total state grant aid grew by 83 (afteradjusting for inflation) between 1997-98 and 2007-08 and byanother 18 over the decade ending in 2017-18
Grants from employers and other private sources were between 12 and 17 of total grant aid to postsecondary students for the entire two decades from 1997-98 through 2017-18 and were13 of the total in 2017-18
ALSO IMPORTANT
Grant aid for veterans which grew from $33 billion (in 2017 dollars) to $127 billion over the decade increased from 15 of federal grant aid in 2007-08 to 31 in 2017-18 At the same time Pell Grants which rose from $172 billion to $282 billion declined from 78 to 68 of the total (Table 1)
The composition of grant aid for graduate students is quite different from that for undergraduate studentsmdashand from the totals in Figure 5 In 2017-18 11 of graduate student grant aid came from the federal government (including aid to veterans) 64 from institutions 24from employers and other private sources and 2 from states Forundergraduate students the percentages were 36 44 11 and10 respectively (Table 1 online)
For detailed data behind the graphs and additional information please visit trendscollegeboardorg 14
Loan
s in
Bill
ions
of 2
017
Dol
lars
$1248$1229 $1196
$120 $1162
$1108$1091 $1086 $1075$1070 $1055
$979
8
7 9
8 9
12
9
50 48 43 42 40
31 32 33 33
13
34
9
14
38
33
10
16
37 35 33 31
32
10
18
32 32 30
11
20
11
23
10
25
32
30
8
3
25
34
41
8
4
12
35
43
8
5
7
36
41
9
6
7
35
41
10
6
7
25
50
9
7
8
24
50
9
7
9
23
49
10
8
9
22
48
11
8
10
20
47
12
9
10
20
46
12
10
11 Nonfederal Loans $938
$889 Perkins Loans $90 Grad PLUS Loans
$803
Parent PLUS $694 Loans
$602 $60 $558
$512 $548
$493
Federal Unsubsidized Loans
$30
Federal Subsidized Loans
$0 97-98 98-99 99-00 00-01 01-02 02-03 03-04 04-05 05-06 06-07 07-08 08-09 09-10 10-11 11-12 12-13 13-14 14-15 15-16 16-17 17-18
$1277
In 1997-98 61 of Stafford Loans were subsidized loansmdashthe interest is paid by the government while students are in school This percentage declined to 52 in 2007-08 and to 33 in 2012-13 when graduate students were no longer eligible for the program In 2017-18 30 of Stafford Loans were subsidized
Types of LoansTotal annual student and parent borrowing for postsecondary education declined (in inflation-adjusted dollars) for the seventh consecutive year to $1055 billion in 2017-18
FIGURE 6 Total Federal and Nonfederal Loans in 2017 Dollars by Type of Loan 1997-98 to 2017-18
NOTES Nonfederal loans include loans to students from states and institutions in addition to private loans issued by banks credit unions and other lenders Values fornonfederal loans are best estimates and are less precise than federal loan amounts
SOURCES See page 34 for a list of sources for loans included in Figure 6
Between 2012-13 and 2017-18 total annual borrowing from the subsidized and unsubsidized Direct Loan programs declined by 22 to $700 billion Total annual borrowing from the Parent PLUSLoan program increased by 22 to $128 billion and borrowing from the Grad PLUS program increased by 27 to $103 billion
Students borrow nonfederal education loans from banks creditunions and other private lenders including some states and postsecondary institutions These loans which are not part of the student aid system and typically do not involve subsidies fellfrom about $26 billion (in 2017 dollars) in 2007-08 to $9 billion in 2009-10 but increased to almost $12 billion by 2017-18 when theyaccounted for about 11 of all education loans
ALSO IMPORTANT
There are no credit requirements for subsidized and unsubsidizedDirect Loans or Perkins Loans To qualify for PLUS loans borrowers cannot have an ldquoadverse credit historyrdquo defined as being 90 days or more delinquent on any debts greater than $2085 or being the subject of default determination bankruptcy discharge foreclosure repossession tax lien wage garnishment or write-off of a federal education debt during the five years preceding the date of the credit report
For detailed data behind the graphs and additional information please visit trendscollegeboardorg 15
Federal Aid Federal education tax credits and deductions reached an estimated 120 million students in 2016-17 50 million more than the 70 million Pell Grant recipients in 2017-18
FIGURE 7 Number of Recipients by Federal Aid Program (with Average Aid
Received) 2017-18
120
Num
ber o
f Rec
ipie
nts
(in M
illio
ns) million
12
10 79
70 million 688 million million
55 6 million
4
14 2 million
601000 767000 286000
0 Federal Federal Direct Direct Direct FSEOG Federal Post9-11 Perkins
Education Pell Subsidized Subsidized Unsubsidized ($530) Work-Study GI Bill Loan Tax Benefits Grant or Loans Loans ($1600) Veterans ($2810)
($1390) ($4010) Unsubsidized ($3850) ($7220) Benefits Loans ($15310)
($8800)
Federal Aid Programs (with Average Aid per Recipient)
NOTES Data on tax benefits are estimated for 2016-17 FSEOG and FWS amounts represent federal funds only Institutions provide matching funds so the awards that students receive under these programs are larger than these federal aid amounts Perkins Loans are made from revolving funds on campus No new federal outlays have been provided since 2005-06 but originally the funds came partly from the federal government and partly from institutional sources
SOURCES See page 34 for a list of sources of data on federal aid programs
FIGURE 8 Percentage Distribution of Federal Aid Funds by Sector 2016-17
Public Two-Year Public Four-Year Private Nonprofit For-Profit
Pell Grants
FSEOG
Federal Work-Study
Perkins Loans
Direct Subsidized Loans
Direct Unsubsidized Loans
Parent PLUS Loans
Grad PLUS Loans
34 35
31
36
1 2
33
41
12
16 15
5
24
18
50 48
13 45
6 41
1
26
38
16
16
50
26
42
68
7
6
Percentage of Aid
NOTES Excludes aid to students enrolled in public less-than-two-year colleges and to studentsenrolled in foreign institutions Percentages may not sum to 100 because of rounding
SOURCES See page 34 for a list of sources of data on federal aid programs
In 2017-18 an estimated 601000 students receivedFederal Work-Study (FWS) funding
In 2017-18 the total number of borrowers in the subsidized and unsubsidized Direct Loan programs was 79 millionmdashless than the sum of the number of recipients in each program because about two-thirds of all borrowers participated in both programs
In 2016-17 public two-year college students who made up 32 of full-time equivalent (FTE) undergraduate enrollment received 34 of Pell Grant funds Students in this sector received less than their proportionate share of funds from all other federal student aid programs
In 2016-17 students in the private nonprofit sectoraccounted for 18 of undergraduate and 22 oftotal postsecondary FTE enrollment They received 68 of Grad PLUS 48 of Perkins Loans and 41of FWS funds
ALSO IMPORTANT
Pell Grants FSEOG and Direct Subsidized Loans are for undergraduates only Grad PLUS Loans are for graduate students only Parent PLUS Loans are for parents of undergraduate students FWS PerkinsLoans Direct Unsubsidized Loans and Post-911 GI Bill benefits are available to both undergraduate and graduate students
The number of students receiving FWS funds declined from 698000 in 2007-08 to 601000 in 2017-18 (Table 5 online)
In 2012-13 41 of Post-911 GI Bill veterans benefits went to students in the for-profit sector (US Senate HELP Committee 2014 ldquoIs the New GI Bill Workingrdquo) In 2017 Congress passed legislation known as the ldquoForever GI Billrdquo increasing the generosity of education benefits for veterans
Distribution of Fall 2016 Enrollment by Sector
FTE Undergraduate Students
All FTE Students
Public Two-Year 32 27
Public Four-Year 42 43
Private Nonprofit Four-Year
For-Profit
18
ensp7
22
ensp7
SOURCE NCES IPEDS Enrollment data
For detailed data behind the graphs and additional information please visit trendscollegeboardorg 16
Federal Loans Annual BorrowingAfter a decade of rapid growth in annual borrowing total federal loans to undergraduate students declined by 23 between 2012-13 and 2017-18 after adjusting for inflation and federal loans to graduate students rose by 2
FIGURE 9A Total Annual Amount Borrowed from Federal Subsidized Unsubsidized and PLUS Loans in Millions of 2017 Dollars 2002-03 to 2017-18 Selected Years
$80000 PLUS $71730
Tota
l Ann
ual A
mou
nt B
orro
wed
in M
illio
ns o
f 201
7 D
olla
rs
$60000
$40000
$20000
$0
$38200
$50210 $55520
$18050
$28820
$36940 $37580
2002-03 2007-08 2012-13 2017-18 2002-03 2007-08 2012-13 2017-18
Undergraduate Graduate
Unsubsidized
Subsidized
FIGURE 9B Average Annual Amount Borrowed in Federal Subsidized Unsubsidized and PLUS Loans in 2017 Dollars 2002-03 to 2017-18 Selected Years
$6320
$19820 $20490
$6360
$19280
$6790
$18860
$6570
Graduate
Undergraduate
2017-18
2012-13
2007-08
2002-03
$11750
$19960
$13480
$23480
$16090
$24810
$16450
Undergraduate
$0
PLUS
Su
bsid
ized
and
Unsu
bsid
ized
Graduate
$0 $5000 $10000 $15000 $20000 $25000 $30000
Average Annual Amount Borrowed in 2017 Dollars per Borrower
Number of Borrowers (in Thousands) 2002-03 to 2017-18 Selected Years
2002-03 2007-08 2012-13 2017-18
Subsidized and Unsubsidized Undergraduate 5003 6473 9024 6504
Graduate 881 1272 1495 1446
Total 5884 7745 10519 7950
PLUS
Undergraduate 563 671 652 779
Graduate 0 181 346 416
Total 563 852 998 1195
The share of federal education loans going to graduate students (who constitute about 14 of all postsecondary students) rose from 32 ($181 billion out of $563 billion in 2017 dollars) in 2002-03 to 40 ($376 billion out of $931 billion) in 2017-18
In 2017-18 undergraduates taking subsidized andor unsubsidized Direct Loans borrowed an average of $6570mdash$210 more (in 2017 dollars) than a decade earlier and $220 less than in 2012-13
The number of parents borrowing Parent PLUS Loans in 2017-18 was 12 of the number of undergraduates taking subsidized and unsubsidized Direct Loans (779000 vs 65 million) However the average parent loan was $16450 25 times as much as the average undergraduate student loan
In 2017-18 416000 graduate students borrowed through the Grad PLUS program 14 million borrowed unsubsidized Direct Loans The average amount borrowed through the PLUS program was $5950 higher than the average Direct Loan ($24810 vs $18860)
ALSO IMPORTANT
The aggregate federal student loan limit for dependent undergraduate students is $31000 No more than $23000 can be subsidized loans Independent students and dependent students whose parents are not eligible for Parent PLUS Loans can borrow an additional $26500 in unsubsidized loans
Graduate and professional students can borrow up to a lifetime total of $138500 from the subsidized and unsubsidized loan programs including their undergraduate borrowing Each year students are enrolled they can borrow up to the full cost of attendance including living expenses and books and supplies in addition to tuition and fees through the Grad PLUS program
Like the Grad PLUS program the Parent PLUS program allows borrowing to cover studentsrsquo entire budgets less other aid received for an unlimited number of years of enrollment
NOTE Graduate students became eligible to borrow PLUS Loans in 2006-07
SOURCE Trends in Student Aid website (trendscollegeboard org) Table 6
For detailed data behind the graphs and additional information please visit trendscollegeboardorg 17
Annual Undergraduate Borrowing Parent PLUS and Private Loans In 2015-16 parents of 9 of dependent undergraduate students borrowed through the Parent PLUS program The shares of parents taking these loans ranged from less than 1 of dependent public two-year college students to 21 of dependent for-profit college students
FIGURE 10A Share of Dependent Undergraduate Students with Parent PLUS Loans 1999-00 to 2015-16
1999-00 2003-04 2007-08 2011-12 2015-16
0
10
20
Shar
e of
Dep
ende
nt U
nder
grad
uate
sw
ith P
aren
t PLU
S Lo
ans
6 7 9 97 86 9 12
12
13
12
14
19
17
05
03
04 1 06
24
29
21
25
21
30
All Public Four-Year Private Nonprofit Public Two-Year For-Profit Four-Year
Average Parent PLUS Loans Among Borrowers (2016 Dollars)
1999-00 2003-04 2007-08 2011-12 2015-16
All $9800 $11300 $11700 $12700 $14000
Public Four-Year $8600 $9800 $10500 $11700 $12800
Private Nonprofit Four-Year $12100 $14300 $15300 $15500 $17500
Public Two-Year mdash $6900 $5100 $9100 $7700
For-Profit $8200 $11000 $9900 $11900 $12600
FIGURE 10B Share of Undergraduate Students with Private Loans 1999-00 to 2015-16
1999-00 2003-04 2007-08 2011-12 2015-16 40
Shar
e of
Und
ergr
adua
tes
with
Pr
ivat
e Lo
ans
30
20
10
3 14
6 65 53 14
7 8 11
8 25
12
12
12
5 40
12
642 2106
0 All Public Four-Year Private Nonprofit Public Two-Year For-Profit
Four-Year
Average Private Loans Among Borrowers (2016 Dollars)
1999-00 2003-04 2007-08 2011-12 2015-16
All $7000 $7500 $7000 $6100 $8700
Public Four-Year $5400 $6800 $6700 $5700 $7800
Private Nonprofit Four-Year $8400 $10000 $10100 $8200 $12400
Public Two-Year $5500 $4100 $3800 $3300 $4100
For-Profit $8400 $7000 $6600 $6300 $8100
SOURCES NCES NPSAS 2000 2004 2008 2016 calculations by the authors
For detailed data behind the graphs and additional information please visit trendscollegeboardorg
The average annual amount borrowed through the Parent PLUS program has increased over time in all sectors except public two-year colleges At private nonprofit colleges and universities these loan amounts rose from an average of $12100 (in 2016 dollars) for 12 of dependent students in 1999-00 to $15300 for 14 of dependent students in 2007-08 and to $17500 for 17 of dependent students in 2015-16
The share of undergraduate students taking private student loans fell from 14 in 2007-08 to 6 in both 2011-12 and 2015-16
In 2007-08 40 of undergraduates at for-profit institutions took private student loans but that share had fallen to 6 by 2015-16mdashlower than the 12 at private nonprofit four-year and the 8 at public four-year colleges in 2015-16
In 2015-16 the average size of private student loans among the students who used them ranged from $4100 for 2 of public two-year college students to $12400 for 12 of private nonprofit four-year college students
ALSO IMPORTANT
Among 2015-16 bachelorrsquos degree recipients 20 of dependent studentsrsquo parents had borrowed PLUS loans at some point during the studentsrsquo undergraduate study Of those who borrowed Parent PLUS Loans the average cumulative amount borrowed was $36800 (NPSAS 2016 calculations by the authors)
Among 2015-16 bachelorrsquos degree recipients 16 had borrowed private loans at some point during their undergraduate study Of those who borrowed private loans the average cumulative amount borrowed was $21300 (NPSAS 2016 calculations by the authors)
In addition to using Parent PLUS Loans parents may borrow through home equity loans credit cards or other sources of credit This borrowing is not reflected in the data reported here
Private student loans do not carry the borrower protections included in federal student loan programs including the option of repaying through income-driven plans that base monthly payments on earnings Like federal student loans private loans are more difficult to discharge in bankruptcy than other personal loans
18
Federal Loans Borrowing and BalancesAs of March 2018 40 of the outstanding federal education loan debt was held by the 9 of borrowers owing $80000 or more
FIGURE 11 Distribution of Borrowers and Debt by Outstanding Balance 2018
18 PercentageLess than $5000
1 of Borrower
17 Percentage$5000 to $9999
4 of Debt
Out
stan
ding
Bor
row
er D
ebt B
alan
ce 21 $10000 to $19999
10
21$20000 to $39999
19
9$40000 to $59999
14
5$60000 to $79999
12
3$80000 to $99999
7
4 $100000 to $199999
19
2$200000 or More 14
s
NOTE Includes both loans made under the Federal Direct Loan Program (FDLP) and loans made under the Federal Family Education Loan (FFEL) Program which ended in 2009-10 Data were as of March 31 2018 the end of the second quarter of FY18
SOURCE US Department of Education Federal Student Aid Center Federal Student Loan Portfolio
FIGURE 12 Percentage of Undergraduate Students Borrowing Federal Subsidized and Unsubsidized Student Loans 2007-08 2012-13 and 2017-18
No Stafford Subsidized Unsubsidized Both Subsidized and Loans Only Only Unsubsidized Loans
2017-18
ar
eYc i
me
2012-13
adcA
2007-08
Percentage of Undergraduate Students
NOTES IPEDS headcount enrollments are adjusted for the difference between total headcount which counts students more than once if they are enrolled in more than one institution at the same time and unduplicated headcount reported by the National Student Clearinghouse (NSC) Twelve-month undergraduate headcount for 2017-18 is estimated from NSC data Percentages may not sum to 100 because of rounding
SOURCES NCES Postsecondary Institutions and Cost of Attendance in 2017-18 Degrees and Other Awards Conferred 2016-17 and 12-Month Enrollment 2016-17 First Look (Preliminary Data) and earlier editions National Student Clearinghouse Current Term Enrollment Estimates Spring 2018US Department of Education Federal Student Aid Data Center Title IV Program Volume Reports and Aid Recipients Summary calculations by the authors
For detailed data behind the graphs and additional information please visit trendscollegeboardorg
As of March 2018 56 of borrowers owed less than $20000 These borrowers held 15 of the outstanding federal debt
In 2017-18 71 of undergraduates did not borrow either subsidized or unsubsidized Stafford Loans That percentage was 70 in 2007-08 and 63 in 2012-13
In 2017-18 5 of undergraduate students borrowed subsidized loans only 5 borrowed unsubsidized loans only and 19 borrowed from both programs In other words two-thirds of the 29 who borrowed Stafford Loans took both subsidized and unsubsidized loans
A decade earlier in 2007-08 12 of undergraduates borrowed only subsidized loans Among the 29 who borrowed less than half of the students borrowed both subsidized and unsubsidized loans
ALSO IMPORTANT
Figure 12 shows that 29 of undergraduates took federal student loans in 2017-18 This percentage is lower than the share of students who graduate with debt for a number of reasons Many students who borrow do not borrow every year In 2015-16 among enrolled students who had borrowed at some point as undergraduates 70 borrowed federal student loans (NPSAS 2016)
Part-time students borrow at lower rates than full-time students In 2015-16 half of all full-time undergraduates used federal student loans compared with just 18 of those who were enrolled exclusively part time (NPSAS 2016)
19
5 5 19
7 9
71
63
70
22
12 4 13
In March 2018 borrowers in IDR plans held 49 of the outstanding debt in repayment under the federal
Direct Loan program up from 27 in 2014
Outstanding Federal LoansParticipation in Income-Driven Repayment (IDR) plans for federal student loans has grown dramatically in recent years In March 2018 29 of the borrowers in repayment on federal Direct Loans were in programs limiting their payments to an affordable percentage of their discretionary incomes up from 13 in 2014
FIGURE 13A Distribution of Outstanding Federal Direct Loan Dollars and Borrowers by Repayment Plan Second Quarter 2014 2016 and 2018
60
40
20
0
2014 2016 2018
911
10
13
13
12
14
12
14
27
41
49
13
23
29
42
33
26
64
54
47
13
18
13
Dollars Borrowers Dollars Borrowers Dollars Borrowers Dollars Borrowers Income Driven Level Payments Level Payments Graduated Payments
10 Years or Less More Than 10 Years or Alternative
Repayment Plan
NOTES Includes Direct Loan borrowers in repayment deferment and forbearance Because some borrowers have multiple loans recipients may be counted multiple times across varying loan statuses Income-driven plans include REPAYE Pay As You Earn Income-Contingent Repayment and Income-Based Repayment Level payment plans require monthly payments that are the same over a fixed period of time Alternative repayment plans are customized to borrowersrsquo circumstances Under the graduated payment plan monthly payments increase over time The second quarter of FY18 ended on March 31 2018 Percentages may not sum to 100 because of rounding
SOURCE US Department of Education Federal Student Aid Data Center Federal Student Loan Portfolio
FIGURE 13B Repayment Status of Federal Education Loan Portfolio Second Quarter FY18
45
54
18
12
9
11
7
10
3
2
17
11
Percentage of BorrowersPercentage of Dollars
Default
Grace
Forbearance
Deferment
Repa
ymen
t Sta
tus
In-School
Repayment
NOTES Includes both loans made under the Federal Direct Loan Program and loans made under the Federal Family Education Loan Program (FFEL) and held by the US Department of Education Excludes the $200 billion in outstanding FFEL loans not held by the federal government The second quarter of FY18 ended on March 31 2018
SOURCE US Department of Education Federal Student Aid Data Center Federal Student Loan Portfolio
In March 2018 17 of borrowersmdashbut 11 of outstanding dollarsmdashwere in default The average balance on defaulted loans was $18600 compared with $29200 for all outstanding loans
ALSO IMPORTANT
Borrowers in IDR plans have higher average balances than those in other repayment plansmdash$56200 vs $24000 in March 2018
There are several IDR plans Just over 40 of borrowers in IDR plans are in the Income-Based Repayment plan which after July 2014 limits payments for new borrowers to 10 of income above 150 of the poverty line and forgives remaining debt after 20 years of eligible payments Earlier borrowers pay 15 of income above 150 of the poverty line for 25 years
Revised Pay As You Earn (REPAYE) launched in 2015makes all federal Direct Loan borrowers eligible for IDR plans In March 2018 among IDR plans about30 of borrowers and 30 of the dollars were in the REPAYE plan
Average Federal Loan Balance Number of Borrowers andTotal Balance by Repayment Status Second Quarter 2018
Repayment
In-School
Average Balance
$34600
$19800
Number of Borrowers (in Millions)
186
72
Total Balance (in Billions)
$6430
$1425
Deferment $33200 38 $1263
Forbearance $42600 28 $1193
Grace $19300 13 $251
Default $18600 70 $1303
Other $32000 03 $96
Total $29200 410 $11961
NOTE Repayment in active repayment status In-School borrower is still enrolled never entered repayment Deferment payments postponed because of economic hardship military service or returning to school Forbearance payment temporarily suspended or reduced because of financial hardships Grace six-month period after borrower is no longer enrolled at least half time Default more than 360 days delinquent ldquoOtherrdquo category includes loans that are in non-defaulted bankruptcy and in a disability status
For detailed data behind the graphs and additional information please visit trendscollegeboardorg 20
Completers had higher repayment rates than noncompleters in all sectors but completers from the for-profit sector had lower repayment rates than noncompleters from the public and private nonprofit four-year sectors
In all sectors dependent students had higher repayment rates than independent students Repayment rates ranged from 30 for independent students from the for-profit sector and 38 for those from publi c two-year colleges to 67 for dependent students from the private nonprofit four-year sector and 69 for those from the public four-year sector
Borrowers can be in good standing without paying down the principal owed They may be enrolled in an Income-Driven Repayment (IDR) plan Some may have no requ ired payments and for others the required payments may be too small to cover the interest charged leading to increases in the balance owed In addition borrowers may be in deferment or forbearance and not required to make payments in their current circumstances
Completers Noncompleters
68 Public Two-Year
39
79Public Four-Year
54
Sect
or
Sect
or 80Private NonprofitFour-Year 54
43For-Profit 26
67All 41
Dependent Independent
52Public Two-Year
38
69Public Four-Year 55
67Private NonprofitFour-Year 52
41For-Profit 30
65All 46
0 20 40 60 80 Repayment Rate
Federal Student Loan Five-Year Repayment Rate by Completion Status and by Dependency Status Borrowers Entering Repayment in 2009-10 and 2010-11
FIGURE 14B Federal Student Loan One-Year Three-Year Five-Year and Seven-Year Repayment Rates by Sector Borrowers Entering Repayment in 2007-08 and 2008-09
1-Year 3-Year 5-Year 7-Year
45 47
50 53
62
65 68
71
63
31
33 36
41
50 53
57 62
66 69
72
0
20
40
60
Repa
ymen
t Rat
e
Public Public Private Nonprofit For-Profit All Two-Year Four-Year Four-Year
Federal Loans Repayment RatesSixty-seven percent of federal student loan borrowers who entered repayment in 2009-10 and 2010-11 after earning a degree or certificate had paid down at least one dollar of their loan principal after five years This repayment rate was 41 for noncompleters
FIGURE 14A
In all sectors the share of borrowers who have made some progress paying down their student debt increases as time in repayment increases The largest increments are for borrowers from for-profit institutions where the repayment rate for borrowers who entered repayment in 2007-08 and 2008-09 rose from 31 after one year to 41 after seven years
After seven years 41 of borrowers from for-profitinstitutions had reduced their loan balances by at least one dollar This repayment rate was lower thanthe one-year repayment rates in all other sectorsincluding public two-year colleges where therepayment rate rose from 45 after one year to53 after seven years
ALSO IMPORTANT
NOTES The repayment rate is defined as the percentage of borrowers in each repayment cohort whose payments reduced the loan principal by at least one dollar after the specified number of years Repayment status on each loan is attributed to the school for which the loan was taken Therefore a student can be counted in the repayment cohorts of more than one institution
SOURCES US Department of Education College Scorecard data calculations by the authors
For detailed data behind the graphs and additional information please visit trendscollegeboardorg 21
In 2016-17 average debt per bachelorrsquos degree recipient including both those who borrowed and those who did not was $16700 for the two sectors combined 1 higher than in 2011-12
Students who earn their bachelorrsquos degrees at for-profit institutions not included in Figure 15 are more likely to borrow and accumulate higher average levels of debt than those who graduate from public and private nonprofit four-year colleges (Figure 16)
Figure 15 includes only students who earned their bachelorrsquos degrees at the institutions in which they first enrolled Students who attend two or more institutions may have different borrowing patterns
$15
200
$26
200
$15
500
$26
900
$11
200
$21
600
$12
400
$22
500
Private Nonprofit Four-Year
162
00
254
00
199
00
300
00
203
00
317
00
326
00
$20
000
Per Borrower Per Degree Recipient
Public Four-Year
Aver
age
Cum
ulat
ive
Deb
t in
2017
Dol
lars
Av
erag
e Cu
mul
ativ
e D
ebt i
n 20
17 D
olla
rs
$30000
$20000
$10000
$0 2001-02 (52) 2006-07 (55) 2011-12 (58) 2016-17 (58)
Academic Year (Percentage of Graduates Who Borrowed)
$30000
$20000
$10000
$$ $$ $$ $$0 2001-02 (64) 2006-07 (66) 2011-12 (64) 2016-17 (61)
Academic Year (Percentage of Graduates Who Borrowed)
Average Cumulative Debt Levels in 2017 Dollars Bachelorrsquos Degree Recipients at Public and Private Nonprofit Four-Year Institutions 2001-02 to 2016-17 Selected Years
Cumulative Debt Bachelorrsquos Degree RecipientsIn 2016-17 the 59 of bachelorrsquos degree recipients from public and private nonprofit institutions who borrowed graduated with an average of $28500 in debt an increase of 3 in inflation-adjusted dollars over the average amount borrowed in 2011-12
FIGURE 15
Average debt among public four-year college graduate borrowers rose by 3 ($700 in 2017 dollars) between 2011-12 and 2016-17 following a 16 ($3700) increase over the previous five years Average debt per graduate (including those who did not borrow) increased by 23 ($2800) between 2006-07 and 2011-12 and by 2 ($300) between 2011-12 and 2016-17
Borrowing among private nonprofit four-year college graduates rose rapidly between 2001-02 and 2006-07 but slowed over the next 10 years Average debt per borrower increased by 6 ($1700 in 2017 dollars) between 2006-07 and 2011-12 and by 3 ($900) between 2011-12 and 2016-17 Average debt per graduate rose by 2 ($400) between 2006-07 and 2011-12 and fell by 1 ($300) between 2011-12 and 2016-17
The share of public four-year college bachelorrsquos degree recipients graduating with debt rose from 52 in 2001-02 to 58 in 2011-12 but remained at 58 in 2016-17 The share of private nonprofit four-year college bachelorrsquos degree recipients graduating with debt rose from 64 in 2001-02 to 66 in 2006-07 but fell to 61 over the following decade
ALSO IMPORTANT
NOTES Figures include federal and nonfederal loans taken by students who began their studies at the institution from which they graduated Parent PLUS loans are not included The orange bars represent the average cumulative debt levels of bachelorrsquos degree recipients who took student loans The blue bars represent the average debt per bachelorrsquos degree recipient including those who graduated without student debt Calculations are based on the number of bachelorrsquos degrees awarded which typically exceeds the number of students receiving degrees The available data are not adequate to allow comparable calculations for for-profit institutions
SOURCES College Board Annual Survey of Colleges 2002 to 2017 calculations by the authors
Average Cumulative Debt in 2017 Dollars Bachelorrsquos Degree Recipients at Public and Private Nonprofit Four-Year Institutions 2001-02 to 2016-17 Selected Years
Percentage with Debt
Average Debt per Borrower
Average Debt per Graduate
2001-02 56 $23000 $12800
2006-07 58 $25000 $14600
2011-12 60 $27800 $16600
2016-17 59 $28500 $16700
For detailed data behind the graphs and additional information please visit trendscollegeboardorg 22
Half of the students who completed associate degrees in 2015-16 graduated without taking student loans This included 59 of those who graduated from public two-year colleges and 12 of those who earned their degrees from for-profit institutions
In 2015-16 non-degree-granting for-profit institutions granted 30 of all undergraduate certificates Among students completing these programs 15 did not take student loans and 17 borrowed $20000 or more More than half of certificate completers who attended public two-year institutions graduated without debt and 15 borrowed $20000 or more
Undergraduate certificate programs are short-term programs that prepare students for gainful employment in a recognized occupation To qualify for federal financial aid they must meet program hour specifications
In 2015-16 24 of the 39 million undergraduate credentials conferred were certificates 26 were associate degrees and 50 were bachelorrsquos degrees (NCES Digest of Education Statistics 2017Table 31840)
Bachelorrsquos Degree Recipients
No Debt $1 to $10000 to $20000 to $30000 to $40000 to $50000
All
Public Four-Year (60)
Private NonprofitFour-Year (27)
For-Profit (9)
All
Public Two-Year (82)
For-Profit (11)
All
Public Two-Year (33)
Public Non-Degree-Granting (9)
Private Nonprofit Two-Year or Less (6)
For-Profit Two-Year or More (19)
For-Profit Non-Degree-Granting (30)
$9999 $19999 $29999 $39999 $49999 or More
29 11 13 17 12 8 11
31 11 14 18 12 6 7
13 8 11 15
28 12 19 9 12 8 12
7 14 32
Associate Degree Recipients
No Debt $1 to $10000 to $20000 to $30000 to $40000 $9999 $19999 $29999 $39999 or More
51 13 5 5 17 10
3
1859 12
3
7
12 12 19 25 17 16
Certificate Recipients
No Debt $1 to $10000 to $20000 to $30000 $9999 $19999 $29999 or More
33 21
8
8 30 9
52 22 11 7
3
19
3
69 6
17 32
17 29
29 14
34 11
15 38 30 10 7
9
8
Cumulative Debt Undergraduate Degree RecipientsThe share of 2015-16 bachelorrsquos degree recipients who borrowed $50000 or more for their undergraduate studies ranged from 7 of those who earned their degrees at public four-year colleges and universities to 32 of those who graduated from for-profit institutions
FIGURE 16 D istribution of 2015-16 Degree or Certificate Completers by Cumulative Amount Borrowed for Undergraduate Study
ALSO IMPORTANT
Average debt by type of degree conceals considerable variation across borrowers of different backgrounds For example among bachelorrsquos degree recipients 11 of dependent students borrowed $40000 or more while 28 of independent students borrowed this much And among dependent students the share of students borrowing to fund their bachelorrsquos degrees goes down as family incomes go up
NOTES Percentages in parentheses on vertical axes represent the share of students earningtheir credentials in the specified sectors These percentages do not sum to 100 because a smallpercentage of students earn degrees at institutions not included in the sectors reported Forexample the bachelorrsquos degree graph excludes students who earned their bachelorrsquos degrees at public and private nonprofit two-year schools and the associate degree and certificate graphsexclude students who earned their credentials at public and private nonprofit four-year schools
SOURCES NCES National Postsecondary Student Aid Study (NPSAS) 2016 calculations by the authors
For detailed data behind the graphs and additional information please visit trendscollegeboardorg 23
The share of masterrsquos degree recipients who did not borrow for graduate school ranged from a low of 21 at for-profit institutions to a high of 42 at public universities
More than half of public university doctoral degree recipients avoided borrowing for graduate school while 12 borrowed $100000 or more
Sixteen percent of 2015-16 doctoral degree recipients earned their degrees at for-profit institutions 51 of these students borrowed $100000 or more for graduate school
More than one-quarter of students who earned professional degrees at private nonprofit universities in 2015-16 borrowed $200000 or more for graduate study as did 9 of those who graduated with professional degrees from public universities
In 2016 median earnings among adults 25 and older were $91600 for those with doctoral degrees and $100100 for those with professional degrees (US Census Bureau Table PINC-03)
All
Public (47)
Private Nonprofit (43)
For-Profit (10)
All
Public (52)
Private Nonprofit (32)
For-Profit (16)
All
Public (42)
Private Nonprofit (53)
For-Profit (4)
Masterrsquos Degree Recipients
No Debt $1 to $25000 to $50000 to $75000 to $100000 $24999 $49999 $74999 $99999 or More
38 21 20 12 4 5
42
3
24 19 10
2
38 18 19 14 5 6
21 31 7 8 20 13
Doctoral Degree Recipients
No Debt $1 to $50000 to $100000 to $150000 $49999 $99999 $149999 or More
42 21 16 13
55
7
6
6 19 14 6
35 30 18 11
15 13 21 38 13
Professional Degree Recipients
No Debt $1 to $50000 to $100000 to $150000 to $200000$49999 $99999 $149999 $199999 or More
21 13 15 16 14 20
20 17 20 23 10 9
24 10 11 10 17 28
7 12 13 18 22 28
Cumulative Debt Graduate Degree RecipientsIn 2015-16 5 of masterrsquos degree recipients 20 of doctoral degree recipients and 50 of professional degree recipients borrowed $100000 or more to fund their graduate school study
Distribution of 2015-16 Advanced Degree Recipients by Cumulative Amount Borrowed for Graduate Study
ALSO IMPORTANT
Almost three-quarters of graduate-level credentials earned are masterrsquos degrees 12 are professional degrees 5 are research doctoral degrees and the remaining credentials are post-baccalaureate certificates (NPSAS 2016)
Professional degrees include those in chiropractic medicine dentistry law medicine optometry osteopathic medicine pharmacy podiatry and veterinary medicine
NOTES Includes all loans borrowed for graduate study Percentages on the vertical axis represent shares of graduates from each sector Percentages may not sum to 100 because of rounding
SOURCES NCES National Postsecondary Student Aid Study (NPSAS) 2016 calculations by the authors
For detailed data behind the graphs and additional information please visit trendscollegeboardorg 24
FIGURE 17
Federal VeteransDepartment State Institutional Private and (Nonmilitary) of Defense Employer
Public Four-Year
All Full-Time 7 20 31 13 $7300Students
Independent 21 13 17 9 $8460Students (17)
Dependent 14 $7060Students (83)
3
Less than 25 20 8 $11700$35000 (26)
$35000 to 25 33 11 $8280$69999 (21)
7 3 $70000 to
21 $4830$119999 (25)
39
27 21 35
46
28
17 53
57
30
3 10 $120000 or
25 $3810Higher (28) 7
$0 $2000 $4000 $6000 $8000 $10000 $12000
Public Two-Year
8 All Full-Time
$4680Students 10
4 Independent
27 $5750Students (34)
56 12 14
54 10
57 17 14
75 14
53 19 15
45
11 4 Dependent
$4130Students (66)
6 Less than
$6550$35000 (36) 11 5
$35000 to $3710$69999 (29)
3 $70000 to
27 37 26 $1980$119999 (24) 7 14$120000 or
36 $2140Higher (12) 4
$0 $2000 $4000 $6000 $8000 $10000 $12000
Dep
ende
nt S
tude
nts
D
epen
dent
Stu
dent
s
Pare
ntsrsquo
Inco
me
Pare
ntsrsquo
Inco
me
Sources of Grant Aid Public Institutions In 2015-16 full-time students received an average of $7300 in grant aid at public four-year institutions and $4680 at public two-year institutions
FIGURE 18 Sources of Grant Aid Full-Time Students at Public Institutions 2015-16
NOTES Includes full-time undergraduate students who were US citizens or permanent residents Percentages may not sum to 100 because of rounding
SOURCES NCES NPSAS 2016 calculations by the authors
At both public four-year and public two-yearinstitutions full-time independent studentsreceived more grant aid on average than dependentstudents Independent students received lessfunding from state institutional and private and employer grants but more from federal grants andparticularly veterans and military grants
At public four-year colleges and universitiesdependent students from families with incomes lessthan $35000 received almost half of their grant aid from the federal government Those from familieswith incomes of $70000 or more received very little federal aid more than half of the grant aid these students received came from their institutions
At public two-year colleges dependent students from families with incomes less than $35000 received three-quarters of their grant aid from the federal government Institutional grant aid in this sector was skewed toward more affluent students with average grants ranging from $230 per independent student and $380 per dependent student from families with incomes less than $35000 to $970 for those from families with incomes of $120000 or higher
ALSO IMPORTANT
In 2015-16 public doctoral universities awarded institutional aid averaging $5750 to 43 of their full-time domestic undergraduate studentsmdashanaverage of $2490 per student Public nondoctoral universities awarded institutional aid averaging $3730 to 30 of their full-time domestic undergraduatestudentsmdashan average of $1110 per student
Students from higher-income families attending public four-year institutions are more likely than those from lower-income families to attend doctoral universities In 2015-16 76 of dependent students from thelowest family income quartile attended doctoral universities and 24 attended non-doctoral-grantinginstitutions Among those from the highest income quartile these shares were 85 and 15 respectively
For detailed data behind the graphs and additional information please visit trendscollegeboardorg 25
Average total grant aid for independent students at private nonprofit institutions was only about 60 of the average amount received by dependent students in 2015-16 Independent students received more funding from federal grants including aid to veterans and the military but less from states from private sources and employers and particularly from institutions
Federal VeteransDepartment State Institutional (Nonmilitary) of Defense
Private Nonprofit Four-Year
3 All Full-Time
10 5 74 8 $19050Students
6 Independent
24 19 43 8 $11890Students (20)
Dependent8 5 78 8 $20780Students (80)
Less than 22 8 63
Private and Employer
6 $26220$35000 (19)
$35000 to10 7 77 6 $24710$69999 (20) 2
$70000 to86 7 $20900$119999 (23)
4 $120000 or
85 11 $15860Higher (38) 2
$0 $5000 $10000 $15000 $20000 $25000 $30000
For-Profit
4 All Full-Time 33 6 $8400Students
Independent40 6 $8820Students (75)
3 Dependent
8 $7160Students (25)
4 Less than
6 $8940$35000 (49)
$35000 to9 $6650$69999 (28)
2 4$70000 to
19 58 17 $5070$119999 (14)
42 15
41 10
45 7 9 31
9 21
34 10 10 38
78
59
7 13 $120000 or
$2490Higher (9) 2
$0 $2000 $4000 $6000 $8000 $10000
Dep
ende
nt S
tude
nts
D
epen
dent
Stu
dent
s
Pare
ntsrsquo
Inco
me
Pare
ntsrsquo
Inco
me
FIGURE 19 Sources of Grant Aid Full-Time Students at Private Institutions 2015-16
Sources of Grant Aid Private Institutions In 2015-16 low-income students enrolled full time at private nonprofit four-year colleges and universities received 63 of their total grant aid from their institutionsmdashan average of $16590 per student out of a total of $26220 of grant aid from all sources
NOTES Includes full-time undergraduate students who were US citizens or permanent residents Percentages may not sum to 100 because of rounding
SOURCES NCES NPSAS 2016 calculations by the authors
Students from families with incomes of $120000 or higher received 85 of their total grant aid from their institutionsmdashan average of $13510 per student out of a total of $15860
In 2015-16 full-time students at for-profit institutions received 42 of their grant aid from federal nonmilitary grants 33 from veterans and military grants and 15 from their institutions
Average institutional grant aid per student in thefor-profit sector ranged from $910 for independentstudents and $1920 for dependent students fromfamilies with incomes below $35000 to $2920 for those with incomes between $70000 and $120000
ALSO IMPORTANT
In 2015-16 very selective private nonprofit four-year institutions awarded 73 of their full-time domestic students an average of $24340 in grant aidmdashan average of $17670 per student Forty-five percentof dependent students from families with incomes of $120000 or more enrolled in the private nonprofit sector attended these very selective institutions as did 25 to 30 of those from lower-income families and 21 of independent students (Selectivity is defined by NPSAS based on the share of students admitted and SATregACT scores)
Minimally selective and open admission four-year private nonprofit institutions awarded 43 of their full-time students an average of $11450 in grant aidmdashan average of $4910 per student Four percent of dependent students from families with incomes of $120000 or more enrolled in the private nonprofit sector attended these institutions compared with 20 of those from the lowest-income families and 34 of independent students in this sector
For detailed data behind the graphs and additional information please visit trendscollegeboardorg 26
The number of undergraduates declined by26 million (10) between 2011-12 and 2017-18 The number of Pell Grant recipients declined by24 million (26) over these six years
Number of Recipients (in Millions)
Total Pell Expenditures (in Billions) $50 10
Tota
l Pel
l Exp
endi
ture
s in
Bill
ions
of 2
017
Dol
lars
Num
ber of Pell Recipients (in Millions)$10
$20
$30
$40$40
2
4
6
8
$61
20
$61 $81
$108 $97
$158 $172
$343
$282
25 29
40 37
48
55
90
70
$0 0 77-78 82-83 87-88 92-93 97-98 02-03 07-08 12-13 17-18
Year
1977-78
Percentage of Recipients Who Were Independent
39
1987-88 58
1997-98 57
2007-08 58
2012-13 58
2013-14 56
2014-15 55
2015-16 53
2016-17 51
12-Month Undergraduate Headcount Enrollment Pell Recipients
252246 24725
0
10
219 232
241 236 232 227 224 222
17-1816-1715-1614-1513-1412-1311-1210-1109-1008-0907-08
25 26 33 37 38 37 37 36 34 32 32
5
20
Mill
ions
of S
tude
nts
15
Pell Grants The share of undergraduate students receiving Pell Grants rose from 25 in 2007-08 to a peak of 38 in2011-12 It then declined steadily to 32 in 2017-18
FIGURE 20A Undergraduate Enrollment and Percentage of UndergraduateStudents Receiving Pell Grants 2007-08 to 2017-18
NOTES IPEDS headcount enrollments are adjusted for the difference between total headcount which counts students more than once if they are enrolled in more than one institution at the same time and unduplicated headcount reported by the National Student Clearinghouse (NSC) Twelve-month undergraduate headcount for 2017-18 is estimated from NSC data
SOURCES NCES Postsecondary Institutions and Cost of Attendance in 2017-18 Degrees and Other Awards Conferred 2016-17 and 12-Month Enrollment 2016-17 First Look (Preliminary Data) and earlier editions National Student Clearinghouse Current Term Enrollment Estimates Spring 2018 US Department of Education Federal Pell Grant Program End-of-Year Report 2016-17US Department of Education Federal Student Aid Data Center Title IV Program Volume Reports and Aid Recipients Summary calculations by the authors
FIGURE 20B Total Pell Grant Expenditures and Number of Recipients 1977-78 to 2017-18
Total Pell Grant expenditures increased from $61 billion (in 2017 dollars) in 1977-78 to $97 billion in 1997-98 and to $282 billion in 2017-18 Over the decade from 2007-08 to 2017-18 expenditures spiked from $172 billion in 2007-08 to $401 billion in 2010-11 before falling back to $282 billion in 2017-18
The percentage of Pell Grant recipients who are independent students with eligibility determined bytheir own financial circumstances rather than those of their parents increased from 39 in 1977-78 to 57 in 1997-98 This percentage declined from 58 in 2007-08 and 2012-13 to 51 in 2016-17
ALSO IMPORTANT
Changes in Pell Grant expenditures result from changes in the legislated maximum grant the formula for determining expected family contributions the number of enrolled students the share of students enrolling full time and the financial circumstances of students and families
Percentage of Recipients Who Were Independent 1977-78to 2016-17 Selected Years
SOURCES US Department of Education Federal Pell Grant Program End-of-Year Report 1977-78 through 2016-17US Department of Education Federal Student Aid Data Center Title IV Program Volume Reports and Aid Recipients Summary calculations by the authors
For detailed data behind the graphs and additional information please visit trendscollegeboardorg 27
FIGURE 21A Maximum and Average Pell Grants in 2017 Dollars 1977-78 to 2017-18
Max
imum
and
Ave
rage
Gra
nt in
201
7 D
olla
rs
$3000
$4000
$5000
$6000
Maximum Pell Grant
Average Pell Grant per Recipient
$5620
$3040
$4520
$4120
$5060
$5920
$2800 $2590
$3110
$4010
$2000
$1000
$0 77-78 82-83 87-88 92-93 97-98 02-03 07-08 12-13 17-18
FIGURE 21B Inflation-Adjusted Maximum Pell Grant and Published Prices at Public and Private Nonprofit Four-Year Institutions in 2018 Dollars 1998-99 to 2018-19
$48510 $50000
Public Four-Year Tuition and Fees and Room and
Board
Private Nonprofit Four-Year Tuition and Fees and Room and Board
Private Nonprofit Four-Year Tuition and Fees
$22710
$28430
$35830
$31600
$38720
$21370
$40000
$30000
Public Four-Year Tuition and Fees
$5010 $7560
$10230 $12000
$16470
$5420 $6100
$20000
$10000
$4630 Maximum Pell Grant $0
98-99 00-01 02-03 04-05 06-07 08-09 00-11 12-13 14-15 16-17 18-19
The maximum Pell Grant is the most frequently cited measure of per-student subsidies provided by the program However most students receive smaller grants because they are enrolled part time or because their family incomes and assets reduce their aid eligibility In 2017-18 when the maximum Pell Grant was $5920 the average grant was $4010
The percentage of average public four-year in-state published tuition and fees covered by the maximum Pell Grant declined from 92 in 1998-99 to 72 in 2008-09 and to 60 in 2018-19
In 2016-17 27 of recipients received the maximum grant of $5815 (US Department of Education Federal Pell Grant Program End-of-Year Report 2016-17Table 3A)
Between 2008-09 and 2018-19 published tuition and fees increased by 31 per year at public four-year institutions and by 23 per year at private nonprofit institutions while the maximum Pell Grant increased by 12 per year after adjusting for inflation
Pell Grants The maximum Pell Grant amount which is legislated by Congress has fluctuated over time The $5920 maximum Pell Grant in 2017-18 was 44 higher in inflation-adjusted dollars than it was 20 years earlier but only 5 higher than it was 40 years earlier in 1977-78
The percentage of average private nonprofit four-year published tuition and fees covered by the maximum Pell Grant declined from 20 in 1998-99 to 19 in 2008-09 and to 17 in 2018-19
ALSO IMPORTANT
The maximum Pell Grant for 2018-19 is $6095 about the same as in 2017-18 after adjusting for the 30 increase in the Consumer Price Index
SOURCES US Department of Education Federal Pell Grant Program End-of-Year Report 1977-78 through 2016-17 US Department of Education Federal Student Aid Data Center Title IV Program Volume Reports and Aid Recipients Summary calculations by the authors
2018
Dol
lars
Maximum Pell Grant as a Percentage of Published Prices in 2018 Dollars 1998-99 to 2018-19 Selected Years
Public Four-Year In-State Private Nonprofit Four-Year
Tuition and Fees
Tuition and Fees and
Room and Board
Tuition and Fees
Tuition and Fees and
Room and Board
98-99 92 39 20 15
03-04 87 38 21 16
08-09 72 33 19 14
13-14 64 31 19 14
18-19 60 29 17 13 SOURCES The College Board Trends in College Pricing 2018 Table 2 online US Department of Education Federal Student Aid Data Center
For detailed data behind the graphs and additional information please visit trendscollegeboardorg 28
Distribution of Pell Grant Recipients by Dependency Status and Family Income 2016-17
Independent Without Dependents (21)
Independent with Dependents (30)
Dependent (49)
$9000 or $9001 to $20001 to $40001 to $50001 or Less $20000 $40000 $50000 Higher
53 35 11
21 26
16
32 9
36 12
12
21 15
Percentage of Pell Grant Recipients
41 and Older (7) 517400
31 to 40 (13) 924300
24 to 30 (23) 1678000
20 to 23 (33) 2396600
19 or Younger (23) 1678500
0 05 10 15 20 25 30
Number of Pell Grant Recipients (Millions)(Total = 72 Million)
Pell Grants In 2016-17 56 of Pell Grant recipients were younger than 24 23 were between 24 and 30 and 20 were older than 30
FIGURE 22A Distribution of Pell Grant Recipients by Age 2016-17
NOTES Percentages on the vertical axis represent percentages of recipients in each age groupPercentages may not sum to 100 because of rounding
SOURCE US Department of Education 2016-17 Federal Pell Grant Program End-of-Year ReportTable 11A
FIGURE 22B
NOTES Percentages on the vertical axis represent percentages of recipients in each group Percentages may not sum to 100 because of rounding
SOURCE US Department of Education 2016-17 Federal Pell Grant Program End-of-Year ReportTable 2
In 2016-17 49 of Pell Grant recipients were dependent students 37 of these students camefrom families with incomes of $20000 or less andanother 36 came from families with incomes between $20000 and $40000
Fifty-one percent of 2016-17 Pell Grant recipients were independent students 30 had dependentsof their own and 21 were independent studentswithout dependents
Among independent Pell Grant recipients withdependents 47 had family incomes of $20000or less and another 32 had incomes between$20000 and $40000
Fifty-three percent of independent Pell Grantrecipients without dependents had family incomesof $9000 or less another 35 had incomesbetween $9000 and $20000
ALSO IMPORTANT
The age distribution of Pell Grant recipients in 2016-17 was similar to the age distribution in 1996-97 In both years 56 of recipients were 23 or younger and 20were over age 30 However between 2009-10 and2011-12 about one-quarter of Pell Grant recipients were over the age of 30 (Federal Pell Grant Program End-of-Year Reports 1996-97 and 2016-17)
In 2016-17 63 of Pell Grant recipients had zero expected family contribution (EFC) This included 51 of dependent recipients 63 of independent recipients without dependents and 81 ofindependent recipients with dependents (2016-17 Federal Pell Grant Program End-of-Year Report Table 2)
In 2016-17 12 of dependent recipients received a Pell Grant of less than $1500 and 38 received$5400 or more (2016-17 Federal Pell Grant ProgramEnd-of-Year Report Table 3B)
For detailed data behind the graphs and additional information please visit trendscollegeboardorg 29
FIGURE 23B Need-Based State Grant Aid as a Percentage of Total Undergraduate State Grant Aid by State 2016-17
$820 $800 $750
Non-Need-Based $700$670
$0 76-77 81-82 86-87 91-92 96-97 01-02 06-07 11-12 16-17
Aver
age
Stat
e G
rant
per
FTE
Unde
rgra
duat
e St
uden
t
100
100
100
100
100
100
91
90
91
91
91
90
90
89
88
89
90
90
87
86
85
Need-Based $600
$520
$430 $390$400 $380
$320
$200
83
82
78
76
76
77
74
73
72
72
73
72
73
71
74
75
76
76
76
76
95 99100 100
80 76
60
46
40
20 17
Geo
rgia
Sout
h Da
kota
Arka
nsas
Loui
sian
aSo
uth
Caro
lina
Utah
New
Mex
ico
Neva
daTe
nnes
see
Mon
tana
Alas
kaFl
orid
aW
est V
irgin
iaKe
ntuc
kyM
issi
ssip
piDe
law
are
Mis
sour
iNo
rth
Dako
taO
hio
Unite
d St
ates
Vi
rgin
iaO
klah
oma
Nebr
aska
Iow
aAl
abam
aCo
lora
doNe
w Yo
rkW
ashi
ngto
nM
assa
chus
etts
Wis
cons
inNo
rth
Caro
lina
Indi
ana
Idah
oNe
w J
erse
yM
ichi
gan
Mar
ylan
dCo
nnec
ticut
Min
neso
taPe
nnsy
lvan
iaVe
rmon
tIlli
nois
Calif
orni
aAr
izona
Haw
aii
Kans
asM
aine
Ore
gon
Rhod
e Is
land
Texa
sW
yom
ing
00
Perc
enta
ge o
f Sta
te G
rant
sBa
sed
on F
inan
cial
Nee
d
In 1981-82 and earlier years virtually all state grant aid was based on studentsrsquo financial circumstances The share that was need-based declined gradually to a low of 71 in 2010-11 From 2013-14 through 2016-17 76 of state grant aid was need-based
In 2016-17 half of the states considered studentsrsquo financial circumstances in allocating at least 95 of their state grant aid Fifteen states considered studentsrsquo financial circumstances when awarding less than half of their state grant aid
Need-Based and Non-Need-Based State Grants per Full-Time Equivalent Undergraduate Student in 2016 Dollars 1976-77 to 2016-17
State Grants State grant aid per full-time equivalent undergraduate student rose for the fifth consecutive year in 2016-17 to $820mdashan increase of $120 (17) since 2011-12
FIGURE 23A
NOTE Percentages displayed represent percentages of total undergraduate state grant aid for which studentsrsquo financial circumstances were considered
SOURCE National Association of State Student Grant and Aid Programs (NASSGAP) Annual Survey 1976-77 to 2016-17 Tables 1 and 12
NOTES Need-based aid includes any grants for which financial circumstances contribute to eligibility Non-need-based aid refers to grants for which financial circumstances have no influence on eligibility New Hampshire did not award state grant aid to undergraduate students in 2016-17
SOURCE NASSGAP Annual Survey 2016-17 Table 1
ALSO IMPORTANT
Total spending on state grant aid increased from $9 billion (in 2016 dollars) in 2006-07 to $10 billion in 2011-12 and to $11 billion in 2016-17 (NASSGAP Annual Survey 2006-07 2011-12 and 2016-17)
For detailed data behind the graphs and additional information please visit trendscollegeboardorg 30
$2190
Stat
e G
rant
Aid
per
FTE
Stu
dent
$1000
$500
$0
New
Ham
pshi
reM
onta
naAr
izona
Utah
Haw
aii
Kans
asId
aho
Sout
h Da
kota
Rhod
e Is
land
Nebr
aska
Conn
ectic
utM
issi
ssip
piM
ichi
gan
Ohi
oM
assa
chus
etts
Alab
ama
Mai
neIo
wa
Mar
ylan
dO
rego
nNo
rth
Dako
taM
isso
uri
Colo
rado
Wis
cons
inNe
vada
Flor
ida
Dela
war
eO
klah
oma
Verm
ont
Illino
isW
yom
ing
Nort
h Ca
rolin
a Un
ited
Stat
esPe
nnsy
lvan
iaTe
xas
Min
neso
taAl
aska
Arka
nsas
Virg
inia
New
York
Indi
ana
Wes
t Virg
inia
Calif
orni
a W
ashi
ngto
nNe
w M
exic
oLo
uisi
ana
Kent
ucky
Ne
w J
erse
y Te
nnes
see
$0 $150
$390 $550
$820
$2000
$1500 $1290
$1110
Geo
rgia
Sout
h Ca
rolin
a
Gra
nt A
id a
s a
Perc
enta
geof
Fis
cal S
uppo
rt
30
20
10
0
13
0
36
New
Ham
pshi
reHa
wai
iM
onta
naUt
ahId
aho
Kans
asSo
uth
Dako
taAr
izona
Nebr
aska
Co
nnec
ticut
Mis
siss
ippi
Wyo
min
gNo
rth
Dako
taRh
ode
Isla
ndM
aryl
and
Alas
kaAl
abam
aO
hio
Mic
higa
nM
assa
chus
etts
Mai
neNe
vada
Illino
isNo
rth
Caro
lina
Iow
aW
isco
nsin
Flor
ida
Ore
gon
Dela
war
eO
klah
oma
Arka
nsas
Texa
s Ne
w M
exic
oUn
ited
Stat
esM
inne
sota
Mis
sour
i Ca
lifor
nia
Colo
rado
New
York
Indi
ana
Was
hing
ton
Kent
ucky
New
Jer
sey
Loui
sian
aW
est V
irgin
ia
Geo
rgia
Ve
rmon
t Vi
rgin
ia
Tenn
esse
e Pe
nnsy
lvan
iaSo
uth
Caro
lina
In 2016-17 four states provided 42 of all state grant aid dollars with California accounting for 18 of the total
Some state-funded grant aid is in the form of ldquotuition set-asiderdquo programs through which a portion of tuition revenues at public institutionsmdashor of increases in tuitionmdashis dedicated to grant aid Some of these funds are included in reported state grant aid but others are not Tuition remission dollars not always reported as state grant aid are sizable in several states
State Grants In 2016-17 state grant aid per full-time equivalent (FTE) undergraduate student ranged from under $200 in nine states to over $1000 in 13 states
FIGURE 24A State Grant Aid per Full-Time Equivalent (FTE) Undergraduate Student 2016-17
NOTE State grant expenditures include funding for both undergraduate and graduate students
SOURCE NASSGAP Annual Survey 2016-17 Table 14
South Carolina with the highest grant aid per FTE undergraduate student considered the financial circumstances of recipients for only 17 of state grant funds in 2016-17 Georgia the second most generous state allocates its grant funds without regard to studentsrsquo financial circumstances (Figure 23B)
ALSO IMPORTANT
Overall state grant expenditures constituted 13 of total state
support for higher education in 2016-17 Thirteen states devoted less than 5 of their higher education funding to grant aid for students nine states directed more than 20 of their funding to individual students rather than to institutions
For detailed data behind the graphs and additional information please visit trendscollegeboardorg 31
NOTES Full-time equivalent students include both state residents and out-of-state students States do not award grant aid to nonresidents
SOURCES NASSGAP Annual Survey 2016-17 Tables 1 and 12 calculations by the authors
FIGURE 24B State Grant Expenditures as a Percentage of Total State Support for Higher Education by State 2016-17
On average dependent students from families with incomes below $35000 received more than five times as much institutional grant aid at high-tuition private colleges in 2015-16 as similar students at low-tuition private colleges ($33260 vs $6160) Students from families with incomes of $120000 or higher recei ved on average about 50 more grant aid at high-tuition colleges than similar students at low-tuition colleges ($12840 vs $8660)
In 2015-16 public doctoral universities distributed 62 of their institutional grant aid without regard to studentsrsquo financial need at public masterrsquos universities it was 71
Average Institutional Grant Aid Full-Time Undergraduates at Private Nonprofit Four-Year Institutions 2015-16
Average Institutional Grant Aid Full-Time Undergraduates at Public Doctoral and Master rsquos Insti tutions 2015-16
Tuition and Fees
Need-Based $45000 or Higher
Tuition and Fees
15
85 54
35
65
35
65
23
77
82
18
74
26
69
31
52
48
46$13900
$19740 $21160 $20280
$15640
$33260 $33120
$25730
Between $35000 and $44999
Tuition and Fees Between $30000
$25000 and $34999
Tuition and Fees Less than $25000
Aver
age
Inst
itutio
nal G
rant
Aid
$20000
37
63
$14270
33
67
$15350
25
75
$16340
$12840
$9550
71 81
$8660$10000 $7850 $6160
76
46 54
29 2419$0 Less than $35000 $70000 $120000 Less than $35000 $70000 $120000 Less than $35000 $70000 $120000 Less than $35000 $70000 $120000 $35000 to to or Higher $35000 to to or Higher $35000 to to or Higher $35000 to to or Higher
$69999 $119999 $69999 $119999 $69999 $119999 $69999 $119999
Parentsrsquo Income of Dependent Students
Non-Need-Based Need-Based
$3570
45
45
74
$3310 $3110
Aver
age
Inst
itutio
nal G
rant
Aid
$3000
$2000
$1000
$0
$2900
38
62
$2490
15
85
55
$1490 $1460
63
$1410$1360$1330
8855
16
84
36
64
29
71
26
12 37
All Less than $35000 $70000 $120000 All Less than $35000 $70000 $120000 $35000 to to or Higher $35000 to to or Higher
$69999 $119999 $69999 $119999
Public Doctoral Public Masterrsquos
Parentsrsquo Income of Dependent Students
Institutional Grants In 2015-16 private nonprofit four-year institutions with tuition and fees of $45000 or higher awarded on average about two and a half times as much grant aid to dependent students from families with incomes below $35000 as to those from families with incomes of $120000 or higher ($33260 vs $12840)
FIGURE 25A
Non-Need-Based
FIGURE 25B Lower-price private nonprofit four-year institutions tend to award larger shares of their grant aid without regard to the financial circumstances of recipients In 2015-16 the lowest-price institutions (those with tuition and fees of less than $25000) awarded more institutional grant aid on average to students from families with incomes of $70000 or higher than to those from families with lower incomes
NOTES Includes full-time undergraduates who were US citizens or permanent residents Averages are across all full-time students enrolled for the full year at one institution including those who did not receive institutional grant aid Non-need-based aid is based entirely on merit or other circumstances not related to need and includes athletic and merit scholarships tuition waivers of all kinds and other categories of institutional awards Each tuition and fee category in Figure 25A includes about one-quarter of full-time undergraduates in the sector Public bachelorrsquos colleges which enroll about 5 of undergraduates in the public sector are not included in Figure 25B
SOURCES NCES NPSAS 2016 calculations by the authors
In 2015-16 the lowest-income dependent students at public doctoral universities received about 25 more institutional grant aid on average than those from families with incomes of $120000 or higher ($3110 vs $2490) At public masterrsquos universities average institutional grants were similar for students from all income groups
For detailed data behind the graphs and additional information please visit trendscollegeboardorg 32
Tax savings for students and parents who claimed education tax credits averaged about $1500 in 2016
The American Opportunity Tax Credit which accounts for most of the total credits and deductions is available to taxpayers with adjusted gross incomes as high as $180000 The maximum benefit per filer is $2500 with up to $1000 of that amount available as a refund to filers with no tax liability
Distribution of Education Tax Credits by Adjusted Gross Income 2006 2011 and 2016
Less than $25000 to $50000 to $75000 to $100000 to $25000 $49999 $74999 $99999 $180000
2016 (Average = $1500) 24 24
2011 (Average = $1500) 25 19
1
2006 (Average = $1100) 34
22 16 14
14
16 13
26 25
27
Total DeductionsTotal Credits
2016 $160 $166
2014 $180 $185
2012 $185 $191
2010 $224 $229
2008 $71 $87
2006 $72 $88
2004 $66 $87
2002 $59 $73
2000 $63 $63
1998 $47 $47
$0 $5 $10 $15 $20 $25
Total Savings in Billions of Dollars
Education Tax Credits and Tuition Deductions The implementation of the American Opportunity Tax Credit in 2009 shifted the benefits of the education tax credits from filers with incomes between $25000 and $100000 to those with lower and higher incomes
FIGURE 26B Total Education Tax Credits and Savings from Tuition Deductions in Billions of 2016 Dollars 1998 to 2016 Selected Years
NOTES The total and average values of tax credits and deductions are best estimates based on data from the Internal Revenue Service A portion of nonrefundable dollars claimed on nontaxable returns is excluded to account for credits and deductions that do not reduce tax liability The value of tax deductions is estimated based on applicable marginal tax rates Percentages may not sum to 100 because of rounding
SOURCES Internal Revenue Service Statistics of Income 1998 to 2016 Tables 13 14 33 calculations by the authors
In 2016 about a quarter of the benefits of the federal education tax credits went to tax filers with incomes between $100000 and $180000 a slightly smallershare went to filers with incomes of $25000 orless and just over half went to those with incomes between $25000 and $100000
In 2016 students and parents saved about $166 billion on their federal income taxes through taxcredits and deductions for higher education expenses This form of subsidy was $88 billion (in 2016 dollars) in 2006 and $229 billion in 2010
ALSO IMPORTANT
Education tax credits and deductions are ldquotax expendituresrdquo They reduce federal income tax liabilities and federal tax revenues and have the same impact on the federal budget as direct expenditures such asPell Grants
Because the credit is only partially refundable manylow-income filers who have low or no tax liabilitiesreceive smaller credits than higher-income filers whocan subtract the full credit from the amount they owe
About one quarter of undergraduates are ineligible foreducation tax credits because they do not pay tuition out of pocket Many low-income students receive federal and state grant aid that covers tuition and feesliving costs are not qualifying expenses for educationtax credits and deductions (Delisle and Dancy ldquoA New Look at Tuition Tax Benefitsrdquo 2015)
In 2016 124 million taxpayers deducted $134 billion in student loan interest generating about $2 billion in tax savings for those borrowers (Internal Revenue Service Statistics of Income 2016 Table 14 Fiscal Year 2017 Analytical Perspectives Budget of the US Government FY18 Table 13-1)
For detailed data behind the graphs and additional information please visit trendscollegeboardorg 33
FIGURE 26A
Notes and Sources
Campus-Based Aid (FWS Perkins and FSEOG) Iraq and Afghanistan Service Grants and ACGSMART Grants US Department of Education Annual Federal Program Data Books Federal Work-Study (FWS) and Federal Supplemental Educational Opportunity Grant (FSEOG) amounts include allocated federal funds only Institutional matching funds required since 1989-90 for FSEOG are reported under institutional grants No funds have been appropriated for new federal capital contributions to the Perkins Loan program since FY06 and the program is funded from past federal and institutional capital contributions as well as collections from borrowers
Education Tax Benefits Income Tax Returns All Returns Tables 13 14 2 and 33 Data on education tax credits are authorsrsquo estimates based on IRS data on the volume of Hope Lifetime Learning and American Opportunity credits for tax years 1998 and later A portion of nonrefundable dollars claimed on nontaxable returns is excluded to account for credits that do not reduce tax liability Tax deductions are based on IRS Statistics of Income Table 14 with associated savings estimated by the authors based on the marginal tax rates applied to the taxable income of the taxpayers in each income bracket claiming the deduction on taxable returns Calendar year amounts are split between the two associated academic years
Federal Subsidized and Unsubsidized Student Loans 2009-10 and prior unpublished data provided by the US Department of Education staff 2010-11 and after Federal Student Aid Data Center Title IV Program Volume Reports Because the Federal Student Aid Data Center will continue to update the loan volume after each academic year ends we adjusted the 2017-18 data (released in September 2018) using the average of the percentage change between July 2015 and July 2016 in the reported 2014-15 loan volume the percentage change between July 2016 and July 2017 in the reported 2015-16 loan volume and the percentage change between July 2017 and July 2018 in the reported 2016-17 loan volume
Prior to 1993-94 federal Subsidized and Unsubsidized Loans for students were made by banks and other private lenders and guaranteed by the federal government From 1994-95 through 2009-10 the guaranteed loan program known as the Federal Family Education Loan Program (FFELP) continued alongside the Federal Direct Loan Program (FDLP) which lends federal funds to students Beginning in 2010-11 all of the loans are Federal Direct Subsidized or Unsubsidized Loans
Subsidized Loans are need-based student loans for which the federal government pays the interest while the student is in school and during a six-month grace period thereafter Prior to June 2012 these loans were available to both undergraduate and graduate students but the Budget Control Act of 2011 eliminated the program for graduate students whose federal loans are now all Unsubsidized or Grad PLUS loans Interest accrues on Unsubsidized Loans from the time they are disbursed
Institutional Grants 2015-16 and prior IPEDS Finance data Estimated for 2016-17 and 2017-18 Estimated figures represent best approximations and are updated each year as additional information becomes available
Nonfederal Loans Estimates of nonfederal borrowing rely on data from MeasureOne Between 2011-12 and 2016-17 we supplemented these data with information from the Consumer Bankers Association and the Consumer Financial Protection Bureau Earlier data are based on information provided by lenders supplemented by data from annual reports and from NPSAS Estimates of institutional lending are based on NPSAS as well as a survey of institutions conducted for the College Board by the National Association of Student Financial Aid Administrators (NASFAA) We no longer report state and institutional loans separately from private loans because of changes in MeasureOnersquos methodology and data availability issues
Pell Grant Program 2016-17 and prior Federal Pell Grant Program End-of-Year Report 2017-18 Federal Student Aid Data Center Title IV Program Volume Reports
Private and Employer Grants Estimates are based on data included in NPSAS and on National Scholarship Providers Association surveys of major private student grant providers supplemented by information from annual reports of selected scholarship providers data from institutional financial aid offices and the College Boardrsquos Annual Survey of Colleges
State Grant Programs 20th through 48th Annual Survey Reports of the National Association of State Student Grant and Aid Programs (NASSGAP) for 1988-89 to 2016-17 and estimated for 2017-18
Veterans Benefits Benefits Program series (annual publication for each fiscal year) US Department of Veterans Affairs Office of Budget and Finance Veterans benefits are payments for postsecondary education and training to veterans and their dependents including the Post-911 Veterans Educational Assistance Program established in 2009-10 and all programs established earlier The Iraq and Afghanistan Service Grants program begun in 2010-11 provides non-need-based grants for students whose parent or guardian was a member of the Armed Forces who died in Iraq or Afghanistan as a result of performing military service after Sept 11 2001 Estimates include benefits for active duty military members
34
Trends in Student Aid was authored by Sandy Baum nonresident fellow at the Urban Institute Jennifer Ma senior policy research scientist at the College Board Matea Pender policy research scientist at the College Board and CJ Libassi senior policy research analyst at the College Board
CONTACT INFORMATION FOR THE AUTHORS
sandybaum73gmailcomtrendscollegeboardorg
Trends in Student Aid and its companion report Trends in College Pricing are supplemented by a website that makes detailed data available for reference and downloading The PDF versions of these reports along with PowerPoint slides of all the graphs are available on the web trendscollegeboardorg
Hard copies may be requested by contacting trendscollegeboardorg
Tables graphs and data in this report or excerpts thereof may bereproduced or cited for noncommercial purposes only provided that the following attribution is included
Source Baum Sandy Jennifer Ma Matea Pender and CJ Libassi (2018) Trends in Student Aid 2018 New York The College Board
copy 2018 The College Boardwwwcollegeboardorg
ACKNOWLEDGMENTS
Anthony LaRosa and Edward Lu provided critical support for this publication We also benefited from comments from Dean Bentley Jessica Howell Michael Hurwitz and Melanie Storey Sandy Alexander provided expert graphic design work The publication would not have been possible without the cooperation and support of many individuals at the College Board including Connie Betterton Robert Gordon Karen Lanning Alejandro Leal George Lilas Robert Majoros Jose Rios and Matt Walsh
We thank all of those who contributed to the data collection for this publication especially Charlotte Etier of the National Association of Student Financial Aid Administrators (NASFAA) and Mike Solomon of the Illinois Student Aid Commission
36
collegeboardorgtrendscollegeboardorg
00947-055
October 2018
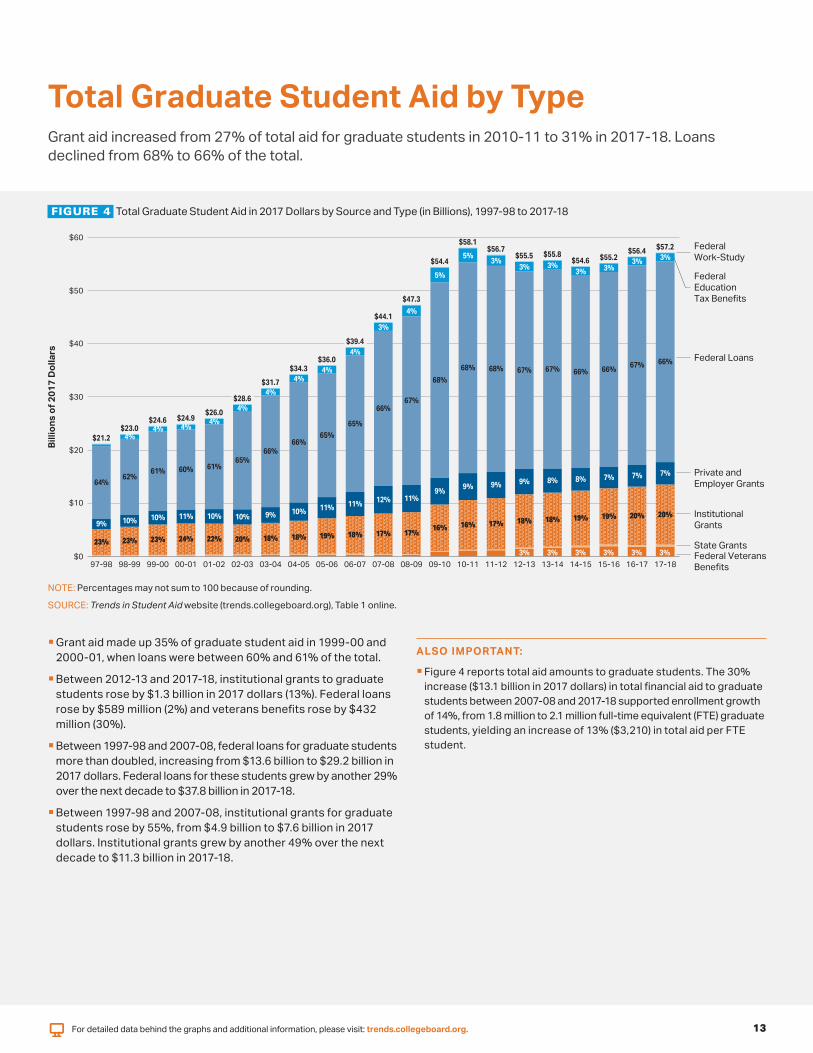
$60
$212 $230
$246 $249 $260
$286
$317
$343 $360
$394
$441
$473
$544 $555
$546 $552
23 23 23 24 22 20 18 18 19 18 17 17 16 16 17 18
3 3
18 19 19 20 20
64 62
61 60 61 65
66 66
65
65
66 67
68
68 68 67 67 66 66 67 66
4 4 4
4
3
$50
$40
$30
$20
$10
$0 97-98 98-99 99-00 00-01 01-02 02-03 03-04 04-05 05-06 06-07 07-08
Billi
ons
of 2
017
Dol
lars
$581 $567 $572 Federal $564 $558 Work-Study
Federal Education Tax Benefits
Federal Loans
Private and Employer Grants
Institutional Grants
State Grants Federal Veterans
08-09 09-10 10-11 11-12 12-13 13-14 14-15 15-16 16-17 17-18 Benefits
Total Graduate Student Aid by TypeGrant aid increased from 27 of total aid for graduate students in 2010-11 to 31 in 2017-18 Loans declined from 68 to 66 of the total
FIGURE 4 Total Graduate Student Aid in 2017 Dollars by Source and Type (in Billions) 1997-98 to 2017-18
NOTE Percentages may not sum to 100 because of rounding
SOURCE Trends in Student Aid website (trendscollegeboardorg) Table 1 online
Grant aid made up 35 of graduate student aid in 1999-00 and 2000-01 when loans were between 60 and 61 of the total
Between 2012-13 and 2017-18 institutional grants to graduate students rose by $13 billion in 2017 dollars (13) Federal loans rose by $589 million (2) and veterans benefits rose by $432 million (30)
Between 1997-98 and 2007-08 federal loans for graduate studentsmore than doubled increasing from $136 billion to $292 billion in2017 dollars Federal loans for these students grew by another 29over the next decade to $378 billion in 2017-18
Between 1997-98 and 2007-08 institutional grants for graduate students rose by 55 from $49 billion to $76 billion in 2017 dollars Institutional grants grew by another 49 over the next decade to $113 billion in 2017-18
ALSO IMPORTANT
Figure 4 reports total aid amounts to graduate students The 30 increase ($131 billion in 2017 dollars) in total financial aid to graduate students between 2007-08 and 2017-18 supported enrollment growth of 14 from 18 million to 21 million full-time equivalent (FTE) graduate students yielding an increase of 13 ($3210) in total aid per FTE student
For detailed data behind the graphs and additional information please visit trendscollegeboardorg 13
4
4
4 4
4
3
4
5
5 3
3 3 3 3 3
9 10 10 11 10 10 9 10 11 11 12 11 9
9 9 9 8 8 7 7 7
3 3 3 3
$1294
Gra
nts
in B
illio
ns o
f 201
7 D
olla
rs
$120
$90
$60
$30
$0
$425 $467
$496 $520
$563 $610
$659 $688 $707
$735
$787
$843
$1088
$1215 $1187
$1215 $1228 $1244 $1259 $1259
29 29 27 27 30 32 32 31 29 28 28 30
41 44
41 39 38 36 34 32 32 45 45 45 44 42
39 40 41 42 43
43 42
37
35 38 40 41 43 45 46
46
14 15
16 16 16
16 16
16 17 17
17
16
13
12 13
13 13 12 13 13 13
12 12
12 13
13 13
12 13 12
13
12
11
9
9 9
8 8 9 9 9 9 State Grants
Private and EmployerGrants
Institutional Grants
Federal Grants
97-98 98-99 99-00 00-01 01-02 02-03 03-04 04-05 05-06 06-07 07-08 08-09 09-10 10-11 11-12 12-13 13-14 14-15 15-16 16-17 17-18
Sources of Grant Aid The total amount of grant aid supporting postsecondary students increased by 85 (after adjusting for inflation) between 1997-98 and 2007-08 and by another 64 between 2007-08 and 2017-18 reaching a total of $1294 billion
FIGURE 5 Total Grant Aid in 2017 Dollars by Source of Grant 1997-98 to 2017-18
NOTE Percentages may not sum to 100 because of rounding
SOURCES See page 34 for a list of sources for grants included in Figure 5
Almost all of the growth in total grant aid over the last decade occurred between 2007-08 and 2012-13 as full-time equivalent (FTE) enrollment increased by 13 Between 2012-13 and 2017-18 FTE enrollment declined by 5 and total grant aid increased by 7
Federal grants fluctuated between 27 and 32 of all grant aid for undergraduate and graduate students between 1997-98 and 2007-08 This share rose to 44 in 2010-11 but declined to 32 in 2017-18
Institutional aid is the only type of grant aid that grew rapidly between 2012-13 and 2017-18 Colleges and universities increased their aid by 24 from $484 billion (in 2017 dollars) in 2012-13 to $600 billion in 2017-18
From 1997-98 to 2007-08 state grant aid was between 12 and 13 of all grant aid From 2009-10 to 2017-18 it was between8 and 9 of all grant aid Total state grant aid grew by 83 (afteradjusting for inflation) between 1997-98 and 2007-08 and byanother 18 over the decade ending in 2017-18
Grants from employers and other private sources were between 12 and 17 of total grant aid to postsecondary students for the entire two decades from 1997-98 through 2017-18 and were13 of the total in 2017-18
ALSO IMPORTANT
Grant aid for veterans which grew from $33 billion (in 2017 dollars) to $127 billion over the decade increased from 15 of federal grant aid in 2007-08 to 31 in 2017-18 At the same time Pell Grants which rose from $172 billion to $282 billion declined from 78 to 68 of the total (Table 1)
The composition of grant aid for graduate students is quite different from that for undergraduate studentsmdashand from the totals in Figure 5 In 2017-18 11 of graduate student grant aid came from the federal government (including aid to veterans) 64 from institutions 24from employers and other private sources and 2 from states Forundergraduate students the percentages were 36 44 11 and10 respectively (Table 1 online)
For detailed data behind the graphs and additional information please visit trendscollegeboardorg 14
Loan
s in
Bill
ions
of 2
017
Dol
lars
$1248$1229 $1196
$120 $1162
$1108$1091 $1086 $1075$1070 $1055
$979
8
7 9
8 9
12
9
50 48 43 42 40
31 32 33 33
13
34
9
14
38
33
10
16
37 35 33 31
32
10
18
32 32 30
11
20
11
23
10
25
32
30
8
3
25
34
41
8
4
12
35
43
8
5
7
36
41
9
6
7
35
41
10
6
7
25
50
9
7
8
24
50
9
7
9
23
49
10
8
9
22
48
11
8
10
20
47
12
9
10
20
46
12
10
11 Nonfederal Loans $938
$889 Perkins Loans $90 Grad PLUS Loans
$803
Parent PLUS $694 Loans
$602 $60 $558
$512 $548
$493
Federal Unsubsidized Loans
$30
Federal Subsidized Loans
$0 97-98 98-99 99-00 00-01 01-02 02-03 03-04 04-05 05-06 06-07 07-08 08-09 09-10 10-11 11-12 12-13 13-14 14-15 15-16 16-17 17-18
$1277
In 1997-98 61 of Stafford Loans were subsidized loansmdashthe interest is paid by the government while students are in school This percentage declined to 52 in 2007-08 and to 33 in 2012-13 when graduate students were no longer eligible for the program In 2017-18 30 of Stafford Loans were subsidized
Types of LoansTotal annual student and parent borrowing for postsecondary education declined (in inflation-adjusted dollars) for the seventh consecutive year to $1055 billion in 2017-18
FIGURE 6 Total Federal and Nonfederal Loans in 2017 Dollars by Type of Loan 1997-98 to 2017-18
NOTES Nonfederal loans include loans to students from states and institutions in addition to private loans issued by banks credit unions and other lenders Values fornonfederal loans are best estimates and are less precise than federal loan amounts
SOURCES See page 34 for a list of sources for loans included in Figure 6
Between 2012-13 and 2017-18 total annual borrowing from the subsidized and unsubsidized Direct Loan programs declined by 22 to $700 billion Total annual borrowing from the Parent PLUSLoan program increased by 22 to $128 billion and borrowing from the Grad PLUS program increased by 27 to $103 billion
Students borrow nonfederal education loans from banks creditunions and other private lenders including some states and postsecondary institutions These loans which are not part of the student aid system and typically do not involve subsidies fellfrom about $26 billion (in 2017 dollars) in 2007-08 to $9 billion in 2009-10 but increased to almost $12 billion by 2017-18 when theyaccounted for about 11 of all education loans
ALSO IMPORTANT
There are no credit requirements for subsidized and unsubsidizedDirect Loans or Perkins Loans To qualify for PLUS loans borrowers cannot have an ldquoadverse credit historyrdquo defined as being 90 days or more delinquent on any debts greater than $2085 or being the subject of default determination bankruptcy discharge foreclosure repossession tax lien wage garnishment or write-off of a federal education debt during the five years preceding the date of the credit report
For detailed data behind the graphs and additional information please visit trendscollegeboardorg 15
Federal Aid Federal education tax credits and deductions reached an estimated 120 million students in 2016-17 50 million more than the 70 million Pell Grant recipients in 2017-18
FIGURE 7 Number of Recipients by Federal Aid Program (with Average Aid
Received) 2017-18
120
Num
ber o
f Rec
ipie
nts
(in M
illio
ns) million
12
10 79
70 million 688 million million
55 6 million
4
14 2 million
601000 767000 286000
0 Federal Federal Direct Direct Direct FSEOG Federal Post9-11 Perkins
Education Pell Subsidized Subsidized Unsubsidized ($530) Work-Study GI Bill Loan Tax Benefits Grant or Loans Loans ($1600) Veterans ($2810)
($1390) ($4010) Unsubsidized ($3850) ($7220) Benefits Loans ($15310)
($8800)
Federal Aid Programs (with Average Aid per Recipient)
NOTES Data on tax benefits are estimated for 2016-17 FSEOG and FWS amounts represent federal funds only Institutions provide matching funds so the awards that students receive under these programs are larger than these federal aid amounts Perkins Loans are made from revolving funds on campus No new federal outlays have been provided since 2005-06 but originally the funds came partly from the federal government and partly from institutional sources
SOURCES See page 34 for a list of sources of data on federal aid programs
FIGURE 8 Percentage Distribution of Federal Aid Funds by Sector 2016-17
Public Two-Year Public Four-Year Private Nonprofit For-Profit
Pell Grants
FSEOG
Federal Work-Study
Perkins Loans
Direct Subsidized Loans
Direct Unsubsidized Loans
Parent PLUS Loans
Grad PLUS Loans
34 35
31
36
1 2
33
41
12
16 15
5
24
18
50 48
13 45
6 41
1
26
38
16
16
50
26
42
68
7
6
Percentage of Aid
NOTES Excludes aid to students enrolled in public less-than-two-year colleges and to studentsenrolled in foreign institutions Percentages may not sum to 100 because of rounding
SOURCES See page 34 for a list of sources of data on federal aid programs
In 2017-18 an estimated 601000 students receivedFederal Work-Study (FWS) funding
In 2017-18 the total number of borrowers in the subsidized and unsubsidized Direct Loan programs was 79 millionmdashless than the sum of the number of recipients in each program because about two-thirds of all borrowers participated in both programs
In 2016-17 public two-year college students who made up 32 of full-time equivalent (FTE) undergraduate enrollment received 34 of Pell Grant funds Students in this sector received less than their proportionate share of funds from all other federal student aid programs
In 2016-17 students in the private nonprofit sectoraccounted for 18 of undergraduate and 22 oftotal postsecondary FTE enrollment They received 68 of Grad PLUS 48 of Perkins Loans and 41of FWS funds
ALSO IMPORTANT
Pell Grants FSEOG and Direct Subsidized Loans are for undergraduates only Grad PLUS Loans are for graduate students only Parent PLUS Loans are for parents of undergraduate students FWS PerkinsLoans Direct Unsubsidized Loans and Post-911 GI Bill benefits are available to both undergraduate and graduate students
The number of students receiving FWS funds declined from 698000 in 2007-08 to 601000 in 2017-18 (Table 5 online)
In 2012-13 41 of Post-911 GI Bill veterans benefits went to students in the for-profit sector (US Senate HELP Committee 2014 ldquoIs the New GI Bill Workingrdquo) In 2017 Congress passed legislation known as the ldquoForever GI Billrdquo increasing the generosity of education benefits for veterans
Distribution of Fall 2016 Enrollment by Sector
FTE Undergraduate Students
All FTE Students
Public Two-Year 32 27
Public Four-Year 42 43
Private Nonprofit Four-Year
For-Profit
18
ensp7
22
ensp7
SOURCE NCES IPEDS Enrollment data
For detailed data behind the graphs and additional information please visit trendscollegeboardorg 16
Federal Loans Annual BorrowingAfter a decade of rapid growth in annual borrowing total federal loans to undergraduate students declined by 23 between 2012-13 and 2017-18 after adjusting for inflation and federal loans to graduate students rose by 2
FIGURE 9A Total Annual Amount Borrowed from Federal Subsidized Unsubsidized and PLUS Loans in Millions of 2017 Dollars 2002-03 to 2017-18 Selected Years
$80000 PLUS $71730
Tota
l Ann
ual A
mou
nt B
orro
wed
in M
illio
ns o
f 201
7 D
olla
rs
$60000
$40000
$20000
$0
$38200
$50210 $55520
$18050
$28820
$36940 $37580
2002-03 2007-08 2012-13 2017-18 2002-03 2007-08 2012-13 2017-18
Undergraduate Graduate
Unsubsidized
Subsidized
FIGURE 9B Average Annual Amount Borrowed in Federal Subsidized Unsubsidized and PLUS Loans in 2017 Dollars 2002-03 to 2017-18 Selected Years
$6320
$19820 $20490
$6360
$19280
$6790
$18860
$6570
Graduate
Undergraduate
2017-18
2012-13
2007-08
2002-03
$11750
$19960
$13480
$23480
$16090
$24810
$16450
Undergraduate
$0
PLUS
Su
bsid
ized
and
Unsu
bsid
ized
Graduate
$0 $5000 $10000 $15000 $20000 $25000 $30000
Average Annual Amount Borrowed in 2017 Dollars per Borrower
Number of Borrowers (in Thousands) 2002-03 to 2017-18 Selected Years
2002-03 2007-08 2012-13 2017-18
Subsidized and Unsubsidized Undergraduate 5003 6473 9024 6504
Graduate 881 1272 1495 1446
Total 5884 7745 10519 7950
PLUS
Undergraduate 563 671 652 779
Graduate 0 181 346 416
Total 563 852 998 1195
The share of federal education loans going to graduate students (who constitute about 14 of all postsecondary students) rose from 32 ($181 billion out of $563 billion in 2017 dollars) in 2002-03 to 40 ($376 billion out of $931 billion) in 2017-18
In 2017-18 undergraduates taking subsidized andor unsubsidized Direct Loans borrowed an average of $6570mdash$210 more (in 2017 dollars) than a decade earlier and $220 less than in 2012-13
The number of parents borrowing Parent PLUS Loans in 2017-18 was 12 of the number of undergraduates taking subsidized and unsubsidized Direct Loans (779000 vs 65 million) However the average parent loan was $16450 25 times as much as the average undergraduate student loan
In 2017-18 416000 graduate students borrowed through the Grad PLUS program 14 million borrowed unsubsidized Direct Loans The average amount borrowed through the PLUS program was $5950 higher than the average Direct Loan ($24810 vs $18860)
ALSO IMPORTANT
The aggregate federal student loan limit for dependent undergraduate students is $31000 No more than $23000 can be subsidized loans Independent students and dependent students whose parents are not eligible for Parent PLUS Loans can borrow an additional $26500 in unsubsidized loans
Graduate and professional students can borrow up to a lifetime total of $138500 from the subsidized and unsubsidized loan programs including their undergraduate borrowing Each year students are enrolled they can borrow up to the full cost of attendance including living expenses and books and supplies in addition to tuition and fees through the Grad PLUS program
Like the Grad PLUS program the Parent PLUS program allows borrowing to cover studentsrsquo entire budgets less other aid received for an unlimited number of years of enrollment
NOTE Graduate students became eligible to borrow PLUS Loans in 2006-07
SOURCE Trends in Student Aid website (trendscollegeboard org) Table 6
For detailed data behind the graphs and additional information please visit trendscollegeboardorg 17
Annual Undergraduate Borrowing Parent PLUS and Private Loans In 2015-16 parents of 9 of dependent undergraduate students borrowed through the Parent PLUS program The shares of parents taking these loans ranged from less than 1 of dependent public two-year college students to 21 of dependent for-profit college students
FIGURE 10A Share of Dependent Undergraduate Students with Parent PLUS Loans 1999-00 to 2015-16
1999-00 2003-04 2007-08 2011-12 2015-16
0
10
20
Shar
e of
Dep
ende
nt U
nder
grad
uate
sw
ith P
aren
t PLU
S Lo
ans
6 7 9 97 86 9 12
12
13
12
14
19
17
05
03
04 1 06
24
29
21
25
21
30
All Public Four-Year Private Nonprofit Public Two-Year For-Profit Four-Year
Average Parent PLUS Loans Among Borrowers (2016 Dollars)
1999-00 2003-04 2007-08 2011-12 2015-16
All $9800 $11300 $11700 $12700 $14000
Public Four-Year $8600 $9800 $10500 $11700 $12800
Private Nonprofit Four-Year $12100 $14300 $15300 $15500 $17500
Public Two-Year mdash $6900 $5100 $9100 $7700
For-Profit $8200 $11000 $9900 $11900 $12600
FIGURE 10B Share of Undergraduate Students with Private Loans 1999-00 to 2015-16
1999-00 2003-04 2007-08 2011-12 2015-16 40
Shar
e of
Und
ergr
adua
tes
with
Pr
ivat
e Lo
ans
30
20
10
3 14
6 65 53 14
7 8 11
8 25
12
12
12
5 40
12
642 2106
0 All Public Four-Year Private Nonprofit Public Two-Year For-Profit
Four-Year
Average Private Loans Among Borrowers (2016 Dollars)
1999-00 2003-04 2007-08 2011-12 2015-16
All $7000 $7500 $7000 $6100 $8700
Public Four-Year $5400 $6800 $6700 $5700 $7800
Private Nonprofit Four-Year $8400 $10000 $10100 $8200 $12400
Public Two-Year $5500 $4100 $3800 $3300 $4100
For-Profit $8400 $7000 $6600 $6300 $8100
SOURCES NCES NPSAS 2000 2004 2008 2016 calculations by the authors
For detailed data behind the graphs and additional information please visit trendscollegeboardorg
The average annual amount borrowed through the Parent PLUS program has increased over time in all sectors except public two-year colleges At private nonprofit colleges and universities these loan amounts rose from an average of $12100 (in 2016 dollars) for 12 of dependent students in 1999-00 to $15300 for 14 of dependent students in 2007-08 and to $17500 for 17 of dependent students in 2015-16
The share of undergraduate students taking private student loans fell from 14 in 2007-08 to 6 in both 2011-12 and 2015-16
In 2007-08 40 of undergraduates at for-profit institutions took private student loans but that share had fallen to 6 by 2015-16mdashlower than the 12 at private nonprofit four-year and the 8 at public four-year colleges in 2015-16
In 2015-16 the average size of private student loans among the students who used them ranged from $4100 for 2 of public two-year college students to $12400 for 12 of private nonprofit four-year college students
ALSO IMPORTANT
Among 2015-16 bachelorrsquos degree recipients 20 of dependent studentsrsquo parents had borrowed PLUS loans at some point during the studentsrsquo undergraduate study Of those who borrowed Parent PLUS Loans the average cumulative amount borrowed was $36800 (NPSAS 2016 calculations by the authors)
Among 2015-16 bachelorrsquos degree recipients 16 had borrowed private loans at some point during their undergraduate study Of those who borrowed private loans the average cumulative amount borrowed was $21300 (NPSAS 2016 calculations by the authors)
In addition to using Parent PLUS Loans parents may borrow through home equity loans credit cards or other sources of credit This borrowing is not reflected in the data reported here
Private student loans do not carry the borrower protections included in federal student loan programs including the option of repaying through income-driven plans that base monthly payments on earnings Like federal student loans private loans are more difficult to discharge in bankruptcy than other personal loans
18
Federal Loans Borrowing and BalancesAs of March 2018 40 of the outstanding federal education loan debt was held by the 9 of borrowers owing $80000 or more
FIGURE 11 Distribution of Borrowers and Debt by Outstanding Balance 2018
18 PercentageLess than $5000
1 of Borrower
17 Percentage$5000 to $9999
4 of Debt
Out
stan
ding
Bor
row
er D
ebt B
alan
ce 21 $10000 to $19999
10
21$20000 to $39999
19
9$40000 to $59999
14
5$60000 to $79999
12
3$80000 to $99999
7
4 $100000 to $199999
19
2$200000 or More 14
s
NOTE Includes both loans made under the Federal Direct Loan Program (FDLP) and loans made under the Federal Family Education Loan (FFEL) Program which ended in 2009-10 Data were as of March 31 2018 the end of the second quarter of FY18
SOURCE US Department of Education Federal Student Aid Center Federal Student Loan Portfolio
FIGURE 12 Percentage of Undergraduate Students Borrowing Federal Subsidized and Unsubsidized Student Loans 2007-08 2012-13 and 2017-18
No Stafford Subsidized Unsubsidized Both Subsidized and Loans Only Only Unsubsidized Loans
2017-18
ar
eYc i
me
2012-13
adcA
2007-08
Percentage of Undergraduate Students
NOTES IPEDS headcount enrollments are adjusted for the difference between total headcount which counts students more than once if they are enrolled in more than one institution at the same time and unduplicated headcount reported by the National Student Clearinghouse (NSC) Twelve-month undergraduate headcount for 2017-18 is estimated from NSC data Percentages may not sum to 100 because of rounding
SOURCES NCES Postsecondary Institutions and Cost of Attendance in 2017-18 Degrees and Other Awards Conferred 2016-17 and 12-Month Enrollment 2016-17 First Look (Preliminary Data) and earlier editions National Student Clearinghouse Current Term Enrollment Estimates Spring 2018US Department of Education Federal Student Aid Data Center Title IV Program Volume Reports and Aid Recipients Summary calculations by the authors
For detailed data behind the graphs and additional information please visit trendscollegeboardorg
As of March 2018 56 of borrowers owed less than $20000 These borrowers held 15 of the outstanding federal debt
In 2017-18 71 of undergraduates did not borrow either subsidized or unsubsidized Stafford Loans That percentage was 70 in 2007-08 and 63 in 2012-13
In 2017-18 5 of undergraduate students borrowed subsidized loans only 5 borrowed unsubsidized loans only and 19 borrowed from both programs In other words two-thirds of the 29 who borrowed Stafford Loans took both subsidized and unsubsidized loans
A decade earlier in 2007-08 12 of undergraduates borrowed only subsidized loans Among the 29 who borrowed less than half of the students borrowed both subsidized and unsubsidized loans
ALSO IMPORTANT
Figure 12 shows that 29 of undergraduates took federal student loans in 2017-18 This percentage is lower than the share of students who graduate with debt for a number of reasons Many students who borrow do not borrow every year In 2015-16 among enrolled students who had borrowed at some point as undergraduates 70 borrowed federal student loans (NPSAS 2016)
Part-time students borrow at lower rates than full-time students In 2015-16 half of all full-time undergraduates used federal student loans compared with just 18 of those who were enrolled exclusively part time (NPSAS 2016)
19
5 5 19
7 9
71
63
70
22
12 4 13
In March 2018 borrowers in IDR plans held 49 of the outstanding debt in repayment under the federal
Direct Loan program up from 27 in 2014
Outstanding Federal LoansParticipation in Income-Driven Repayment (IDR) plans for federal student loans has grown dramatically in recent years In March 2018 29 of the borrowers in repayment on federal Direct Loans were in programs limiting their payments to an affordable percentage of their discretionary incomes up from 13 in 2014
FIGURE 13A Distribution of Outstanding Federal Direct Loan Dollars and Borrowers by Repayment Plan Second Quarter 2014 2016 and 2018
60
40
20
0
2014 2016 2018
911
10
13
13
12
14
12
14
27
41
49
13
23
29
42
33
26
64
54
47
13
18
13
Dollars Borrowers Dollars Borrowers Dollars Borrowers Dollars Borrowers Income Driven Level Payments Level Payments Graduated Payments
10 Years or Less More Than 10 Years or Alternative
Repayment Plan
NOTES Includes Direct Loan borrowers in repayment deferment and forbearance Because some borrowers have multiple loans recipients may be counted multiple times across varying loan statuses Income-driven plans include REPAYE Pay As You Earn Income-Contingent Repayment and Income-Based Repayment Level payment plans require monthly payments that are the same over a fixed period of time Alternative repayment plans are customized to borrowersrsquo circumstances Under the graduated payment plan monthly payments increase over time The second quarter of FY18 ended on March 31 2018 Percentages may not sum to 100 because of rounding
SOURCE US Department of Education Federal Student Aid Data Center Federal Student Loan Portfolio
FIGURE 13B Repayment Status of Federal Education Loan Portfolio Second Quarter FY18
45
54
18
12
9
11
7
10
3
2
17
11
Percentage of BorrowersPercentage of Dollars
Default
Grace
Forbearance
Deferment
Repa
ymen
t Sta
tus
In-School
Repayment
NOTES Includes both loans made under the Federal Direct Loan Program and loans made under the Federal Family Education Loan Program (FFEL) and held by the US Department of Education Excludes the $200 billion in outstanding FFEL loans not held by the federal government The second quarter of FY18 ended on March 31 2018
SOURCE US Department of Education Federal Student Aid Data Center Federal Student Loan Portfolio
In March 2018 17 of borrowersmdashbut 11 of outstanding dollarsmdashwere in default The average balance on defaulted loans was $18600 compared with $29200 for all outstanding loans
ALSO IMPORTANT
Borrowers in IDR plans have higher average balances than those in other repayment plansmdash$56200 vs $24000 in March 2018
There are several IDR plans Just over 40 of borrowers in IDR plans are in the Income-Based Repayment plan which after July 2014 limits payments for new borrowers to 10 of income above 150 of the poverty line and forgives remaining debt after 20 years of eligible payments Earlier borrowers pay 15 of income above 150 of the poverty line for 25 years
Revised Pay As You Earn (REPAYE) launched in 2015makes all federal Direct Loan borrowers eligible for IDR plans In March 2018 among IDR plans about30 of borrowers and 30 of the dollars were in the REPAYE plan
Average Federal Loan Balance Number of Borrowers andTotal Balance by Repayment Status Second Quarter 2018
Repayment
In-School
Average Balance
$34600
$19800
Number of Borrowers (in Millions)
186
72
Total Balance (in Billions)
$6430
$1425
Deferment $33200 38 $1263
Forbearance $42600 28 $1193
Grace $19300 13 $251
Default $18600 70 $1303
Other $32000 03 $96
Total $29200 410 $11961
NOTE Repayment in active repayment status In-School borrower is still enrolled never entered repayment Deferment payments postponed because of economic hardship military service or returning to school Forbearance payment temporarily suspended or reduced because of financial hardships Grace six-month period after borrower is no longer enrolled at least half time Default more than 360 days delinquent ldquoOtherrdquo category includes loans that are in non-defaulted bankruptcy and in a disability status
For detailed data behind the graphs and additional information please visit trendscollegeboardorg 20
Completers had higher repayment rates than noncompleters in all sectors but completers from the for-profit sector had lower repayment rates than noncompleters from the public and private nonprofit four-year sectors
In all sectors dependent students had higher repayment rates than independent students Repayment rates ranged from 30 for independent students from the for-profit sector and 38 for those from publi c two-year colleges to 67 for dependent students from the private nonprofit four-year sector and 69 for those from the public four-year sector
Borrowers can be in good standing without paying down the principal owed They may be enrolled in an Income-Driven Repayment (IDR) plan Some may have no requ ired payments and for others the required payments may be too small to cover the interest charged leading to increases in the balance owed In addition borrowers may be in deferment or forbearance and not required to make payments in their current circumstances
Completers Noncompleters
68 Public Two-Year
39
79Public Four-Year
54
Sect
or
Sect
or 80Private NonprofitFour-Year 54
43For-Profit 26
67All 41
Dependent Independent
52Public Two-Year
38
69Public Four-Year 55
67Private NonprofitFour-Year 52
41For-Profit 30
65All 46
0 20 40 60 80 Repayment Rate
Federal Student Loan Five-Year Repayment Rate by Completion Status and by Dependency Status Borrowers Entering Repayment in 2009-10 and 2010-11
FIGURE 14B Federal Student Loan One-Year Three-Year Five-Year and Seven-Year Repayment Rates by Sector Borrowers Entering Repayment in 2007-08 and 2008-09
1-Year 3-Year 5-Year 7-Year
45 47
50 53
62
65 68
71
63
31
33 36
41
50 53
57 62
66 69
72
0
20
40
60
Repa
ymen
t Rat
e
Public Public Private Nonprofit For-Profit All Two-Year Four-Year Four-Year
Federal Loans Repayment RatesSixty-seven percent of federal student loan borrowers who entered repayment in 2009-10 and 2010-11 after earning a degree or certificate had paid down at least one dollar of their loan principal after five years This repayment rate was 41 for noncompleters
FIGURE 14A
In all sectors the share of borrowers who have made some progress paying down their student debt increases as time in repayment increases The largest increments are for borrowers from for-profit institutions where the repayment rate for borrowers who entered repayment in 2007-08 and 2008-09 rose from 31 after one year to 41 after seven years
After seven years 41 of borrowers from for-profitinstitutions had reduced their loan balances by at least one dollar This repayment rate was lower thanthe one-year repayment rates in all other sectorsincluding public two-year colleges where therepayment rate rose from 45 after one year to53 after seven years
ALSO IMPORTANT
NOTES The repayment rate is defined as the percentage of borrowers in each repayment cohort whose payments reduced the loan principal by at least one dollar after the specified number of years Repayment status on each loan is attributed to the school for which the loan was taken Therefore a student can be counted in the repayment cohorts of more than one institution
SOURCES US Department of Education College Scorecard data calculations by the authors
For detailed data behind the graphs and additional information please visit trendscollegeboardorg 21
In 2016-17 average debt per bachelorrsquos degree recipient including both those who borrowed and those who did not was $16700 for the two sectors combined 1 higher than in 2011-12
Students who earn their bachelorrsquos degrees at for-profit institutions not included in Figure 15 are more likely to borrow and accumulate higher average levels of debt than those who graduate from public and private nonprofit four-year colleges (Figure 16)
Figure 15 includes only students who earned their bachelorrsquos degrees at the institutions in which they first enrolled Students who attend two or more institutions may have different borrowing patterns
$15
200
$26
200
$15
500
$26
900
$11
200
$21
600
$12
400
$22
500
Private Nonprofit Four-Year
162
00
254
00
199
00
300
00
203
00
317
00
326
00
$20
000
Per Borrower Per Degree Recipient
Public Four-Year
Aver
age
Cum
ulat
ive
Deb
t in
2017
Dol
lars
Av
erag
e Cu
mul
ativ
e D
ebt i
n 20
17 D
olla
rs
$30000
$20000
$10000
$0 2001-02 (52) 2006-07 (55) 2011-12 (58) 2016-17 (58)
Academic Year (Percentage of Graduates Who Borrowed)
$30000
$20000
$10000
$$ $$ $$ $$0 2001-02 (64) 2006-07 (66) 2011-12 (64) 2016-17 (61)
Academic Year (Percentage of Graduates Who Borrowed)
Average Cumulative Debt Levels in 2017 Dollars Bachelorrsquos Degree Recipients at Public and Private Nonprofit Four-Year Institutions 2001-02 to 2016-17 Selected Years
Cumulative Debt Bachelorrsquos Degree RecipientsIn 2016-17 the 59 of bachelorrsquos degree recipients from public and private nonprofit institutions who borrowed graduated with an average of $28500 in debt an increase of 3 in inflation-adjusted dollars over the average amount borrowed in 2011-12
FIGURE 15
Average debt among public four-year college graduate borrowers rose by 3 ($700 in 2017 dollars) between 2011-12 and 2016-17 following a 16 ($3700) increase over the previous five years Average debt per graduate (including those who did not borrow) increased by 23 ($2800) between 2006-07 and 2011-12 and by 2 ($300) between 2011-12 and 2016-17
Borrowing among private nonprofit four-year college graduates rose rapidly between 2001-02 and 2006-07 but slowed over the next 10 years Average debt per borrower increased by 6 ($1700 in 2017 dollars) between 2006-07 and 2011-12 and by 3 ($900) between 2011-12 and 2016-17 Average debt per graduate rose by 2 ($400) between 2006-07 and 2011-12 and fell by 1 ($300) between 2011-12 and 2016-17
The share of public four-year college bachelorrsquos degree recipients graduating with debt rose from 52 in 2001-02 to 58 in 2011-12 but remained at 58 in 2016-17 The share of private nonprofit four-year college bachelorrsquos degree recipients graduating with debt rose from 64 in 2001-02 to 66 in 2006-07 but fell to 61 over the following decade
ALSO IMPORTANT
NOTES Figures include federal and nonfederal loans taken by students who began their studies at the institution from which they graduated Parent PLUS loans are not included The orange bars represent the average cumulative debt levels of bachelorrsquos degree recipients who took student loans The blue bars represent the average debt per bachelorrsquos degree recipient including those who graduated without student debt Calculations are based on the number of bachelorrsquos degrees awarded which typically exceeds the number of students receiving degrees The available data are not adequate to allow comparable calculations for for-profit institutions
SOURCES College Board Annual Survey of Colleges 2002 to 2017 calculations by the authors
Average Cumulative Debt in 2017 Dollars Bachelorrsquos Degree Recipients at Public and Private Nonprofit Four-Year Institutions 2001-02 to 2016-17 Selected Years
Percentage with Debt
Average Debt per Borrower
Average Debt per Graduate
2001-02 56 $23000 $12800
2006-07 58 $25000 $14600
2011-12 60 $27800 $16600
2016-17 59 $28500 $16700
For detailed data behind the graphs and additional information please visit trendscollegeboardorg 22
Half of the students who completed associate degrees in 2015-16 graduated without taking student loans This included 59 of those who graduated from public two-year colleges and 12 of those who earned their degrees from for-profit institutions
In 2015-16 non-degree-granting for-profit institutions granted 30 of all undergraduate certificates Among students completing these programs 15 did not take student loans and 17 borrowed $20000 or more More than half of certificate completers who attended public two-year institutions graduated without debt and 15 borrowed $20000 or more
Undergraduate certificate programs are short-term programs that prepare students for gainful employment in a recognized occupation To qualify for federal financial aid they must meet program hour specifications
In 2015-16 24 of the 39 million undergraduate credentials conferred were certificates 26 were associate degrees and 50 were bachelorrsquos degrees (NCES Digest of Education Statistics 2017Table 31840)
Bachelorrsquos Degree Recipients
No Debt $1 to $10000 to $20000 to $30000 to $40000 to $50000
All
Public Four-Year (60)
Private NonprofitFour-Year (27)
For-Profit (9)
All
Public Two-Year (82)
For-Profit (11)
All
Public Two-Year (33)
Public Non-Degree-Granting (9)
Private Nonprofit Two-Year or Less (6)
For-Profit Two-Year or More (19)
For-Profit Non-Degree-Granting (30)
$9999 $19999 $29999 $39999 $49999 or More
29 11 13 17 12 8 11
31 11 14 18 12 6 7
13 8 11 15
28 12 19 9 12 8 12
7 14 32
Associate Degree Recipients
No Debt $1 to $10000 to $20000 to $30000 to $40000 $9999 $19999 $29999 $39999 or More
51 13 5 5 17 10
3
1859 12
3
7
12 12 19 25 17 16
Certificate Recipients
No Debt $1 to $10000 to $20000 to $30000 $9999 $19999 $29999 or More
33 21
8
8 30 9
52 22 11 7
3
19
3
69 6
17 32
17 29
29 14
34 11
15 38 30 10 7
9
8
Cumulative Debt Undergraduate Degree RecipientsThe share of 2015-16 bachelorrsquos degree recipients who borrowed $50000 or more for their undergraduate studies ranged from 7 of those who earned their degrees at public four-year colleges and universities to 32 of those who graduated from for-profit institutions
FIGURE 16 D istribution of 2015-16 Degree or Certificate Completers by Cumulative Amount Borrowed for Undergraduate Study
ALSO IMPORTANT
Average debt by type of degree conceals considerable variation across borrowers of different backgrounds For example among bachelorrsquos degree recipients 11 of dependent students borrowed $40000 or more while 28 of independent students borrowed this much And among dependent students the share of students borrowing to fund their bachelorrsquos degrees goes down as family incomes go up
NOTES Percentages in parentheses on vertical axes represent the share of students earningtheir credentials in the specified sectors These percentages do not sum to 100 because a smallpercentage of students earn degrees at institutions not included in the sectors reported Forexample the bachelorrsquos degree graph excludes students who earned their bachelorrsquos degrees at public and private nonprofit two-year schools and the associate degree and certificate graphsexclude students who earned their credentials at public and private nonprofit four-year schools
SOURCES NCES National Postsecondary Student Aid Study (NPSAS) 2016 calculations by the authors
For detailed data behind the graphs and additional information please visit trendscollegeboardorg 23
The share of masterrsquos degree recipients who did not borrow for graduate school ranged from a low of 21 at for-profit institutions to a high of 42 at public universities
More than half of public university doctoral degree recipients avoided borrowing for graduate school while 12 borrowed $100000 or more
Sixteen percent of 2015-16 doctoral degree recipients earned their degrees at for-profit institutions 51 of these students borrowed $100000 or more for graduate school
More than one-quarter of students who earned professional degrees at private nonprofit universities in 2015-16 borrowed $200000 or more for graduate study as did 9 of those who graduated with professional degrees from public universities
In 2016 median earnings among adults 25 and older were $91600 for those with doctoral degrees and $100100 for those with professional degrees (US Census Bureau Table PINC-03)
All
Public (47)
Private Nonprofit (43)
For-Profit (10)
All
Public (52)
Private Nonprofit (32)
For-Profit (16)
All
Public (42)
Private Nonprofit (53)
For-Profit (4)
Masterrsquos Degree Recipients
No Debt $1 to $25000 to $50000 to $75000 to $100000 $24999 $49999 $74999 $99999 or More
38 21 20 12 4 5
42
3
24 19 10
2
38 18 19 14 5 6
21 31 7 8 20 13
Doctoral Degree Recipients
No Debt $1 to $50000 to $100000 to $150000 $49999 $99999 $149999 or More
42 21 16 13
55
7
6
6 19 14 6
35 30 18 11
15 13 21 38 13
Professional Degree Recipients
No Debt $1 to $50000 to $100000 to $150000 to $200000$49999 $99999 $149999 $199999 or More
21 13 15 16 14 20
20 17 20 23 10 9
24 10 11 10 17 28
7 12 13 18 22 28
Cumulative Debt Graduate Degree RecipientsIn 2015-16 5 of masterrsquos degree recipients 20 of doctoral degree recipients and 50 of professional degree recipients borrowed $100000 or more to fund their graduate school study
Distribution of 2015-16 Advanced Degree Recipients by Cumulative Amount Borrowed for Graduate Study
ALSO IMPORTANT
Almost three-quarters of graduate-level credentials earned are masterrsquos degrees 12 are professional degrees 5 are research doctoral degrees and the remaining credentials are post-baccalaureate certificates (NPSAS 2016)
Professional degrees include those in chiropractic medicine dentistry law medicine optometry osteopathic medicine pharmacy podiatry and veterinary medicine
NOTES Includes all loans borrowed for graduate study Percentages on the vertical axis represent shares of graduates from each sector Percentages may not sum to 100 because of rounding
SOURCES NCES National Postsecondary Student Aid Study (NPSAS) 2016 calculations by the authors
For detailed data behind the graphs and additional information please visit trendscollegeboardorg 24
FIGURE 17
Federal VeteransDepartment State Institutional Private and (Nonmilitary) of Defense Employer
Public Four-Year
All Full-Time 7 20 31 13 $7300Students
Independent 21 13 17 9 $8460Students (17)
Dependent 14 $7060Students (83)
3
Less than 25 20 8 $11700$35000 (26)
$35000 to 25 33 11 $8280$69999 (21)
7 3 $70000 to
21 $4830$119999 (25)
39
27 21 35
46
28
17 53
57
30
3 10 $120000 or
25 $3810Higher (28) 7
$0 $2000 $4000 $6000 $8000 $10000 $12000
Public Two-Year
8 All Full-Time
$4680Students 10
4 Independent
27 $5750Students (34)
56 12 14
54 10
57 17 14
75 14
53 19 15
45
11 4 Dependent
$4130Students (66)
6 Less than
$6550$35000 (36) 11 5
$35000 to $3710$69999 (29)
3 $70000 to
27 37 26 $1980$119999 (24) 7 14$120000 or
36 $2140Higher (12) 4
$0 $2000 $4000 $6000 $8000 $10000 $12000
Dep
ende
nt S
tude
nts
D
epen
dent
Stu
dent
s
Pare
ntsrsquo
Inco
me
Pare
ntsrsquo
Inco
me
Sources of Grant Aid Public Institutions In 2015-16 full-time students received an average of $7300 in grant aid at public four-year institutions and $4680 at public two-year institutions
FIGURE 18 Sources of Grant Aid Full-Time Students at Public Institutions 2015-16
NOTES Includes full-time undergraduate students who were US citizens or permanent residents Percentages may not sum to 100 because of rounding
SOURCES NCES NPSAS 2016 calculations by the authors
At both public four-year and public two-yearinstitutions full-time independent studentsreceived more grant aid on average than dependentstudents Independent students received lessfunding from state institutional and private and employer grants but more from federal grants andparticularly veterans and military grants
At public four-year colleges and universitiesdependent students from families with incomes lessthan $35000 received almost half of their grant aid from the federal government Those from familieswith incomes of $70000 or more received very little federal aid more than half of the grant aid these students received came from their institutions
At public two-year colleges dependent students from families with incomes less than $35000 received three-quarters of their grant aid from the federal government Institutional grant aid in this sector was skewed toward more affluent students with average grants ranging from $230 per independent student and $380 per dependent student from families with incomes less than $35000 to $970 for those from families with incomes of $120000 or higher
ALSO IMPORTANT
In 2015-16 public doctoral universities awarded institutional aid averaging $5750 to 43 of their full-time domestic undergraduate studentsmdashanaverage of $2490 per student Public nondoctoral universities awarded institutional aid averaging $3730 to 30 of their full-time domestic undergraduatestudentsmdashan average of $1110 per student
Students from higher-income families attending public four-year institutions are more likely than those from lower-income families to attend doctoral universities In 2015-16 76 of dependent students from thelowest family income quartile attended doctoral universities and 24 attended non-doctoral-grantinginstitutions Among those from the highest income quartile these shares were 85 and 15 respectively
For detailed data behind the graphs and additional information please visit trendscollegeboardorg 25
Average total grant aid for independent students at private nonprofit institutions was only about 60 of the average amount received by dependent students in 2015-16 Independent students received more funding from federal grants including aid to veterans and the military but less from states from private sources and employers and particularly from institutions
Federal VeteransDepartment State Institutional (Nonmilitary) of Defense
Private Nonprofit Four-Year
3 All Full-Time
10 5 74 8 $19050Students
6 Independent
24 19 43 8 $11890Students (20)
Dependent8 5 78 8 $20780Students (80)
Less than 22 8 63
Private and Employer
6 $26220$35000 (19)
$35000 to10 7 77 6 $24710$69999 (20) 2
$70000 to86 7 $20900$119999 (23)
4 $120000 or
85 11 $15860Higher (38) 2
$0 $5000 $10000 $15000 $20000 $25000 $30000
For-Profit
4 All Full-Time 33 6 $8400Students
Independent40 6 $8820Students (75)
3 Dependent
8 $7160Students (25)
4 Less than
6 $8940$35000 (49)
$35000 to9 $6650$69999 (28)
2 4$70000 to
19 58 17 $5070$119999 (14)
42 15
41 10
45 7 9 31
9 21
34 10 10 38
78
59
7 13 $120000 or
$2490Higher (9) 2
$0 $2000 $4000 $6000 $8000 $10000
Dep
ende
nt S
tude
nts
D
epen
dent
Stu
dent
s
Pare
ntsrsquo
Inco
me
Pare
ntsrsquo
Inco
me
FIGURE 19 Sources of Grant Aid Full-Time Students at Private Institutions 2015-16
Sources of Grant Aid Private Institutions In 2015-16 low-income students enrolled full time at private nonprofit four-year colleges and universities received 63 of their total grant aid from their institutionsmdashan average of $16590 per student out of a total of $26220 of grant aid from all sources
NOTES Includes full-time undergraduate students who were US citizens or permanent residents Percentages may not sum to 100 because of rounding
SOURCES NCES NPSAS 2016 calculations by the authors
Students from families with incomes of $120000 or higher received 85 of their total grant aid from their institutionsmdashan average of $13510 per student out of a total of $15860
In 2015-16 full-time students at for-profit institutions received 42 of their grant aid from federal nonmilitary grants 33 from veterans and military grants and 15 from their institutions
Average institutional grant aid per student in thefor-profit sector ranged from $910 for independentstudents and $1920 for dependent students fromfamilies with incomes below $35000 to $2920 for those with incomes between $70000 and $120000
ALSO IMPORTANT
In 2015-16 very selective private nonprofit four-year institutions awarded 73 of their full-time domestic students an average of $24340 in grant aidmdashan average of $17670 per student Forty-five percentof dependent students from families with incomes of $120000 or more enrolled in the private nonprofit sector attended these very selective institutions as did 25 to 30 of those from lower-income families and 21 of independent students (Selectivity is defined by NPSAS based on the share of students admitted and SATregACT scores)
Minimally selective and open admission four-year private nonprofit institutions awarded 43 of their full-time students an average of $11450 in grant aidmdashan average of $4910 per student Four percent of dependent students from families with incomes of $120000 or more enrolled in the private nonprofit sector attended these institutions compared with 20 of those from the lowest-income families and 34 of independent students in this sector
For detailed data behind the graphs and additional information please visit trendscollegeboardorg 26
The number of undergraduates declined by26 million (10) between 2011-12 and 2017-18 The number of Pell Grant recipients declined by24 million (26) over these six years
Number of Recipients (in Millions)
Total Pell Expenditures (in Billions) $50 10
Tota
l Pel
l Exp
endi
ture
s in
Bill
ions
of 2
017
Dol
lars
Num
ber of Pell Recipients (in Millions)$10
$20
$30
$40$40
2
4
6
8
$61
20
$61 $81
$108 $97
$158 $172
$343
$282
25 29
40 37
48
55
90
70
$0 0 77-78 82-83 87-88 92-93 97-98 02-03 07-08 12-13 17-18
Year
1977-78
Percentage of Recipients Who Were Independent
39
1987-88 58
1997-98 57
2007-08 58
2012-13 58
2013-14 56
2014-15 55
2015-16 53
2016-17 51
12-Month Undergraduate Headcount Enrollment Pell Recipients
252246 24725
0
10
219 232
241 236 232 227 224 222
17-1816-1715-1614-1513-1412-1311-1210-1109-1008-0907-08
25 26 33 37 38 37 37 36 34 32 32
5
20
Mill
ions
of S
tude
nts
15
Pell Grants The share of undergraduate students receiving Pell Grants rose from 25 in 2007-08 to a peak of 38 in2011-12 It then declined steadily to 32 in 2017-18
FIGURE 20A Undergraduate Enrollment and Percentage of UndergraduateStudents Receiving Pell Grants 2007-08 to 2017-18
NOTES IPEDS headcount enrollments are adjusted for the difference between total headcount which counts students more than once if they are enrolled in more than one institution at the same time and unduplicated headcount reported by the National Student Clearinghouse (NSC) Twelve-month undergraduate headcount for 2017-18 is estimated from NSC data
SOURCES NCES Postsecondary Institutions and Cost of Attendance in 2017-18 Degrees and Other Awards Conferred 2016-17 and 12-Month Enrollment 2016-17 First Look (Preliminary Data) and earlier editions National Student Clearinghouse Current Term Enrollment Estimates Spring 2018 US Department of Education Federal Pell Grant Program End-of-Year Report 2016-17US Department of Education Federal Student Aid Data Center Title IV Program Volume Reports and Aid Recipients Summary calculations by the authors
FIGURE 20B Total Pell Grant Expenditures and Number of Recipients 1977-78 to 2017-18
Total Pell Grant expenditures increased from $61 billion (in 2017 dollars) in 1977-78 to $97 billion in 1997-98 and to $282 billion in 2017-18 Over the decade from 2007-08 to 2017-18 expenditures spiked from $172 billion in 2007-08 to $401 billion in 2010-11 before falling back to $282 billion in 2017-18
The percentage of Pell Grant recipients who are independent students with eligibility determined bytheir own financial circumstances rather than those of their parents increased from 39 in 1977-78 to 57 in 1997-98 This percentage declined from 58 in 2007-08 and 2012-13 to 51 in 2016-17
ALSO IMPORTANT
Changes in Pell Grant expenditures result from changes in the legislated maximum grant the formula for determining expected family contributions the number of enrolled students the share of students enrolling full time and the financial circumstances of students and families
Percentage of Recipients Who Were Independent 1977-78to 2016-17 Selected Years
SOURCES US Department of Education Federal Pell Grant Program End-of-Year Report 1977-78 through 2016-17US Department of Education Federal Student Aid Data Center Title IV Program Volume Reports and Aid Recipients Summary calculations by the authors
For detailed data behind the graphs and additional information please visit trendscollegeboardorg 27
FIGURE 21A Maximum and Average Pell Grants in 2017 Dollars 1977-78 to 2017-18
Max
imum
and
Ave
rage
Gra
nt in
201
7 D
olla
rs
$3000
$4000
$5000
$6000
Maximum Pell Grant
Average Pell Grant per Recipient
$5620
$3040
$4520
$4120
$5060
$5920
$2800 $2590
$3110
$4010
$2000
$1000
$0 77-78 82-83 87-88 92-93 97-98 02-03 07-08 12-13 17-18
FIGURE 21B Inflation-Adjusted Maximum Pell Grant and Published Prices at Public and Private Nonprofit Four-Year Institutions in 2018 Dollars 1998-99 to 2018-19
$48510 $50000
Public Four-Year Tuition and Fees and Room and
Board
Private Nonprofit Four-Year Tuition and Fees and Room and Board
Private Nonprofit Four-Year Tuition and Fees
$22710
$28430
$35830
$31600
$38720
$21370
$40000
$30000
Public Four-Year Tuition and Fees
$5010 $7560
$10230 $12000
$16470
$5420 $6100
$20000
$10000
$4630 Maximum Pell Grant $0
98-99 00-01 02-03 04-05 06-07 08-09 00-11 12-13 14-15 16-17 18-19
The maximum Pell Grant is the most frequently cited measure of per-student subsidies provided by the program However most students receive smaller grants because they are enrolled part time or because their family incomes and assets reduce their aid eligibility In 2017-18 when the maximum Pell Grant was $5920 the average grant was $4010
The percentage of average public four-year in-state published tuition and fees covered by the maximum Pell Grant declined from 92 in 1998-99 to 72 in 2008-09 and to 60 in 2018-19
In 2016-17 27 of recipients received the maximum grant of $5815 (US Department of Education Federal Pell Grant Program End-of-Year Report 2016-17Table 3A)
Between 2008-09 and 2018-19 published tuition and fees increased by 31 per year at public four-year institutions and by 23 per year at private nonprofit institutions while the maximum Pell Grant increased by 12 per year after adjusting for inflation
Pell Grants The maximum Pell Grant amount which is legislated by Congress has fluctuated over time The $5920 maximum Pell Grant in 2017-18 was 44 higher in inflation-adjusted dollars than it was 20 years earlier but only 5 higher than it was 40 years earlier in 1977-78
The percentage of average private nonprofit four-year published tuition and fees covered by the maximum Pell Grant declined from 20 in 1998-99 to 19 in 2008-09 and to 17 in 2018-19
ALSO IMPORTANT
The maximum Pell Grant for 2018-19 is $6095 about the same as in 2017-18 after adjusting for the 30 increase in the Consumer Price Index
SOURCES US Department of Education Federal Pell Grant Program End-of-Year Report 1977-78 through 2016-17 US Department of Education Federal Student Aid Data Center Title IV Program Volume Reports and Aid Recipients Summary calculations by the authors
2018
Dol
lars
Maximum Pell Grant as a Percentage of Published Prices in 2018 Dollars 1998-99 to 2018-19 Selected Years
Public Four-Year In-State Private Nonprofit Four-Year
Tuition and Fees
Tuition and Fees and
Room and Board
Tuition and Fees
Tuition and Fees and
Room and Board
98-99 92 39 20 15
03-04 87 38 21 16
08-09 72 33 19 14
13-14 64 31 19 14
18-19 60 29 17 13 SOURCES The College Board Trends in College Pricing 2018 Table 2 online US Department of Education Federal Student Aid Data Center
For detailed data behind the graphs and additional information please visit trendscollegeboardorg 28
Distribution of Pell Grant Recipients by Dependency Status and Family Income 2016-17
Independent Without Dependents (21)
Independent with Dependents (30)
Dependent (49)
$9000 or $9001 to $20001 to $40001 to $50001 or Less $20000 $40000 $50000 Higher
53 35 11
21 26
16
32 9
36 12
12
21 15
Percentage of Pell Grant Recipients
41 and Older (7) 517400
31 to 40 (13) 924300
24 to 30 (23) 1678000
20 to 23 (33) 2396600
19 or Younger (23) 1678500
0 05 10 15 20 25 30
Number of Pell Grant Recipients (Millions)(Total = 72 Million)
Pell Grants In 2016-17 56 of Pell Grant recipients were younger than 24 23 were between 24 and 30 and 20 were older than 30
FIGURE 22A Distribution of Pell Grant Recipients by Age 2016-17
NOTES Percentages on the vertical axis represent percentages of recipients in each age groupPercentages may not sum to 100 because of rounding
SOURCE US Department of Education 2016-17 Federal Pell Grant Program End-of-Year ReportTable 11A
FIGURE 22B
NOTES Percentages on the vertical axis represent percentages of recipients in each group Percentages may not sum to 100 because of rounding
SOURCE US Department of Education 2016-17 Federal Pell Grant Program End-of-Year ReportTable 2
In 2016-17 49 of Pell Grant recipients were dependent students 37 of these students camefrom families with incomes of $20000 or less andanother 36 came from families with incomes between $20000 and $40000
Fifty-one percent of 2016-17 Pell Grant recipients were independent students 30 had dependentsof their own and 21 were independent studentswithout dependents
Among independent Pell Grant recipients withdependents 47 had family incomes of $20000or less and another 32 had incomes between$20000 and $40000
Fifty-three percent of independent Pell Grantrecipients without dependents had family incomesof $9000 or less another 35 had incomesbetween $9000 and $20000
ALSO IMPORTANT
The age distribution of Pell Grant recipients in 2016-17 was similar to the age distribution in 1996-97 In both years 56 of recipients were 23 or younger and 20were over age 30 However between 2009-10 and2011-12 about one-quarter of Pell Grant recipients were over the age of 30 (Federal Pell Grant Program End-of-Year Reports 1996-97 and 2016-17)
In 2016-17 63 of Pell Grant recipients had zero expected family contribution (EFC) This included 51 of dependent recipients 63 of independent recipients without dependents and 81 ofindependent recipients with dependents (2016-17 Federal Pell Grant Program End-of-Year Report Table 2)
In 2016-17 12 of dependent recipients received a Pell Grant of less than $1500 and 38 received$5400 or more (2016-17 Federal Pell Grant ProgramEnd-of-Year Report Table 3B)
For detailed data behind the graphs and additional information please visit trendscollegeboardorg 29
FIGURE 23B Need-Based State Grant Aid as a Percentage of Total Undergraduate State Grant Aid by State 2016-17
$820 $800 $750
Non-Need-Based $700$670
$0 76-77 81-82 86-87 91-92 96-97 01-02 06-07 11-12 16-17
Aver
age
Stat
e G
rant
per
FTE
Unde
rgra
duat
e St
uden
t
100
100
100
100
100
100
91
90
91
91
91
90
90
89
88
89
90
90
87
86
85
Need-Based $600
$520
$430 $390$400 $380
$320
$200
83
82
78
76
76
77
74
73
72
72
73
72
73
71
74
75
76
76
76
76
95 99100 100
80 76
60
46
40
20 17
Geo
rgia
Sout
h Da
kota
Arka
nsas
Loui
sian
aSo
uth
Caro
lina
Utah
New
Mex
ico
Neva
daTe
nnes
see
Mon
tana
Alas
kaFl
orid
aW
est V
irgin
iaKe
ntuc
kyM
issi
ssip
piDe
law
are
Mis
sour
iNo
rth
Dako
taO
hio
Unite
d St
ates
Vi
rgin
iaO
klah
oma
Nebr
aska
Iow
aAl
abam
aCo
lora
doNe
w Yo
rkW
ashi
ngto
nM
assa
chus
etts
Wis
cons
inNo
rth
Caro
lina
Indi
ana
Idah
oNe
w J
erse
yM
ichi
gan
Mar
ylan
dCo
nnec
ticut
Min
neso
taPe
nnsy
lvan
iaVe
rmon
tIlli
nois
Calif
orni
aAr
izona
Haw
aii
Kans
asM
aine
Ore
gon
Rhod
e Is
land
Texa
sW
yom
ing
00
Perc
enta
ge o
f Sta
te G
rant
sBa
sed
on F
inan
cial
Nee
d
In 1981-82 and earlier years virtually all state grant aid was based on studentsrsquo financial circumstances The share that was need-based declined gradually to a low of 71 in 2010-11 From 2013-14 through 2016-17 76 of state grant aid was need-based
In 2016-17 half of the states considered studentsrsquo financial circumstances in allocating at least 95 of their state grant aid Fifteen states considered studentsrsquo financial circumstances when awarding less than half of their state grant aid
Need-Based and Non-Need-Based State Grants per Full-Time Equivalent Undergraduate Student in 2016 Dollars 1976-77 to 2016-17
State Grants State grant aid per full-time equivalent undergraduate student rose for the fifth consecutive year in 2016-17 to $820mdashan increase of $120 (17) since 2011-12
FIGURE 23A
NOTE Percentages displayed represent percentages of total undergraduate state grant aid for which studentsrsquo financial circumstances were considered
SOURCE National Association of State Student Grant and Aid Programs (NASSGAP) Annual Survey 1976-77 to 2016-17 Tables 1 and 12
NOTES Need-based aid includes any grants for which financial circumstances contribute to eligibility Non-need-based aid refers to grants for which financial circumstances have no influence on eligibility New Hampshire did not award state grant aid to undergraduate students in 2016-17
SOURCE NASSGAP Annual Survey 2016-17 Table 1
ALSO IMPORTANT
Total spending on state grant aid increased from $9 billion (in 2016 dollars) in 2006-07 to $10 billion in 2011-12 and to $11 billion in 2016-17 (NASSGAP Annual Survey 2006-07 2011-12 and 2016-17)
For detailed data behind the graphs and additional information please visit trendscollegeboardorg 30
$2190
Stat
e G
rant
Aid
per
FTE
Stu
dent
$1000
$500
$0
New
Ham
pshi
reM
onta
naAr
izona
Utah
Haw
aii
Kans
asId
aho
Sout
h Da
kota
Rhod
e Is
land
Nebr
aska
Conn
ectic
utM
issi
ssip
piM
ichi
gan
Ohi
oM
assa
chus
etts
Alab
ama
Mai
neIo
wa
Mar
ylan
dO
rego
nNo
rth
Dako
taM
isso
uri
Colo
rado
Wis
cons
inNe
vada
Flor
ida
Dela
war
eO
klah
oma
Verm
ont
Illino
isW
yom
ing
Nort
h Ca
rolin
a Un
ited
Stat
esPe
nnsy
lvan
iaTe
xas
Min
neso
taAl
aska
Arka
nsas
Virg
inia
New
York
Indi
ana
Wes
t Virg
inia
Calif
orni
a W
ashi
ngto
nNe
w M
exic
oLo
uisi
ana
Kent
ucky
Ne
w J
erse
y Te
nnes
see
$0 $150
$390 $550
$820
$2000
$1500 $1290
$1110
Geo
rgia
Sout
h Ca
rolin
a
Gra
nt A
id a
s a
Perc
enta
geof
Fis
cal S
uppo
rt
30
20
10
0
13
0
36
New
Ham
pshi
reHa
wai
iM
onta
naUt
ahId
aho
Kans
asSo
uth
Dako
taAr
izona
Nebr
aska
Co
nnec
ticut
Mis
siss
ippi
Wyo
min
gNo
rth
Dako
taRh
ode
Isla
ndM
aryl
and
Alas
kaAl
abam
aO
hio
Mic
higa
nM
assa
chus
etts
Mai
neNe
vada
Illino
isNo
rth
Caro
lina
Iow
aW
isco
nsin
Flor
ida
Ore
gon
Dela
war
eO
klah
oma
Arka
nsas
Texa
s Ne
w M
exic
oUn
ited
Stat
esM
inne
sota
Mis
sour
i Ca
lifor
nia
Colo
rado
New
York
Indi
ana
Was
hing
ton
Kent
ucky
New
Jer
sey
Loui
sian
aW
est V
irgin
ia
Geo
rgia
Ve
rmon
t Vi
rgin
ia
Tenn
esse
e Pe
nnsy
lvan
iaSo
uth
Caro
lina
In 2016-17 four states provided 42 of all state grant aid dollars with California accounting for 18 of the total
Some state-funded grant aid is in the form of ldquotuition set-asiderdquo programs through which a portion of tuition revenues at public institutionsmdashor of increases in tuitionmdashis dedicated to grant aid Some of these funds are included in reported state grant aid but others are not Tuition remission dollars not always reported as state grant aid are sizable in several states
State Grants In 2016-17 state grant aid per full-time equivalent (FTE) undergraduate student ranged from under $200 in nine states to over $1000 in 13 states
FIGURE 24A State Grant Aid per Full-Time Equivalent (FTE) Undergraduate Student 2016-17
NOTE State grant expenditures include funding for both undergraduate and graduate students
SOURCE NASSGAP Annual Survey 2016-17 Table 14
South Carolina with the highest grant aid per FTE undergraduate student considered the financial circumstances of recipients for only 17 of state grant funds in 2016-17 Georgia the second most generous state allocates its grant funds without regard to studentsrsquo financial circumstances (Figure 23B)
ALSO IMPORTANT
Overall state grant expenditures constituted 13 of total state
support for higher education in 2016-17 Thirteen states devoted less than 5 of their higher education funding to grant aid for students nine states directed more than 20 of their funding to individual students rather than to institutions
For detailed data behind the graphs and additional information please visit trendscollegeboardorg 31
NOTES Full-time equivalent students include both state residents and out-of-state students States do not award grant aid to nonresidents
SOURCES NASSGAP Annual Survey 2016-17 Tables 1 and 12 calculations by the authors
FIGURE 24B State Grant Expenditures as a Percentage of Total State Support for Higher Education by State 2016-17
On average dependent students from families with incomes below $35000 received more than five times as much institutional grant aid at high-tuition private colleges in 2015-16 as similar students at low-tuition private colleges ($33260 vs $6160) Students from families with incomes of $120000 or higher recei ved on average about 50 more grant aid at high-tuition colleges than similar students at low-tuition colleges ($12840 vs $8660)
In 2015-16 public doctoral universities distributed 62 of their institutional grant aid without regard to studentsrsquo financial need at public masterrsquos universities it was 71
Average Institutional Grant Aid Full-Time Undergraduates at Private Nonprofit Four-Year Institutions 2015-16
Average Institutional Grant Aid Full-Time Undergraduates at Public Doctoral and Master rsquos Insti tutions 2015-16
Tuition and Fees
Need-Based $45000 or Higher
Tuition and Fees
15
85 54
35
65
35
65
23
77
82
18
74
26
69
31
52
48
46$13900
$19740 $21160 $20280
$15640
$33260 $33120
$25730
Between $35000 and $44999
Tuition and Fees Between $30000
$25000 and $34999
Tuition and Fees Less than $25000
Aver
age
Inst
itutio
nal G
rant
Aid
$20000
37
63
$14270
33
67
$15350
25
75
$16340
$12840
$9550
71 81
$8660$10000 $7850 $6160
76
46 54
29 2419$0 Less than $35000 $70000 $120000 Less than $35000 $70000 $120000 Less than $35000 $70000 $120000 Less than $35000 $70000 $120000 $35000 to to or Higher $35000 to to or Higher $35000 to to or Higher $35000 to to or Higher
$69999 $119999 $69999 $119999 $69999 $119999 $69999 $119999
Parentsrsquo Income of Dependent Students
Non-Need-Based Need-Based
$3570
45
45
74
$3310 $3110
Aver
age
Inst
itutio
nal G
rant
Aid
$3000
$2000
$1000
$0
$2900
38
62
$2490
15
85
55
$1490 $1460
63
$1410$1360$1330
8855
16
84
36
64
29
71
26
12 37
All Less than $35000 $70000 $120000 All Less than $35000 $70000 $120000 $35000 to to or Higher $35000 to to or Higher
$69999 $119999 $69999 $119999
Public Doctoral Public Masterrsquos
Parentsrsquo Income of Dependent Students
Institutional Grants In 2015-16 private nonprofit four-year institutions with tuition and fees of $45000 or higher awarded on average about two and a half times as much grant aid to dependent students from families with incomes below $35000 as to those from families with incomes of $120000 or higher ($33260 vs $12840)
FIGURE 25A
Non-Need-Based
FIGURE 25B Lower-price private nonprofit four-year institutions tend to award larger shares of their grant aid without regard to the financial circumstances of recipients In 2015-16 the lowest-price institutions (those with tuition and fees of less than $25000) awarded more institutional grant aid on average to students from families with incomes of $70000 or higher than to those from families with lower incomes
NOTES Includes full-time undergraduates who were US citizens or permanent residents Averages are across all full-time students enrolled for the full year at one institution including those who did not receive institutional grant aid Non-need-based aid is based entirely on merit or other circumstances not related to need and includes athletic and merit scholarships tuition waivers of all kinds and other categories of institutional awards Each tuition and fee category in Figure 25A includes about one-quarter of full-time undergraduates in the sector Public bachelorrsquos colleges which enroll about 5 of undergraduates in the public sector are not included in Figure 25B
SOURCES NCES NPSAS 2016 calculations by the authors
In 2015-16 the lowest-income dependent students at public doctoral universities received about 25 more institutional grant aid on average than those from families with incomes of $120000 or higher ($3110 vs $2490) At public masterrsquos universities average institutional grants were similar for students from all income groups
For detailed data behind the graphs and additional information please visit trendscollegeboardorg 32
Tax savings for students and parents who claimed education tax credits averaged about $1500 in 2016
The American Opportunity Tax Credit which accounts for most of the total credits and deductions is available to taxpayers with adjusted gross incomes as high as $180000 The maximum benefit per filer is $2500 with up to $1000 of that amount available as a refund to filers with no tax liability
Distribution of Education Tax Credits by Adjusted Gross Income 2006 2011 and 2016
Less than $25000 to $50000 to $75000 to $100000 to $25000 $49999 $74999 $99999 $180000
2016 (Average = $1500) 24 24
2011 (Average = $1500) 25 19
1
2006 (Average = $1100) 34
22 16 14
14
16 13
26 25
27
Total DeductionsTotal Credits
2016 $160 $166
2014 $180 $185
2012 $185 $191
2010 $224 $229
2008 $71 $87
2006 $72 $88
2004 $66 $87
2002 $59 $73
2000 $63 $63
1998 $47 $47
$0 $5 $10 $15 $20 $25
Total Savings in Billions of Dollars
Education Tax Credits and Tuition Deductions The implementation of the American Opportunity Tax Credit in 2009 shifted the benefits of the education tax credits from filers with incomes between $25000 and $100000 to those with lower and higher incomes
FIGURE 26B Total Education Tax Credits and Savings from Tuition Deductions in Billions of 2016 Dollars 1998 to 2016 Selected Years
NOTES The total and average values of tax credits and deductions are best estimates based on data from the Internal Revenue Service A portion of nonrefundable dollars claimed on nontaxable returns is excluded to account for credits and deductions that do not reduce tax liability The value of tax deductions is estimated based on applicable marginal tax rates Percentages may not sum to 100 because of rounding
SOURCES Internal Revenue Service Statistics of Income 1998 to 2016 Tables 13 14 33 calculations by the authors
In 2016 about a quarter of the benefits of the federal education tax credits went to tax filers with incomes between $100000 and $180000 a slightly smallershare went to filers with incomes of $25000 orless and just over half went to those with incomes between $25000 and $100000
In 2016 students and parents saved about $166 billion on their federal income taxes through taxcredits and deductions for higher education expenses This form of subsidy was $88 billion (in 2016 dollars) in 2006 and $229 billion in 2010
ALSO IMPORTANT
Education tax credits and deductions are ldquotax expendituresrdquo They reduce federal income tax liabilities and federal tax revenues and have the same impact on the federal budget as direct expenditures such asPell Grants
Because the credit is only partially refundable manylow-income filers who have low or no tax liabilitiesreceive smaller credits than higher-income filers whocan subtract the full credit from the amount they owe
About one quarter of undergraduates are ineligible foreducation tax credits because they do not pay tuition out of pocket Many low-income students receive federal and state grant aid that covers tuition and feesliving costs are not qualifying expenses for educationtax credits and deductions (Delisle and Dancy ldquoA New Look at Tuition Tax Benefitsrdquo 2015)
In 2016 124 million taxpayers deducted $134 billion in student loan interest generating about $2 billion in tax savings for those borrowers (Internal Revenue Service Statistics of Income 2016 Table 14 Fiscal Year 2017 Analytical Perspectives Budget of the US Government FY18 Table 13-1)
For detailed data behind the graphs and additional information please visit trendscollegeboardorg 33
FIGURE 26A
Notes and Sources
Campus-Based Aid (FWS Perkins and FSEOG) Iraq and Afghanistan Service Grants and ACGSMART Grants US Department of Education Annual Federal Program Data Books Federal Work-Study (FWS) and Federal Supplemental Educational Opportunity Grant (FSEOG) amounts include allocated federal funds only Institutional matching funds required since 1989-90 for FSEOG are reported under institutional grants No funds have been appropriated for new federal capital contributions to the Perkins Loan program since FY06 and the program is funded from past federal and institutional capital contributions as well as collections from borrowers
Education Tax Benefits Income Tax Returns All Returns Tables 13 14 2 and 33 Data on education tax credits are authorsrsquo estimates based on IRS data on the volume of Hope Lifetime Learning and American Opportunity credits for tax years 1998 and later A portion of nonrefundable dollars claimed on nontaxable returns is excluded to account for credits that do not reduce tax liability Tax deductions are based on IRS Statistics of Income Table 14 with associated savings estimated by the authors based on the marginal tax rates applied to the taxable income of the taxpayers in each income bracket claiming the deduction on taxable returns Calendar year amounts are split between the two associated academic years
Federal Subsidized and Unsubsidized Student Loans 2009-10 and prior unpublished data provided by the US Department of Education staff 2010-11 and after Federal Student Aid Data Center Title IV Program Volume Reports Because the Federal Student Aid Data Center will continue to update the loan volume after each academic year ends we adjusted the 2017-18 data (released in September 2018) using the average of the percentage change between July 2015 and July 2016 in the reported 2014-15 loan volume the percentage change between July 2016 and July 2017 in the reported 2015-16 loan volume and the percentage change between July 2017 and July 2018 in the reported 2016-17 loan volume
Prior to 1993-94 federal Subsidized and Unsubsidized Loans for students were made by banks and other private lenders and guaranteed by the federal government From 1994-95 through 2009-10 the guaranteed loan program known as the Federal Family Education Loan Program (FFELP) continued alongside the Federal Direct Loan Program (FDLP) which lends federal funds to students Beginning in 2010-11 all of the loans are Federal Direct Subsidized or Unsubsidized Loans
Subsidized Loans are need-based student loans for which the federal government pays the interest while the student is in school and during a six-month grace period thereafter Prior to June 2012 these loans were available to both undergraduate and graduate students but the Budget Control Act of 2011 eliminated the program for graduate students whose federal loans are now all Unsubsidized or Grad PLUS loans Interest accrues on Unsubsidized Loans from the time they are disbursed
Institutional Grants 2015-16 and prior IPEDS Finance data Estimated for 2016-17 and 2017-18 Estimated figures represent best approximations and are updated each year as additional information becomes available
Nonfederal Loans Estimates of nonfederal borrowing rely on data from MeasureOne Between 2011-12 and 2016-17 we supplemented these data with information from the Consumer Bankers Association and the Consumer Financial Protection Bureau Earlier data are based on information provided by lenders supplemented by data from annual reports and from NPSAS Estimates of institutional lending are based on NPSAS as well as a survey of institutions conducted for the College Board by the National Association of Student Financial Aid Administrators (NASFAA) We no longer report state and institutional loans separately from private loans because of changes in MeasureOnersquos methodology and data availability issues
Pell Grant Program 2016-17 and prior Federal Pell Grant Program End-of-Year Report 2017-18 Federal Student Aid Data Center Title IV Program Volume Reports
Private and Employer Grants Estimates are based on data included in NPSAS and on National Scholarship Providers Association surveys of major private student grant providers supplemented by information from annual reports of selected scholarship providers data from institutional financial aid offices and the College Boardrsquos Annual Survey of Colleges
State Grant Programs 20th through 48th Annual Survey Reports of the National Association of State Student Grant and Aid Programs (NASSGAP) for 1988-89 to 2016-17 and estimated for 2017-18
Veterans Benefits Benefits Program series (annual publication for each fiscal year) US Department of Veterans Affairs Office of Budget and Finance Veterans benefits are payments for postsecondary education and training to veterans and their dependents including the Post-911 Veterans Educational Assistance Program established in 2009-10 and all programs established earlier The Iraq and Afghanistan Service Grants program begun in 2010-11 provides non-need-based grants for students whose parent or guardian was a member of the Armed Forces who died in Iraq or Afghanistan as a result of performing military service after Sept 11 2001 Estimates include benefits for active duty military members
34
Trends in Student Aid was authored by Sandy Baum nonresident fellow at the Urban Institute Jennifer Ma senior policy research scientist at the College Board Matea Pender policy research scientist at the College Board and CJ Libassi senior policy research analyst at the College Board
CONTACT INFORMATION FOR THE AUTHORS
sandybaum73gmailcomtrendscollegeboardorg
Trends in Student Aid and its companion report Trends in College Pricing are supplemented by a website that makes detailed data available for reference and downloading The PDF versions of these reports along with PowerPoint slides of all the graphs are available on the web trendscollegeboardorg
Hard copies may be requested by contacting trendscollegeboardorg
Tables graphs and data in this report or excerpts thereof may bereproduced or cited for noncommercial purposes only provided that the following attribution is included
Source Baum Sandy Jennifer Ma Matea Pender and CJ Libassi (2018) Trends in Student Aid 2018 New York The College Board
copy 2018 The College Boardwwwcollegeboardorg
ACKNOWLEDGMENTS
Anthony LaRosa and Edward Lu provided critical support for this publication We also benefited from comments from Dean Bentley Jessica Howell Michael Hurwitz and Melanie Storey Sandy Alexander provided expert graphic design work The publication would not have been possible without the cooperation and support of many individuals at the College Board including Connie Betterton Robert Gordon Karen Lanning Alejandro Leal George Lilas Robert Majoros Jose Rios and Matt Walsh
We thank all of those who contributed to the data collection for this publication especially Charlotte Etier of the National Association of Student Financial Aid Administrators (NASFAA) and Mike Solomon of the Illinois Student Aid Commission
36
collegeboardorgtrendscollegeboardorg
00947-055
October 2018
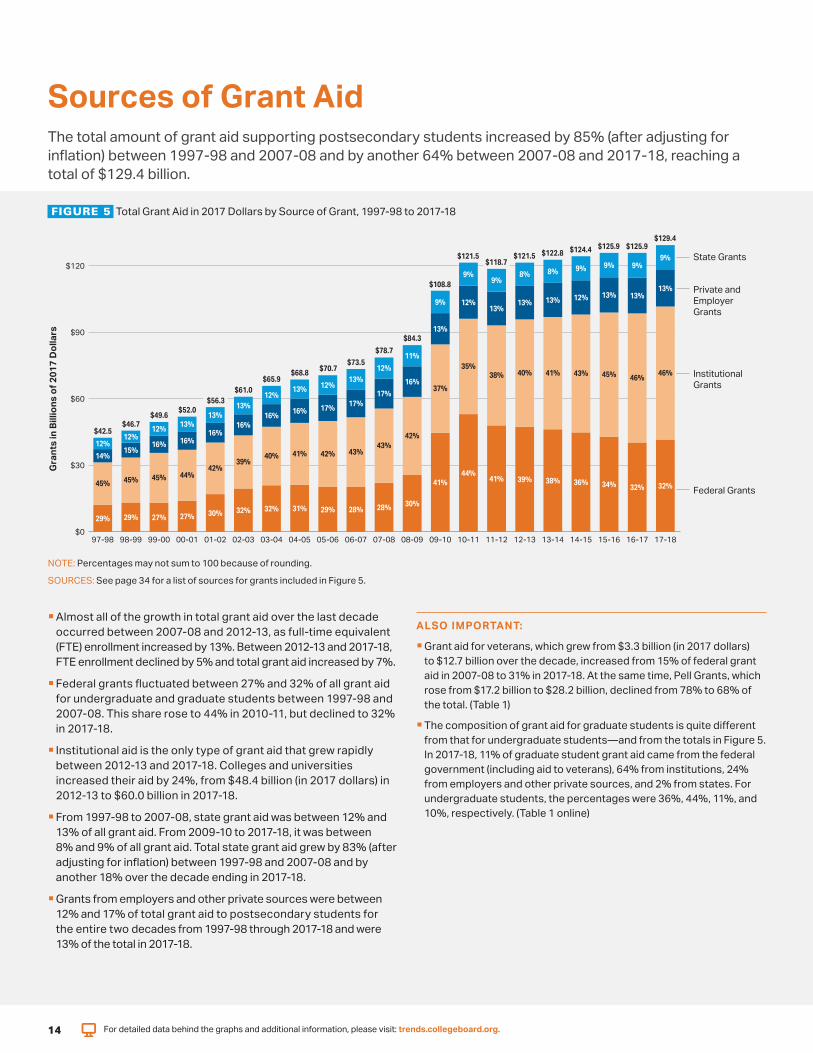
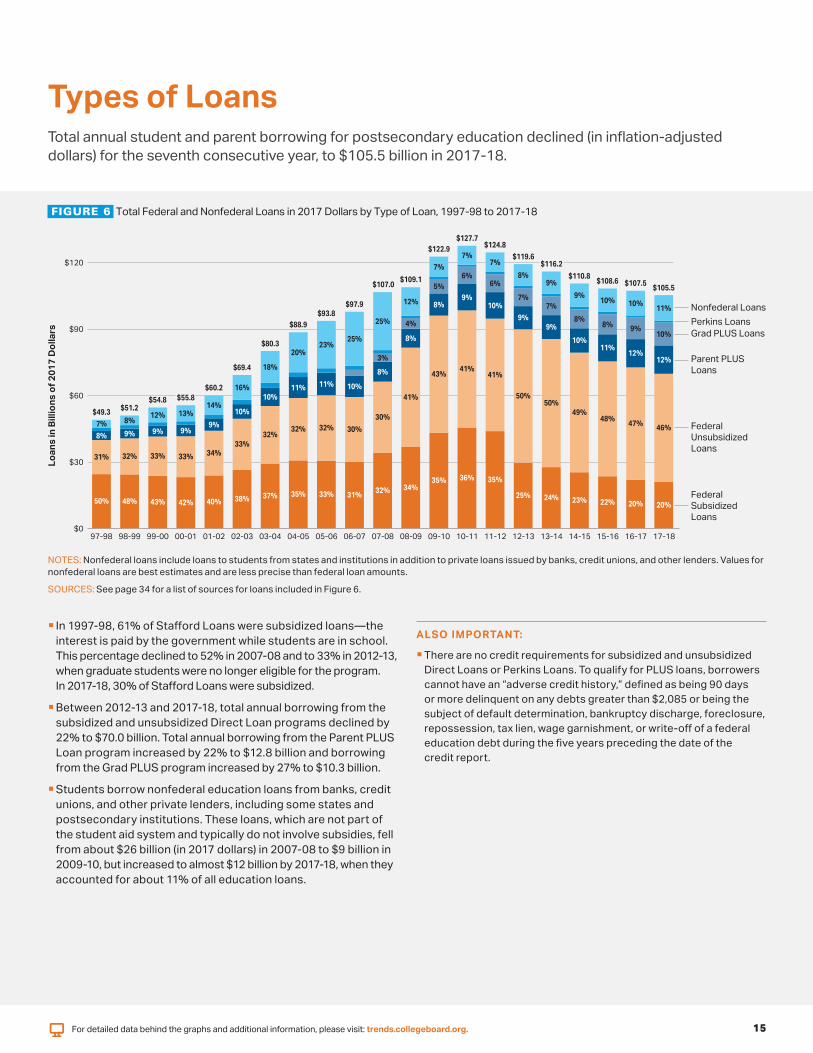
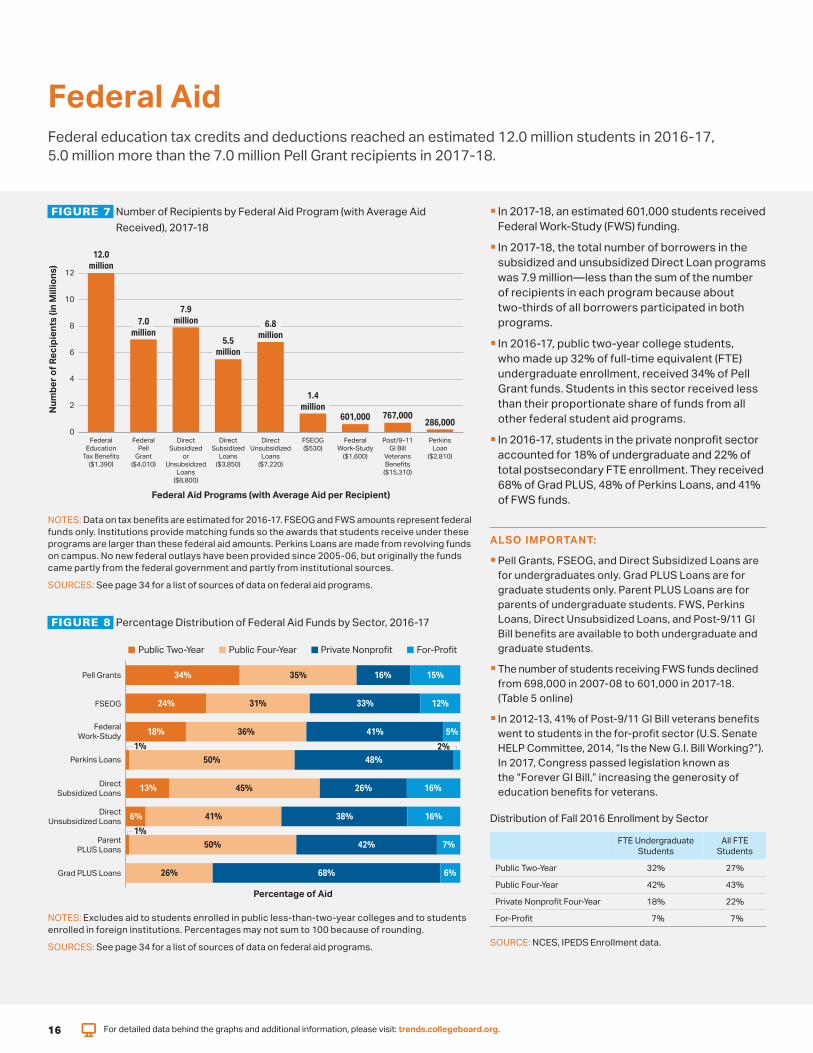
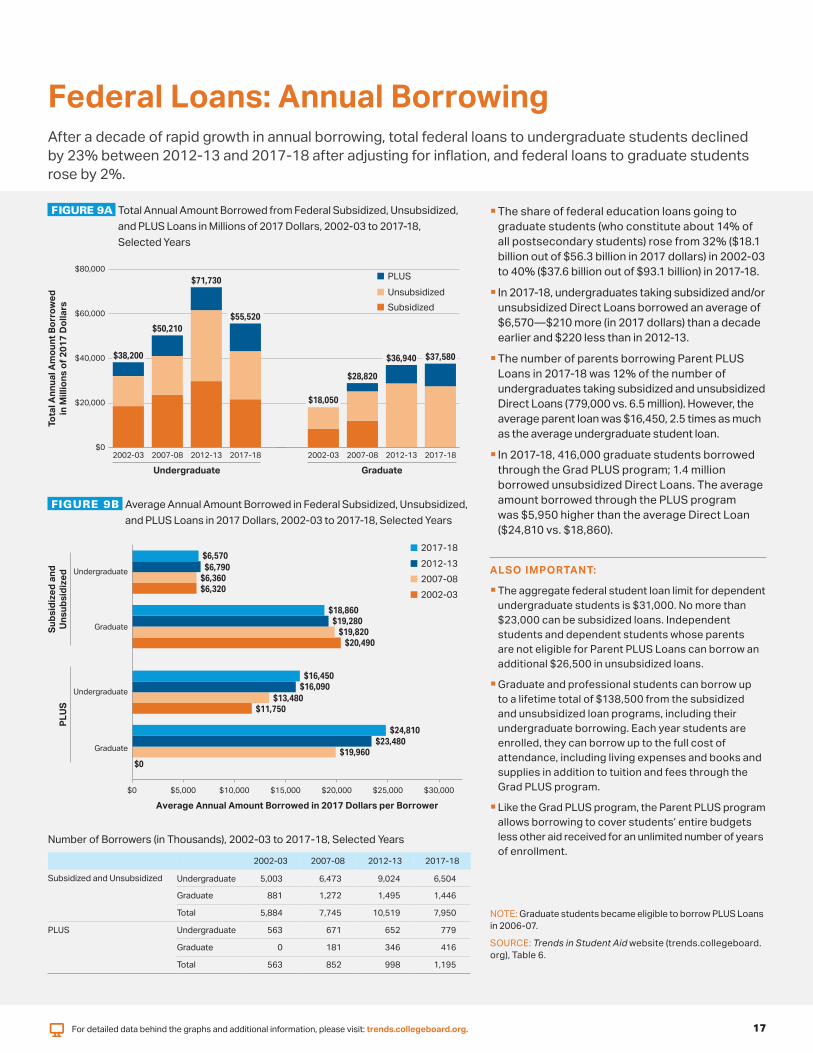
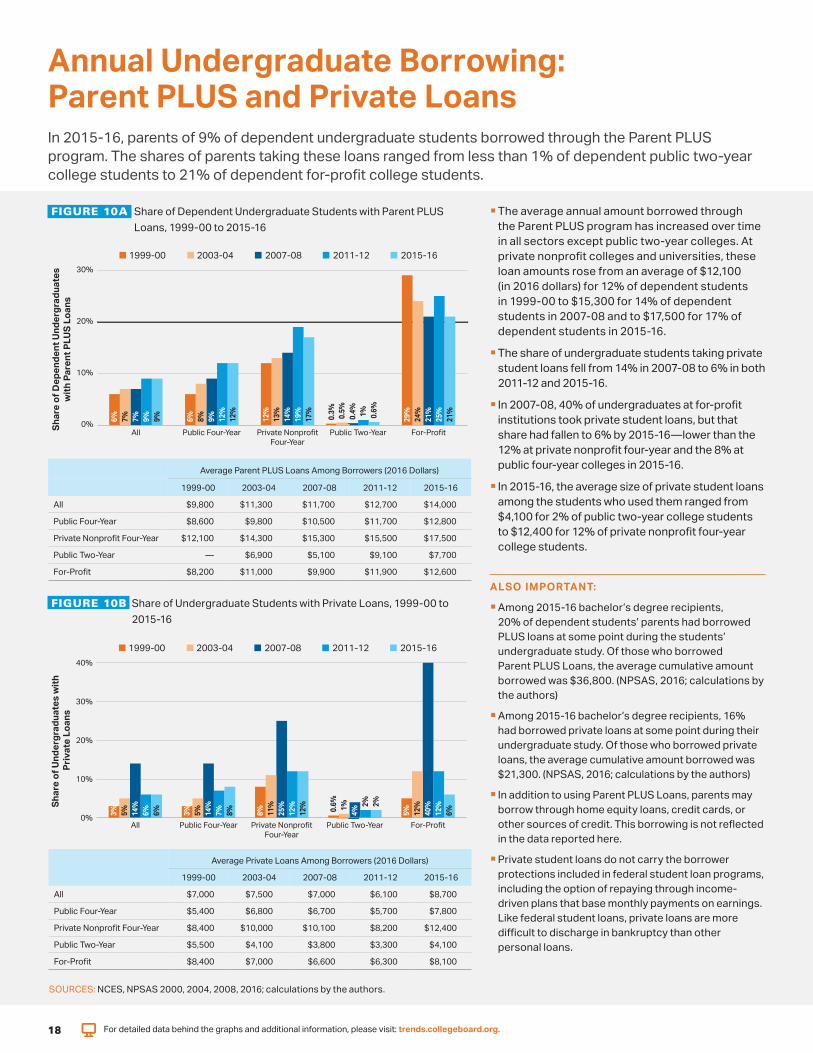
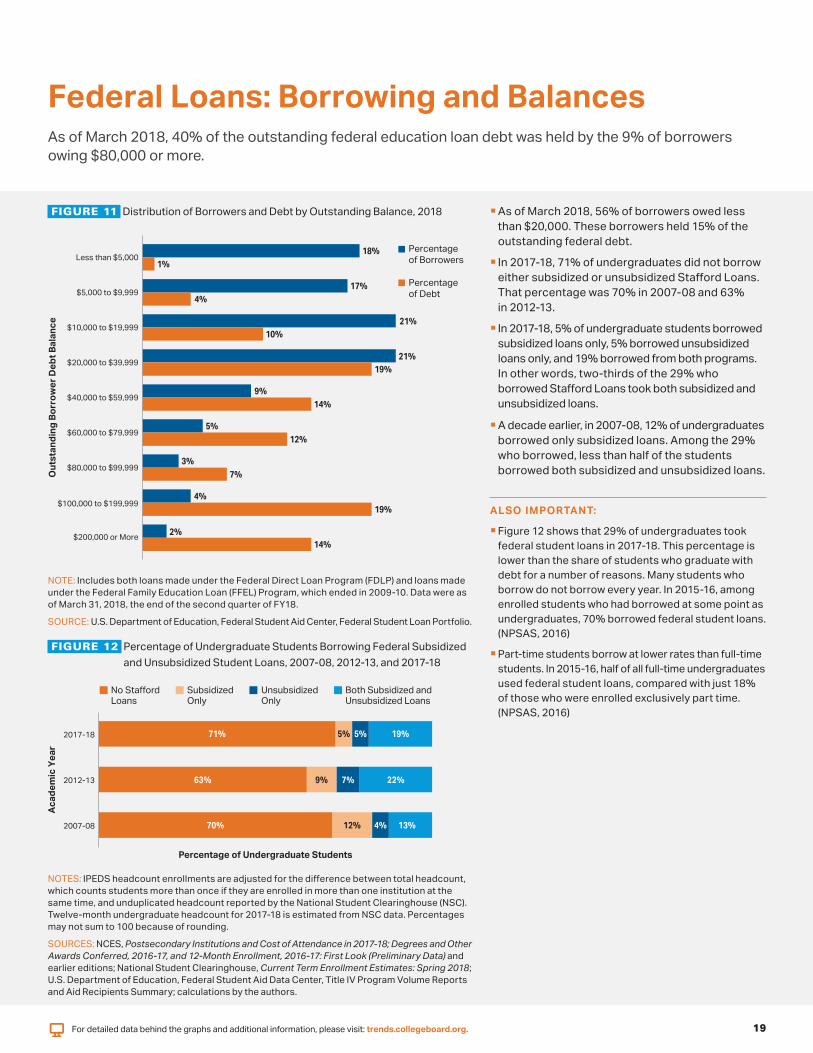
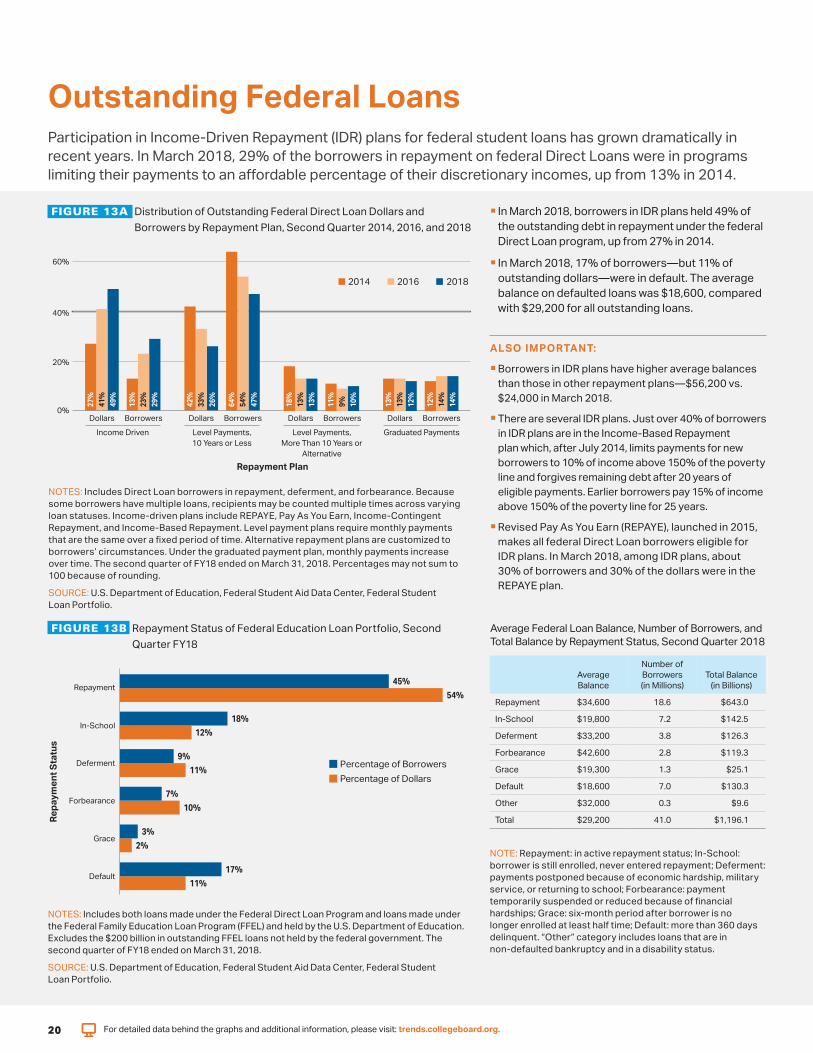
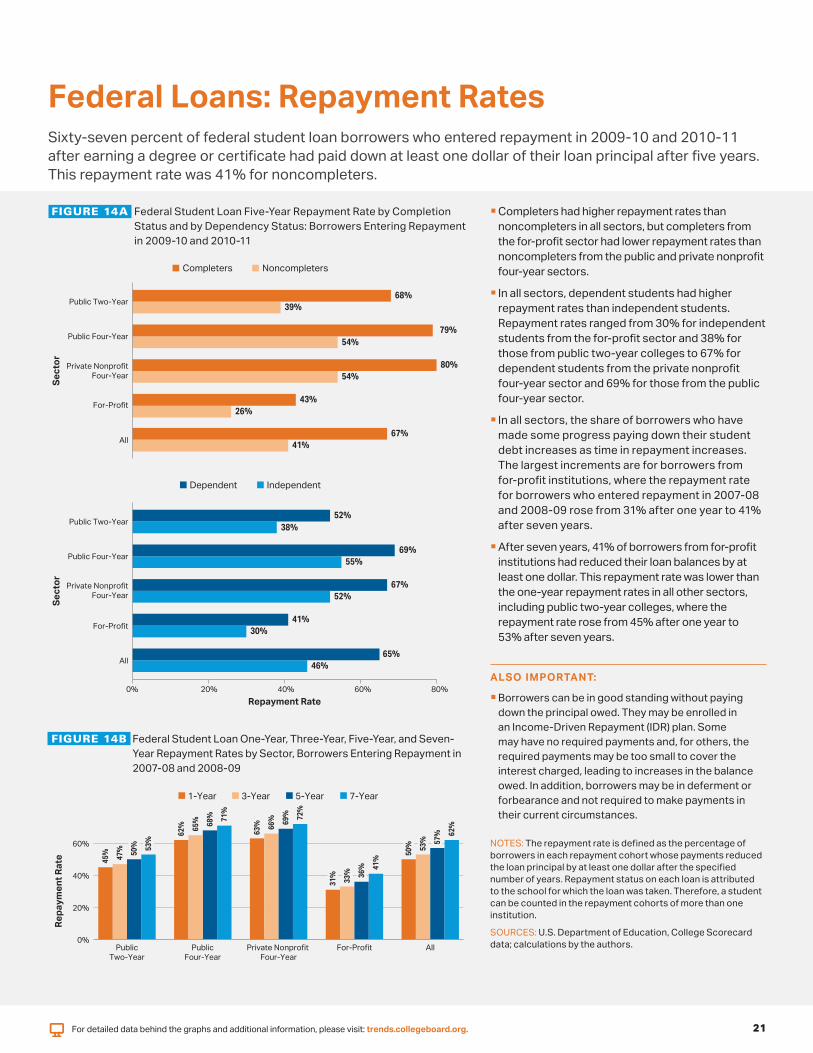
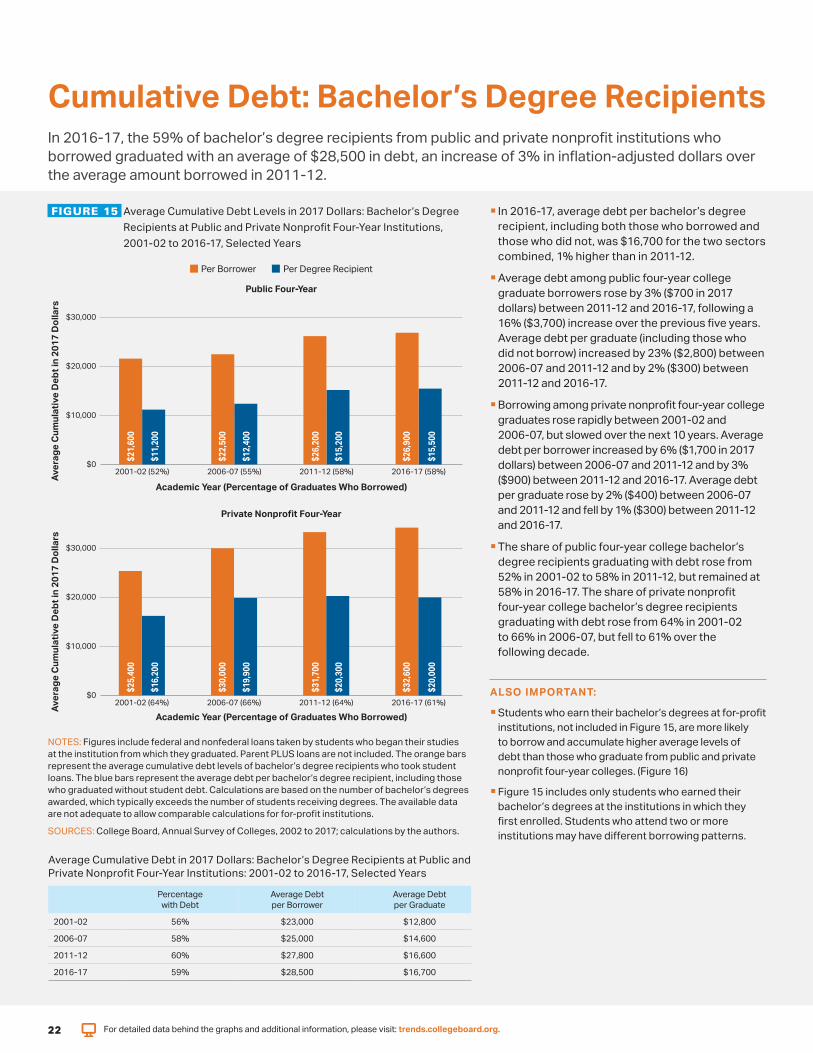
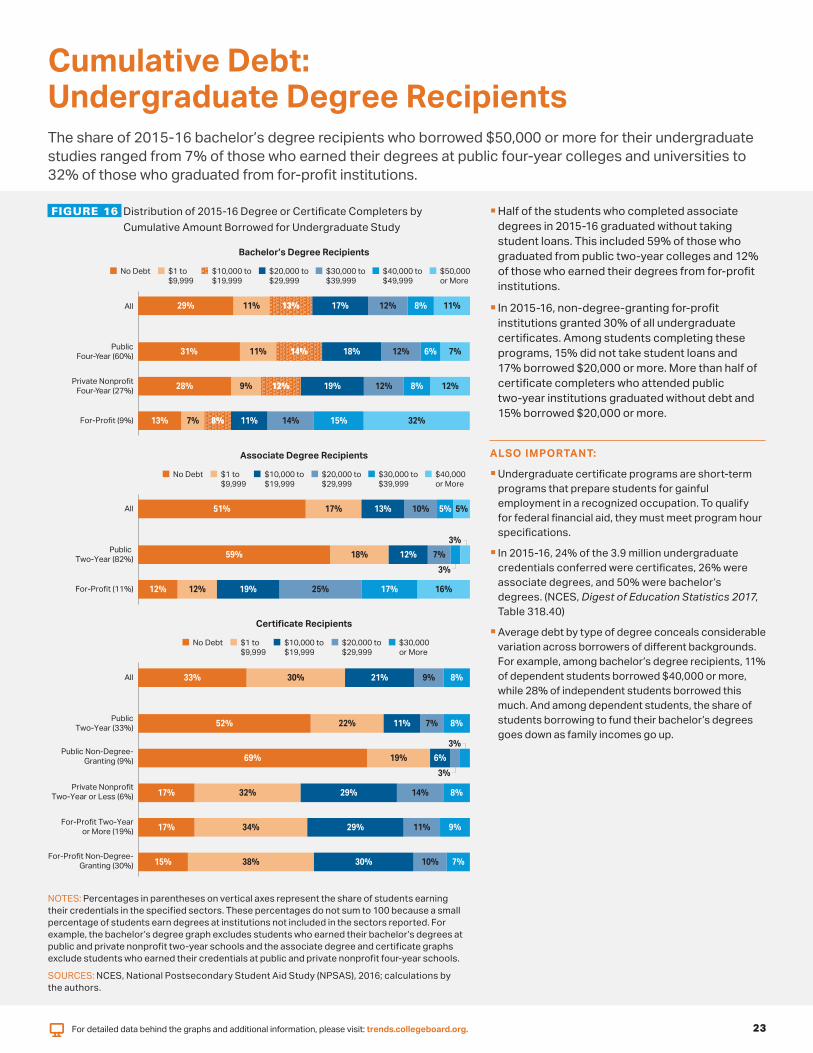
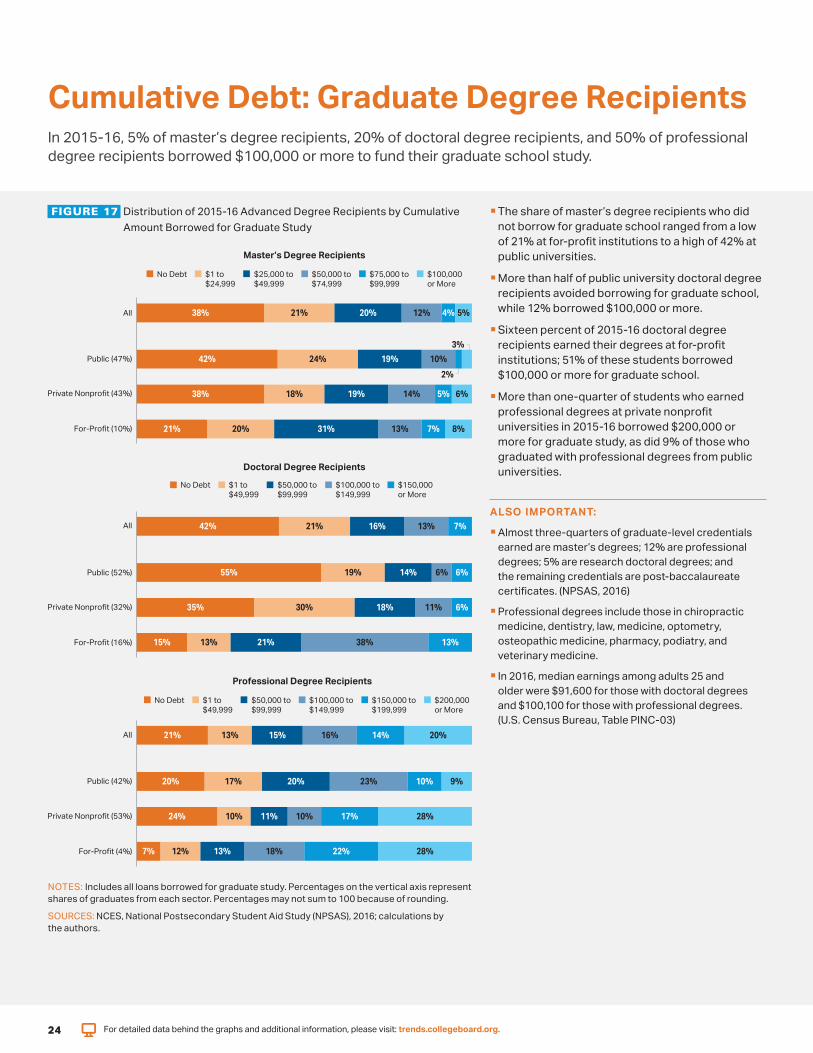
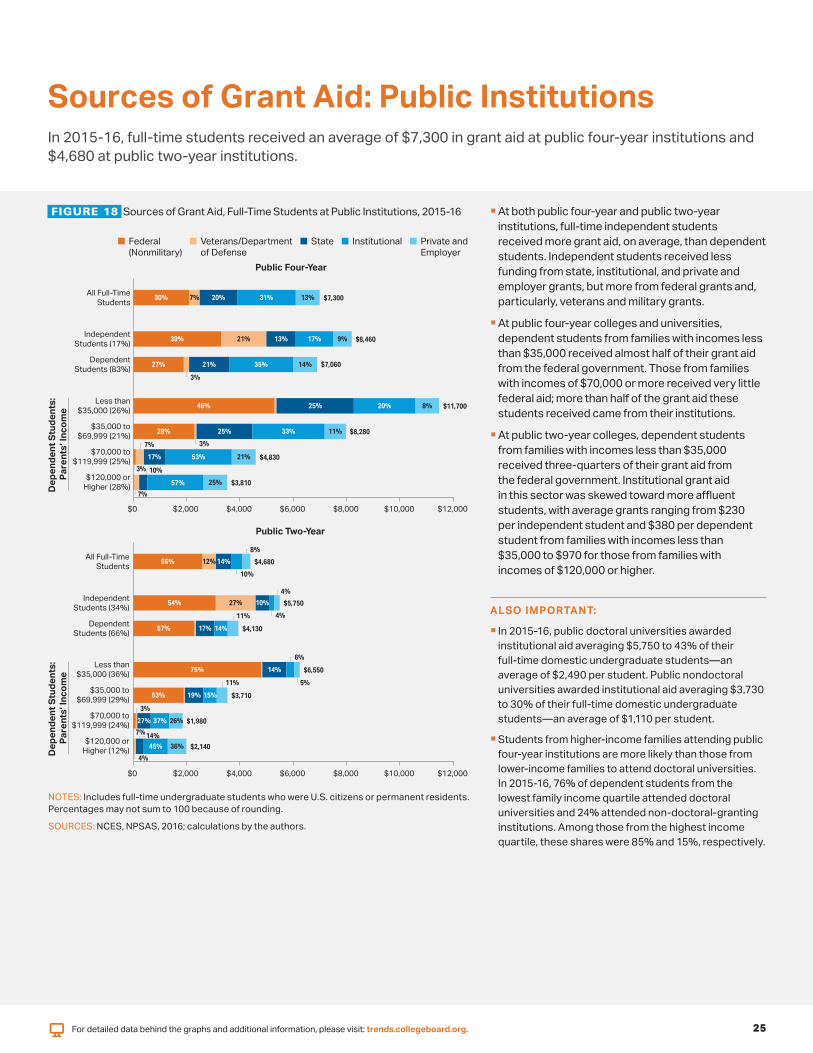
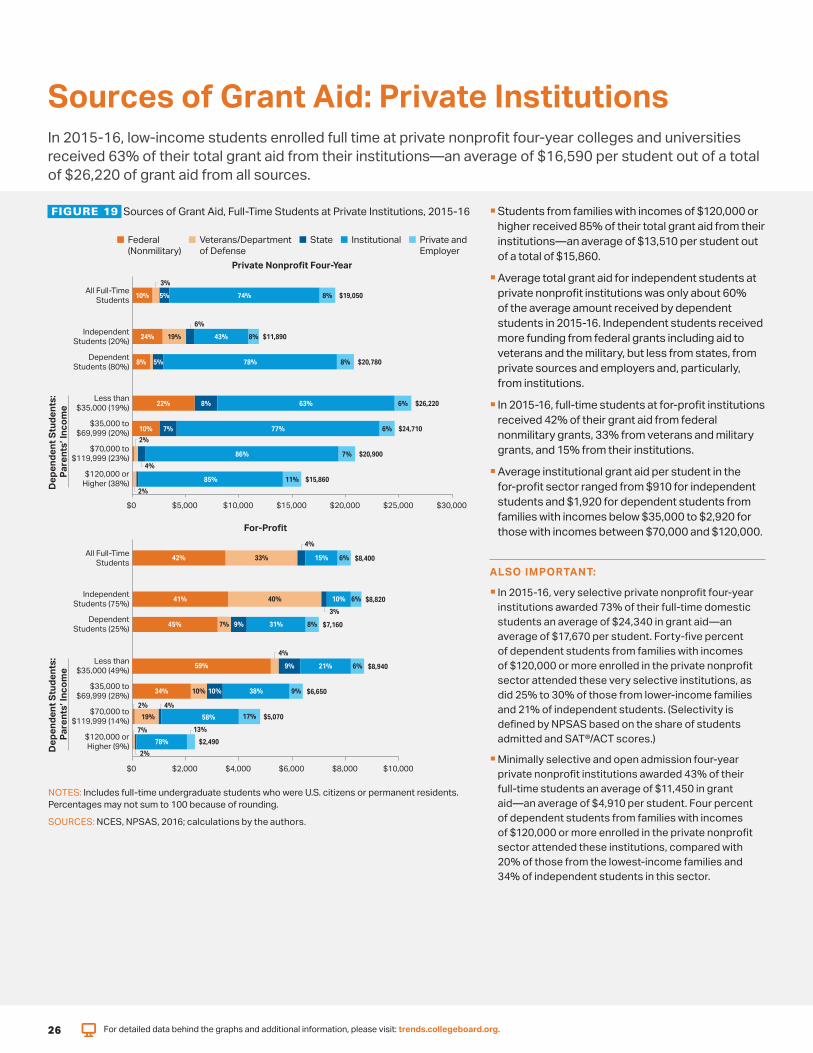
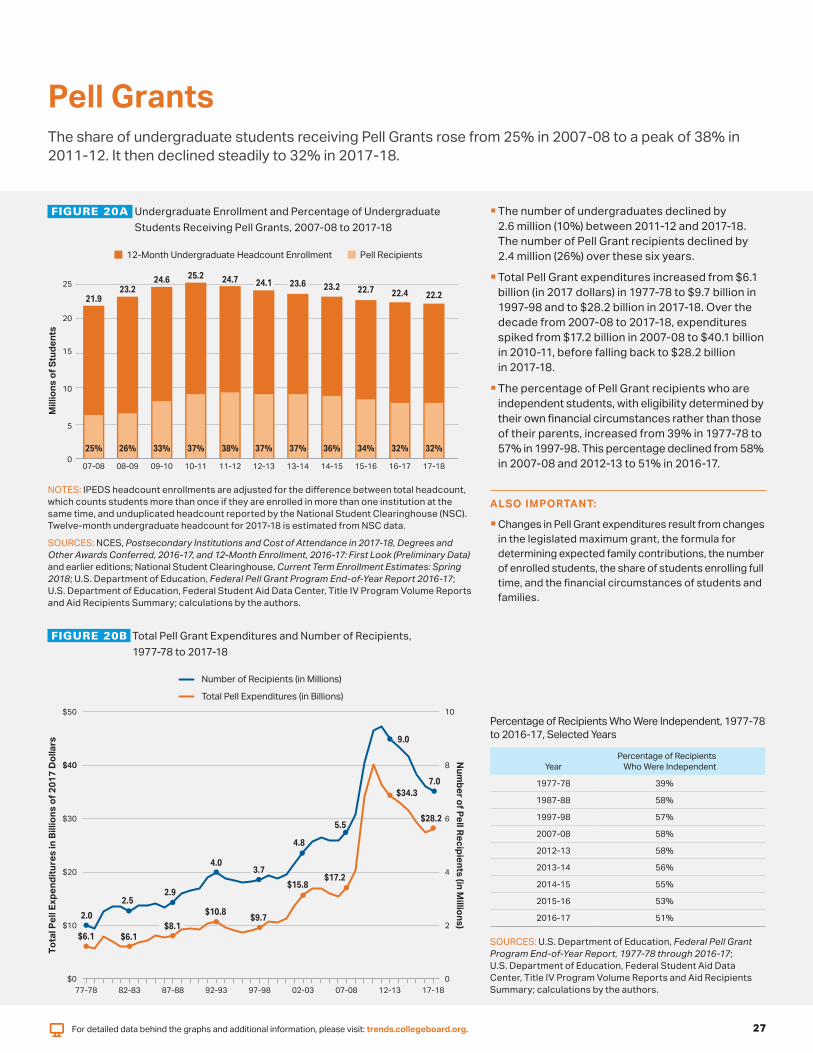
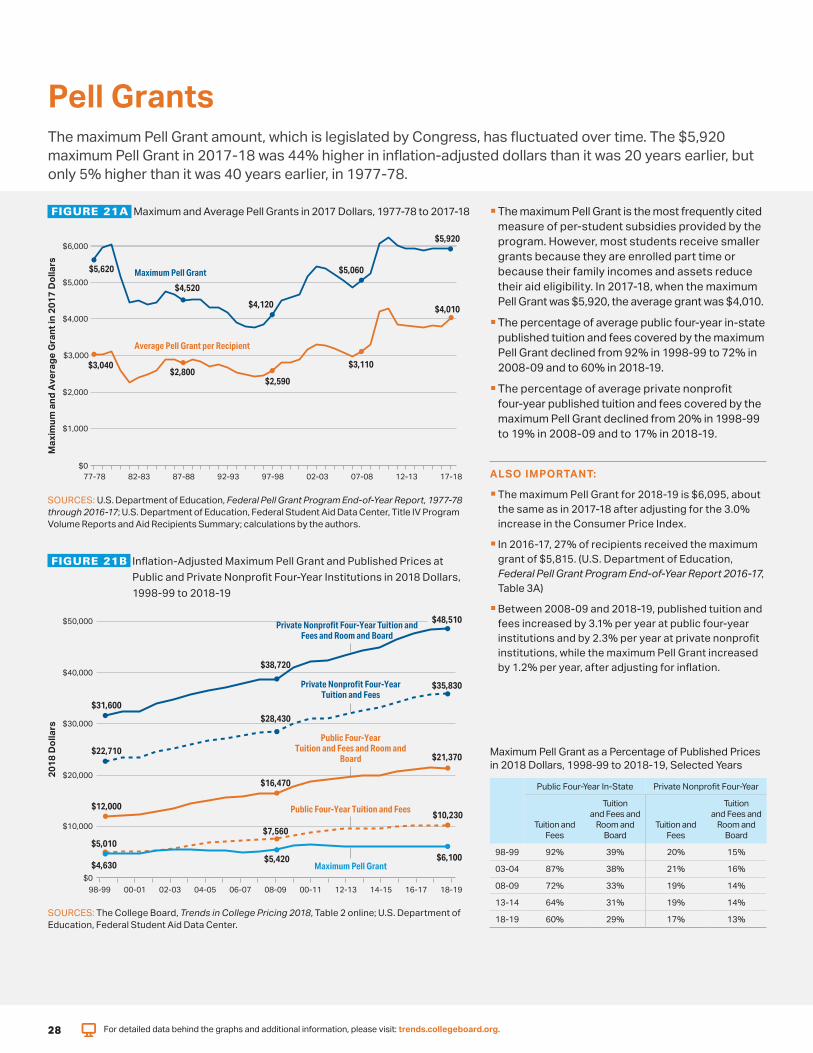
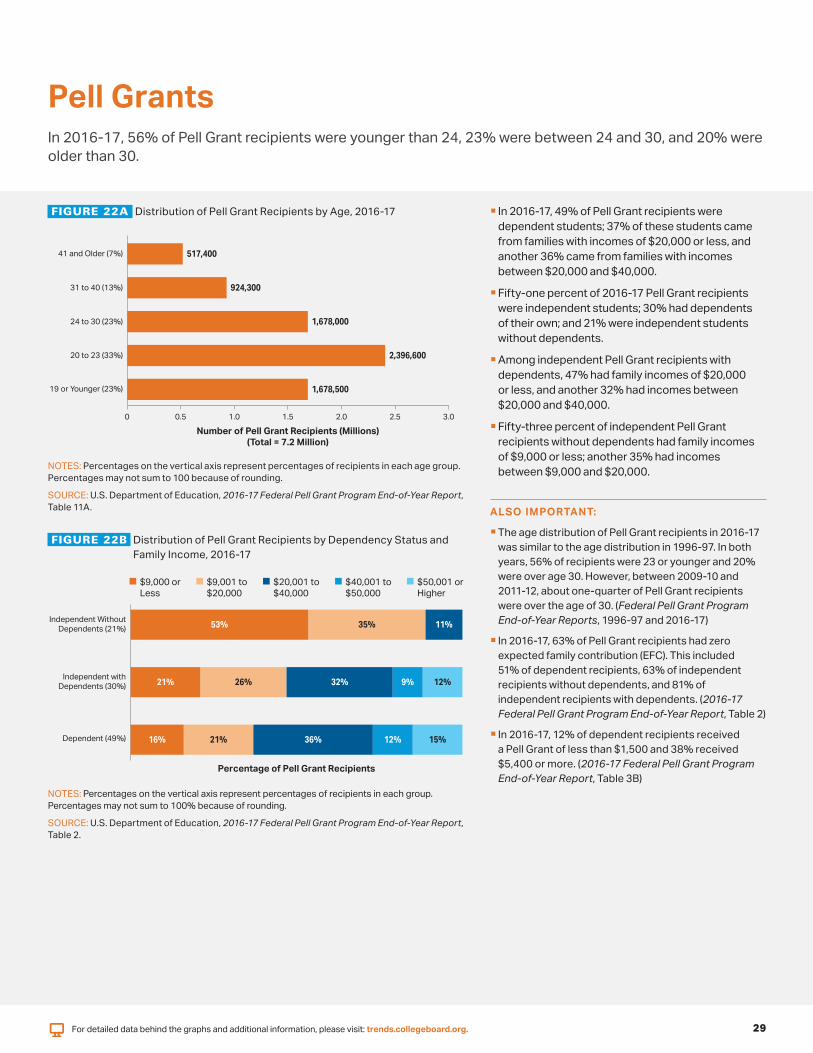
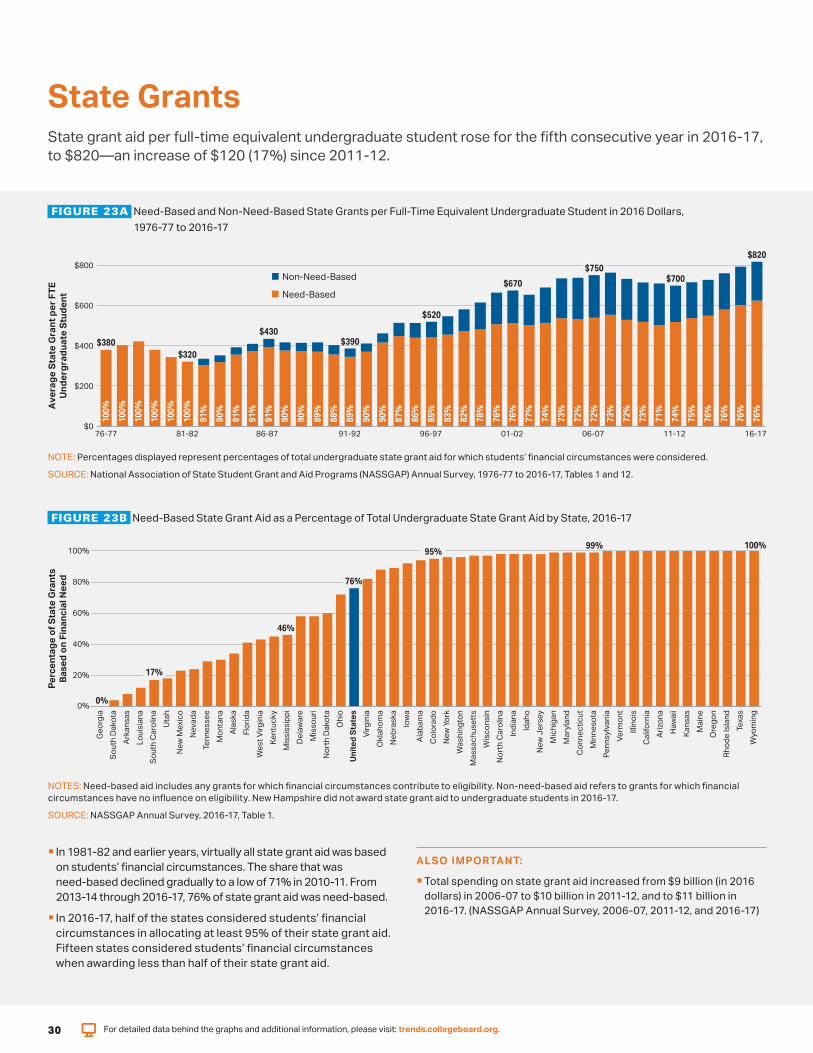
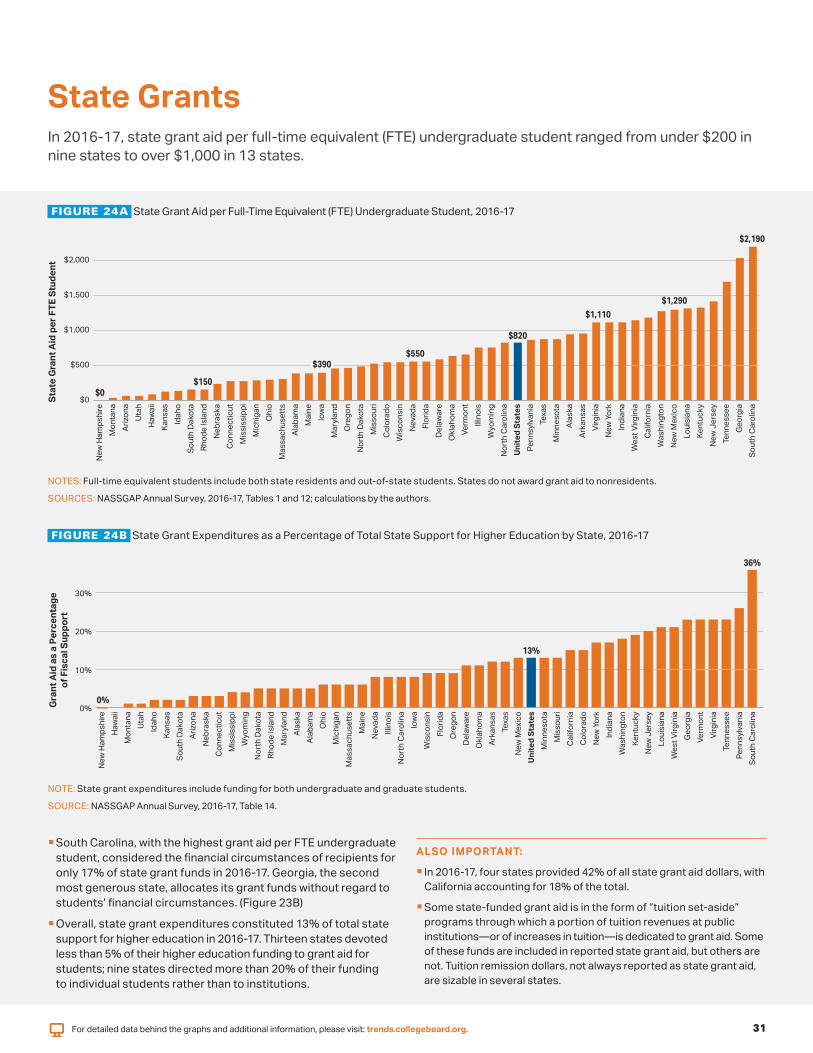
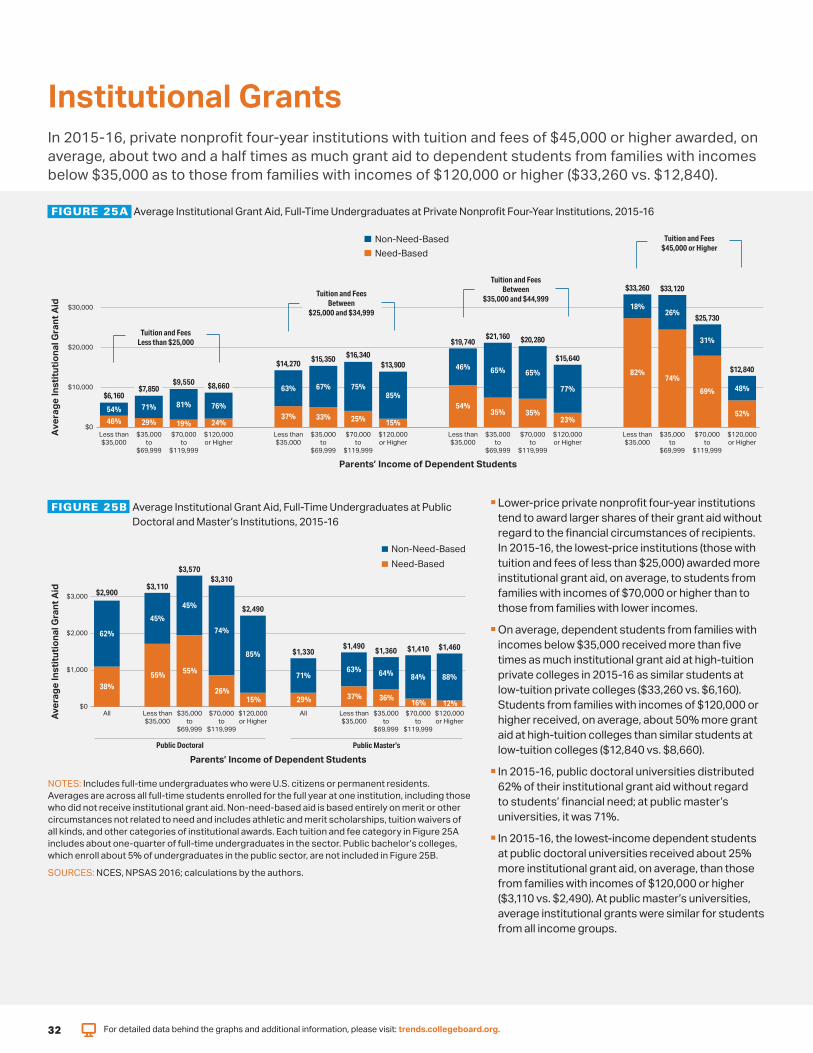
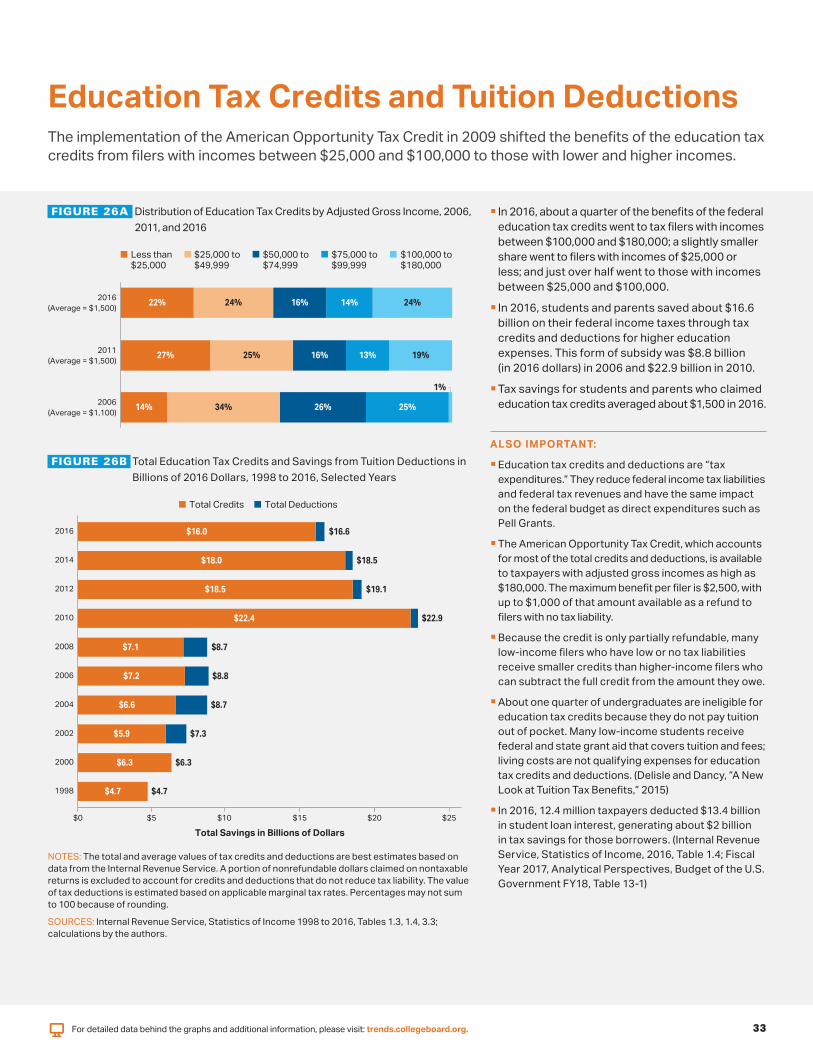
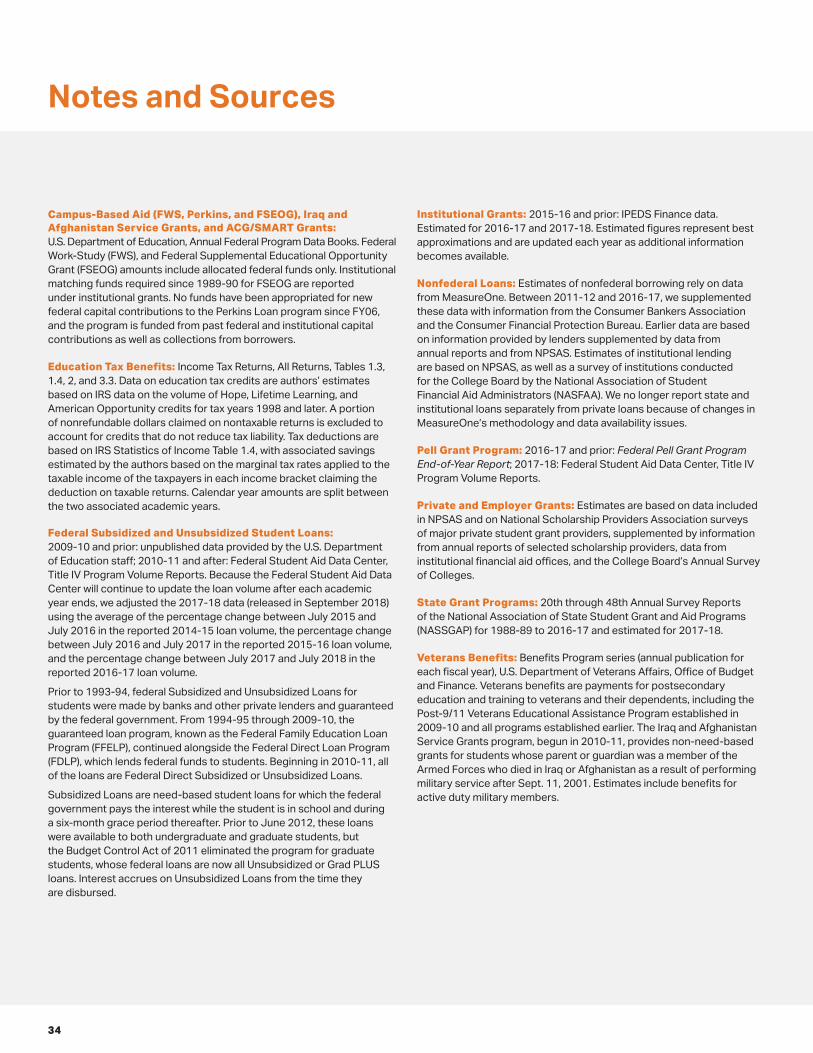

36
collegeboardorgtrendscollegeboardorg
00947-055
October 2018