Embed Size (px)
Citation preview

Trend Following & Mean Reverting Indicators: How to Use, When to Use, and How to Use Together
WILL GEISDORF, CMT Global Strategist
January 7, 2015
Please see important disclosures at the end of this report. www.ndr.com | Periodical

Rule #1 at Ned Davis Research Don’t Fight the Tape!
2
“The Trend is Your Friend”

3
“I always come back to trend-following indicators because if a big move is coming, they pretty much guarantee losses will be cut short and profits can run. In other words, they have a built-in stop-loss.”
-Ned Davis (Institutional Hotline, 2/13/2012)
Simple trend-following strategy

4
The word “whipsaw” comes from the timber industry where a long, thin, two-man wood saw would often get caught in a log, if not properly handled, and whip the sawyers back and forth without cutting the wood
and subjecting them to “two damaging and usually opposing forces at the same time”.
Simple trend-following strategy failed in secular bear
of the 1970s

What to do when there isn’t a trend to befriend?
Use the following types of indicators:
Oscillators
Mean-Reverting Indicators
Overbought/Oversold Indicators
Sentiment
5

6
Mean-reverting indicators tend to have a high percentage of profitable trades. However, in a trending market they oftentimes let losses run and cut profits short.
A lot of winning trades
Lousy performance

7
In a directionless market, like the 1970s secular bear, mean-reverting indicators tend to outperform trend-following systems.
A lot of winning trades
Decent Performance

Combing Trend-Following & Mean-Reverting Indicators
Adaptive Trading Model
Stand alone Trend-Following Model
Stand alone Mean-Reverting Model
Strength of Trend Composite to determine whether the market is trending or churning sideways
8

9
Strength of Trend Concept #1
Welles Wilder’s Average Directional Index was created to measure trend strength without regard to trend direction.

10
Strength of Trend Concept #2 Efficiency ratio was developed by Perry Kaufman as a way of measuring noise in the market. It compares the absolute
change in price over a set period to the sum of the absolute daily changes over the same period.
11
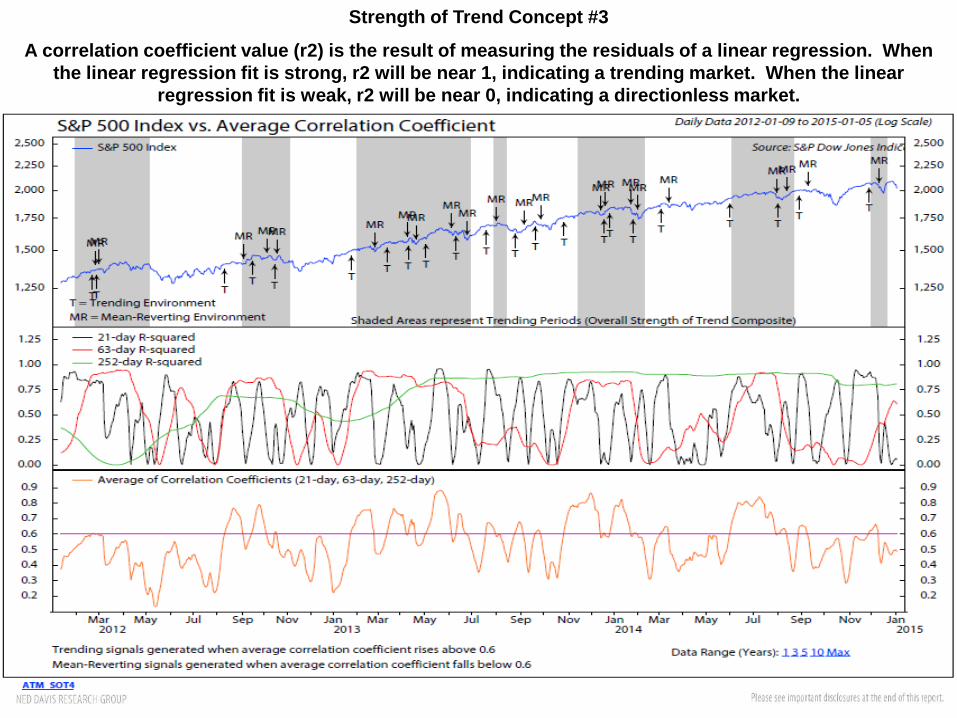
Strength of Trend Concept #3
A correlation coefficient value (r2) is the result of measuring the residuals of a linear regression. When the linear regression fit is strong, r2 will be near 1, indicating a trending market. When the linear
regression fit is weak, r2 will be near 0, indicating a directionless market.

12
Strength of Trend Concept #4 A bandpass is an adjective that describes a type of filter or filtering process. John Ehlers and Ric Way apply the idea of a
bandpass filter to equity markets in the March 2010 issue of Technical Analysis of STOCKS & COMMODITIES. They empirically decompose market data into a cycle component and a trend component.

13
Strength of Trend Composite is a diffusion model based on signals from ADX, Efficiency Ratio, R2, and Bandpass Filter indicators.
Majority of indicators trending
Majority of indicators mean-
reverting

14
Signal from Strength of Trend Composite determines whether the model follows the message from our trend-following or mean-reverting model.
Strength of Trend Composite
Mean-Reverting Model
Trend-Following Model
Bullish Bullish Bearish Bearish Neutral

Trend-Following Model
Point & Figure
Adaptive Moving Average
Triple Exponential Moving Average
True Strength Index
15

16
Trend-Following Concept #1
Simple Point & Figure Trading Strategy

17
Trend-Following Concept #2
Adaptive moving average is based on the concept that a noisy market requires a slower trend than a quiet market. This means the trendline should lag further behind a noisy market to avoid whipsaws.

18
Trend-Following Concept #3
Changes in a moving average can be abrupt based on the size of the values entering and leaving the period being smoothed. Applying a smoothing three times increases importance on the middle values.

19
Trend-Following Concept #4
The True Strength Index (TSI) is based on a smoothed one-period rate of change. William Blau referred to this concept as using momentum as a more sensitive proxy for price.

20
Trend-Following Model is a diffusion index based on the four indicators just discussed.
Majority of trend-following indicators bearish
Majority of trend-following indicators bullish

Mean-Reverting Model
Overbought/Oversold
Bullish & Bearish Divergence
Excessive Optimism/Pessimism
21

22
Mean-Reverting Concept #1
Calculate the % of stocks trading below lower Bollinger Band. Identify when the % is at an extreme. Look for reversal from extreme level to generate a short-term buy signal.

23
Mean-Reverting Concept #2
Calculate the % of stocks on sell signals using a very sensitive P&F rule. Identify when the % reaches an extreme. Look for reversal from extreme level to generate short-term buy signal.

24
Mean-Reverting Concept #3
My attempt to quantify divergences between price and momentum.
Bullish Divergence

25
Calculate slope of two-month regressions for price and 30-day momentum.
Normalize slope readings by calculating 30-day stochastic of each. Compare stochastic readings.
Bullish Divergence

26
Mean-Reverting Concept #4 SKEW measures perceived tail risk, comparing the price OTM puts relative to OTM calls. Large declines in SKEW signal
complacency. Look for reversals from extreme complacency to trigger short-term sell signals.

27
Mean-Reverting Concept #5
Short-term changes in VIX can be used as a sentiment measure. A large short-term increase in VIX is a sign that implied volatility is increasing. This indicates pessimism/fear amongst investors.

28
Mean-Reverting Model a diffusion of five concepts and 10 total indicators.
Five indicators produce buy or neutral signals.
Five indicators produce sell or neutral signals.
Market reversing from oversold conditions
Market reversing from overbought conditions

29
Current State of the Model
Trend-Following Model is bullish. Mean-Reverting Model is neutral.
Strength of Trend Composite signaling a mean-reverting environment. Model is neutral.

30
Model has outperformed Buy/Hold over past five years with less risk.

SUMMARY Trend-Following & Mean-Reverting indicators are both
valuable tools for investors
Several technical tools available to help identify whether the market is trending or churning
Adaptive Trading Model tries to incorporate both types of indicators into a single trading system
Potential Model Enhancement:
Improve optimization technique used to choose Strength of Trend indicators
Look for additional indicators to help determine market environment (Janus Factor, Performance of various Quant Factors)
31

Shameless Plug Buy the latest edition of “Being Right or Making Money”
32