Embed Size (px)
Citation preview
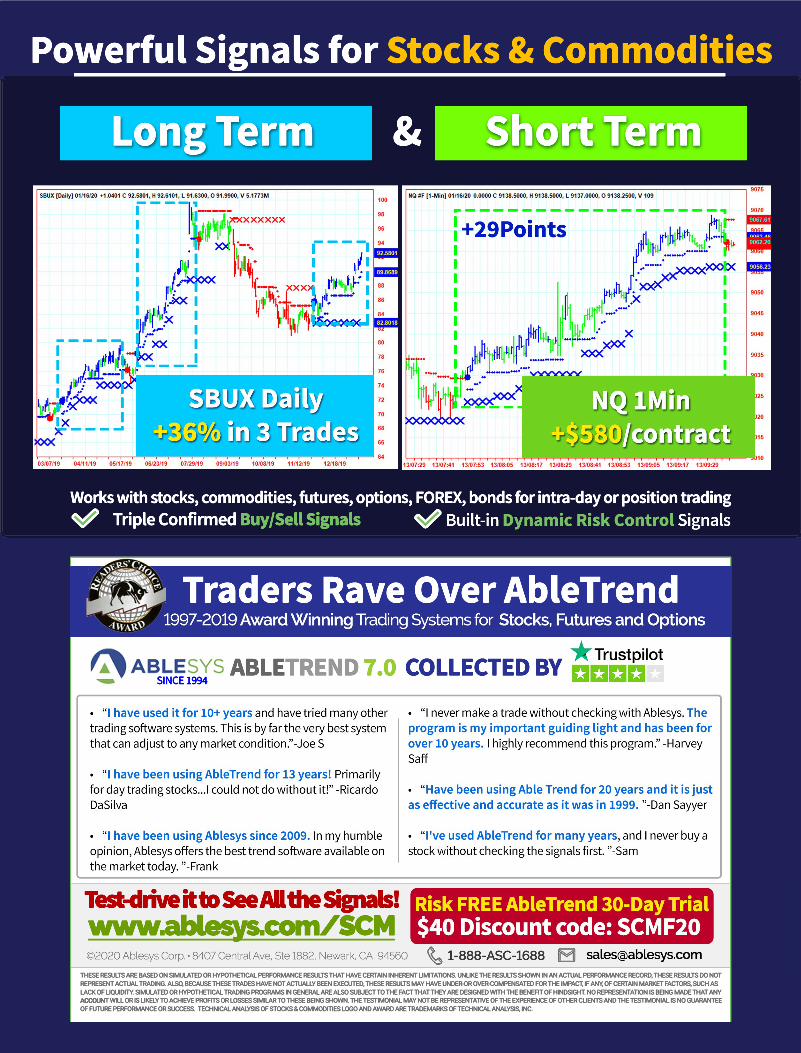
Powerful Signals for Stocks & Commodities
Traders Rave Over AbleTrend
ABLETREND 7.0 COLLECTED BYSINCE 1994
Test-drive it to See All the Signals!
Works with stocks, commodities, futures, options, FOREX, bonds for intra-day or position tradingTriple Confirmed Buy/Sell Signals
Long Term Short Term&
THESE RESULTS ARE BASED ON SIMULATED OR HYPOTHETICAL PERFORMANCE RESULTS THAT HAVE CERTAIN INHERENT LIMITATIONS. UNLIKE THE RESULTS SHOWN IN AN ACTUAL PERFORMANCE RECORD, THESE RESULTS DO NOT REPRESENT ACTUAL TRADING. ALSO, BECAUSE THESE TRADES HAVE NOT ACTUALLY BEEN EXECUTED, THESE RESULTS MAY HAVE UNDER-OR OVER-COMPENSATED FOR THE IMPACT, IF ANY, OF CERTAIN MARKET FACTORS, SUCH AS LACK OF LIQUIDITY. SIMULATED OR HYPOTHETICAL TRADING PROGRAMS IN GENERAL ARE ALSO SUBJECT TO THE FACT THAT THEY ARE DESIGNED WITH THE BENEFIT OF HINDSIGHT. NO REPRESENTATION IS BEING MADE THAT ANY ACCOUNACCOUNT WILL OR IS LIKELY TO ACHIEVE PROFITS OR LOSSES SIMILAR TO THESE BEING SHOWN. THE TESTIMONIAL MAY NOT BE REPRESENTATIVE OF THE EXPERIENCE OF OTHER CLIENTS AND THE TESTIMONIAL IS NO GUARANTEE OF FUTURE PERFORMANCE OR SUCCESS. TECHNICAL ANALYSIS OF STOCKS & COMMODITIES LOGO AND AWARD ARE TRADEMARKS OF TECHNICAL ANALYSIS, INC.
17 is HereFeaturing the NEW OptionScope™
and QuoteCenter™ PowerToolsDiscover the latest features at metastock.com/whats-new
Because you can never have
too many PowerTools
MS17 TASC AD-powertools.indd 1 11/12/19 11:17 AM
Stocks & Commodities V. 31:8 (44-47): System Design Software, Part 2 by Sunny Harris
Copyright © Technical Analysis Inc.
In Part 1 of this series on system de-sign software, we looked at AmiBroker and Adaptrade. Here in Part 2, we’ll look at two more products.
by Sunny Harris
esigning your own trading system can give you a unique edge in your trading. Software with good fea-tures can certainly help the design
process along. Fortunately, you have many choices today when it comes to selecting system design software. Most offer similar features, but each has its subtle differences. In this article series in which I take a look at different system design software, it is my goal to bring out the unique features of each of the products I consider. In this, the second part, I will discuss eSignal and Trade Navigator.
eSignal, an interactive Data company3955 Point Eden WayHayward, CA 94545Phone: 510 266-6000Fax: 510 266-6100Internet: www.esignal.com
In the days when I was newly in search of real-time data, it was eSignal I settled on. Back then, data was transmitted over the airways on a radio signal dedicated to data, and I used what was then called Lotus Signal. I remember having a huge television-type antenna on my roof, with wires coming down the side of my house and into my trading room. It always seemed like when I was in the middle of a crucial trade, the antenna would need adjustment, and I would have my kids climb the roof while we would yell back and forth, “Turn it this way, turn it that way, stop! You’ve got it.” I’m sure the neighbors thought I was nuts. For the times when I was traveling,
D
ProDuct revIew
I carried a transistor radio-sized hand-held device called QuoTrek on which I received my real-time quotes — no charts, just numbers. It was way ahead of its time, and only the coolest traders had one. I also remember paying thousands of dollars each month for my data. Thank goodness those days are gone, and now data is all but free. It’s a lot easier to make a profit when your overhead isn’t so high.
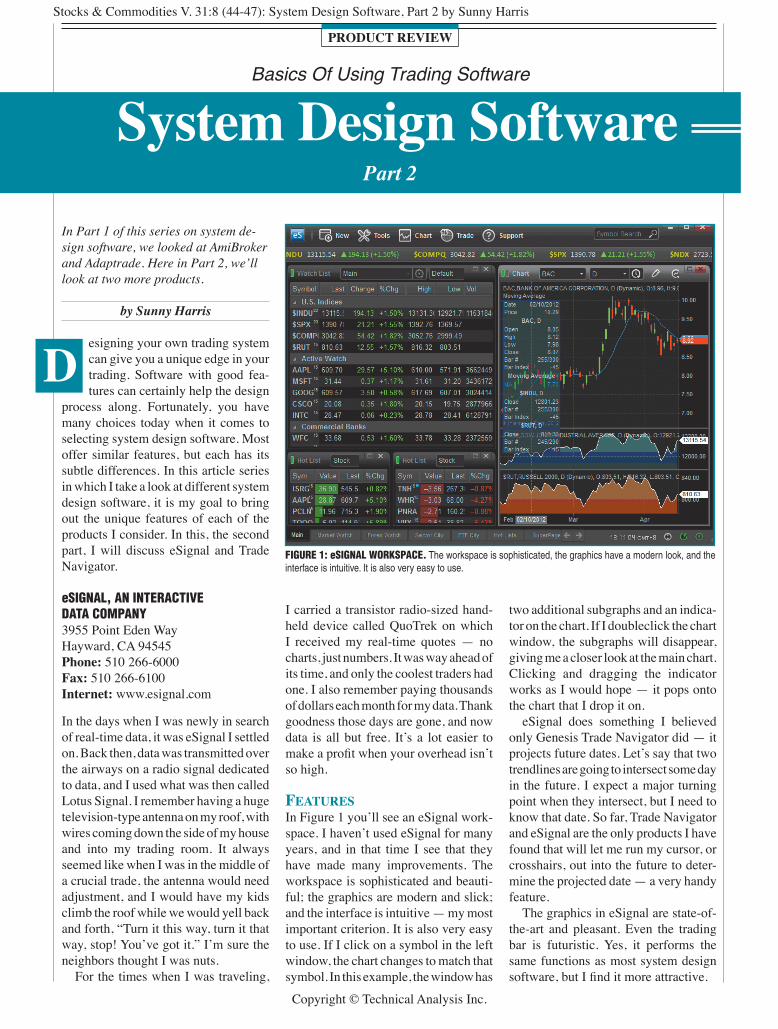
FeaturesIn Figure 1 you’ll see an eSignal work-space. I haven’t used eSignal for many years, and in that time I see that they have made many improvements. The workspace is sophisticated and beauti-ful; the graphics are modern and slick; and the interface is intuitive — my most important criterion. It is also very easy to use. If I click on a symbol in the left window, the chart changes to match that symbol. In this example, the window has
two additional subgraphs and an indica-tor on the chart. If I doubleclick the chart window, the subgraphs will disappear, giving me a closer look at the main chart. Clicking and dragging the indicator works as I would hope — it pops onto the chart that I drop it on. eSignal does something I believed only Genesis Trade Navigator did — it projects future dates. Let’s say that two trendlines are going to intersect some day in the future. I expect a major turning point when they intersect, but I need to know that date. So far, Trade Navigator and eSignal are the only products I have found that will let me run my cursor, or crosshairs, out into the future to deter-mine the projected date — a very handy feature. The graphics in eSignal are state-of-the-art and pleasant. Even the trading bar is futuristic. Yes, it performs the same functions as most system design software, but I find it more attractive.
Basics Of Using Trading Software
System Design SoftwarePart 2
FigUre 1: eSignal WorKSpace. The workspace is sophisticated, the graphics have a modern look, and the interface is intuitive. It is also very easy to use.
Stocks & Commodities V. 31:8 (44-47): System Design Software, Part 2 by Sunny Harris
Copyright © Technical Analysis Inc.
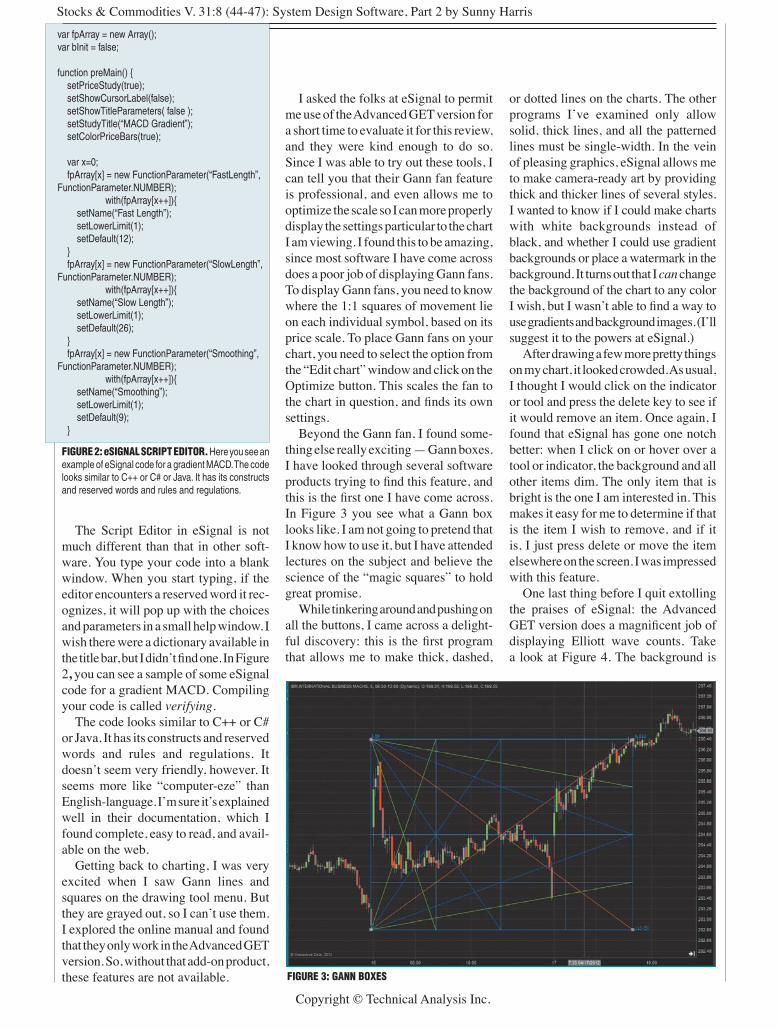
I asked the folks at eSignal to permit me use of the Advanced GET version for a short time to evaluate it for this review, and they were kind enough to do so. Since I was able to try out these tools, I can tell you that their Gann fan feature is professional, and even allows me to optimize the scale so I can more properly display the settings particular to the chart I am viewing. I found this to be amazing, since most software I have come across does a poor job of displaying Gann fans. To display Gann fans, you need to know where the 1:1 squares of movement lie on each individual symbol, based on its price scale. To place Gann fans on your chart, you need to select the option from the “Edit chart” window and click on the Optimize button. This scales the fan to the chart in question, and finds its own settings. Beyond the Gann fan, I found some-thing else really exciting — Gann boxes. I have looked through several software products trying to find this feature, and this is the first one I have come across. In Figure 3 you see what a Gann box looks like. I am not going to pretend that I know how to use it, but I have attended lectures on the subject and believe the science of the “magic squares” to hold great promise. While tinkering around and pushing on all the buttons, I came across a delight-ful discovery: this is the first program that allows me to make thick, dashed,
var fpArray = new Array();var bInit = false;
function preMain() { setPriceStudy(true); setShowCursorLabel(false); setShowTitleParameters( false ); setStudyTitle(“MACD Gradient”); setColorPriceBars(true);
var x=0; fpArray[x] = new FunctionParameter(“FastLength”, FunctionParameter.NUMBER); with(fpArray[x++]){ setName(“Fast Length”); setLowerLimit(1); setDefault(12); } fpArray[x] = new FunctionParameter(“SlowLength”, FunctionParameter.NUMBER); with(fpArray[x++]){ setName(“Slow Length”); setLowerLimit(1); setDefault(26); } fpArray[x] = new FunctionParameter(“Smoothing”, FunctionParameter.NUMBER); with(fpArray[x++]){ setName(“Smoothing”); setLowerLimit(1); setDefault(9); }
or dotted lines on the charts. The other programs I’ve examined only allow solid, thick lines, and all the patterned lines must be single-width. In the vein of pleasing graphics, eSignal allows me to make camera-ready art by providing thick and thicker lines of several styles. I wanted to know if I could make charts with white backgrounds instead of black, and whether I could use gradient backgrounds or place a watermark in the background. It turns out that I can change the background of the chart to any color I wish, but I wasn’t able to find a way to use gradients and background images. (I’ll suggest it to the powers at eSignal.) After drawing a few more pretty things on my chart, it looked crowded. As usual, I thought I would click on the indicator or tool and press the delete key to see if it would remove an item. Once again, I found that eSignal has gone one notch better: when I click on or hover over a tool or indicator, the background and all other items dim. The only item that is bright is the one I am interested in. This makes it easy for me to determine if that is the item I wish to remove, and if it is, I just press delete or move the item elsewhere on the screen. I was impressed with this feature. One last thing before I quit extolling the praises of eSignal: the Advanced GET version does a magnificent job of displaying Elliott wave counts. Take a look at Figure 4. The background is
FigUre 2: eSignal Script eDitor. Here you see an example of eSignal code for a gradient MACD. The code looks similar to C++ or C# or Java. It has its constructs and reserved words and rules and regulations.
FigUre 3: gann BoXeS
The Script Editor in eSignal is not much different than that in other soft-ware. You type your code into a blank window. When you start typing, if the editor encounters a reserved word it rec-ognizes, it will pop up with the choices and parameters in a small help window. I wish there were a dictionary available in the title bar, but I didn’t find one. In Figure 2, you can see a sample of some eSignal code for a gradient MACD. Compiling your code is called verifying. The code looks similar to C++ or C# or Java. It has its constructs and reserved words and rules and regulations. It doesn’t seem very friendly, however. It seems more like “computer-eze” than English-language. I’m sure it’s explained well in their documentation, which I found complete, easy to read, and avail-able on the web. Getting back to charting, I was very excited when I saw Gann lines and squares on the drawing tool menu. But they are grayed out, so I can’t use them. I explored the online manual and found that they only work in the Advanced GET version. So, without that add-on product, these features are not available.
Stocks & Commodities V. 31:8 (44-47): System Design Software, Part 2 by Sunny Harris
Copyright © Technical Analysis Inc.
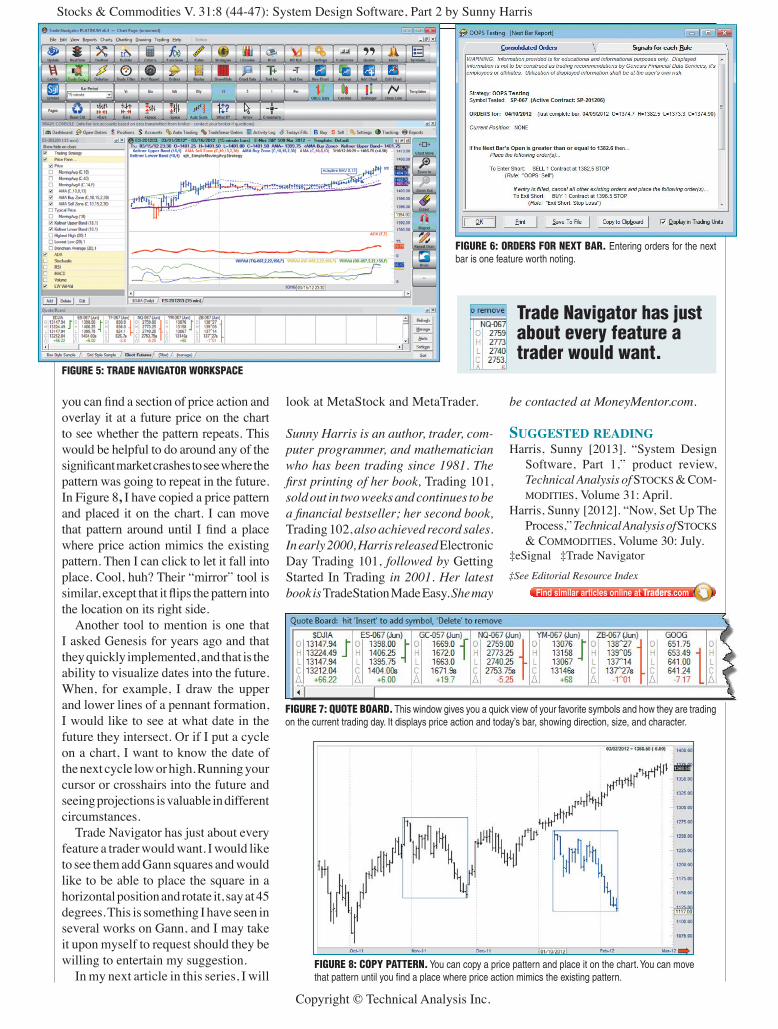
Navigator chart, you can do a neat little trick. You can ask Trade Navigator to display orders for the next bar. In Figure 6, you see an example of this feature. Don’t you just love that you now have exact numbers for the next day? Within Trade Navigator, I can ma-nipulate text in several different ways, changing size, color, and font to my heart’s content. I can play with any and all of the Fibonacci retracement values. I liked what I saw when I displayed the lunar cycles on my chart — it wasn’t just a simple repeating curve as in other software. It is a meaningful, automati-cally calculated set of cycles that makes sense to traders. At the bottom of the Trade Navigator workspace, there is a little horizontal window called “Quote Board.” This window gives you a quick view of your favorite symbols and how they are trad-ing on the current trading day (Figure 7). It displays price action and today’s bar, showing direction, size, and character. The Quote Board is an invaluable quick look at your favorite markets. No up-to-date software would be complete without it. Trade Navigator also has chart trading and an order bar for order placement. To prevent you from making one of the most common trading mistakes when you go to place an order, a confirmation window pops up to assist you in plac-ing stops and limit orders. The triangle moves to the appropriate place on the bar to show you how the order will be executed — it’s foolproof. There are so many other nice features in Trade Navigator. The toolbar is full of features I’ve often wished for. Here are some of the fun and invaluable tools:
n Target shootern Gann fann Copy patternn Mirrorn Dollar differencen Support/resistance line (dif-
ferent from a horizontal line)n Sophisticated text capabilitiesn Icons n Wave labeln Risk/reward line
One of the more impressive tools is the “Copy pattern” tool. With this tool,
ProDuct revIew
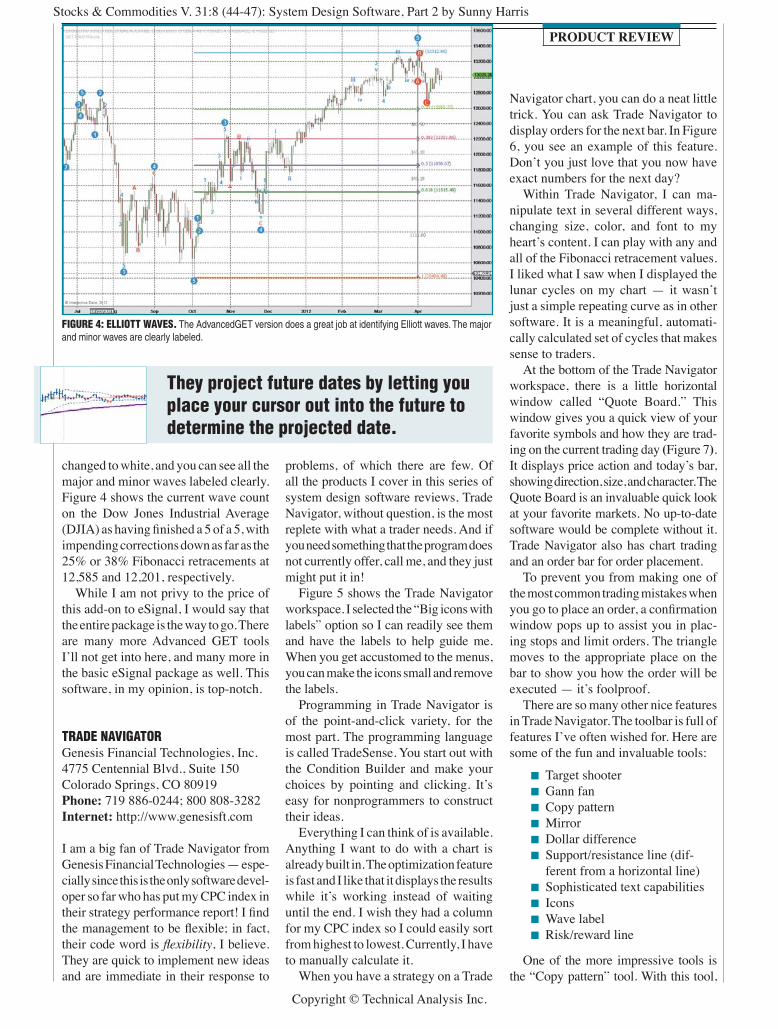
changed to white, and you can see all the major and minor waves labeled clearly. Figure 4 shows the current wave count on the Dow Jones Industrial Average (DJIA) as having finished a 5 of a 5, with impending corrections down as far as the 25% or 38% Fibonacci retracements at 12,585 and 12,201, respectively. While I am not privy to the price of this add-on to eSignal, I would say that the entire package is the way to go. There are many more Advanced GET tools I’ll not get into here, and many more in the basic eSignal package as well. This software, in my opinion, is top-notch.
traDe navigatorGenesis Financial Technologies, Inc.4775 Centennial Blvd., Suite 150Colorado Springs, CO 80919Phone: 719 886-0244; 800 808-3282Internet: http://www.genesisft.com
I am a big fan of Trade Navigator from Genesis Financial Technologies — espe-cially since this is the only software devel-oper so far who has put my CPC index in their strategy performance report! I find the management to be flexible; in fact, their code word is flexibility, I believe. They are quick to implement new ideas and are immediate in their response to
they project future dates by letting you place your cursor out into the future to determine the projected date.
FigUre 4: elliott WaveS. The AdvancedGET version does a great job at identifying Elliott waves. The major and minor waves are clearly labeled.
problems, of which there are few. Of all the products I cover in this series of system design software reviews, Trade Navigator, without question, is the most replete with what a trader needs. And if you need something that the program does not currently offer, call me, and they just might put it in! Figure 5 shows the Trade Navigator workspace. I selected the “Big icons with labels” option so I can readily see them and have the labels to help guide me. When you get accustomed to the menus, you can make the icons small and remove the labels. Programming in Trade Navigator is of the point-and-click variety, for the most part. The programming language is called TradeSense. You start out with the Condition Builder and make your choices by pointing and clicking. It’s easy for nonprogrammers to construct their ideas. Everything I can think of is available. Anything I want to do with a chart is already built in. The optimization feature is fast and I like that it displays the results while it’s working instead of waiting until the end. I wish they had a column for my CPC index so I could easily sort from highest to lowest. Currently, I have to manually calculate it. When you have a strategy on a Trade
Stocks & Commodities V. 31:8 (44-47): System Design Software, Part 2 by Sunny Harris
Copyright © Technical Analysis Inc.
you can find a section of price action and overlay it at a future price on the chart to see whether the pattern repeats. This would be helpful to do around any of the significant market crashes to see where the pattern was going to repeat in the future. In Figure 8, I have copied a price pattern and placed it on the chart. I can move that pattern around until I find a place where price action mimics the existing pattern. Then I can click to let it fall into place. Cool, huh? Their “mirror” tool is similar, except that it flips the pattern into the location on its right side. Another tool to mention is one that I asked Genesis for years ago and that they quickly implemented, and that is the ability to visualize dates into the future. When, for example, I draw the upper and lower lines of a pennant formation, I would like to see at what date in the future they intersect. Or if I put a cycle on a chart, I want to know the date of the next cycle low or high. Running your cursor or crosshairs into the future and seeing projections is valuable in different circumstances. Trade Navigator has just about every feature a trader would want. I would like to see them add Gann squares and would like to be able to place the square in a horizontal position and rotate it, say at 45 degrees. This is something I have seen in several works on Gann, and I may take it upon myself to request should they be willing to entertain my suggestion. In my next article in this series, I will
FigUre 7: QUote BoarD. This window gives you a quick view of your favorite symbols and how they are trading on the current trading day. It displays price action and today’s bar, showing direction, size, and character.
FigUre 8: copy pattern. You can copy a price pattern and place it on the chart. You can move that pattern until you find a place where price action mimics the existing pattern.
FigUre 6: orDerS For neXt Bar. Entering orders for the next bar is one feature worth noting.
FigUre 5: traDe navigator WorKSpace
look at MetaStock and MetaTrader.
Sunny Harris is an author, trader, com-puter programmer, and mathematician who has been trading since 1981. The first printing of her book, Trading 101, sold out in two weeks and continues to be a financial bestseller; her second book, Trading 102, also achieved record sales. In early 2000, Harris released Electronic Day Trading 101, followed by Getting Started In Trading in 2001. Her latest book is TradeStation Made Easy. She may
be contacted at MoneyMentor.com.
suggested readingHarris, Sunny [2013]. “System Design
Software, Part 1,” product review, Technical Analysis of StockS & com-moditieS, Volume 31: April.
Harris, Sunny [2012]. “Now, Set Up The Process,” Technical Analysis of StockS & commoditieS, Volume 30: July.
‡eSignal ‡Trade Navigator
trade navigator has just about every feature a trader would want.
‡See Editorial Resource Index

Traders take many paths to reach their destination.
Can your platform get you there?
Search apps and services to personalize the NinjaTrader platform to meet your requirements.
Indicators, automated strategies, free tools & more.
Explore now at ninjatraderecosystem.com
Futures, foreign currency and options trading contains substantial risk and is not for every investor. Only risk capital should be used for trading and only those with suf�cient risk capital should consider trading.
03-IB20-1280CH1278
Take theBond Challenge!
Member - NYSE, FINRA, SIPC – Supporting documentation for any claims and statistical information will be provided upon request. *Interactive Brokers rated #1, Best Online Broker according to Barron’s Best Online Brokers Survey of 2019: February 25, 2019. For more information see, ibkr.com/info Barron’s is a registered trademark of Dow Jones & Co. Inc.
Use the IBKR Bond Scanner to compare available yields against those of your broker.
Start Trading Today!
ibkr.com/comparechallengeInteractive Brokers Rated #1 Best Online Broker 2019 by Barron’s*
Every Stocks & Commodities subscription (regular and digital) includes:
• Full access to our Digital Edition The complete magazine as a PDF you can download.
• Full access to our Digital Archives That’s 35 years’ worth of content!
• Complete access to WorkingMoney.com The information you need to invest smartly and successfully.
• Access to Traders.com Advantage Insights, tips and techniques that can help you trade smarter.
1 year ................$8999
2 years ...........$14999
3 years ...........$19999
Visit www.Traders.com to find out more!Email: [email protected] • Phone: 206-938-0570 facebook.com/STOCKSandCOMMODITIES @STOCKSandCOMM
PROFESSIONAL TRADERS’ STARTER KITA 5-year subscription to S&C magazine that includes everything above PLUS a free* book, Charting The Stock Market: The Wyckoff Method, all for a price that saves you $150 off the year-by-year price! *Shipping & han-dling charges apply for foreign orders.
1 year ................$8999
2 years ...........$14999
3 years ...........$19999
That’s around $5 a month!
5 years .........$29999
5 years .........$29999
subscribe or renew today!