Embed Size (px)
Citation preview
Environ Risk Assess Remediat 2017 Volume 1 Issue 236
http://www.alliedacademies.org/environmental-risk-assessment-and-remediation/Hypothesis
IntroductionThe potential for natural resources conflict to create major risk of disruption to socio-economic activities in the country necessitates the need to diversify the economy to reducing the over-dependence on oil revenues especially in the face of dwindling oil prices in the international market in recent times. This can be partly, if not mostly, achieved by repositioning the agricultural sector in order to increase the capacity therein. Every nation’s economy is linked to climate sensitive activities including rain-fed agriculture, food and energy security which are crucially dependent on adequate and timely availability of water.
In Nigeria, the climate in recent years has witnessed significant variability leading to extreme weather events [1] such as the 2012 flood that devastated essential components of human livelihoods with the agricultural sector worse hit with loses put at billions of naira (NEMA 2012). An indebt understanding of contemporary and historical rainfall trends as well as variation is of utmost importance to be able to take proactive adaptation strategies. Furthermore studies associated with the distribution and analysis of rainfall are sin qua non to the planning and management of irrigation projects, reservoir operations changes in water requirements and agricultural production.
Nigeria is divided into five agroecological zones with a large percentage of the populace involved in both subsistence and mechanized agriculture. Agriculture remains the main stay of the economy and is highly affected by the vagaries of weather. Crops and animals derived their water resources largely from rainfall. Rainfall is considered as the main determinant of the types of crops that can be grown in an area and also the period of cultivation of such crops and the farming systems that can be practiced.
Increasing flood risk is now being recognized as the most important threat from climate change in most parts of the Nigeria and this has prompted public debate on the apparent increased, frequency of extreme, and in particular, on perceived increase in rainfall and temperature intensities. Several studies have adduced extreme rainfall to be the major cause of flood worldwide [2]. Other studies have identified the characteristics of extreme rainfall that are associated with flood frequency to include duration, intensity, frequency, seasonality, variability, trend and fluctuation. A good understanding of the rainfall distribution across the various agro-ecological zones is of vital importance if any meaningful development is to take place in the agricultural sector, water resource management and the energy sector. Nigeria’s electricity supply is believed to be 90%
The research sought to investigate the significance of trends in annual rainfall in the 45 weather stations across Nigeria, using rainfall data obtained from the Nigerian Meteorological Agency (NiMet) spanning a time interval of 35 years (1981-2015). The research tends to show the pattern of rainfall in other to plan alternative resources capabilities in Nigeria. This will help policy makers to plan towards sustainability in Agriculture, Hydro etc. as an alternative to boost economy in Nigeria. The study thereby identifies data points which were statistically aggregated into their relevant agro-ecological zones in the country. Parametric (Z test) and non-parametric (i.e. Mankandall Test) procedures were then employed to test for the significance of the trends. The study analyses in computing the change points in the rainfall values as well as the magnitude of the changes. The results of both the parametric and non-parametric tests, at the 1% level of significance, indicated upward trends in annual rainfall, significant at the 1% level, over the Swamp, Guinea, Sudan and Sahel agro-ecological zones of Nigeria. Additionally, over these zones annual rainfall during the period under review (1983-2015), increased from 2140 to 2866 mm (with a 100% confidence level), 1341 to 1436 mm (with a 96% confidence level), 861 to 1097 mm (with a 100% confidence level), 480 to 665 mm (with a 100% confidence level), respectively. However, the tropical region showed no significant trend in annual rainfall at the 1% level which invariably reflected in the finding that there is no significant change in annual rainfall in this region. Accordingly, over this region annual rainfall, during the period under review, remained at 1,608 mm. It is based on these findings that the subsequent assessment and discussions vis-à-vis implications of the results for the zones are underpinned.
Abstract
Trend analysis and change point detection of rainfall across the Agro-ecological zones for sustainability development in Nigeria.
Aremu O1, Bello E1, Aganbi B1, Festus O2
1Department of Meteorology, Nigeria Meteorological Agency, Nigeria2University of Missouri, Kansas City, United States of America
Accepted on April 24, 2017
Keywords: Heavy metal, arsenic, lead, mercury, seasonal variation, Adyar Estuary.
Environ Risk Assess Remediat 2017 Volume 1 Issue 2 37
Citation: Aremu O, Bello E, Aganbi B, et al. Trend analysis and change point detection of rainfall across the Agro-ecological zones for sustainability development in Nigeria. Environ Risk Assess Remediat. 2017;1(2):36-46.
water-driven or generated, and with the recent vandalisation of gas installations in the Niger-Delta by militant groups the role of water and its management including the pattern of its source, vis-à-vis rainfall variability has been further magnified.
Previous studies have, at various times for different regions, been dedicated to understanding the variability and trend of rainfall over some or most parts of Nigeria with emphasizes on the Sudano-Sahelian region [3-8]. However there is either scant or no record of studies that have considered employing both parametric and non-parametric tests to detect trends in annual rainfall across the agro-ecological zones in the country including the use of a change point detection model to identify the changes.
It is against this background that this study seeks to determine trends in annual rainfall and investigate their significance at the 1% level at the Sahel, Sudan, Guinea savanna, tropical rainforest and the swamp forest of Nigeria, including some specific stations in the country using ground-based observation data (from 1981-2015), and also based on the outcome of the tests, provide an estimate of the average annual change in rainfall in these locations between 1981 and 2015, backed by the associated confidence levels.
The Study AreaThe study area comprise of the five agro-ecological zones in Nigeria viz: Swamp, Tropical, Guinea, Sudan and Sahel. An Agro-Ecological Zone is a geographic area having similar climatic conditions that influence their ability to support rain-fed agriculture. At regional scale AEZs are influenced by latitude elevation, temperature and seasonal rainfall amount [9].
The Swamp forest agro-ecological zone in Nigeria is located in the extreme southern part of the country it is a zone that exhibits a bimodal seasonal rainfall distribution and has an average temperature and rainfall of about 26°C and 2500 mm respectively [10]. In this zone there is hardly a month without rainfall. The locations in this zone considered as study area include: Calabar, Eket, Uyo, Lagos Marine and Warri.
Like the Swamp zone, Tropical rainforest has a bimodal rainfall pattern but with less intensity and a clear distinction between wet and dry seasons. This zone has a mean temperature and rainfall of about 26.5°C and 1489 mm respectively. The locations in this zone considered as study area include:Akure, Asaba, Abeokuta, Benin, Osogbo, Ibadan etc.
The Guinea savannah is located around the middle part of the country and is the most extensive of all the zones. With a unimodal rainfall distribution, it has an average rainfall and temperature distribution of about 1051.7 mm 27.3°C respectively. The locations in this zone considered as study area include: Enugu, Ilorin, Bida, Lokoja, Minna, Ogoja, Makurdi, Shaki, Ibi, FCT and Lafia.
The Sudan zone is found in the North West. It has an annual average rainfall of about 700-1100 mm with a prolonged dry season of about 6-9 months. It covers areas such as Kaduna, Kano, Jos, Yola, Gombe, Bauchi, Zaria and Yelwa.
The Sahel is located in the extreme northeastern part of the
country. In this zone dry season can last for as long as 9 months and the maximum annual rainfall is about 600 mm. The locations in this zone considered as study area include: Maiduguri, Nguru, Potiskum, Katsina, Gusau and Sokoto.
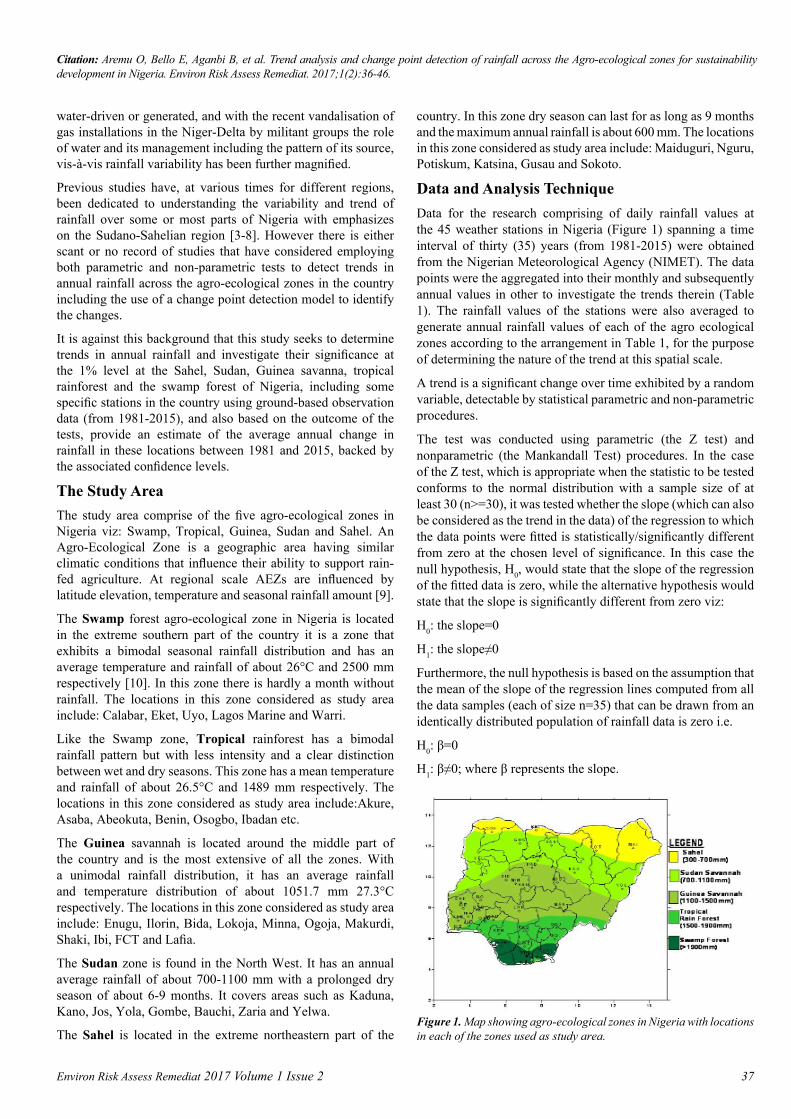
Data and Analysis TechniqueData for the research comprising of daily rainfall values at the 45 weather stations in Nigeria (Figure 1) spanning a time interval of thirty (35) years (from 1981-2015) were obtained from the Nigerian Meteorological Agency (NIMET). The data points were the aggregated into their monthly and subsequently annual values in other to investigate the trends therein (Table 1). The rainfall values of the stations were also averaged to generate annual rainfall values of each of the agro ecological zones according to the arrangement in Table 1, for the purpose of determining the nature of the trend at this spatial scale.
A trend is a significant change over time exhibited by a random variable, detectable by statistical parametric and non-parametric procedures.
The test was conducted using parametric (the Z test) and nonparametric (the Mankandall Test) procedures. In the case of the Z test, which is appropriate when the statistic to be tested conforms to the normal distribution with a sample size of at least 30 (n>=30), it was tested whether the slope (which can also be considered as the trend in the data) of the regression to which the data points were fitted is statistically/significantly different from zero at the chosen level of significance. In this case the null hypothesis, H0, would state that the slope of the regression of the fitted data is zero, while the alternative hypothesis would state that the slope is significantly different from zero viz:
H0: the slope=0
H1: the slope≠0
Furthermore, the null hypothesis is based on the assumption that the mean of the slope of the regression lines computed from all the data samples (each of size n=35) that can be drawn from an identically distributed population of rainfall data is zero i.e.
H0: β=0
H1: β≠0; where β represents the slope.
Figure 1. Map showing agro-ecological zones in Nigeria with locations in each of the zones used as study area.
Aremu/Bello/Aganbi/et al.
Environ Risk Assess Remediat 2017 Volume 1 Issue 238
This test is associated with the fact that the various slopes of regression lines computed from all the possible data samples that can be randomly drawn from an identically distributed data (the population) are normally distributed around the mean of all the slopes, or the slope of the regression obtained from the data of the entire population.
With as the random variable representing rainfall values, the mean, and the standard deviation, the normal distribution is given by:
( )
2121
2( )
X Xx
F X x e dx − −
−∞
≤ =√ ∫ δ
δ π
Generally in hypothesis testing involving a set of normally
distributed set of data, the Z statistic given by b
X XZS−
= is computed and compared with its critical value at a given confidence interval. With regards to this study, in which we are considering a sample of size 35, the Z statistic to be computed
and compared to the critical Z value is given byb
X XZS−
= , with
the standard deviation in the previous equation replaced by the standard error of the slope, bS . This adjustment is usually necessary when dealing with samples. Given that the regression here are the rainfall values as function defined on time t (t = 1,2,…35 years), with SE as the standard error of the regression, the standard error of the slope is given by
2 2/ ( (( ) ) / )SE SQRT t t nΣ − Σ ;
The standard error of the regression is given by ¡
( ) ^ 2) / ( 2))SQRT X X nΣ −Σ − where the rainfall values obtained from the regression line.
If the absolute value of the computed Z statistic is greater than its critical value at a given confidence level (here the confidence levels 95% and 99% were considered), the null hypothesis is rejected in favor of the alternative hypothesis and we conclude or accept that the slope is significantly different from zero at the chosen confidence level; the null hypothesis was accepted otherwise.
The significance of a trend/slope in the aforementioned data was also subjected to nonparametric test using the Mankandall procedure based on the S-statistic given by
( )1
1 1
, j ,
clearly j 2,3,..n, & k 1,2,..n 1
n n
j kk j k
S sgn x x for all k−
= = +
= − >
= = −
∑∑
With all the representing the annual rainfall values, the associated variance of this statistic used in computing the Z-statistic for this form of test, is computed from the relationship given by
( ) ( )( )2 1 2 5 , 35
18n n n
Vars S or nδ− +
= =
The Z-statistic in this case was then derived from
>+
=
<−
=
0100
01
SSS
SS
Z
δ
δ
A fundamental advantage of this test over the parametric tests lies in the fact that it can be applied to a data set with a skewed probability distribution; in other words the probability distribution need not be normal, though in practical applications, when used interchangeably with the aforementioned parametric procedure, they would yield identical results most of the time.
For a set of independent and randomly distributed random variables, when n ≥ 8, the S statistic is approximately normally distributed, with zero mean, and as such the associated Z statistic follows a standardized normal distribution. The null hypothesis, H0, states that the data come from a population where the random variables are independently and identically
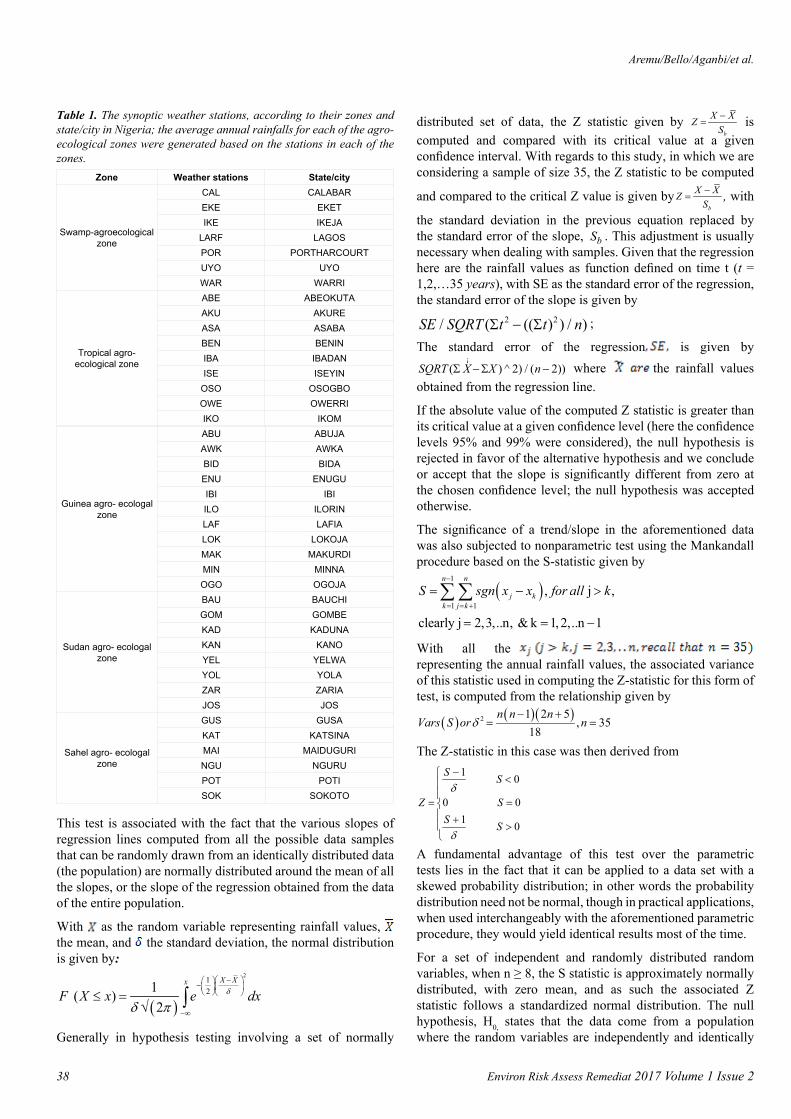
Table 1. The synoptic weather stations, according to their zones and state/city in Nigeria; the average annual rainfalls for each of the agro-ecological zones were generated based on the stations in each of the zones.
Zone Weather stations State/city
Swamp-agroecological zone
CAL CALABAREKE EKETIKE IKEJA
LARF LAGOSPOR PORTHARCOURTUYO UYOWAR WARRI
Tropical agro-ecological zone
ABE ABEOKUTAAKU AKUREASA ASABABEN BENINIBA IBADANISE ISEYIN
OSO OSOGBOOWE OWERRIIKO IKOM
Guinea agro- ecologal zone
ABU ABUJAAWK AWKABID BIDAENU ENUGUIBI IBIILO ILORINLAF LAFIALOK LOKOJAMAK MAKURDIMIN MINNAOGO OGOJA
Sudan agro- ecologal zone
BAU BAUCHIGOM GOMBEKAD KADUNAKAN KANOYEL YELWAYOL YOLAZAR ZARIAJOS JOS
Sahel agro- ecologal zone
GUS GUSAKAT KATSINAMAI MAIDUGURINGU NGURUPOT POTISOK SOKOTO
Environ Risk Assess Remediat 2017 Volume 1 Issue 2 39
Citation: Aremu O, Bello E, Aganbi B, et al. Trend analysis and change point detection of rainfall across the Agro-ecological zones for sustainability development in Nigeria. Environ Risk Assess Remediat. 2017;1(2):36-46.
distributed. The alternative hypothesis, H1, would state that the data follow a monotonic trend over time. A positive value of the Z statistic is indicative of an upward trend, and a negative value a downward trend.
As earlier mentioned in the case of the parametric test, the null hypothesis would be rejected in favor of the of the alternative hypothesis and it would be conclude that the data set are not randomly distributed provided that the absolute value of the computed Z statistic is greater than its critical value at the chosen confidence level; otherwise the null hypothesis was accepted. The adopted confidence levels here were the 95 and 99 percent.
While the S and Z statistics indicate a trend and it’s the direction, where one exists, it does not provide a measure of its magnitude. Another statistic which does not only indicate a trend but is also able to provide an estimate of its magnitude is determined by the Sen’s nonparametric method given by
, where all the j ,
j kkj
x xQ k
j kwithvalues of j and k as already stated
−= >
−
This method only applies when the trend is assumed to be linear. If there are n values xj in the time series we get as many as ( ) 1 / 2N n n= − slope estimates. The Sen’s estimator of slope is then the median of these N values of kjQ when ranked from the smallest to the largest [11].
Having subjected all the rainfall data set to the tests, a decision was made as regards whether a significant trend existed in the rainfall values of a weather station or agro-ecological zone. In this research it was reasonably concluded that a trend exists in the rainfall values of a station only when it is so affirmed by both the parametric and non-parametric tests at the 1% level of significance.
Change point detection
Since a significant positive trend, especially at the 1% significant level, implies an increase in annual rainfall, this presupposes the fact that the increase occurred at some point in time within the period under review. Such points are referred to as change points and the process of detecting them is called change point detection. A number of methods, including the petit test, can be employed to detect change points in a time series but in this study a combination of bootstrap techniques and CUSUM (Cumulative Sum) chart, following the procedure of Taylor (2000a), has been adopted to detect the change point(s) and the magnitude of the change(s) thereof in the rainfall values spanning a time interval of 35 years (33 years in the case of the agro-ecological zones) in each of the aforementioned weather stations.
Given the set of rainfall values X1, X2… X35, the CUSUM chart was constructed as follows:
1 i(X )i iS S X−= + − , For all i=1, 2, 3 …35) years and we Started the cumulative sum at zero by setting S0 = 0 or
1 1; ; 1, 2,3,.. , 35k ni i i iS X kX X X k n n= == Σ − = Σ = = .
These cumulative sums are not the cumulative sums of the values X1, X2… X35 but of that of the difference between the
sums and the average. The CUSUM charts was then plotted from which we obtain the value Sdiff given by
max
min
...., (i 0,1, 2 35
( 0,1,2.....35
..dif max min max i
max i
S f S S where S S and
S Si
= − = =
= =One of the ways of identifying whether a change has occurred is by inspecting CUSUM chart; a sudden change in the CUSUM indicates a change in the average and hence a change in the time series [12]. In other words the most extreme point in a CUSUM chart can indicate that a change has occurred. To ascertain whether the change actually occurred would require that it is supported by a confidence level which can be determined by performing a bootstrap analysis. Typically, 90% or 95% confidence is required before one can conclude that a significant change has been detected.
A bootstrap analysis is simply the process of generating random sample or random re-orderings of the rainfall data X1, X2… X35withoutreplacement. A single bootstrap sample is given by X0
1, X0
2… X035. The possible number of sampling without
replacement or bootstrapping using the rainfall data is 35! In this study a bootstrap sample 1000 has been used to determine the confidence level.
For each the bootstrap samples, the corresponding S0diff was
computed and number of bootstrap samples K, for which S0diff<
Sdiff was noted.
In this way the confidence level for this 1000 bootstrap samples was computed as
Confidence Level = 100 %XN
Once the confidence level has indicated that a change has taken place, an estimate of when the change occurred can be determined by the CUSUM estimator given by
Max1, 2,3....35m iS i S= =
Here m serves to estimate the last point before the change occurred, and Sm is the point furthest from zero in the CUSUM chart.
A second estimator of when the change occurred can be determined by using the mean square estimator given as:
( ) ( ) ( )2 2351 1 1 2
mi i i m iMSE m X X X X= = += Σ − + Σ − ; Where
11
mii
XX
m==∑ ,
35
12
35ii m
XX
m= +=−
∑
The MSE error estimator is based on the idea of splitting the data into two segments, 1 to m and m+1 to 35, estimating the average of each segment, and then seeing how well the data fits the two estimated averages. The value of m that minimizes the MSE is the best estimator of the last point before the change.
Results and Discussions
The results of the trend analysis are presented in this section including those of the 45 stations spread across the country followed by those of the agro-ecological zones obtained from analysis based on statistically aggregated rainfall data of the corresponding ecological zones. Since it would be rather
Aremu/Bello/Aganbi/et al.
Environ Risk Assess Remediat 2017 Volume 1 Issue 240
cumbersome to present all the results of the analysis of the forty-five (45) stations used in the analysis in this study, five stations have been selected from each of the agro-ecological zones for the purpose of describing the trends at the stations. In this regard the weather stations CAL, EKE, IKO, UYO and LARF have been selected to represent the Swamp region; stations ASA, AKU, BEN, ISE and OWE the Tropical savannah; stations MIN, ILO, LOK, MAK and JOS, the Guinea savannah; stations GOM, KAD, KAN, YEL and ZAR, the Sudan savannah; and stations GUS, KAT, MAI, NGU and SOK, the Sahel savannah. Furthermore, presented alongside the results of the trend in the table are the percentage number of stations in each of the agro-ecological zone showing significant positive trend in the rainfall data at the 99 and 95% confidence intervals (These are also known as the 1 and 5% levels of significance respectively).
The coefficient of variation of the selected stations from each of the agro-ecological zone (Table 2). In this study the coefficient of variation measures the interannual variability of annual rainfall in each of the stations; in other words it gives an average estimate of the likely change in annual rainfall relative to the long term mean. With a coeeficient of variation of 15-36%, it is obvious that the coefficient of variation in the Sudano-Sahelian part of the country is higher than in the central (10-24%) and the southern (10-29%) parts of the country. This seems consistent with Oladipo [13] who stated that the pattern of rainfall in the northern part of the country exhibits a high spatio-temporal variation with interannual variability of between 15-20%, a major characteristic of rainfall in this part that mostly results in climate hazards such as floods and severe droughts with their devastating effects on food production and associated calamities
and sufferings [6,13,14]. It also has great implications in the planning of irrigation projects and agricultural activities.
While the coefficient of variation gives an estimate of the expected change in rainfall in any given year, the trend measures the interannual variability which would either have a positive or negative tendency.
Since trend analysis is also one of the active areas of interest as it concerns rainfall variability, the results of the trend analysis will now be evaluated in the proceeding sections.
Analysis of rainfall trend in the 45 stations
Table 3a-3c shows the results of the trend analysis in the stations that have been selected to represent the 45 stations. The results obtained using both the parametric and the Mankandall (considered the non-parametric approach in this study) tests show remarkable similarities at both the 1 and 5% levels of significance. Estimates of the magnitude of the trends or slope coefficient of the selected stations in each of the zones are also presented (Table 4).
Generally the trends at the stations where observed to be mostly positive. As presented in the tables, a significant positive trend at the given level of significance is displayed in the relevant columns as “positive trend”, while a positive trend that proves not to be significant is labeled “+ve/NS” in relevant column. Negative trends that are not significant are labeled as “-ve/NS”. Although the trends in all the stations were observed
Agro-ecological zones Stations Coefficient of variation (%)
Swamp
CAL 13EKE 33IKO 10UYO 29LARF 23
Tropical
OWE 14AKU 12ISE 19ASA 17BEN 21
Guinea
MIN 14ILO 24LOK 19MAK 18JOS 10
Sudan
GOM 15KAD 17KAN 35YEL 20ZAR 15
Sahel
GUS 23KAT 36MAI 32NGU 26SOK 23
Table 2. Coefficient of variations in annual rainfall data at the selected stations of the agro-ecological zones.
Agro-ecological
zonesStations
Trend at the 99%% of stations with +ve
trend in each of the aggroecological zones
Parametric approach
Mankandell approach
Parametric approach
Mankandell approach
Swamp
CAL Positive trend Positive trend
63 63EKE Positive trend Positive trendIKO Positive trend Positive trendUYO Positive trend Positive trendLARF +ve/NS +ve/NS
TropicalSavanah
OWE +ve/NS +ve/NS
10 10AKU -ve/NS -ve/NSISE +ve/NS +ve/NSASA +ve/NS +ve/NSBEN Positive trend Positive trend
Guinea savanah
MIN +ve/NS +ve/NS
25 17ILO -ve/NS -ve/NSLOK +ve/NS +ve/NSMAK +ve/NS +ve/NSJOS +ve/NS +ve/NS
Sudan savanah
GOM +ve/NS +ve/NS
43 43KAD +ve/NS +ve/NSKAN Positive trend Positive trendYEL +ve/NS +ve/NSZAR Positive trend Positive trend
Sahel savanah
GUS +ve/NS +ve/NS
67 33KAT Positive trend Positive trendMAI Positive trend Positive trendNGU Positive trend +ve/NSSOK Positive trend +ve/NS
Table 3a. Results of the trend analysis of the selected stations in the agroe-cological zones. The sign +ve/ns means “positive but not significant” at the indicated level of significance”.
Environ Risk Assess Remediat 2017 Volume 1 Issue 2 41
Citation: Aremu O, Bello E, Aganbi B, et al. Trend analysis and change point detection of rainfall across the Agro-ecological zones for sustainability development in Nigeria. Environ Risk Assess Remediat. 2017;1(2):36-46.
to be mostly positive, the issue of whether such trends were significant was entirely determined by the statistical tests. In the Swamp agro-ecological zone, four out of the five selected stations demonstrated significant positive trends at both the 1 and 5% levels of significance with 63% of all the stations in this zone exhibiting significant positive trends at both levels of significance. Interestingly both the parametric and non-parametric procedures in this case mostly yielded identical results.
In the tropical region three out of the five selected stations indicated positive trends that are not significant at both levels of significance; the weather station named AKU indicted a negative trend although not significant at both the 1 and 5% levels of significance. However the weather station BEN indicated a significant positive trend at both the 1 and 5% levels of significance. Both the parametric and the non-parametric methods showed that only 10% of the stations in the agro ecological zone demonstrated significant positive trend; implying that 90% of the stations in this zone do not show significant positive trends in annual rainfall values.
Agro-ecological
zonesStations
Trend at 95%% of stations with +ve
trend in each of the agro-ecological zones
Parametric approach
Mankandell approach
Parametric approach
Mankandell approach
Swamp
CAL Positive trend Positive trend
63 63EKE Positive trend Positive trendIKO Positive trend Positive trendUYO Positive trend Positive trendLARF +ve/NS +ve/NS
TropicalSavanah
OWE +ve/NS +ve/NS
11 11AKU -ve/NS -ve/NSISE +ve/NS +ve/NSASA +ve/NS +ve/NSBEN Positive trend Positive trend
Guinea savanah
MIN Positive trend +ve/NS
42 33ILO -ve/NS -ve/NSLOK +ve/NS +ve/NSMAK +ve/NS +ve/NSJOS +ve/NS +ve/NS
Sudan savanah
GOM +ve/NS +ve/NS
43 43KAD +ve/NS +ve/NSKAN Positive trend Positive trendYEL +ve/NS +ve/NSZAR Positive trend Positive trend
Sahel savanah
GUS +ve/NS +ve/NS
67 33KAT Positive trend Positive trendMAI Positive trend Positive trendNGU Positive trend Positive trendSOK Positive trend Positive trend
Table 3b. Results of the trend analysis of the selected stations in the agroe-cological zones. The sign +ve/ns means “positive but not significant” at the indicated level of significance” but at 95% confidence interval.
Agro-ecological zones StationsSlope coefficient/trend magnitude
From regression Sen ken’s approach
Swamp
CAL 20.37 20.89EKE 95.10 94.23IKO 1.85 2.19UYO 42.61 26.05LARF 2.02 2.71
TropicalSavanah
OWE 3.36 3.99AKU -2.02 -1.30ISE 2.69 5.48ASA 8.64 4.72BEN 20.65 18.90
Guinea savanah
MIN 6.47 4.57ILO 8.79 4.76LOK 5.15 5.17MAK 2.34 2.15JOS 2.29 1.55
Sudan savanah
GOM 0.63 0.62KAD 6.60 6.93KAN 23.52 24.35YEL 1.20 3.10ZAR 7.63 7.65
Sahel savanah
GUS 0.44 1.71KAT 9.12 6.74MAI 11.53 10.86NGU 4.94 4.85SOK 7.44 6.58
Table 3c. Slope coefficient/trend magnitude in annual rainfall of the selected stations in the agro-ecological zones.
Stations
Change point detectionLevel 1 Level 2
Change point
Change in annual rainfall
(mm)
Change point
Change in annual rainfall (mm)
CAL 2011 2856 - 3551 at 92% c.f level _ _
EKE 1999 2278-4272 at 100% c.f level _ _
UYO 2011 2215-3850 at 99% c.f level _ _
BEN 1987 1575-2342 at 98% c.f level _ _
LAF 1996 1117-1347 at 99% c.f level _ _
KAT 2000 445-702 at 100% c.f level _ _
MAI 1995 492.8-670 at 91% c.f level _ _
BAU 2009 1062-1589 at 100% c.f level 1992 897-1062 at 91%
c.f level
KAN 1996 840-1301 at 98% c.f level 1988 577.5-840 at 93%
c.f level
Table 4a. Change point s in annual rainfall data (1981-2015) at some of the selected stations with significant trends; level 1 change are the first changes detected and the most visibly apparent in the rainfall data.
Agro-ecological
zones
Change point detectionLevel 1 Level 2
Change point
Change in annual rainfall (mm)
Change point
Change in annual rainfall (mm)
Swamp 2011 2432-2864 at 100% c.f level 1994 2140-2432 at 100%
c.f level
Tropical savanah
No significant
change point
ANNUAL RR remains at 1,608 _ _
Guinea savanah 2006 1341-1486 at 96%
c.f level _ _
Sudan savanah 1991 861-1097 at 100%
c.f level _ _
Sahel savanah 1988 480-665at 100%
c.f level _ _
Table 4b. Change point detection in agro-ecological zones.
Aremu/Bello/Aganbi/et al.
Environ Risk Assess Remediat 2017 Volume 1 Issue 242
In the Guinea savannah, where 25% of the stations through the parametric test (and 17% through the Mankandall test) showed significant positive trends at the 1% level of significance, all the selected station indicated positive trends though none of which is significant at the 1% level. At the 5% level of significance 43% of the stations in this zone, through the parametric tests demonstrated significant positive trend while the test conducted by Mankandall approach showed that 33% of the stations in this zone demonstrated significant positive trend. With the exception of MIN weather station the selected weather stations in this zone showed non-significant positive trend at the 5% level.
In the Sudan savannah both the parametric and non-parametric tests showed that 43% of all the stations in this zone exhibited positive trend at the 1% level of significance with only two out of the five selected station showing significant positive trend. Similar results were obtained at the 5% level of significance in this zone.
In Sahel region, with 67% of the stations demonstrating positive trend at the 1% level of significance vis-à-vis the parametric tests, four out of the five selected stations in this zone demonstrated significant positive trend. The Mankandall test on the other hand showed that 33% of the stations in this zone exhibited positive trends in annual rainfall at the 1% level significance. Similar results were obtained at the 5% level of significance.
The magnitude of the trend or slope coefficient at the stations
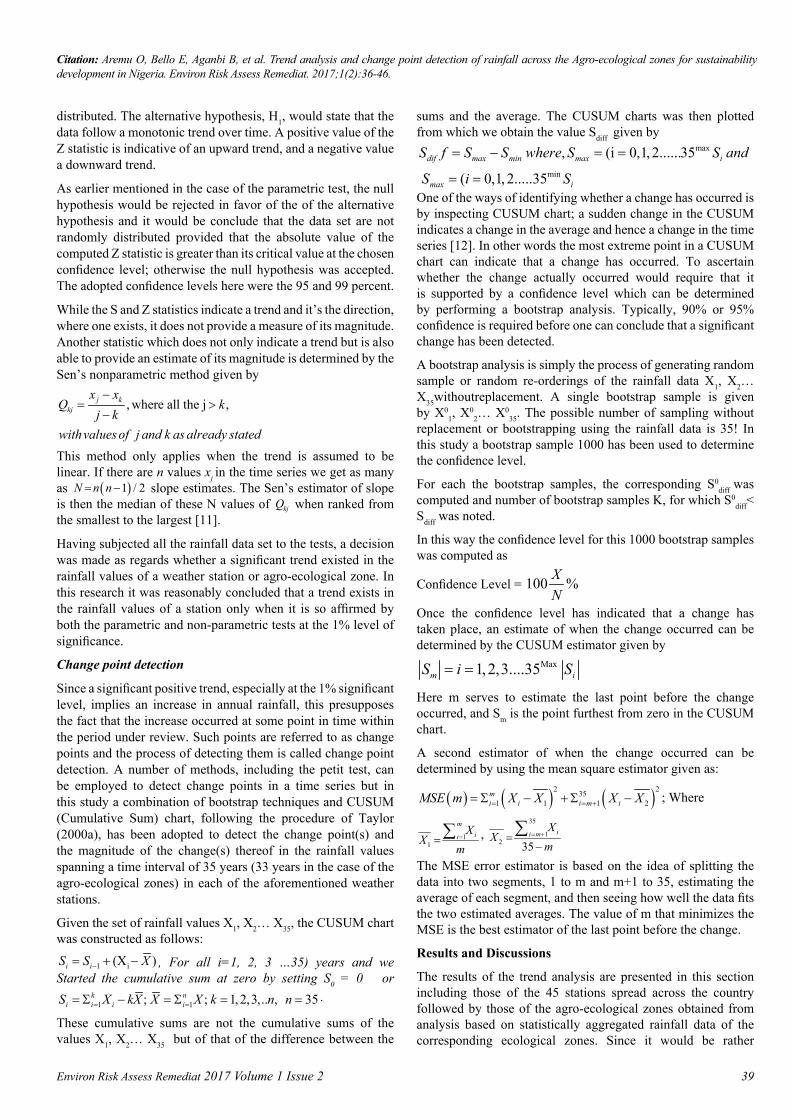
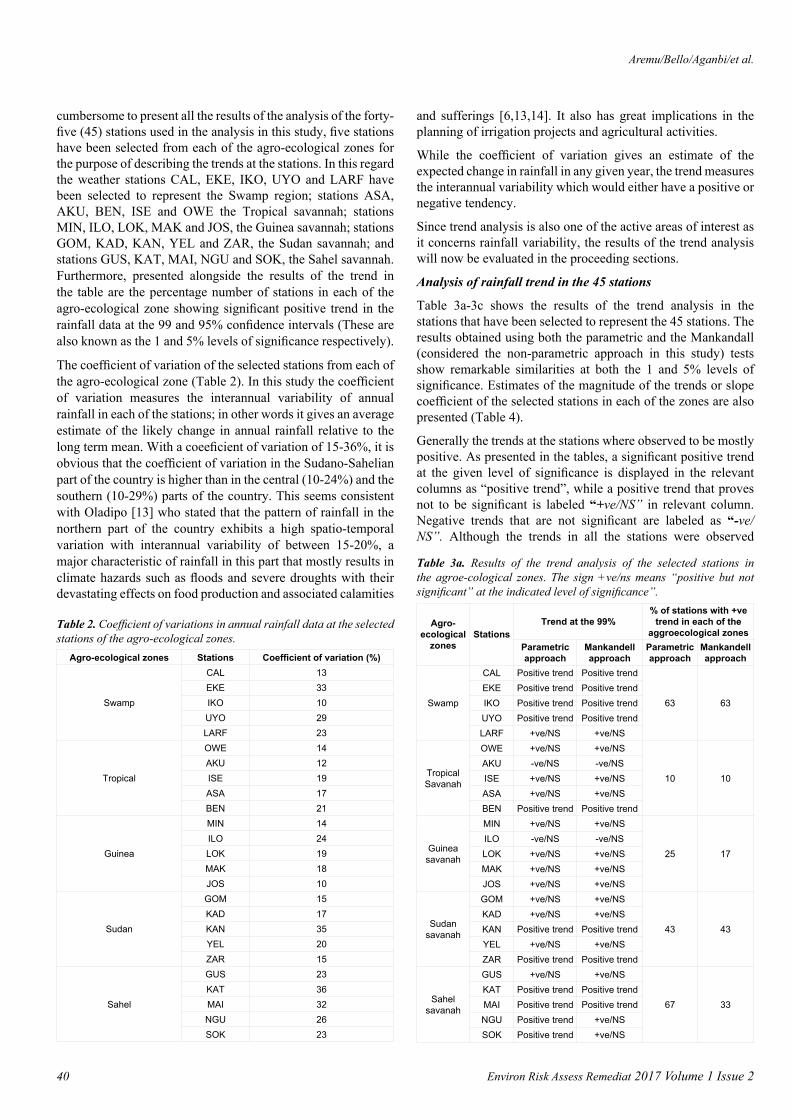
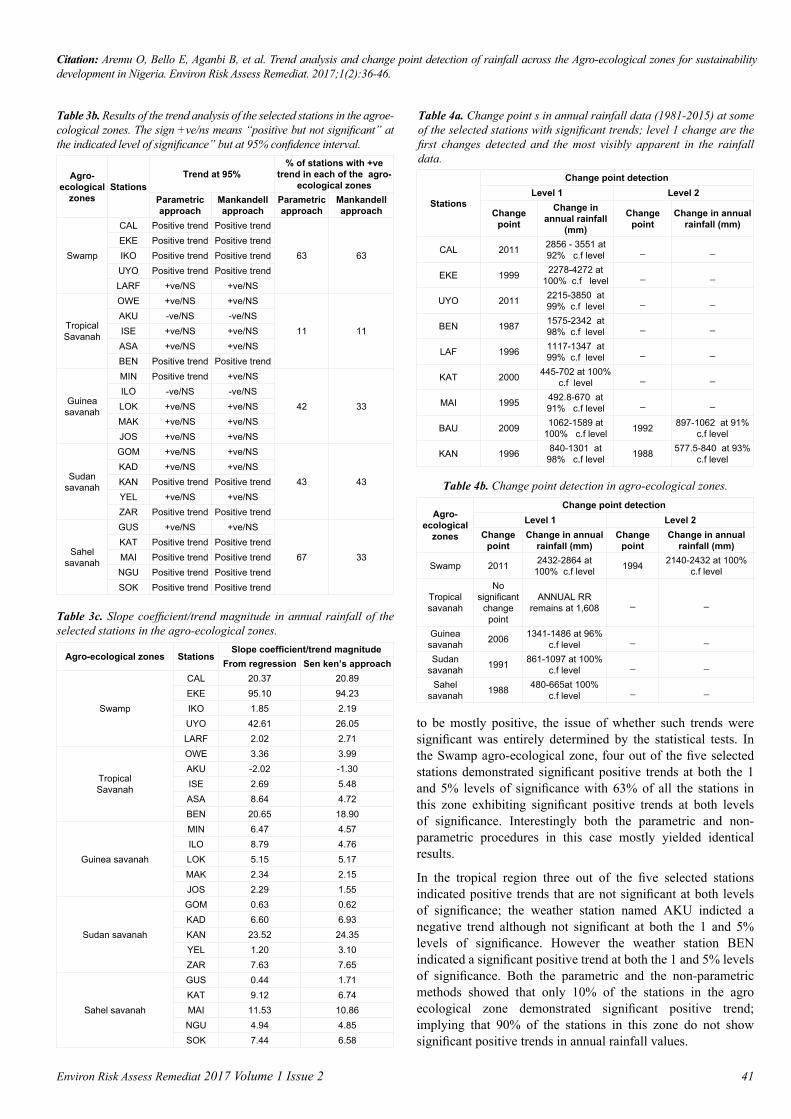
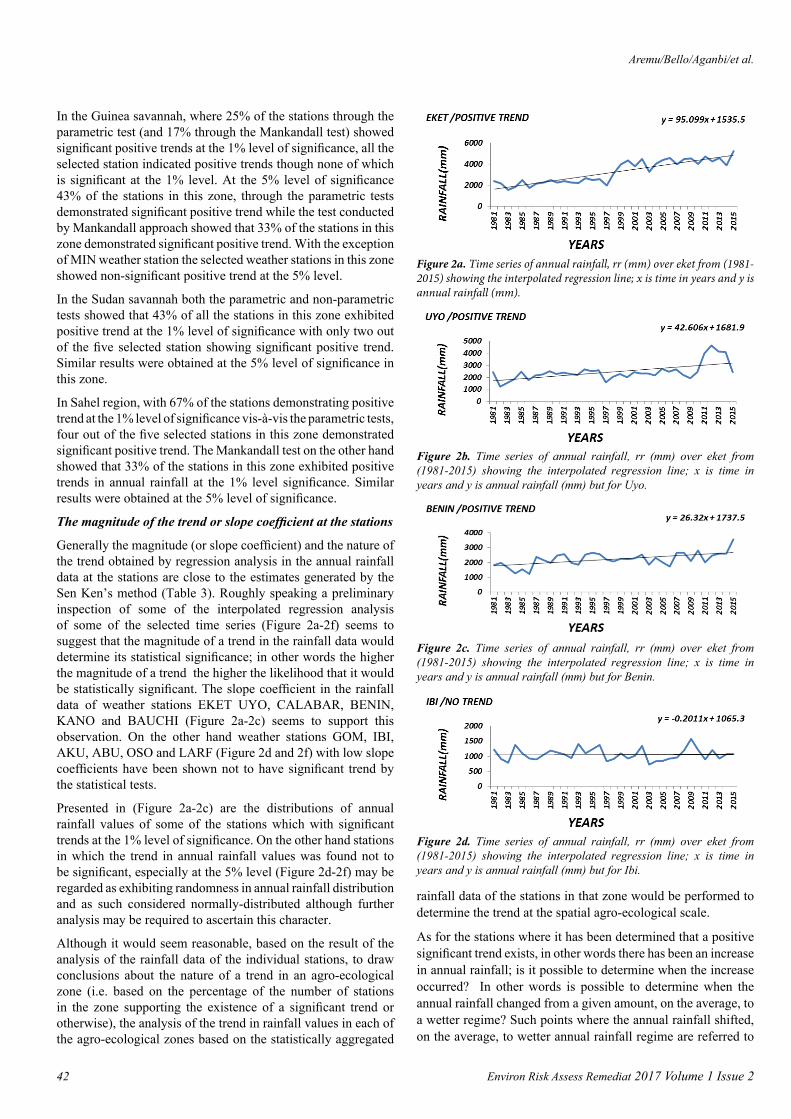
Generally the magnitude (or slope coefficient) and the nature of the trend obtained by regression analysis in the annual rainfall data at the stations are close to the estimates generated by the Sen Ken’s method (Table 3). Roughly speaking a preliminary inspection of some of the interpolated regression analysis of some of the selected time series (Figure 2a-2f) seems to suggest that the magnitude of a trend in the rainfall data would determine its statistical significance; in other words the higher the magnitude of a trend the higher the likelihood that it would be statistically significant. The slope coefficient in the rainfall data of weather stations EKET UYO, CALABAR, BENIN, KANO and BAUCHI (Figure 2a-2c) seems to support this observation. On the other hand weather stations GOM, IBI, AKU, ABU, OSO and LARF (Figure 2d and 2f) with low slope coefficients have been shown not to have significant trend by the statistical tests.
Presented in (Figure 2a-2c) are the distributions of annual rainfall values of some of the stations which with significant trends at the 1% level of significance. On the other hand stations in which the trend in annual rainfall values was found not to be significant, especially at the 5% level (Figure 2d-2f) may be regarded as exhibiting randomness in annual rainfall distribution and as such considered normally-distributed although further analysis may be required to ascertain this character.
Although it would seem reasonable, based on the result of the analysis of the rainfall data of the individual stations, to draw conclusions about the nature of a trend in an agro-ecological zone (i.e. based on the percentage of the number of stations in the zone supporting the existence of a significant trend or otherwise), the analysis of the trend in rainfall values in each of the agro-ecological zones based on the statistically aggregated
Figure 2a. Time series of annual rainfall, rr (mm) over eket from (1981-2015) showing the interpolated regression line; x is time in years and y is annual rainfall (mm).
Figure 2b. Time series of annual rainfall, rr (mm) over eket from (1981-2015) showing the interpolated regression line; x is time in years and y is annual rainfall (mm) but for Uyo.
Figure 2c. Time series of annual rainfall, rr (mm) over eket from (1981-2015) showing the interpolated regression line; x is time in years and y is annual rainfall (mm) but for Benin.
Figure 2d. Time series of annual rainfall, rr (mm) over eket from (1981-2015) showing the interpolated regression line; x is time in years and y is annual rainfall (mm) but for Ibi.
rainfall data of the stations in that zone would be performed to determine the trend at the spatial agro-ecological scale.
As for the stations where it has been determined that a positive significant trend exists, in other words there has been an increase in annual rainfall; is it possible to determine when the increase occurred? In other words is possible to determine when the annual rainfall changed from a given amount, on the average, to a wetter regime? Such points where the annual rainfall shifted, on the average, to wetter annual rainfall regime are referred to
Environ Risk Assess Remediat 2017 Volume 1 Issue 2 43
Citation: Aremu O, Bello E, Aganbi B, et al. Trend analysis and change point detection of rainfall across the Agro-ecological zones for sustainability development in Nigeria. Environ Risk Assess Remediat. 2017;1(2):36-46.
as change points and these will be examined in the next sub section.
Trend analysis of annual rainfall and change point detection in the agro-ecological zones
Owing to the fact that rainfall values of some of the stations were missing for the years 1981-1982, in order to ensure consistency in the analysis, the average annual rainfall data of the agro-ecological zones were computed from 1983-2015.
Results at all the agro-ecological zones (Figure 3a-3c) at the 5% significant level showed upward trends, while at the 1% significant level the results showed upward trends except at the tropical region whose annual rainfall showed a positive trend that is not significant (Table 4a). The results of the trend analysis of the stations situated in the Swamp agro-ecological zone seem to reinforce the result at the spatial agro-ecological scale given that 63% of the stations in this zone indicated significant positive trend at the 1% and 5% level of significance. Similarly results of the stations in the tropical region, whose rainfall data indicated no trend at the 1% significant level, seem to buttress those at the spatial agro-ecological scale given that only 10% of the stations in this zone prove to be statistically significant.
However, at the Guinea and Sudan savannah, the results based on the percentage number of stations with positive trend in this zone appear not to be consistent with those at the agro-ecological scale. For instance whereas only 43% of the stations in this zone showed significant positive trends at the 1% and 5% levels, the result at the spatial agro-ecological scale nevertheless demonstrated a significant positive at the 1% and 5% levels. Perhaps this seeming anomaly may have resulted from the smoothening effect induced by averaging the rainfall data of the stations over the agro-ecological zones.
A significant positive trend in the rainfall values over the years would imply an increase or positive change in rainfall amounts. As earlier mentioned, the time of occurrence of such increase or change, referred to as change points, and were determined by a combination of CUSUM charts and bootstrapping techniques. Apparently when a positive trend in annual rainfall proved to be significant especially at the 1% significant level, it presupposes that the change occurred at some point in time within the interval in question and in the case of this study, between 1983 and 2015. The change points, categorized in levels (i.e. levels 1 and 2) which is tantamount to how visibly apparent they are in the rainfall data, are presented in Table 4. The level of confidence (c.f) associated with each change points are also expressed.
In the Swamp agro-ecological zone, with a significant positive trend at both the 1% and 5% significant levels the annual increase, on the average, occurred twice during the period under review i.e. in 1994 from 2140 mm to 2431 mm; and in 2011 when the annual rainfall increased from 2432 mm to 2864 mm (Table 4b). There is a 100% confidence level that these increases occurred at the aforementioned times.
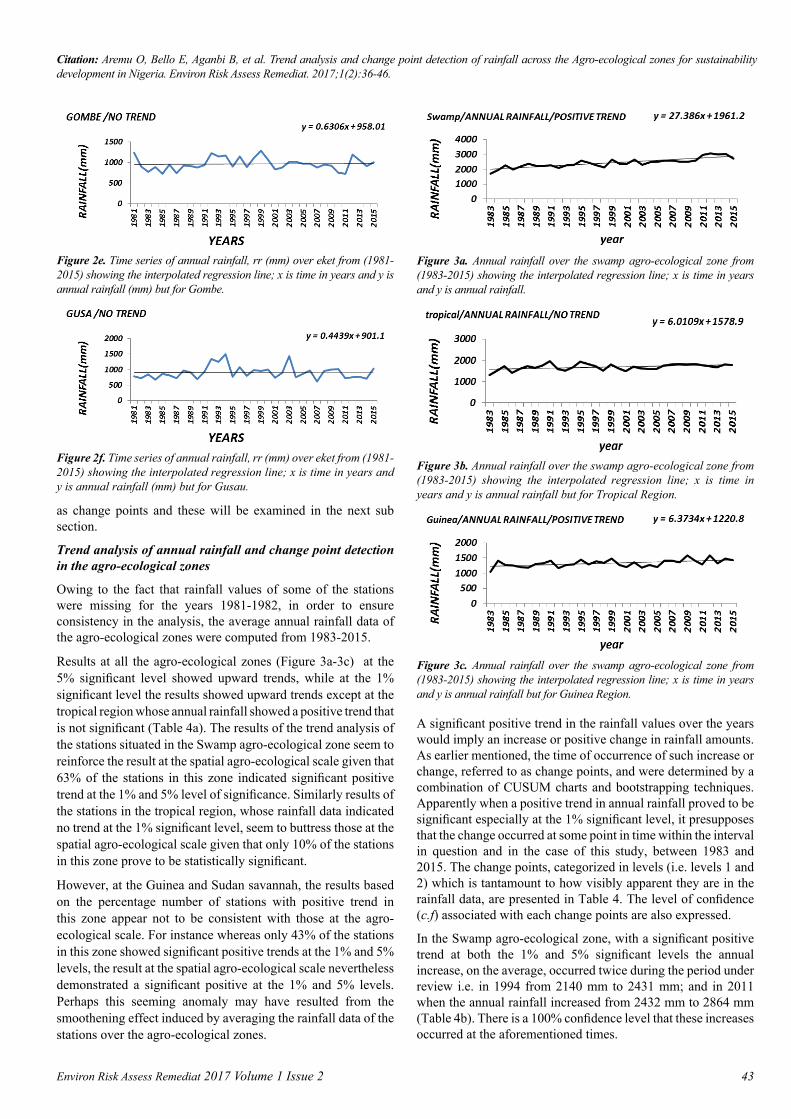
Figure 2f. Time series of annual rainfall, rr (mm) over eket from (1981-2015) showing the interpolated regression line; x is time in years and y is annual rainfall (mm) but for Gusau.
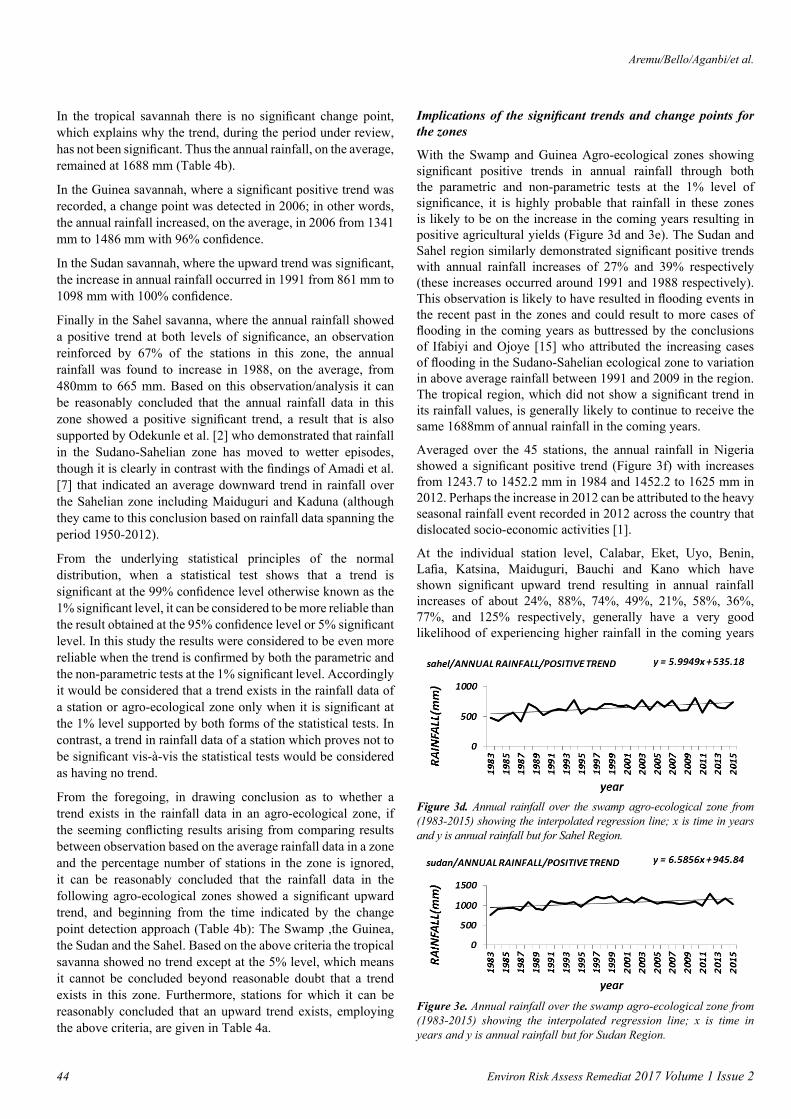
Figure 3a. Annual rainfall over the swamp agro-ecological zone from (1983-2015) showing the interpolated regression line; x is time in years and y is annual rainfall.
Figure 3b. Annual rainfall over the swamp agro-ecological zone from (1983-2015) showing the interpolated regression line; x is time in years and y is annual rainfall but for Tropical Region.
Figure 2e. Time series of annual rainfall, rr (mm) over eket from (1981-2015) showing the interpolated regression line; x is time in years and y is annual rainfall (mm) but for Gombe.
Figure 3c. Annual rainfall over the swamp agro-ecological zone from (1983-2015) showing the interpolated regression line; x is time in years and y is annual rainfall but for Guinea Region.
Aremu/Bello/Aganbi/et al.
Environ Risk Assess Remediat 2017 Volume 1 Issue 244
In the tropical savannah there is no significant change point, which explains why the trend, during the period under review, has not been significant. Thus the annual rainfall, on the average, remained at 1688 mm (Table 4b).
In the Guinea savannah, where a significant positive trend was recorded, a change point was detected in 2006; in other words, the annual rainfall increased, on the average, in 2006 from 1341 mm to 1486 mm with 96% confidence.
In the Sudan savannah, where the upward trend was significant, the increase in annual rainfall occurred in 1991 from 861 mm to 1098 mm with 100% confidence.
Finally in the Sahel savanna, where the annual rainfall showed a positive trend at both levels of significance, an observation reinforced by 67% of the stations in this zone, the annual rainfall was found to increase in 1988, on the average, from 480mm to 665 mm. Based on this observation/analysis it can be reasonably concluded that the annual rainfall data in this zone showed a positive significant trend, a result that is also supported by Odekunle et al. [2] who demonstrated that rainfall in the Sudano-Sahelian zone has moved to wetter episodes, though it is clearly in contrast with the findings of Amadi et al. [7] that indicated an average downward trend in rainfall over the Sahelian zone including Maiduguri and Kaduna (although they came to this conclusion based on rainfall data spanning the period 1950-2012).
From the underlying statistical principles of the normal distribution, when a statistical test shows that a trend is significant at the 99% confidence level otherwise known as the 1% significant level, it can be considered to be more reliable than the result obtained at the 95% confidence level or 5% significant level. In this study the results were considered to be even more reliable when the trend is confirmed by both the parametric and the non-parametric tests at the 1% significant level. Accordingly it would be considered that a trend exists in the rainfall data of a station or agro-ecological zone only when it is significant at the 1% level supported by both forms of the statistical tests. In contrast, a trend in rainfall data of a station which proves not to be significant vis-à-vis the statistical tests would be considered as having no trend.
From the foregoing, in drawing conclusion as to whether a trend exists in the rainfall data in an agro-ecological zone, if the seeming conflicting results arising from comparing results between observation based on the average rainfall data in a zone and the percentage number of stations in the zone is ignored, it can be reasonably concluded that the rainfall data in the following agro-ecological zones showed a significant upward trend, and beginning from the time indicated by the change point detection approach (Table 4b): The Swamp ,the Guinea, the Sudan and the Sahel. Based on the above criteria the tropical savanna showed no trend except at the 5% level, which means it cannot be concluded beyond reasonable doubt that a trend exists in this zone. Furthermore, stations for which it can be reasonably concluded that an upward trend exists, employing the above criteria, are given in Table 4a.
Implications of the significant trends and change points for the zones
With the Swamp and Guinea Agro-ecological zones showing significant positive trends in annual rainfall through both the parametric and non-parametric tests at the 1% level of significance, it is highly probable that rainfall in these zones is likely to be on the increase in the coming years resulting in positive agricultural yields (Figure 3d and 3e). The Sudan and Sahel region similarly demonstrated significant positive trends with annual rainfall increases of 27% and 39% respectively (these increases occurred around 1991 and 1988 respectively). This observation is likely to have resulted in flooding events in the recent past in the zones and could result to more cases of flooding in the coming years as buttressed by the conclusions of Ifabiyi and Ojoye [15] who attributed the increasing cases of flooding in the Sudano-Sahelian ecological zone to variation in above average rainfall between 1991 and 2009 in the region. The tropical region, which did not show a significant trend in its rainfall values, is generally likely to continue to receive the same 1688mm of annual rainfall in the coming years.
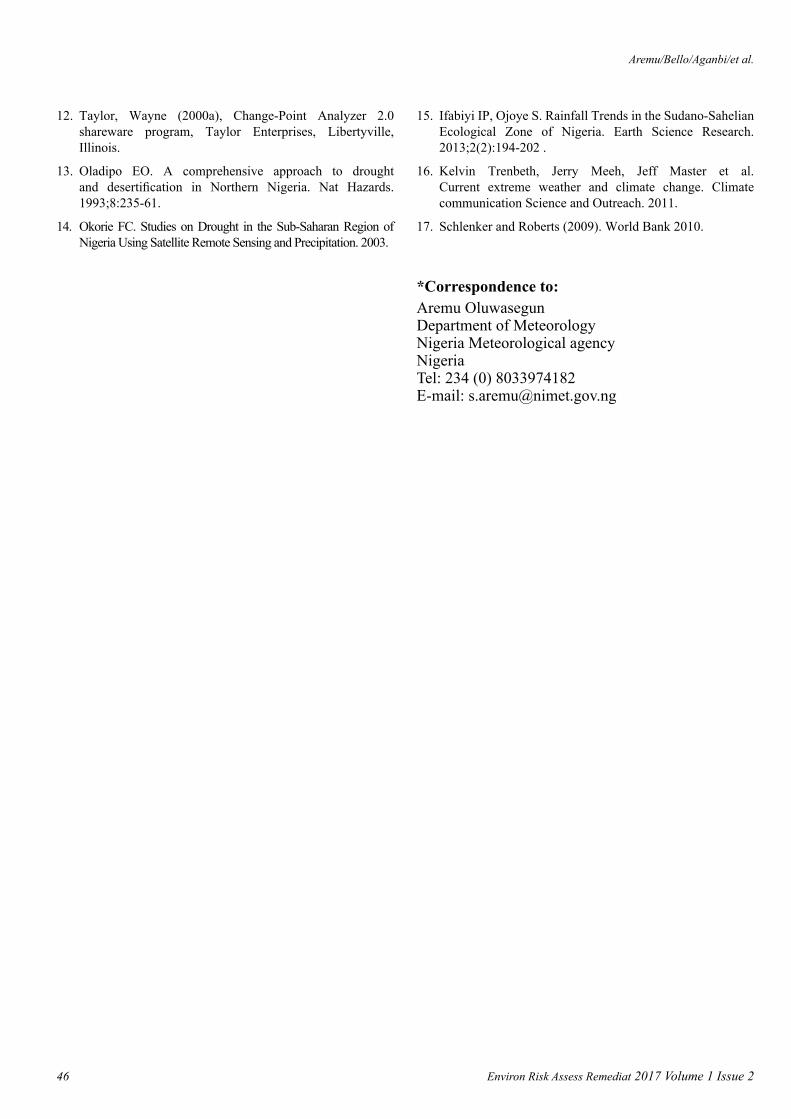
Averaged over the 45 stations, the annual rainfall in Nigeria showed a significant positive trend (Figure 3f) with increases from 1243.7 to 1452.2 mm in 1984 and 1452.2 to 1625 mm in 2012. Perhaps the increase in 2012 can be attributed to the heavy seasonal rainfall event recorded in 2012 across the country that dislocated socio-economic activities [1].
At the individual station level, Calabar, Eket, Uyo, Benin, Lafia, Katsina, Maiduguri, Bauchi and Kano which have shown significant upward trend resulting in annual rainfall increases of about 24%, 88%, 74%, 49%, 21%, 58%, 36%, 77%, and 125% respectively, generally have a very good likelihood of experiencing higher rainfall in the coming years
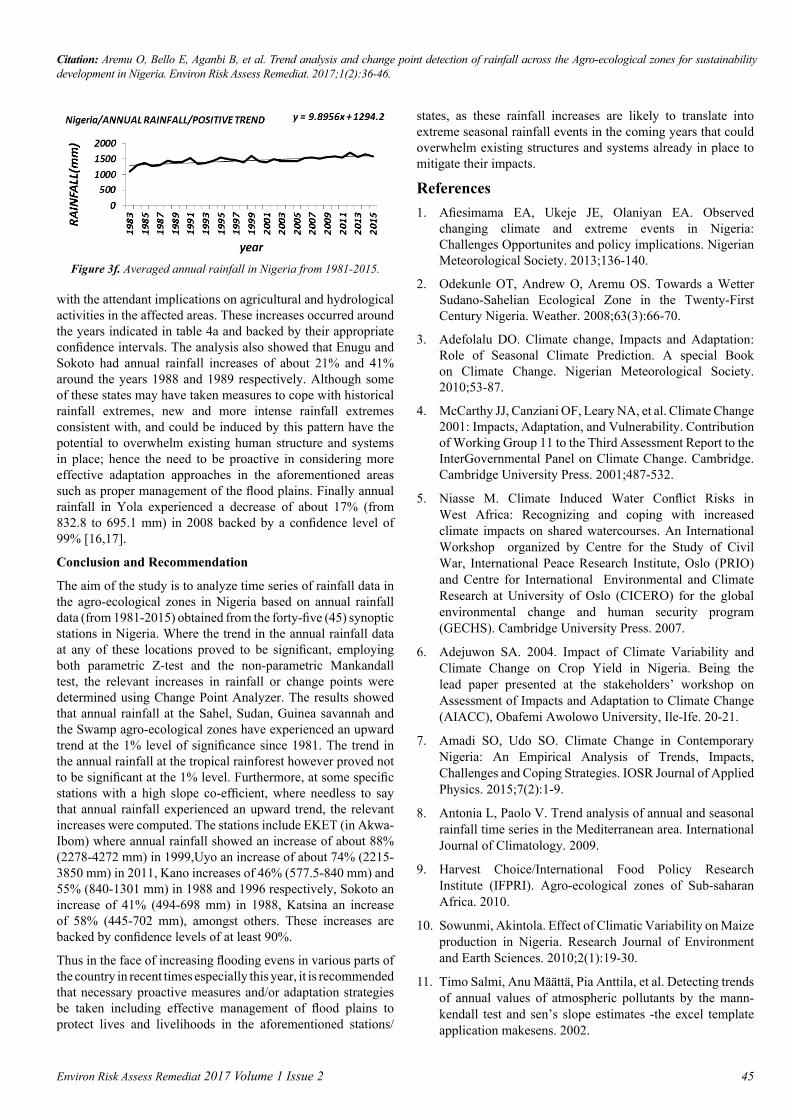
Figure 3d. Annual rainfall over the swamp agro-ecological zone from (1983-2015) showing the interpolated regression line; x is time in years and y is annual rainfall but for Sahel Region.
Figure 3e. Annual rainfall over the swamp agro-ecological zone from (1983-2015) showing the interpolated regression line; x is time in years and y is annual rainfall but for Sudan Region.
Environ Risk Assess Remediat 2017 Volume 1 Issue 2 45
Citation: Aremu O, Bello E, Aganbi B, et al. Trend analysis and change point detection of rainfall across the Agro-ecological zones for sustainability development in Nigeria. Environ Risk Assess Remediat. 2017;1(2):36-46.
with the attendant implications on agricultural and hydrological activities in the affected areas. These increases occurred around the years indicated in table 4a and backed by their appropriate confidence intervals. The analysis also showed that Enugu and Sokoto had annual rainfall increases of about 21% and 41% around the years 1988 and 1989 respectively. Although some of these states may have taken measures to cope with historical rainfall extremes, new and more intense rainfall extremes consistent with, and could be induced by this pattern have the potential to overwhelm existing human structure and systems in place; hence the need to be proactive in considering more effective adaptation approaches in the aforementioned areas such as proper management of the flood plains. Finally annual rainfall in Yola experienced a decrease of about 17% (from 832.8 to 695.1 mm) in 2008 backed by a confidence level of 99% [16,17].
Conclusion and Recommendation
The aim of the study is to analyze time series of rainfall data in the agro-ecological zones in Nigeria based on annual rainfall data (from 1981-2015) obtained from the forty-five (45) synoptic stations in Nigeria. Where the trend in the annual rainfall data at any of these locations proved to be significant, employing both parametric Z-test and the non-parametric Mankandall test, the relevant increases in rainfall or change points were determined using Change Point Analyzer. The results showed that annual rainfall at the Sahel, Sudan, Guinea savannah and the Swamp agro-ecological zones have experienced an upward trend at the 1% level of significance since 1981. The trend in the annual rainfall at the tropical rainforest however proved not to be significant at the 1% level. Furthermore, at some specific stations with a high slope co-efficient, where needless to say that annual rainfall experienced an upward trend, the relevant increases were computed. The stations include EKET (in Akwa-Ibom) where annual rainfall showed an increase of about 88% (2278-4272 mm) in 1999,Uyo an increase of about 74% (2215-3850 mm) in 2011, Kano increases of 46% (577.5-840 mm) and 55% (840-1301 mm) in 1988 and 1996 respectively, Sokoto an increase of 41% (494-698 mm) in 1988, Katsina an increase of 58% (445-702 mm), amongst others. These increases are backed by confidence levels of at least 90%.
Thus in the face of increasing flooding evens in various parts of the country in recent times especially this year, it is recommended that necessary proactive measures and/or adaptation strategies be taken including effective management of flood plains to protect lives and livelihoods in the aforementioned stations/
states, as these rainfall increases are likely to translate into extreme seasonal rainfall events in the coming years that could overwhelm existing structures and systems already in place to mitigate their impacts.
References1. Afiesimama EA, Ukeje JE, Olaniyan EA. Observed
changing climate and extreme events in Nigeria: Challenges Opportunites and policy implications. Nigerian Meteorological Society. 2013;136-140.
2. Odekunle OT, Andrew O, Aremu OS. Towards a Wetter Sudano-Sahelian Ecological Zone in the Twenty-First Century Nigeria. Weather. 2008;63(3):66-70.
3. Adefolalu DO. Climate change, Impacts and Adaptation: Role of Seasonal Climate Prediction. A special Book on Climate Change. Nigerian Meteorological Society. 2010;53-87.
4. McCarthy JJ, Canziani OF, Leary NA, et al. Climate Change 2001: Impacts, Adaptation, and Vulnerability. Contribution of Working Group 11 to the Third Assessment Report to the InterGovernmental Panel on Climate Change. Cambridge. Cambridge University Press. 2001;487-532.
5. Niasse M. Climate Induced Water Conflict Risks in West Africa: Recognizing and coping with increased climate impacts on shared watercourses. An International Workshop organized by Centre for the Study of Civil War, International Peace Research Institute, Oslo (PRIO) and Centre for International Environmental and Climate Research at University of Oslo (CICERO) for the global environmental change and human security program (GECHS). Cambridge University Press. 2007.
6. Adejuwon SA. 2004. Impact of Climate Variability and Climate Change on Crop Yield in Nigeria. Being the lead paper presented at the stakeholders’ workshop on Assessment of Impacts and Adaptation to Climate Change (AIACC), Obafemi Awolowo University, Ile-Ife. 20-21.
7. Amadi SO, Udo SO. Climate Change in Contemporary Nigeria: An Empirical Analysis of Trends, Impacts, Challenges and Coping Strategies. IOSR Journal of Applied Physics. 2015;7(2):1-9.
8. Antonia L, Paolo V. Trend analysis of annual and seasonal rainfall time series in the Mediterranean area. International Journal of Climatology. 2009.
9. Harvest Choice/International Food Policy Research Institute (IFPRI). Agro-ecological zones of Sub-saharan Africa. 2010.
10. Sowunmi, Akintola. Effect of Climatic Variability on Maize production in Nigeria. Research Journal of Environment and Earth Sciences. 2010;2(1):19-30.
11. Timo Salmi, Anu Määttä, Pia Anttila, et al. Detecting trends of annual values of atmospheric pollutants by the mann-kendall test and sen’s slope estimates -the excel template application makesens. 2002.
Figure 3f. Averaged annual rainfall in Nigeria from 1981-2015.
Aremu/Bello/Aganbi/et al.
Environ Risk Assess Remediat 2017 Volume 1 Issue 246
12. Taylor, Wayne (2000a), Change-Point Analyzer 2.0 shareware program, Taylor Enterprises, Libertyville, Illinois.
13. Oladipo EO. A comprehensive approach to drought and desertification in Northern Nigeria. Nat Hazards. 1993;8:235-61.
14. Okorie FC. Studies on Drought in the Sub-Saharan Region of Nigeria Using Satellite Remote Sensing and Precipitation. 2003.
15. Ifabiyi IP, Ojoye S. Rainfall Trends in the Sudano-Sahelian Ecological Zone of Nigeria. Earth Science Research. 2013;2(2):194-202 .
16. Kelvin Trenbeth, Jerry Meeh, Jeff Master et al. Current extreme weather and climate change. Climate communication Science and Outreach. 2011.
17. Schlenker and Roberts (2009). World Bank 2010.
*Correspondence to:Aremu OluwasegunDepartment of MeteorologyNigeria Meteorological agencyNigeriaTel: 234 (0) 8033974182E-mail: [email protected]