Embed Size (px)
Citation preview
© 2005 Trefethen & Co. LLC. All rights reserved. Page 1
C o n v e n i e n c e S t o r e ⎟ R e t a i l P e t r o l e u m M a r k e t N e w s
Trefethen & Company, LLC is pleased to bring you this edition of the Market Update, a periodical designed to provide information on current capital market conditions relevant to convenience store and retail petroleum executives. The Update also provides information on announced M&A activity and industry news impacting M&A. Following is a summary of significant financial news as it relates to convenience store finance and M&A.
Conflicting economic data and lower estimates for economic growth were the primary drivers for broad equity market indices falling slightly during the month of April and over the first four months of the year. Economists also are predicting that government reports showing gross domestic product, durable goods, and retail sales falling short of forecasts will prevent the Federal Reserve from increasing the pace of interest rate increases.
Gasoline futures and cash markets declined in late April as Oil per barrel briefly declined below $50 bbl. National rack to retail margins as reported by OPIS fluctuated drastically throughout April. The low point at the beginning of the month was $0.068 cpg and reaching a high mid month of $0.197. Major c-store and retail petroleum news included:
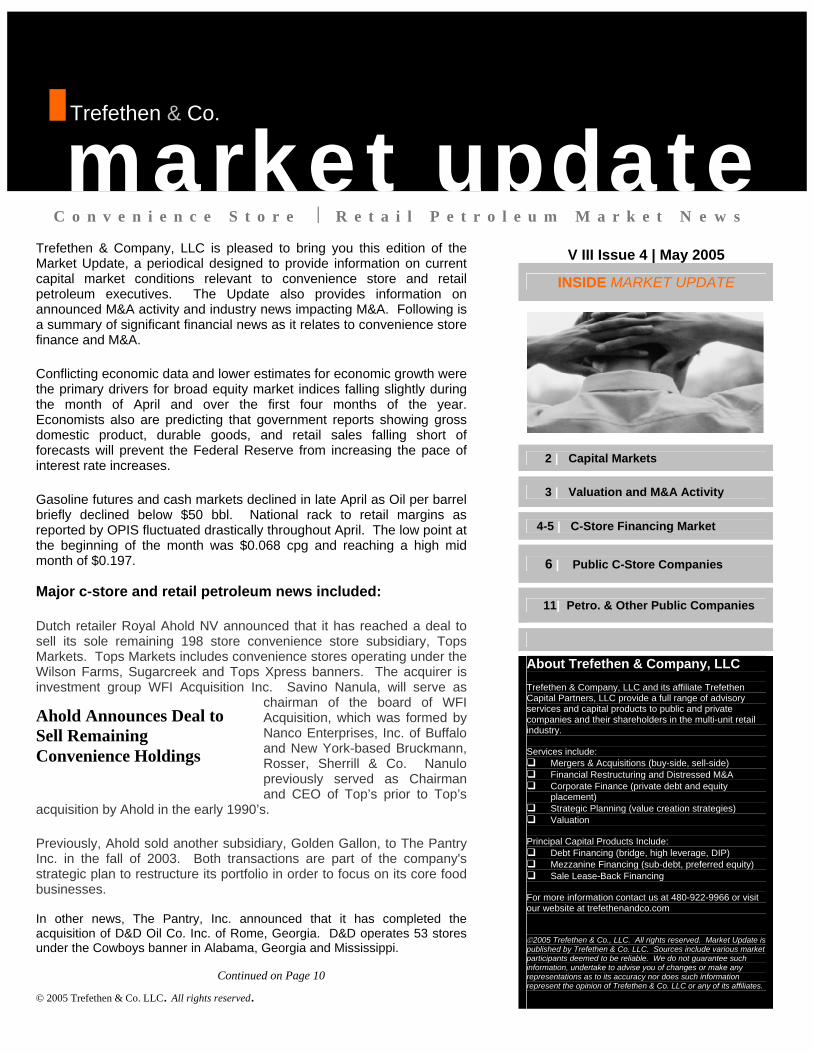
Dutch retailer Royal Ahold NV announced that it has reached a deal to sell its sole remaining 198 store convenience store subsidiary, Tops Markets. Tops Markets includes convenience stores operating under the Wilson Farms, Sugarcreek and Tops Xpress banners. The acquirer is investment group WFI Acquisition Inc. Savino Nanula, will serve as
chairman of the board of WFI Acquisition, which was formed by Nanco Enterprises, Inc. of Buffalo and New York-based Bruckmann, Rosser, Sherrill & Co. Nanulo previously served as Chairman and CEO of Top’s prior to Top’s
acquisition by Ahold in the early 1990’s.
Previously, Ahold sold another subsidiary, Golden Gallon, to The Pantry Inc. in the fall of 2003. Both transactions are part of the company's strategic plan to restructure its portfolio in order to focus on its core food businesses. In other news, The Pantry, Inc. announced that it has completed the acquisition of D&D Oil Co. Inc. of Rome, Georgia. D&D operates 53 stores under the Cowboys banner in Alabama, Georgia and Mississippi.
Continued on Page 10
V III Issue 4 | May 2005
INSIDE MARKET UPDATE
2 | Capital Markets
3 | Valuation and M&A Activity
4-5 | C-Store Financing Market
6 | Public C-Store Companies
11| Petro. & Other Public Companies
About Trefethen & Company, LLC Trefethen & Company, LLC and its affiliate Trefethen Capital Partners, LLC provide a full range of advisory services and capital products to public and private companies and their shareholders in the multi-unit retail industry. Services include:
Mergers & Acquisitions (buy-side, sell-side) Financial Restructuring and Distressed M&A Corporate Finance (private debt and equity
placement) Strategic Planning (value creation strategies) Valuation
Principal Capital Products Include:
Debt Financing (bridge, high leverage, DIP) Mezzanine Financing (sub-debt, preferred equity) Sale Lease-Back Financing
For more information contact us at 480-922-9966 or visit our website at trefethenandco.com ©2005 Trefethen & Co., LLC. All rights reserved. Market Update is published by Trefethen & Co. LLC. Sources include various market participants deemed to be reliable. We do not guarantee such information, undertake to advise you of changes or make any representations as to its accuracy nor does such information represent the opinion of Trefethen & Co. LLC or any of its affiliates.
market update
Trefethen & Co.
Ahold Announces Deal to Sell Remaining Convenience Holdings
© 2005 Trefethen & Co. LLC. All rights reserved. Page 2
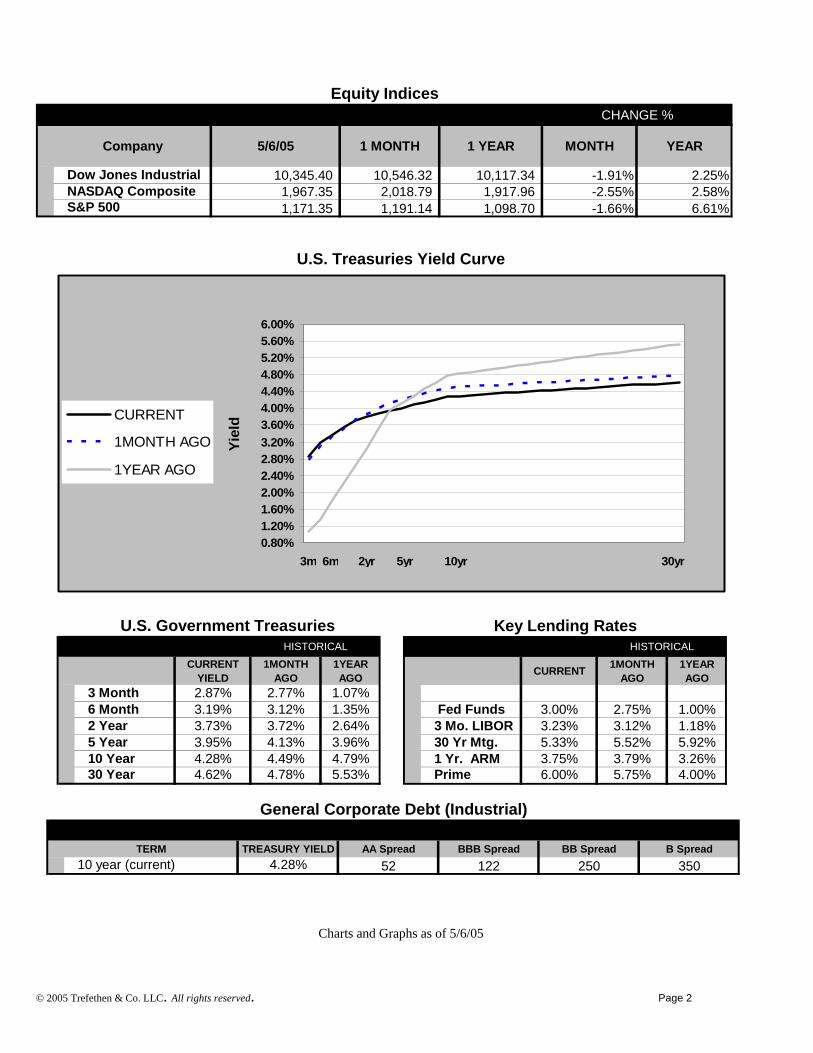
U.S. Treasuries Yield Curve
Charts and Graphs as of 5/6/05
Company 5/6/05 1 MONTH 1 YEAR MONTH YEAR
Dow Jones Industrial 10,345.40 10,546.32 10,117.34 -1.91% 2.25%NASDAQ Composite 1,967.35 2,018.79 1,917.96 -2.55% 2.58%S&P 500 1,171.35 1,191.14 1,098.70 -1.66% 6.61%
Equity IndicesCHANGE %
0.80%1.20%1.60%2.00%2.40%2.80%3.20%3.60%4.00%4.40%4.80%5.20%5.60%6.00%
Yiel
dCURRENT
1MONTH AGO
1YEAR AGO
3m 6m 2yr 5yr 10yr 30yr
CURRENT YIELD
1MONTH AGO
1YEAR AGO
3 Month 2.87% 2.77% 1.07%6 Month 3.19% 3.12% 1.35%2 Year 3.73% 3.72% 2.64%5 Year 3.95% 4.13% 3.96%10 Year 4.28% 4.49% 4.79%30 Year 4.62% 4.78% 5.53%
HISTORICAL
U.S. Government Treasuries
CURRENT 1MONTH AGO
1YEAR AGO
Fed Funds 3.00% 2.75% 1.00%3 Mo. LIBOR 3.23% 3.12% 1.18%30 Yr Mtg. 5.33% 5.52% 5.92%1 Yr. ARM 3.75% 3.79% 3.26%Prime 6.00% 5.75% 4.00%
HISTORICAL
Key Lending Rates
TERM TREASURY YIELD AA Spread BBB Spread BB Spread B Spread10 year (current) 4.28% 52 122 250 350
General Corporate Debt (Industrial)
© 2005 Trefethen & Co. LLC. All rights reserved. Page 3
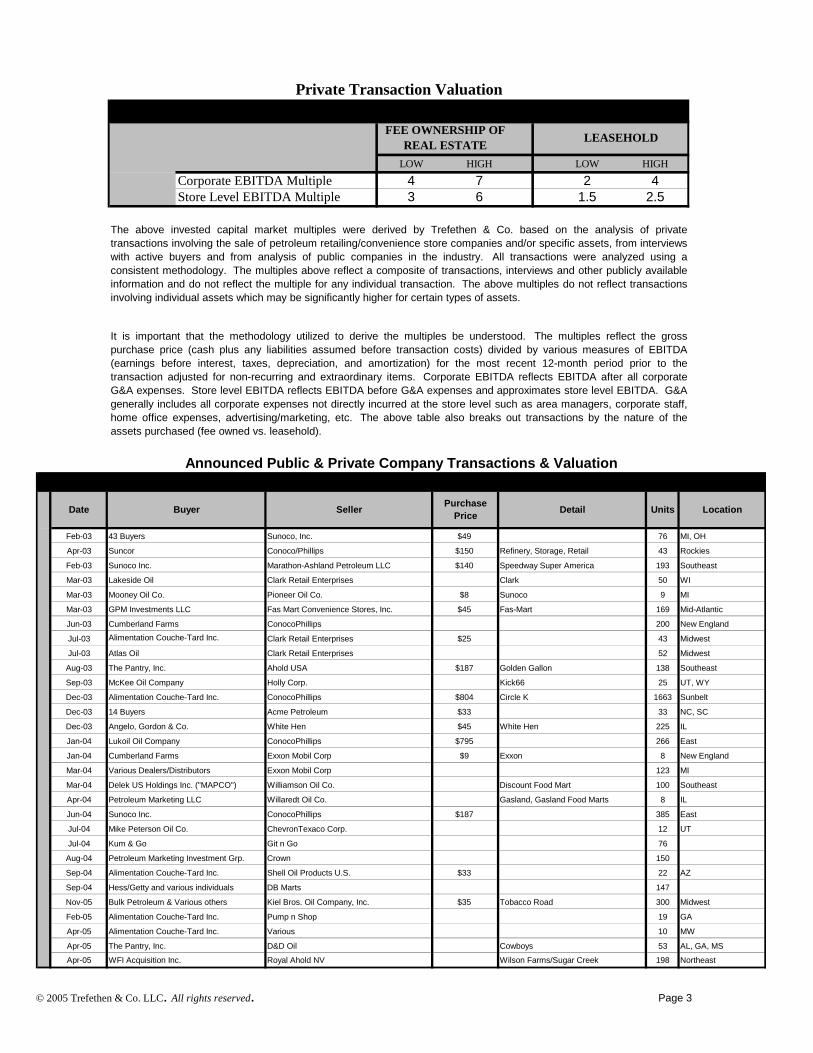
LOW HIGH LOW HIGH
Corporate EBITDA Multiple 4 7 2 4Store Level EBITDA Multiple 3 6 1.5 2.5
Private Transaction Valuation
It is important that the methodology utilized to derive the multiples be understood. The multiples reflect the grosspurchase price (cash plus any liabilities assumed before transaction costs) divided by various measures of EBITDA(earnings before interest, taxes, depreciation, and amortization) for the most recent 12-month period prior to thetransaction adjusted for non-recurring and extraordinary items. Corporate EBITDA reflects EBITDA after all corporateG&A expenses. Store level EBITDA reflects EBITDA before G&A expenses and approximates store level EBITDA. G&Agenerally includes all corporate expenses not directly incurred at the store level such as area managers, corporate staff,home office expenses, advertising/marketing, etc. The above table also breaks out transactions by the nature of theassets purchased (fee owned vs. leasehold).
LEASEHOLDFEE OWNERSHIP OF REAL ESTATE
The above invested capital market multiples were derived by Trefethen & Co. based on the analysis of privatetransactions involving the sale of petroleum retailing/convenience store companies and/or specific assets, from interviewswith active buyers and from analysis of public companies in the industry. All transactions were analyzed using aconsistent methodology. The multiples above reflect a composite of transactions, interviews and other publicly availableinformation and do not reflect the multiple for any individual transaction. The above multiples do not reflect transactionsinvolving individual assets which may be significantly higher for certain types of assets.
Date Buyer Seller Purchase Price Detail Units Location
Feb-03 43 Buyers Sunoco, Inc. $49 76 MI, OH
Apr-03 Suncor Conoco/Phillips $150 Refinery, Storage, Retail 43 Rockies
Feb-03 Sunoco Inc. Marathon-Ashland Petroleum LLC $140 Speedway Super America 193 Southeast
Mar-03 Lakeside Oil Clark Retail Enterprises Clark 50 WI
Mar-03 Mooney Oil Co. Pioneer Oil Co. $8 Sunoco 9 MI
Mar-03 GPM Investments LLC Fas Mart Convenience Stores, Inc. $45 Fas-Mart 169 Mid-Atlantic
Jun-03 Cumberland Farms ConocoPhillips 200 New England
Jul-03 Alimentation Couche-Tard Inc. Clark Retail Enterprises $25 43 Midwest
Jul-03 Atlas Oil Clark Retail Enterprises 52 Midwest
Aug-03 The Pantry, Inc. Ahold USA $187 Golden Gallon 138 Southeast
Sep-03 McKee Oil Company Holly Corp. Kick66 25 UT, WY
Dec-03 Alimentation Couche-Tard Inc. ConocoPhillips $804 Circle K 1663 Sunbelt
Dec-03 14 Buyers Acme Petroleum $33 33 NC, SC
Dec-03 Angelo, Gordon & Co. White Hen $45 White Hen 225 IL
Jan-04 Lukoil Oil Company ConocoPhillips $795 266 East
Jan-04 Cumberland Farms Exxon Mobil Corp $9 Exxon 8 New England
Mar-04 Various Dealers/Distributors Exxon Mobil Corp 123 MI
Mar-04 Delek US Holdings Inc. ("MAPCO") Williamson Oil Co. Discount Food Mart 100 Southeast
Apr-04 Petroleum Marketing LLC Willaredt Oil Co. Gasland, Gasland Food Marts 8 IL
Jun-04 Sunoco Inc. ConocoPhillips $187 385 East
Jul-04 Mike Peterson Oil Co. ChevronTexaco Corp. 12 UT
Jul-04 Kum & Go Git n Go 76
Aug-04 Petroleum Marketing Investment Grp. Crown 150
Sep-04 Alimentation Couche-Tard Inc. Shell Oil Products U.S. $33 22 AZ
Sep-04 Hess/Getty and various individuals DB Marts 147
Nov-05 Bulk Petroleum & Various others Kiel Bros. Oil Company, Inc. $35 Tobacco Road 300 Midwest
Feb-05 Alimentation Couche-Tard Inc. Pump n Shop 19 GA
Apr-05 Alimentation Couche-Tard Inc. Various 10 MW
Apr-05 The Pantry, Inc. D&D Oil Cowboys 53 AL, GA, MS
Apr-05 WFI Acquisition Inc. Royal Ahold NV Wilson Farms/Sugar Creek 198 Northeast
Announced Public & Private Company Transactions & Valuation
© 2005 Trefethen & Co. LLC. All rights reserved. Page 4
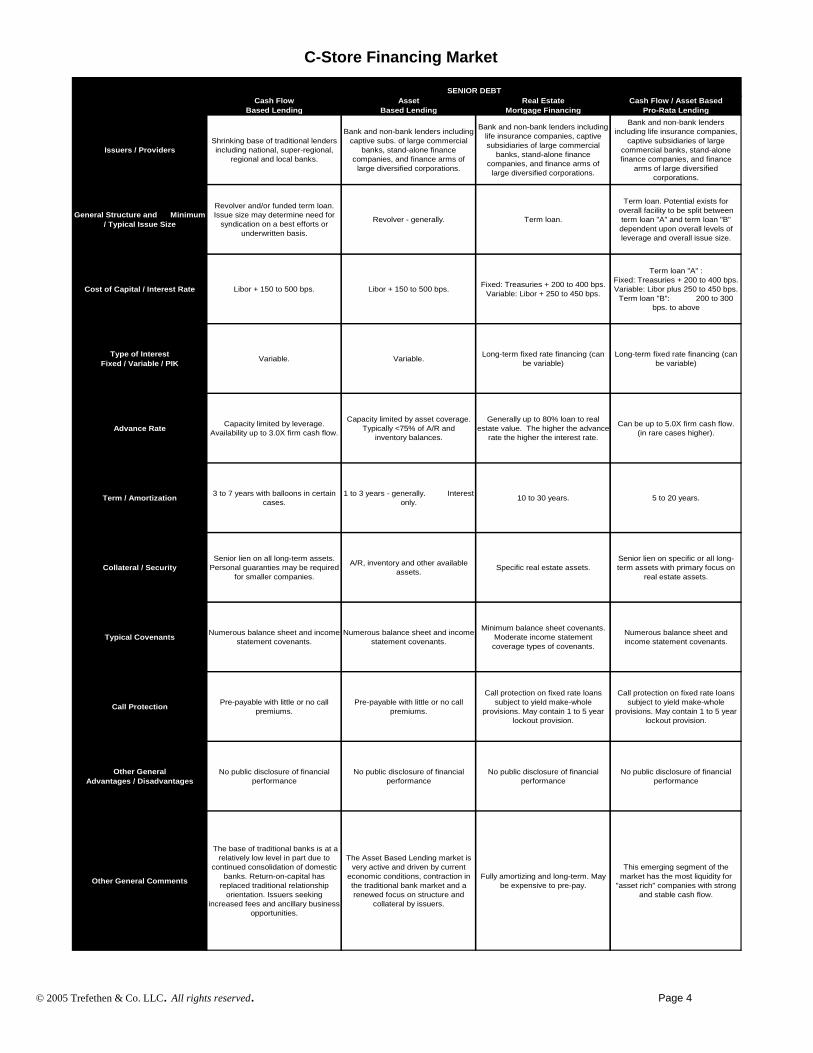
C-Store Financing Market
Issuers / ProvidersShrinking base of traditional lenders including national, super-regional,
regional and local banks.
Bank and non-bank lenders including captive subs. of large commercial
banks, stand-alone finance companies, and finance arms of
large diversified corporations.
Bank and non-bank lenders including life insurance companies, captive subsidiaries of large commercial
banks, stand-alone finance companies, and finance arms of
large diversified corporations.
Bank and non-bank lenders including life insurance companies,
captive subsidiaries of large commercial banks, stand-alone finance companies, and finance
arms of large diversified corporations.
General Structure and Minimum / Typical Issue Size
Revolver and/or funded term loan. Issue size may determine need for
syndication on a best efforts or underwritten basis.
Revolver - generally. Term loan.
Term loan. Potential exists for overall facility to be split between term loan "A" and term loan "B" dependent upon overall levels of leverage and overall issue size.
Cost of Capital / Interest Rate Libor + 150 to 500 bps. Libor + 150 to 500 bps. Fixed: Treasuries + 200 to 400 bps. Variable: Libor + 250 to 450 bps.
Term loan "A" : Fixed: Treasuries + 200 to 400 bps. Variable: Libor plus 250 to 450 bps.
Term loan "B": 200 to 300 bps. to above
Type of Interest Fixed / Variable / PIK Variable. Variable. Long-term fixed rate financing (can
be variable)Long-term fixed rate financing (can
be variable)
Advance Rate Capacity limited by leverage. Availability up to 3.0X firm cash flow.
Capacity limited by asset coverage. Typically <75% of A/R and
inventory balances.
Generally up to 80% loan to real estate value. The higher the advance
rate the higher the interest rate.
Can be up to 5.0X firm cash flow. (in rare cases higher).
Term / Amortization 3 to 7 years with balloons in certain cases.
1 to 3 years - generally. Interest only. 10 to 30 years. 5 to 20 years.
Collateral / SecuritySenior lien on all long-term assets.
Personal guaranties may be required for smaller companies.
A/R, inventory and other available assets. Specific real estate assets.
Senior lien on specific or all long-term assets with primary focus on
real estate assets.
Typical Covenants Numerous balance sheet and income statement covenants.
Numerous balance sheet and income statement covenants.
Minimum balance sheet covenants. Moderate income statement coverage types of covenants.
Numerous balance sheet and income statement covenants.
Call Protection Pre-payable with little or no call premiums.
Pre-payable with little or no call premiums.
Call protection on fixed rate loans subject to yield make-whole
provisions. May contain 1 to 5 year lockout provision.
Call protection on fixed rate loans subject to yield make-whole
provisions. May contain 1 to 5 year lockout provision.
Other General Advantages / Disadvantages
No public disclosure of financial performance
No public disclosure of financial performance
No public disclosure of financial performance
No public disclosure of financial performance
Other General Comments
The base of traditional banks is at a relatively low level in part due to
continued consolidation of domestic banks. Return-on-capital has
replaced traditional relationship orientation. Issuers seeking
increased fees and ancillary business opportunities.
The Asset Based Lending market is very active and driven by current
economic conditions, contraction in the traditional bank market and a renewed focus on structure and
collateral by issuers.
Fully amortizing and long-term. May be expensive to pre-pay.
This emerging segment of the market has the most liquidity for
"asset rich" companies with strong and stable cash flow.
SENIOR DEBTCash Flow
Based LendingAsset
Based LendingReal Estate
Mortgage FinancingCash Flow / Asset Based
Pro-Rata Lending
© 2005 Trefethen & Co. LLC. All rights reserved. Page 5
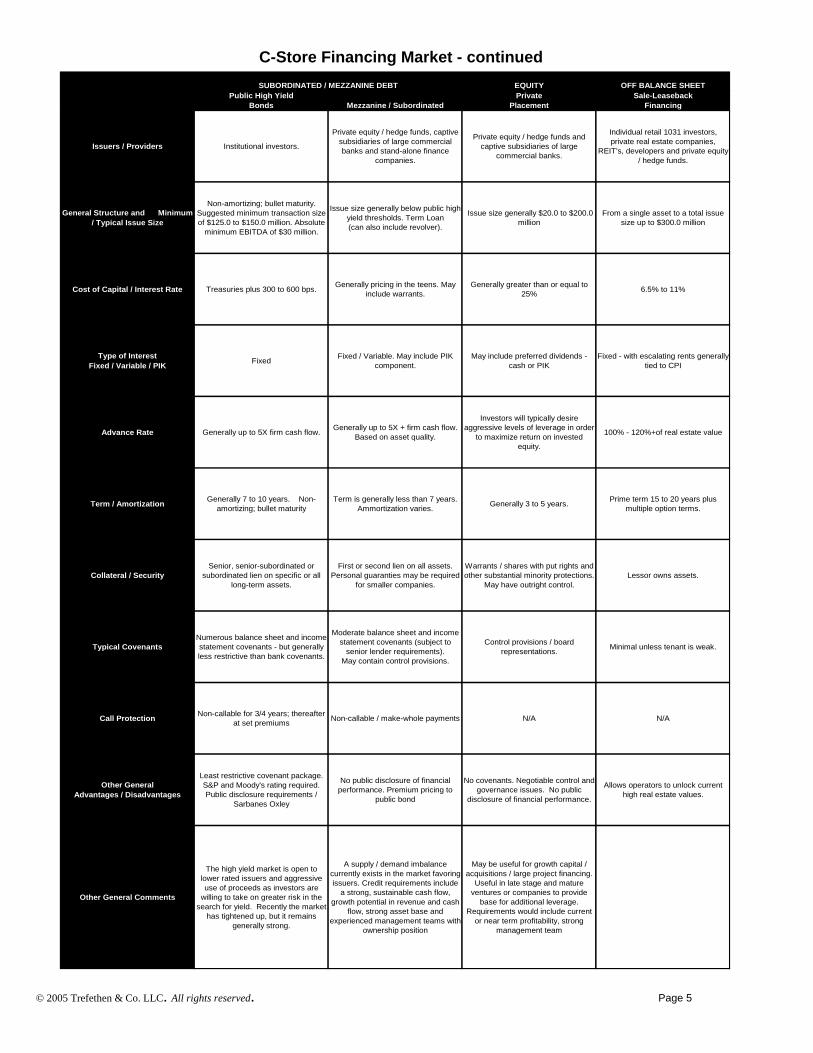
C-Store Financing Market - continued
EQUITY OFF BALANCE SHEET
Issuers / Providers Institutional investors.
Private equity / hedge funds, captive subsidiaries of large commercial banks and stand-alone finance
companies.
Private equity / hedge funds and captive subsidiaries of large
commercial banks.
Individual retail 1031 investors, private real estate companies,
REIT's, developers and private equity / hedge funds.
General Structure and Minimum / Typical Issue Size
Non-amortizing; bullet maturity. Suggested minimum transaction size of $125.0 to $150.0 million. Absolute
minimum EBITDA of $30 million.
Issue size generally below public high yield thresholds. Term Loan (can also include revolver).
Issue size generally $20.0 to $200.0 million
From a single asset to a total issue size up to $300.0 million
Cost of Capital / Interest Rate Treasuries plus 300 to 600 bps. Generally pricing in the teens. May include warrants.
Generally greater than or equal to 25% 6.5% to 11%
Type of Interest Fixed / Variable / PIK Fixed Fixed / Variable. May include PIK
component.May include preferred dividends -
cash or PIKFixed - with escalating rents generally
tied to CPI
Advance Rate Generally up to 5X firm cash flow. Generally up to 5X + firm cash flow. Based on asset quality.
Investors will typically desire aggressive levels of leverage in order
to maximize return on invested equity.
100% - 120%+of real estate value
Term / Amortization Generally 7 to 10 years. Non-amortizing; bullet maturity
Term is generally less than 7 years. Ammortization varies. Generally 3 to 5 years. Prime term 15 to 20 years plus
multiple option terms.
Collateral / SecuritySenior, senior-subordinated or
subordinated lien on specific or all long-term assets.
First or second lien on all assets. Personal guaranties may be required
for smaller companies.
Warrants / shares with put rights and other substantial minority protections.
May have outright control.Lessor owns assets.
Typical CovenantsNumerous balance sheet and income statement covenants - but generally less restrictive than bank covenants.
Moderate balance sheet and income statement covenants (subject to
senior lender requirements). May contain control provisions.
Control provisions / board representations. Minimal unless tenant is weak.
Call Protection Non-callable for 3/4 years; thereafter at set premiums Non-callable / make-whole payments N/A N/A
Other General Advantages / Disadvantages
Least restrictive covenant package. S&P and Moody's rating required. Public disclosure requirements /
Sarbanes Oxley
No public disclosure of financial performance. Premium pricing to
public bond
No covenants. Negotiable control and governance issues. No public
disclosure of financial performance.
Allows operators to unlock current high real estate values.
Other General Comments
The high yield market is open to lower rated issuers and aggressive use of proceeds as investors are
willing to take on greater risk in the search for yield. Recently the market
has tightened up, but it remains generally strong.
A supply / demand imbalance currently exists in the market favoring issuers. Credit requirements include
a strong, sustainable cash flow, growth potential in revenue and cash
flow, strong asset base and experienced management teams with
ownership position
May be useful for growth capital / acquisitions / large project financing.
Useful in late stage and mature ventures or companies to provide
base for additional leverage. Requirements would include current
or near term profitability, strong management team
Private Placement
Sale-Leaseback Financing
SUBORDINATED / MEZZANINE DEBTPublic High Yield
Bonds Mezzanine / Subordinated
© 2005 Trefethen & Co. LLC. All rights reserved. Page 6
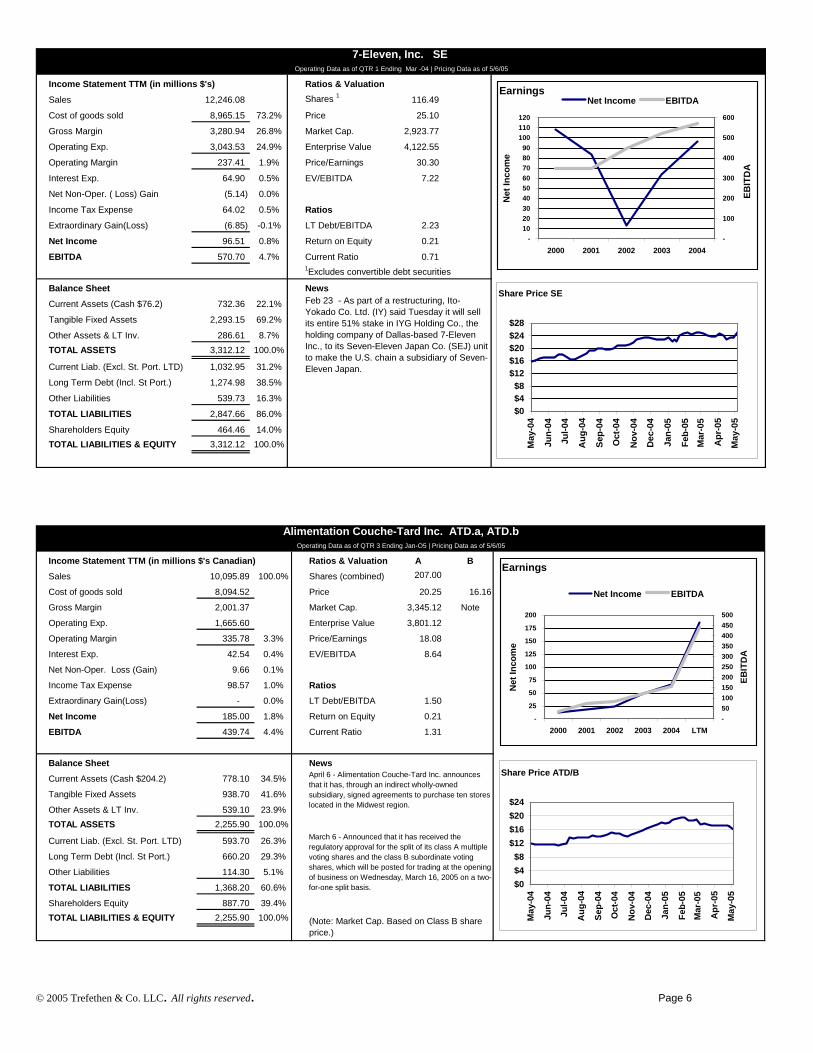
Income Statement TTM (in millions $'s Canadian) Ratios & Valuation A B
Sales 10,095.89 100.0% Shares (combined) 207.00
Cost of goods sold 8,094.52 Price 20.25 16.16
Gross Margin 2,001.37 Market Cap. 3,345.12 Note
Operating Exp. 1,665.60 Enterprise Value 3,801.12
Operating Margin 335.78 3.3% Price/Earnings 18.08
Interest Exp. 42.54 0.4% EV/EBITDA 8.64
Net Non-Oper. Loss (Gain) 9.66 0.1%
Income Tax Expense 98.57 1.0% Ratios
Extraordinary Gain(Loss) - 0.0% LT Debt/EBITDA 1.50
Net Income 185.00 1.8% Return on Equity 0.21
EBITDA 439.74 4.4% Current Ratio 1.31
Balance Sheet News
Current Assets (Cash $204.2) 778.10 34.5%
Tangible Fixed Assets 938.70 41.6%
Other Assets & LT Inv. 539.10 23.9%TOTAL ASSETS 2,255.90 100.0%
Current Liab. (Excl. St. Port. LTD) 593.70 26.3%
Long Term Debt (Incl. St Port.) 660.20 29.3%
Other Liabilities 114.30 5.1%
TOTAL LIABILITIES 1,368.20 60.6%
Shareholders Equity 887.70 39.4%TOTAL LIABILITIES & EQUITY 2,255.90 100.0%
Operating Data as of QTR 3 Ending Jan-O5 | Pricing Data as of 5/6/05
Alimentation Couche-Tard Inc. ATD.a, ATD.b
(Note: Market Cap. Based on Class B share price.)
April 6 - Alimentation Couche-Tard Inc. announces that it has, through an indirect wholly-owned subsidiary, signed agreements to purchase ten stores located in the Midwest region.
March 6 - Announced that it has received the regulatory approval for the split of its class A multiple voting shares and the class B subordinate voting shares, which will be posted for trading at the opening of business on Wednesday, March 16, 2005 on a two-for-one split basis.
Earnings
-
25
50
75
100
125
150
175
200
2000 2001 2002 2003 2004 LTM
Net
Inco
me
-50100150200250300350400450500
EBIT
DA
Net Income EBITDA
Share Price ATD/B
$0$4$8
$12$16$20$24
May
-04
Jun-
04
Jul-0
4
Aug
-04
Sep-
04
Oct
-04
Nov
-04
Dec
-04
Jan-
05
Feb-
05M
ar-0
5
Apr
-05
May
-05
Income Statement TTM (in millions $'s) Ratios & Valuation
Sales 12,246.08 Shares 1 116.49
Cost of goods sold 8,965.15 73.2% Price 25.10
Gross Margin 3,280.94 26.8% Market Cap. 2,923.77
Operating Exp. 3,043.53 24.9% Enterprise Value 4,122.55
Operating Margin 237.41 1.9% Price/Earnings 30.30
Interest Exp. 64.90 0.5% EV/EBITDA 7.22
Net Non-Oper. ( Loss) Gain (5.14) 0.0%
Income Tax Expense 64.02 0.5% Ratios
Extraordinary Gain(Loss) (6.85) -0.1% LT Debt/EBITDA 2.23
Net Income 96.51 0.8% Return on Equity 0.21
EBITDA 570.70 4.7% Current Ratio 0.71 1Excludes convertible debt securities
Balance Sheet News
Current Assets (Cash $76.2) 732.36 22.1%
Tangible Fixed Assets 2,293.15 69.2%
Other Assets & LT Inv. 286.61 8.7%TOTAL ASSETS 3,312.12 100.0%
Current Liab. (Excl. St. Port. LTD) 1,032.95 31.2%
Long Term Debt (Incl. St Port.) 1,274.98 38.5%
Other Liabilities 539.73 16.3%
TOTAL LIABILITIES 2,847.66 86.0%
Shareholders Equity 464.46 14.0%TOTAL LIABILITIES & EQUITY 3,312.12 100.0%
7-Eleven, Inc. SE Operating Data as of QTR 1 Ending Mar -04 | Pricing Data as of 5/6/05
Feb 23 - As part of a restructuring, Ito-Yokado Co. Ltd. (IY) said Tuesday it will sell its entire 51% stake in IYG Holding Co., the holding company of Dallas-based 7-Eleven Inc., to its Seven-Eleven Japan Co. (SEJ) unit to make the U.S. chain a subsidiary of Seven-Eleven Japan.
Earnings
-102030405060708090
100110120
2000 2001 2002 2003 2004
Net
Inco
me
-
100
200
300
400
500
600
EBIT
DA
Net Income EBITDA
Share Price SE
$0$4$8
$12$16$20$24$28
May
-04
Jun-
04
Jul-0
4
Aug
-04
Sep-
04
Oct
-04
Nov
-04
Dec
-04
Jan-
05
Feb-
05M
ar-0
5
Apr
-05
May
-05
© 2005 Trefethen & Co. LLC. All rights reserved. Page 7
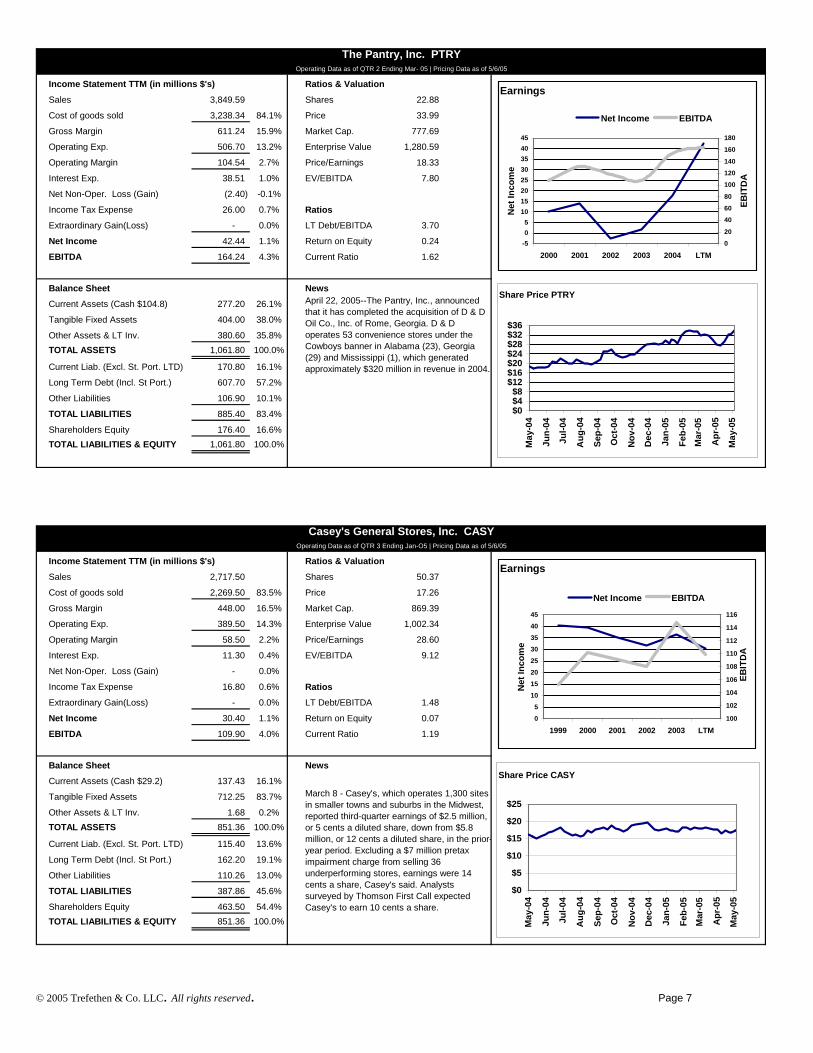
Income Statement TTM (in millions $'s) Ratios & Valuation
Sales 2,717.50 Shares 50.37
Cost of goods sold 2,269.50 83.5% Price 17.26
Gross Margin 448.00 16.5% Market Cap. 869.39
Operating Exp. 389.50 14.3% Enterprise Value 1,002.34
Operating Margin 58.50 2.2% Price/Earnings 28.60
Interest Exp. 11.30 0.4% EV/EBITDA 9.12
Net Non-Oper. Loss (Gain) - 0.0%
Income Tax Expense 16.80 0.6% Ratios
Extraordinary Gain(Loss) - 0.0% LT Debt/EBITDA 1.48
Net Income 30.40 1.1% Return on Equity 0.07
EBITDA 109.90 4.0% Current Ratio 1.19
Balance Sheet News
Current Assets (Cash $29.2) 137.43 16.1%
Tangible Fixed Assets 712.25 83.7%
Other Assets & LT Inv. 1.68 0.2%TOTAL ASSETS 851.36 100.0%
Current Liab. (Excl. St. Port. LTD) 115.40 13.6%
Long Term Debt (Incl. St Port.) 162.20 19.1%
Other Liabilities 110.26 13.0%
TOTAL LIABILITIES 387.86 45.6%
Shareholders Equity 463.50 54.4%TOTAL LIABILITIES & EQUITY 851.36 100.0%
Operating Data as of QTR 3 Ending Jan-O5 | Pricing Data as of 5/6/05
Casey's General Stores, Inc. CASY
March 8 - Casey's, which operates 1,300 sites in smaller towns and suburbs in the Midwest, reported third-quarter earnings of $2.5 million, or 5 cents a diluted share, down from $5.8 million, or 12 cents a diluted share, in the prior-year period. Excluding a $7 million pretax impairment charge from selling 36 underperforming stores, earnings were 14 cents a share, Casey's said. Analysts surveyed by Thomson First Call expected Casey's to earn 10 cents a share.
Earnings
05
1015202530354045
1999 2000 2001 2002 2003 LTM
Net
Inco
me
100
102
104
106
108
110
112
114
116
EBIT
DA
Net Income EBITDA
Share Price CASY
$0
$5
$10
$15
$20
$25
May
-04
Jun-
04
Jul-0
4
Aug
-04
Sep-
04
Oct
-04
Nov
-04
Dec
-04
Jan-
05
Feb-
05
Mar
-05
Apr
-05
May
-05
Income Statement TTM (in millions $'s) Ratios & Valuation
Sales 3,849.59 Shares 22.88
Cost of goods sold 3,238.34 84.1% Price 33.99
Gross Margin 611.24 15.9% Market Cap. 777.69
Operating Exp. 506.70 13.2% Enterprise Value 1,280.59
Operating Margin 104.54 2.7% Price/Earnings 18.33
Interest Exp. 38.51 1.0% EV/EBITDA 7.80
Net Non-Oper. Loss (Gain) (2.40) -0.1%
Income Tax Expense 26.00 0.7% Ratios
Extraordinary Gain(Loss) - 0.0% LT Debt/EBITDA 3.70
Net Income 42.44 1.1% Return on Equity 0.24
EBITDA 164.24 4.3% Current Ratio 1.62
Balance Sheet News
Current Assets (Cash $104.8) 277.20 26.1%
Tangible Fixed Assets 404.00 38.0%
Other Assets & LT Inv. 380.60 35.8%TOTAL ASSETS 1,061.80 100.0%
Current Liab. (Excl. St. Port. LTD) 170.80 16.1%
Long Term Debt (Incl. St Port.) 607.70 57.2%
Other Liabilities 106.90 10.1%
TOTAL LIABILITIES 885.40 83.4%
Shareholders Equity 176.40 16.6%TOTAL LIABILITIES & EQUITY 1,061.80 100.0%
The Pantry, Inc. PTRYOperating Data as of QTR 2 Ending Mar- 05 | Pricing Data as of 5/6/05
April 22, 2005--The Pantry, Inc., announced that it has completed the acquisition of D & D Oil Co., Inc. of Rome, Georgia. D & D operates 53 convenience stores under the Cowboys banner in Alabama (23), Georgia (29) and Mississippi (1), which generated approximately $320 million in revenue in 2004.
Earnings
-505
1015202530354045
2000 2001 2002 2003 2004 LTM
Net
Inco
me
0
20
40
60
80
100
120
140
160
180
EBIT
DA
Net Income EBITDA
Share Price PTRY
$0$4$8
$12$16$20$24$28$32$36
May
-04
Jun-
04
Jul-0
4
Aug
-04
Sep-
04
Oct
-04
Nov
-04
Dec
-04
Jan-
05
Feb-
05M
ar-0
5
Apr
-05
May
-05
© 2005 Trefethen & Co. LLC. All rights reserved. Page 8
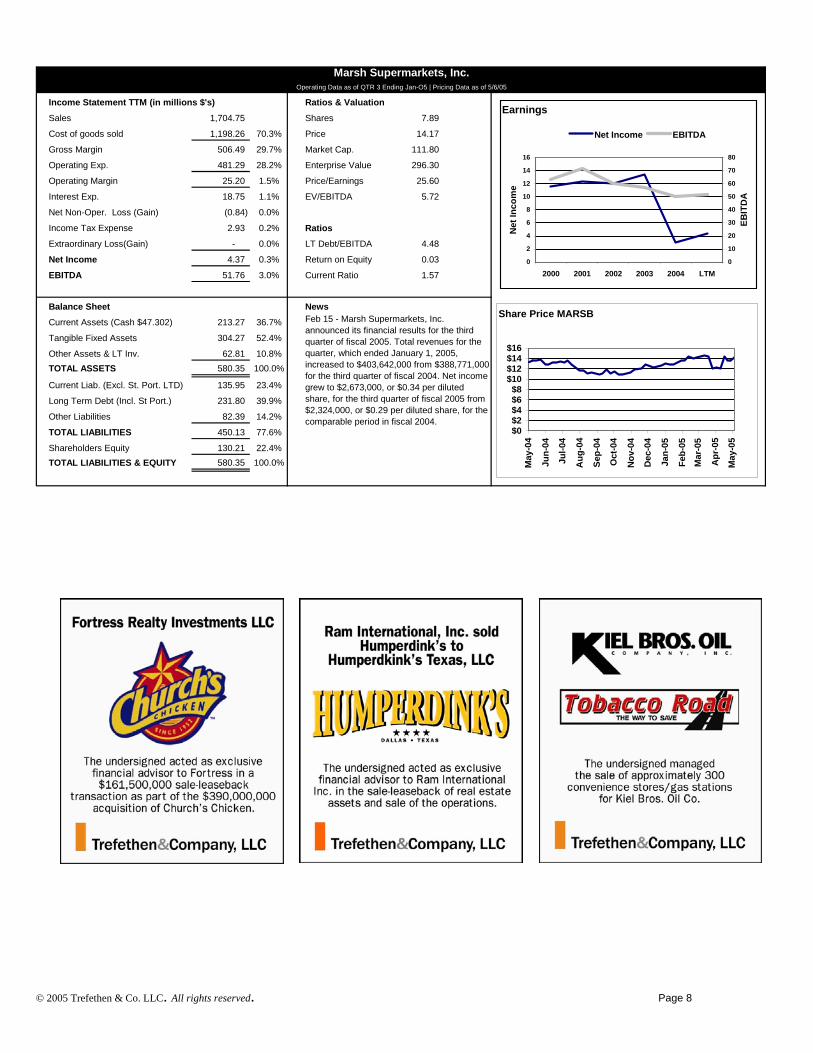
Income Statement TTM (in millions $'s) Ratios & Valuation
Sales 1,704.75 Shares 7.89
Cost of goods sold 1,198.26 70.3% Price 14.17
Gross Margin 506.49 29.7% Market Cap. 111.80
Operating Exp. 481.29 28.2% Enterprise Value 296.30
Operating Margin 25.20 1.5% Price/Earnings 25.60
Interest Exp. 18.75 1.1% EV/EBITDA 5.72
Net Non-Oper. Loss (Gain) (0.84) 0.0%
Income Tax Expense 2.93 0.2% Ratios
Extraordinary Loss(Gain) - 0.0% LT Debt/EBITDA 4.48
Net Income 4.37 0.3% Return on Equity 0.03
EBITDA 51.76 3.0% Current Ratio 1.57
Balance Sheet News
Current Assets (Cash $47.302) 213.27 36.7%
Tangible Fixed Assets 304.27 52.4%
Other Assets & LT Inv. 62.81 10.8%TOTAL ASSETS 580.35 100.0%
Current Liab. (Excl. St. Port. LTD) 135.95 23.4%
Long Term Debt (Incl. St Port.) 231.80 39.9%
Other Liabilities 82.39 14.2%
TOTAL LIABILITIES 450.13 77.6%
Shareholders Equity 130.21 22.4%TOTAL LIABILITIES & EQUITY 580.35 100.0%
Marsh Supermarkets, Inc.Operating Data as of QTR 3 Ending Jan-O5 | Pricing Data as of 5/6/05
Feb 15 - Marsh Supermarkets, Inc. announced its financial results for the third quarter of fiscal 2005. Total revenues for the quarter, which ended January 1, 2005, increased to $403,642,000 from $388,771,000 for the third quarter of fiscal 2004. Net income grew to $2,673,000, or $0.34 per diluted share, for the third quarter of fiscal 2005 from $2,324,000, or $0.29 per diluted share, for the comparable period in fiscal 2004.
Earnings
0
2
4
6
8
10
12
14
16
2000 2001 2002 2003 2004 LTM
Net
Inco
me
0
10
20
30
40
50
60
70
80
EBIT
DA
Net Income EBITDA
Share Price MARSB
$0$2$4$6$8
$10$12$14$16
May
-04
Jun-
04
Jul-0
4
Aug
-04
Sep-
04
Oct
-04
Nov
-04
Dec
-04
Jan-
05
Feb-
05
Mar
-05
Apr
-05
May
-05
© 2005 Trefethen & Co. LLC. All rights reserved. Page 9
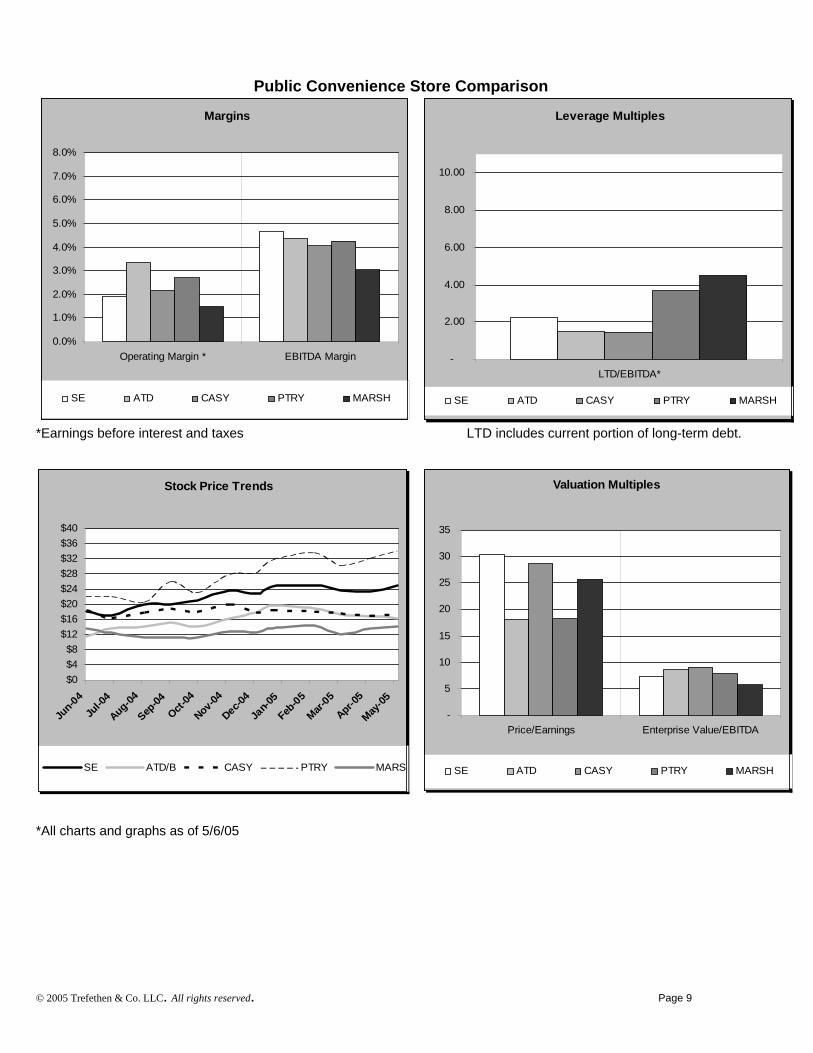
Public Convenience Store Comparison *Earnings before interest and taxes LTD includes current portion of long-term debt. *All charts and graphs as of 5/6/05
Margins
0.0%
1.0%
2.0%
3.0%
4.0%
5.0%
6.0%
7.0%
8.0%
Operating Margin * EBITDA Margin
SE ATD CASY PTRY MARSH
Leverage Multiples
-
2.00
4.00
6.00
8.00
10.00
LTD/EBITDA*
SE ATD CASY PTRY MARSH
Valuation Multiples
-
5
10
15
20
25
30
35
Price/Earnings Enterprise Value/EBITDA
SE ATD CASY PTRY MARSH
Stock Price Trends
$0$4$8
$12$16$20$24$28$32$36$40
Jun-04
Jul-0
4
Aug-04
Sep-04
Oct-04
Nov-04
Dec-04
Jan-0
5
Feb-05
Mar-05
Apr-05
May-05
SE ATD/B CASY PTRY MARS
© 2005 Trefethen & Co. LLC. All rights reserved. Page 10
Continued From Page 1 Earnings Releases: The Pantry, Inc. The Pantry, Inc. reported earnings for the second quarter ending March 31, 2005. Revenues for the second quarter totaled $945.8 million, a 20.3% increase from $786.4 million in the corresponding period a year ago. Net income for the quarter was $3.8 million, or $0.18 per diluted share, compared with a net loss on a GAAP basis of $14.1 million, or $0.71 per share, in last year's second quarter. Results for the year-ago period included $0.72 per share in early debt extinguishment costs, as well as $0.02 per share in expenses related to a secondary stock offering. In addition, there was duplicate interest expense of $0.05 per share on two issues of senior subordinated notes for a one-month period when both were outstanding. Net income excluding these financing-related items for the second quarter of fiscal 2004 was $1.6 million, or $0.08 per share; net income and earnings per share in the fiscal 2005 period were more than double the adjusted results for the year-ago quarter. Merchandise revenue for the quarter was up 6.6% on a comparable store basis. The merchandise gross margin of 37.2% increased 40 basis points from a year ago. Total merchandise gross profits rose 6.3% to $105.7 million, and accounted for approximately 76% of the Company's total gross profits. Comparable store gasoline gallons increased 7.7% from a year ago. Gasoline revenues were up 28.1%, partly due to a 19.4% increase in the average retail price per gallon, to $1.91. The gross margin per gallon was 9.9 cents, compared with 10.5 cents in last year's second quarter. Excluding the impact of the increase in credit card fees, gasoline margins per gallon were flat from a year ago. Gasoline gross profits for the quarter totaled $34.1 million, up 1.1% from a year ago. Alimentation Couche-Tard, Inc. Alimentation Couche-Tard, Inc. reported results for the third quarter ended January 30, 2005. Net earnings quintupled to $46.3 million or $0.45 per fully diluted share compared with $8.7 million or $0.09 per fully diluted share. This performance reflects Circle K’s contribution for the full 12 week period and improved merchandise and service gross margins in the total network and a major increase in gasoline gross margin in the U.S operations. In the U.S., growth of average merchandise sales per store (excluding Circle K) was up 10.2.% compared with 4.8% in the same period last year. In Canada the growth was 7.3%. Growth of average fuel volume in the U.S. (excluding Circle K) was 5.5% over the corresponding quarter a year earlier. In Canada growth of average fuel volume was 7.3% over the third quarter of the previous year. Consolidated merchandise and service gross margin was 32.5% versus 32.0% in the third quarter of last year. The Company anticipates that the consolidated merchandise and service gross margin to further improve as the product mix at Circle K stores is gradually optimized. Fuel gross margin in Canada decreased to 4.15 cents per litre over 4.63 per litre for the same period of the prior year. In the U.S., the fuel gross margin stood at 16.3 cents per gallon over 10.43 cents in the prior year. Casey’s General Stores Inc. Casey’s General Stores Inc. reported earnings for the third quarter ended January 31, 2005. Basic earnings per share for the quarter decreased to $0.05 from $0.12 for the same period last year. The prior year included $0.05 per share of one time tax benefits and the current year includes a $0.09 per share impairment charge for the closing of 36 underperforming stores. Excluding the impairment charge EPS would have been $0.14 per share. Gasoline gallons sold increased 5% and gasoline margin per gallon stood at $.102. Same store sales for grocery & other merchandise was up 6.7% and the margin was 31.2%. Prepared food and fountain same store sales increased 8.9% with an average margin of 61.1%. 7 Eleven Inc. 7-Eleven Inc. reported earnings for the first quarter ending March 31, 2005. Core earnings, which exclude non-operating items, grew to $15.1 million, or $0.13 per diluted share, for the quarter ended March 31, 2005. This compares to core earnings of $12.9 million, or $0.11 per diluted share, for the first quarter of 2004. First quarter net earnings for 2005 were $20.9 million, or $0.18 per diluted share, compared to net earnings of $4.1 million, or $0.04 per diluted share, in the same quarter a year ago. Gasoline gallons were 544.5 million for the first quarter of 2005, or basically flat with the first quarter of 2004. Average gallons sold per store for the quarter grew 0.8 percent, on top of a 6.5 percent increase in the first quarter of 2004. Gasoline gross profit was $68.3 million, a 4.3 percent decrease from the first quarter of 2004. Expressed as cents per gallon, the gasoline margin was 12.5 cents in the first quarter of 2005 compared to 13.1 cents in the first quarter of 2004. For the first quarter, merchandise gross profit grew 6.8 percent to $671.9 million. Merchandise gross profit margin increased by 59 basis points to 35.86 percent compared to the prior-year quarter. This increase was primarily due to favorable changes in mix.
© 2005 Trefethen & Co. LLC. All rights reserved. Page 11
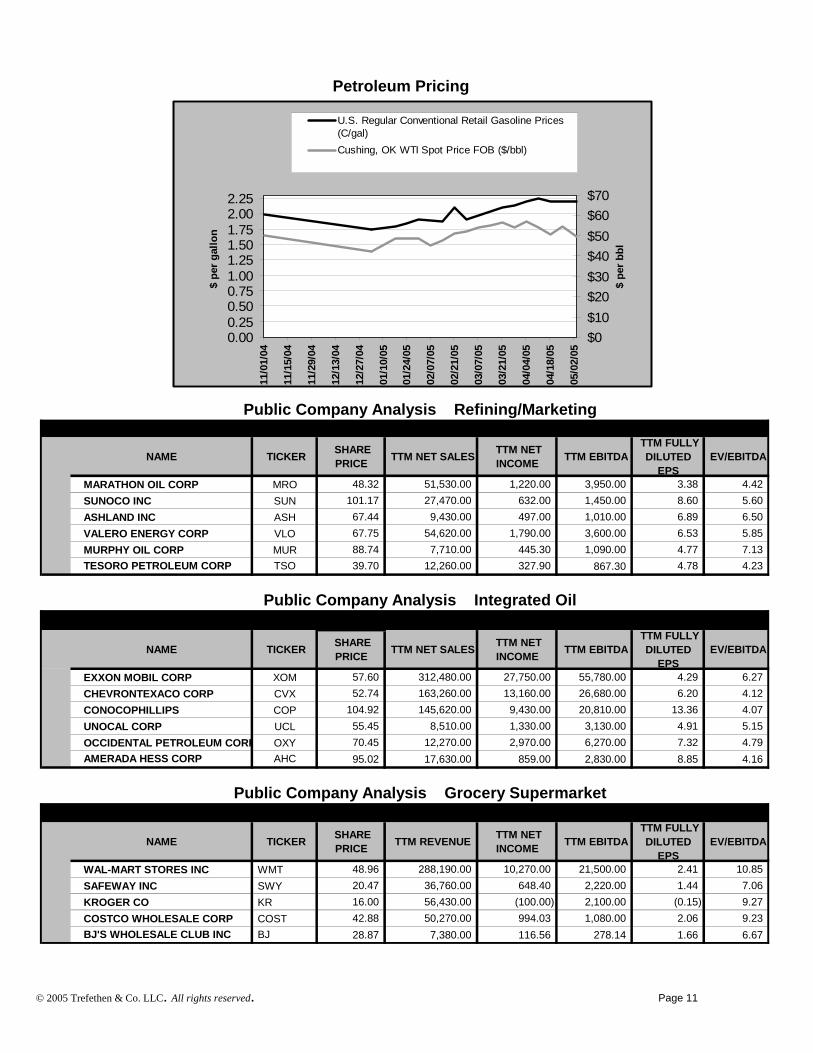
Petroleum Pricing
0.000.250.500.751.001.251.501.752.002.25
11/0
1/04
11/1
5/04
11/2
9/04
12/1
3/04
12/2
7/04
01/1
0/05
01/2
4/05
02/0
7/05
02/2
1/05
03/0
7/05
03/2
1/05
04/0
4/05
04/1
8/05
05/0
2/05
$ pe
r gal
lon
$0$10$20$30$40$50$60$70
$ pe
r bbl
U.S. Regular Conventional Retail Gasoline Prices(C/gal)Cushing, OK WTI Spot Price FOB ($/bbl)
NAME TICKER SHARE PRICE TTM NET SALES TTM NET
INCOME TTM EBITDA TTM FULLY
DILUTED EPS
EV/EBITDA
MARATHON OIL CORP MRO 48.32 51,530.00 1,220.00 3,950.00 3.38 4.42 SUNOCO INC SUN 101.17 27,470.00 632.00 1,450.00 8.60 5.60 ASHLAND INC ASH 67.44 9,430.00 497.00 1,010.00 6.89 6.50 VALERO ENERGY CORP VLO 67.75 54,620.00 1,790.00 3,600.00 6.53 5.85 MURPHY OIL CORP MUR 88.74 7,710.00 445.30 1,090.00 4.77 7.13 TESORO PETROLEUM CORP TSO 39.70 12,260.00 327.90 867.30 4.78 4.23
NAME TICKER SHARE PRICE TTM NET SALES TTM NET
INCOME TTM EBITDA TTM FULLY
DILUTED EPS
EV/EBITDA
EXXON MOBIL CORP XOM 57.60 312,480.00 27,750.00 55,780.00 4.29 6.27 CHEVRONTEXACO CORP CVX 52.74 163,260.00 13,160.00 26,680.00 6.20 4.12 CONOCOPHILLIPS COP 104.92 145,620.00 9,430.00 20,810.00 13.36 4.07 UNOCAL CORP UCL 55.45 8,510.00 1,330.00 3,130.00 4.91 5.15 OCCIDENTAL PETROLEUM CORP OXY 70.45 12,270.00 2,970.00 6,270.00 7.32 4.79 AMERADA HESS CORP AHC 95.02 17,630.00 859.00 2,830.00 8.85 4.16
29.55
NAME TICKER SHARE PRICE TTM REVENUE TTM NET
INCOME TTM EBITDA TTM FULLY
DILUTED EPS
EV/EBITDA
WAL-MART STORES INC WMT 48.96 288,190.00 10,270.00 21,500.00 2.41 10.85 SAFEWAY INC SWY 20.47 36,760.00 648.40 2,220.00 1.44 7.06 KROGER CO KR 16.00 56,430.00 (100.00) 2,100.00 (0.15) 9.27 COSTCO WHOLESALE CORP COST 42.88 50,270.00 994.03 1,080.00 2.06 9.23 BJ'S WHOLESALE CLUB INC BJ 28.87 7,380.00 116.56 278.14 1.66 6.67
Public Company Analysis Refining/Marketing
Public Company Analysis Integrated Oil
Public Company Analysis Grocery Supermarket
© 2005 Trefethen & Co. LLC. All rights reserved. Page 12
C o n v e n i e n c e S t o r e ⎟ R e t a i l P e t r o l e u m M a r k e t N e w s
Request Form
NAME: COMPANY: Please send me future copies of the market update Convenience Store & Retail Petroleum Market News
E-MAIL E-MAIL ADDRESS
MAIL ADDRESS Comments & Suggestions: PH 480 | 922-4518
FX 480 | 922-1666 8601 N. Scottsdale Rd., Suite 320 | Scottsdale | AZ 85253 [email protected]
8601 N. Scottsdale Rd., Suite 320 | Scottsdale | AZ 85253 PH (480) 922-4518 FX (480) 922-1666
market update
PRSRTD STD U.S. POSTAGE
PAID ESCONDIDO, CA PERMIT NO.605
Trefethen & Co.

© 2005 Trefethen & Co. LLC. All rights reserved. Page 13
![Chebfun Guide · Chebfun was originally created by Zachary Battles and Nick Trefethen at Oxford during 2002-2005 [Battles & Trefethen 2004]. ... Joris Van Deun, and Georges Klein](https://img.pdfslide.us/doc/110x75/5edb4e8cad6a402d666575a9/chebfun-guide-chebfun-was-originally-created-by-zachary-battles-and-nick-trefethen.jpg)