Embed Size (px)
Citation preview
Acc
epte
d A
rtic
le
‘This article is protected by copyright. All rights reserved.’
Tree diversity is key for promoting the diversity and abundance of forest-
associated taxa in Europe
Evy Ampoorter1, Luc Barbaro2, HervéJactel5, Lander Baeten1,3, Johanna Boberg6, Monique Carnol8,
Bastien Castagneyrol5, Yohan Charbonnier5, Seid Muhie Dawud9, Marc Deconchat2, Pallieter De Smedt1,
Hans De Wandeler10, Virginie Guyot2,4, Stephan Hättenschwiler11, François-Xavier Joly12, Julia
Koricheva13, Harriet Milligan13, Bart Muys10, Diem Nguyen6,7, Sophia Ratcliffe14, Karsten Raulund-
Rasmussen15, Michael Scherer-Lorenzen16, Fons van der Plas14, J. Van Keer17, Kris Verheyen1, Lars
Vesterdal15 and Eric Allan18
1Forest and Nature Lab, Campus Gontrode, Dept of Environment, Ghent Univ., Geraardsbergsesteenweg
267, BE-9090 Melle-Gontrode, Belgium 2DYNAFOR, Univ. de Toulouse, INRA, INPT, INPT-EL PURPAN, Castanet-Tolosan, France 3CESCO, Museum national d'Histoire naturelle, CNRS, Sorbonne-Univ., Paris, France 4Biogeco, INRA, Univ. de Bordeaux, Cestas, France 5Biogeco, INRA, Univ. de Bordeaux, Cestas, France 6Dept of Forest Mycology and Plant Pathology, Swedish Univ. of Agricultural Sciences, Uppsala,
Sweden 7Dept of Organismal Biology, Uppsala Univ., Uppsala, Sweden 8Laboratory of Plant and Microbial Ecology, InBioS, Dept of Biology, Ecology, Evolution, Univ. of
Liège, Liège, Belgium 9Dept of Forestry, College of Agriculture, Wollo Univ., Dessie, Ethiopia 10Dept of Earth and Environmental Sciences, KU Leuven, Leuven, Belgium 11Centre of Evolutionary and Functional Ecology, UMR5175, CNRS – Univ. of Montpellier – Univ. Paul-
Valéry Montpellier – EPHE, 1919, Montpellier, France 12Biological and Environmental Sciences, Univ. of Stirling, Stirling, UK 13School of Biological Sciences, Royal Holloway Univ. of London, Egham, Surrey, UK 14Dept of Systematic Botany and Functional Biodiversity, Univ. of Leipzig, Leipzig, Germany 15Dept of Geosciences and Natural Resource Management, Univ. of Copenhagen, Frederiksberg,
Denmark 16Geobotany, Faculty of Biology, Univ. of Freiburg, Freiburg, Germany 17Kapelle-op-den-Bos, Belgium 18Inst. of Plant Sciences, Univ. of Bern, Bern, Switzerland
Corresponding author: Evy Ampoorter, Forest and Nature Lab, Campus Gontrode, Dept of
Environment, Ghent Univ., Geraardsbergsesteenweg 267, BE-9090 Melle-Gontrode, Belgium. E-mail:
Decision date: 28-Sep-2019
This article has been accepted for publication and undergone full peer review but has not been
through the copyediting, typesetting, pagination and proofreading process, which may lead to
differences between this version and the Version of Record. Please cite this article as doi:
[10.1111/oik.06290].
Acc
epte
d A
rtic
le
‘This article is protected by copyright. All rights reserved.’
Abstract
Plant diversity is an important driver of diversity at other trophic levels, suggesting that
cascading extinctions could reduce overall biodiversity. Most evidence for positive
effects of plant diversity comes from grasslands. Despite the fact that forests are
hotspots of biodiversity, the importance of tree diversity, in particular its relative
importance compared to other management related factors, in affecting forest-associated
taxa is not well known. To address this, we used data from 183 plots, located in
different forest types, from Mediterranean to Boreal, and established along a climatic
gradient across six European countries (FunDivEUROPE project). We tested the
influence of tree diversity, tree functional composition (i.e. functional trait values),
forest structure, climate and soil on the diversity and abundance/activity of nine taxa
(bats, birds, spiders, microorganisms, earthworms, ungulates, foliar fungal pathogens,
defoliating insects and understorey plants) and on their overall diversity and
abundance/activity (multidiversity,multiabundance/activity). Tree diversity was a key
driver of taxon-level and overall forest-associated biodiversity, along with tree
functional composition, forest structure, climate and soil. Both tree species richness and
functional diversity (variation in functional trait values) were important. The effects of
tree diversity on the abundance/activity of forest-associated taxa were less consistent.
Nonetheless, spiders, ungulates and foliar fungal pathogens were all more
abundant/active in diverse forests. Tree functional composition and structure were also
important drivers of abundance/activity: conifer stands had lower overall multidiversity
(although the effect was driven by defoliating insects), while stands with potentially tall
trees had lower overall multiabundance/activity. We found more synergies than trade-
offs between diversity and abundance/activity of different taxa, suggesting that forest
management can promote high diversity across taxa. Our results clearly show the high
value of mixed forest stands for multiple forest-associated taxa and indicate that
multiple dimensions of tree diversity (taxonomic and functional) are important.
Keywords: climate, forest-associated taxa, forest structure, soil conditions, tree
functional composition , tree diversity
Acc
epte
d A
rtic
le
‘This article is protected by copyright. All rights reserved.’
Introduction
Understanding how changes in plant diversity affect the diversity of other trophic groups is of
fundamental interest to understand trophic interactions. It is also crucial to predict cascading extinctions
and the impact of multiple taxa on ecosystem functioning and ecosystem services (Cardinale et al. 2006,
Soliveres et al. 2016). Plant diversity might have bottom-up effects on higher trophic levels and increase
the diversity of consumers, such as herbivores and pathogens, by providing a greater diversity of
resources for specialist consumers, more opportunities for diet mixing for generalist consumers or by
increasing overall resource levels (Siemann 1998, Borer et al. 2012). Several studies have shown that
diverse plant communities support a higher diversity of other taxa living in the same ecosystem
(Castagneyrol and Jactel 2012, Schuldt et al. 2019). However, a lot of these studies have been carried out
in grasslands (Siemann et al. 1998, Haddad et al. 2009, Scherber et al. 2010), while fewer have been
conducted in mature forest stands (Sobek et al. 2009, Cavard et al. 2011, Fornoff et al. 2019). This limits
our knowledge of whether switching from monocultures (the traditional focus of intensive forest
management) to mixed plantings would promote high diversity and abundance of species that live in the
same forest stand, i.e. forest-associated taxa. It is crucial to address this because forests provide habitats
for many different organisms (Lindenmayer and Franklin 2002) and a better understanding of how tree
diversity affects other groups could be used to optimise forest management for biodiversity conservation.
Tree diversity may affect the diversity and abundance of forest-associated taxa through several
mechanisms. Organisms that feed on trees, such as defoliating insects and foliar fungal pathogens, are
directly affected by tree species composition. Their diversity is expected to be higher in stands with more
tree species (Basset et al. 2012, Castagneyrol and Jactel 2012) because diverse stands provide more
and/or better quality food for consumers (Potts et al. 2003, Haddad et al. 2009). However, tree diversity
may have a range of effects on the damage caused by different consumers. Tree species may have
reduced damage from specialist herbivores in diverse stands (associational resistance hypothesis),
however they may suffer enhanced damage from generalists (associational susceptibility hypothesis),
compared to monoculture stands (Plath et al. 2012). Effects of tree diversity on forest-associated taxa may
also be indirectly mediated by the impacts of the trees on environmental conditions, such as on light
availability and quality (Messier et al. 1998), soil water availability (Barbier et al. 2009), soil acidity and
nutrient availability (Carnol and Bazgir 2013, Augusto et al. 2015), and characteristics of the litter layer
(Hobbie et al. 2006). Diverse forest stands generally have higher complexity (Brose 2003, Cavard et al.
2011), which might provide more niches and therefore increase the diversity and abundance of
Acc
epte
d A
rtic
le
‘This article is protected by copyright. All rights reserved.’
understorey plants (Ampoorter et al. 2016) and earthworms (Chamagne et al. 2016). In grasslands, plant
diversity has been shown to have cascading effects and to increase diversity at multiple trophic levels
(Haddad et al. 2009, Scherber et al. 2010). As herbivores feed on trees and predators eat herbivores, it has
been hypothesized that predator diversity also increases with increasing tree diversity (Castagneyrol and
Jactel 2012). Multiple observational and experimental studies have provided support for this hypothesis
(Siemann 1998, Sobek et al. 2009). Different components of tree diversity might have different effects on
forest-associated taxa. For example, tree functional diversity, i.e. the variation in functional trait values,
might have stronger effects than species richness, if the traits measure interspecific differences (e.g.
nutritional differences) relevant for forest-associated taxa (e.g. Mason et al. 2005). Tree species evenness
might also be important, because it affects the relative abundance of those traits that determine niche
space for forest-associated taxa (Petchey and Gaston 2006).
Tree functional composition, i.e. the particular functional trait values found in a stand, could affect forest-
associated taxa as well. For instance, the leaves of fast growing tree species have high nutrient
concentrations and are likely to be more palatable for defoliating insects and foliar fungal pathogens than
leaves from slow growing species (Rowe et al. 2006). Forest management may not only alter tree
diversity and tree functional composition, but also the structure of forest stands. Horizontal heterogeneity
refers to the spatial distribution of the trees (i.e. regular or random, clustered or dispersed), while vertical
heterogeneity is related to the number of forest layers. A higher horizontal and vertical heterogeneity in
forest structure increases available niche space, provides more refuges and opportunities for isolation and
divergent adaptation, and can therefore enable the coexistence of more species (Cavard et al. 2011). Apart
from these management-related factors, abiotic drivers, such as climate (Engelbrecht et al. 2007, Butchart
et al. 2010) and soil (Rosch et al. 2002, Silvertown 2004), may also affect the diversity of the forest-
associated taxa. Determining the relative importance of tree diversity, tree functional composition, forest
structure, climate and soil in affecting the diversity of forest-associated taxa may help to understand the
mechanisms underlying interactions between trees and forest-associated taxa.
Previous research mainly focused on the impact of one potential driver on forest biodiversity. However,
to develop better forest management plans and to understand the importance of tree diversity as a driver
of associated diversity, we need to determine the relative importance of tree diversity alongside other
management-related and abiotic drivers in affecting forest biodiversity. Moreover, these relations have
predominantly been explored for individual taxa (Zhang et al. 2016) while taxa are likely to respond
differently to changes in tree diversity, tree functional composition, forest structure, climate and soil. For
Acc
epte
d A
rtic
le
‘This article is protected by copyright. All rights reserved.’
example, vertical stratification predominantly influences taxa that occur in several forest layers, like
birds, as a more complex forest structure would result in more abundant and diverse prey resources,
allowing higher levels of predator functional diversity (Barbaro et al. 2014). Tree diversity could have
stronger effects on lower trophic levels because these are more directly associated with the trees, in
accordance with the effect of plant diversity in grasslands (Scherber et al. 2010). In addition, diversity and
abundance of a specific taxon may be driven by different factors (Boulangeat et al. 2012) making it
important to compare responses of diversity with those of abundance. To determine the overall responses
of diversity and abundance, multidiversity or multiabundance indices can be used (Allan et al. 2014) and
these may enable us to identify general responses across a wide range of organism groups.
In this study, part of the FunDivEUROPE project (Baeten et al. 2013), we examined multiple drivers of
the diversity and abundance of various forest-associated taxa. The study plots were located in mature
European forests of six contrasting types that differ in tree species composition and that are spread along
a large climatic gradient. We aimed to quantify the relative effects of tree diversity, tree functional
composition, forest structure, climate and soil on the diversity and abundance (or activity, see methods) of
nine key forest-associated taxa (bats, birds, spiders, micro-organisms, earthworms, ungulates, pathogens,
defoliating insects and understorey plants). These taxa represent different trophic levels above and
belowground, they are important for conservation or nature tourism and/or are key drivers of ecosystem
functioning and ecosystem services providers. We examined each taxon separately but to quantify overall
responses, we also used multidiversity and multiabundance/activity indices. In addition, we investigated
how the diversity and abundance/activity of the different forest-associated taxa were related to each other.
Material and methods
Forest plots
The Exploratory Platform of the FunDivEUROPE project includes six regions representing the main
forest types in Europe: boreal forest (Finland), hemiboreal forest and nemoral coniferous and mixed
broadleaved-coniferous forest (Poland), beech forest (Germany), mountainous beech forest (Romania),
thermophilous deciduous forest (Italy) and Mediterranean mixed forest (Spain) (Barbati et al. 2007). In
each region, three to five target tree species, which are regionally common and/or of silvicultural
importance, were selected. The total tree species pool consisted of the coniferous species Abies alba,
Picea abies, Pinus nigra and Pinus sylvestris, and the broadleaved species Acer pseudoplatanus, Betula
Acc
epte
d A
rtic
le
‘This article is protected by copyright. All rights reserved.’
pendula/pubescens, Carpinus betulus, Castanea sativa, Fagus sylvatica, Fraxinus excelsior, Ostrya
carpinifolia, Quercus robur/petraea, Quercus cerris, Quercus faginea and Quercus ilex. Based on these
regional tree species pools, 28 to 43 plots of 30 m × 30 m were chosen per region, in mature forests, to
cover a gradient in species richness from monoculture stands to mixtures containing all species from the
regional pool (i.e. 3 to 5 species mixtures). Plots were surrounded by a buffer zone 10 m wide, which had
a similar forest composition and structure, to avoid edge effects. For each level of species richness, plots
with different tree species compositions were included. This resulted in 209 plots in total over the six
regions. More information on region-specific tree species pools, tree species combinations and number of
plots can be found in Supporting Information Appendix S1. Intraregional covariation between
environmental variables (bedrock, soil, topography) and tree species richness was avoided, so that past
silvicultural management and/or random species assembly were the key drivers of tree diversity. Some
admixture of non-target species was unavoidable but we ensured that the target species contributed: 1)
>90% of the number of individuals, 2) >90% of total basal area, and 3) were always represented by more
than two individuals per plot. We therefore focused on target species richness in our analyses, but we also
tested for the effect of admixed tree species richness. All forests where these plots are located are
considered ancient forests, i.e. they have been continuously forested at least since the oldest available
land-use maps. They have also been (at least historically) managed for forestry and are currently in the
mid to late stem exclusion, understorey reinitiation or old-growth development stage (i.e. excluding very
young stands). For more information on the regions, tree species combinations, plot selection criteria and
plot-level information, see Baeten et al. (2013) and Jucker et al. (2014).
Forest-associated taxa
Within all plots, in all regions, data on community composition and abundance/activity were collected for
bats, birds, arboreal spiders in the shrub layer, microorganisms, earthworms, ungulates (no data on
community composition), foliar fungal pathogens, defoliating insects and understorey plants. Different
ways of quantifying diversity and abundance/activity were used for the different taxa. We could not
obtain abundance data for all groups and used the activity of defoliating insects (herbivory), pathogens
(infection) and ungulates (browsing damage) as proxies. Information on the data collection can be found
in Supporting Information Appendix S2 and raw diversity and abundance/activity data can be seen in Fig.
3 and Fig. 4. We visited all forest plots once to ensure that we sampled as many plots as possible because
we wanted to maximise sample size and spatial coverage to increase statistical power, and to sample all
plots within the same region within a short time period to limit seasonal variation. Sampling data in many
Acc
epte
d A
rtic
le
‘This article is protected by copyright. All rights reserved.’
plots in several countries is challenging and it would simply not have been possible to sample each plot
more intensively. Sampling periods varied across the year between regions to account for differences in
climatic conditions and leaf phenology. Sampling efforts were relatively small for taxa like bats and birds
but analysis of sample completeness for these taxa indicated that we sampled an adequate proportion of
the European species pool (see Barbaro et al. 2019 for a fuller analysis of sample completeness for birds
and bats). Species pools of forest-associated taxa differed considerably between regions. An overview of
the variation in species numbers between regions is shown for each of our 8 organism groups
in the Supporting Information Appendix S3. In general, our goal was not to quantify absolute
diversities of the different taxonomic groups (and hence to sample the complete communities in all plots)
or to understand the response of each taxonomic group in detail. In contrast, this study focussed on
relative differences in diversity and abundance of forest-associated taxa and on drawing general
conclusions on how the forest-associated taxa respond to different drivers.
In order to test for the overall response of diversity and abundance/activity of forest-associated taxa, we
calculated “multidiversity” and “multiabundance/activity” indices following Allan et al. (2014). These
measures quantify the average proportional diversity and abundance/activity respectively across
taxonomic groups. For each taxon, diversity and abundance/activity values were scaled to the maximum
value observed in any plot (however, scaling to maxima per region did not change the results, see Table
S9.1), so that all taxa were weighted equally, i.e. species rich taxa like understorey plants are weighted
the same as species poor taxa like bats. Then, scaled values were averaged per plot over the different taxa.
Drivers of biodiversity
We tested several components of tree diversity, tree functional composition, forest structure, climate and
soil as potential drivers of the diversity and abundance/activity of forest-associated taxa. Tree diversity
was measured as target tree species richness (SR), admixed tree SR, target species evenness and target
species functional diversity. Functional diversity was calculated as abundance weighted functional
dispersion, which measures the distance between tree species in multivariate trait space (Laliberté and
Legendre 2010; using the function dbFD in the FD package in R; Laliberté 2014). Higher values indicate
greater functional dissimilarity. Functional traits were measured, for each tree species in each region, on
freshly fallen leaf litter. Relative abundances of the tree species were calculated from basal area. We
selected traits related to palatability for defoliating insects and foliar fungal pathogens and to
decomposability: specific leaf area (SLA), leaf pH and the proportion of nitrogen (N), lignin,
Acc
epte
d A
rtic
le
‘This article is protected by copyright. All rights reserved.’
hemicellulose, condensed tannins and soluble phenolics in the leaf. Maximum tree height and mean tree
lifespan were also included because they refer to the structure and stability of the tree layer (information
on the data collection in Supporting Information Appendix S2).
Tree functional composition was determined in several ways. We fitted the community weighted mean
(CWM; Ricotta and Moretti 2011) of leaf N in all models, as this is a key trait for defoliating insects and
foliar fungal pathogens and is therefore expected to have direct or indirect effects on many taxa. The
CWM is calculated by multiplying the trait value of each tree species by its relative abundance (basal
area) and then summing across all tree species in the plot. In addition to CWM N, we included measures
related to tree functional composition that aimed to represent the two major axes of plant strategy
variation, which are (i) a resource acquisition axis, differentiating fast growing acquisitive species from
slow growing conservative species (leaf % N is also related to this axis but we fitted it separately as it
could directly affect nutrient levels for consumers and decomposers), and (ii) a tree height axis,
differentiating small and large plants (Diaz et al. 2016). We explored different ways of representing these
two axes in our models (Supporting Information Appendix S2). The best models had the resource axis
represented as the proportion of conifers in the plots and the size axis by maximum tree height.
Forest structure was measured in each plot as (i) mean basal area of the target tree species, (ii) horizontal
heterogeneity, i.e. the coefficient of variation of the tree-to-tree distances, and (iii) vertical heterogeneity.
To calculate vertical heterogeneity, we first used measures of the cover of the tree layer (diameter >
7.5cm), shrub layer (height > 1.3m and diameter < 7.5cm) and understorey layer (height < 1.3m) which
were taken in three quadrats per plot (Supporting Information Appendix S2). The cover of the tree layer
was estimated for each quadrat while looking upwards and it measures the crown cover of all trees with
stems > 7.5cm diameter. We first averaged the cover of each of layer to produce one average cover per
plot and then calculated vertical heterogeneity as the Shannon diversity of these three layers. Maximum
heterogeneity occurs when tree, shrub and understorey cover values are the same.
Information on climate (annual mean temperature, annual precipitation; WorldClim 2015) and soil
conditions (soil pH and C/N) in each plot was also included (soil sampling methodology in Supporting
Information Appendix S2).
Data analysis
All analyses were performed in R 3.1.1 (R Core Team 2014). From the 209 plots, we only used those
plots for which diversity (ungulates excluded) and abundance/activity values of all nine taxa were
Acc
epte
d A
rtic
le
‘This article is protected by copyright. All rights reserved.’
available (183 plots). More information on which plots were included can be found in the Supporting
Information Appendix S1. All explanatory and response variables were scaled to a mean of 0 and a
standard deviation of 1, to allow us to compare effect sizes between explanatory and response variables.
Abundance/activity values were first log transformed. All correlations between explanatory variables
were ≤0.6, except for tree species richness and functional diversity (Supporting Information Appendix
S4). We fitted both variables in the models as we were interested in both effects. However, we explored
the sensitivity of our results to this correlation by fitting models with only tree species richness or only
functional diversity (Supporting Information Appendix S5-6). Variance inflation factors (VIFs) were also
calculated to check for multicollinearity. We used the car package in R to calculate VIFs for all
explanatory variables and found that all VIFs were <4.5 (Supporting Information Appendix S7). VIFs <
10 indicate that collinearity is not an issue for the analysis (Dormann et al. 2013). All of the effects that
we present are partial effects, after variables have been corrected for each other (Schielzeth 2010). As the
variables are also scaled, these partial coefficients provide a measure of the relative importance of each
variable, similar to a variance decomposition analysis. Next, we calculated correlations between the
diversity of all taxa, between log-transformed abundance/activity of all taxa, and between diversity and
log-transformed abundance/activity for each taxon (Supporting Information Appendix S8).
We used linear mixed effects models to determine the relative effects of all explanatory variables on the
response variables. All models included random effects for region and for target tree species composition
to account for the non-independence between plots within the same region and replicate tree species
compositions, respectively. Models were fitted using lmer in the lme4 package (Bates et al. 2013). Model
structure, in R code, was:
y = Target SR + Evenness + Admixed SR + Functional diversity + Proportion conifers + CWM
height + CWM N + Basal area + Horizontal heterogeneity + Vertical heterogeneity +
Temperature + Precipitation + Soil pH + Soil CN + (1|Region) + (1|Tree species composition)
Parameter estimation was done using restricted maximum likelihood in full models. For each full model,
we calculated the 95 % confidence intervals around each parameter by bootstrapping, with 10 000
iterations, using the confint function in the lme4 package. Means and confidence intervals are reported in
Supporting Information Appendix S9. For each model, we calculated the proportion of the deviance
explained by the fixed factors only (marginal R²) or by the random and fixed effects (conditional R²),
according to Nakagawa and Schielzeth (2013) (piecewiseSEM package; Lefcheck 2016).
Acc
epte
d A
rtic
le
‘This article is protected by copyright. All rights reserved.’
Results
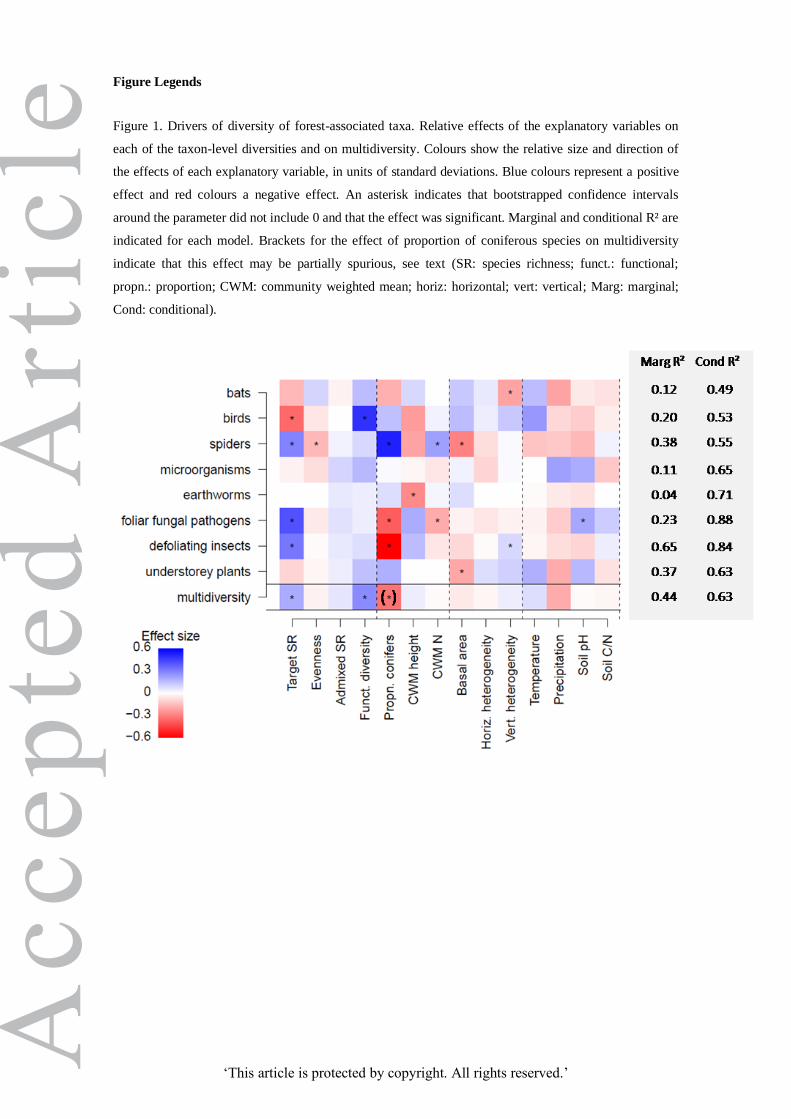
Explanatory variables explained 37-65% of the variation in diversity and 36-53% of the variation in
abundance/activity for spiders, defoliating insects and understorey plants but only 4-23% of the variation
in diversity and 10-16% of the variation in abundance/activity for bats, birds, microorganisms,
earthworms, ungulates and foliar fungal pathogens (Fig. 1, Fig. 2). Most taxa were affected by several
parameters, only microorganism diversity was not affected by any variables tested. The forest parameters
explained 44% of the variation in overall multidiversity and 35% of the variation in overall
multiabundance/activity. Conditional R² values were clearly higher than marginal R² values, suggesting
that the random effects of region and target tree species composition also accounted for a lot of variation
in the data. This means that our fixed forest parameters did not capture all of the variation between
regions and forest stands with different tree species combinations. However, as we were not interested in
the effects of these terms, and only wanted to account for the non-independence between plots within the
same region or with the same tree species combination, we do not further discuss the variation accounted
for by the random effects.
Tree diversity increased the diversity and abundance/activity of many forest-associated taxa. Target
species richness (SR) increased the diversity and abundance/activity of spiders and foliar fungal
pathogens, the diversity of defoliating insects and the activity of ungulates. However, note that the effects
on spider abundance may have been driven by more intense sampling in diverse stands (no effect on mean
abundance per tree species, see Supporting Information Appendix S2). Target SR reduced the diversity
and abundance of birds. Tree functional diversity tended to increase the diversity of all taxa, especially
birds. Overall, both target SR and tree functional diversity significantly increased multidiversity, showing
that they have generally positive effects on the diversity of forest-associated taxa. Due to the strong
correlation between tree SR and tree functional diversity (Supporting Information Appendix S4), we
repeated all analyses without tree functional diversity. In these models tree SR had a neutral effect on bird
diversity while other effects were unchanged (Supporting Information Appendix S5). However, when
bird models were fitted without tree SR, the effect of functional diversity remained (data not shown),
showing that functional diversity effects are robust to any correlation with species richness.
Multiabundance/activity did not significantly increase with tree species richness and functional diversity.
Tree species evenness reduced spider diversity and increased bat activity. In contrast, admixed species
richness had no effects on any taxa.
Acc
epte
d A
rtic
le
‘This article is protected by copyright. All rights reserved.’
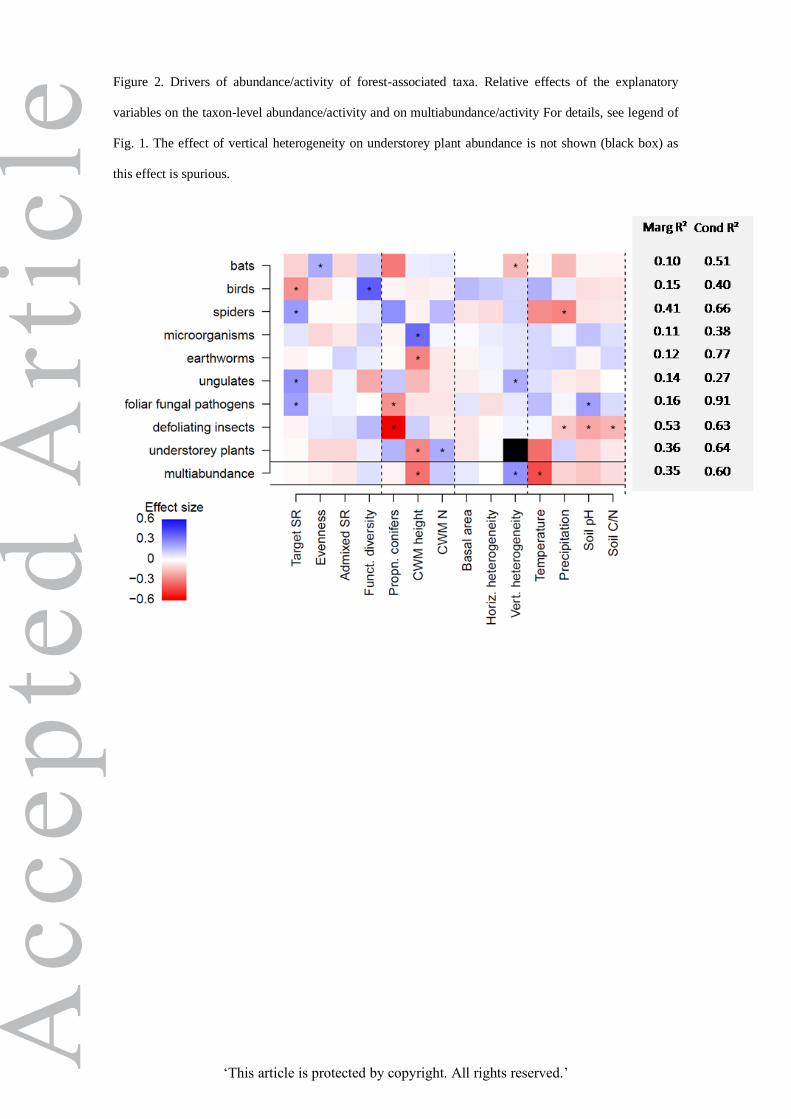
Tree functional composition was also important for several forest-associated taxa. The diversity and
abundance/activity of foliar fungal pathogens and defoliating insects was lower in stands with a high
proportion of conifers, while spider diversity was higher in conifer stands. Overall multidiversity was also
lower in stands dominated by conifers, but this result should be treated with caution as it is mainly driven
by the defoliating insects (no significant effect on multidiversity without defoliators: β=0.02±0.3, slope ±
95% confidence intervals) and their diversity is difficult to assess accurately in coniferous stands (Guyot
et al. 2016). Forest stands with a higher CWM height (thus a higher proportion of potentially tall trees)
had a less diverse and less abundant earthworm community and a lower understorey cover but a higher
abundance of microorganisms. In general, forest stands with a higher CWM height had a significantly
lower multiabundance/activity (although this effect was not significant if multiabundance was
standardised per region, Table S9.1). Forest stands dominated by trees with nitrogen-rich leaves had a
higher diversity of spiders and a higher understorey cover but a lower diversity of foliar fungal pathogens.
Forest structure seemed to be less important for the diversity and abundance/activity of forest-associated
taxa than tree diversity and tree functional composition. Plots with a higher mean basal area contained a
less diverse spider and understorey plant community. Higher vertical heterogeneity was associated with
lower bat diversity and activity but a higher diversity of defoliating insects and higher activity of
ungulates. Understorey plant cover was used in the calculation of vertical heterogeneity. We therefore
included vertical heterogeneity in the understorey plant abundance model to account for it but do not
discuss its effect. Overall, vertical heterogeneity increased multiabundance/activity, also when
understorey plants were excluded from the calculation (β=0.13±0.12; slope ± 95% confidence intervals).
The climate variables (temperature, precipitation) and soil conditions (soil pH, soil C/N) had rather minor
effects on the forest-associated taxa. Multiabundance/activity was lower in warmer areas (only if
standardised across regions, Table S9.1) and although the results were not significant, all taxa, except
microorganisms, had lower diversity at higher precipitation levels. Higher diversity and activity of foliar
fungal pathogens and lower activity of defoliating insects were found in soils with higher pH. The activity
of defoliating insects was lower in soils with higher soil C/N.
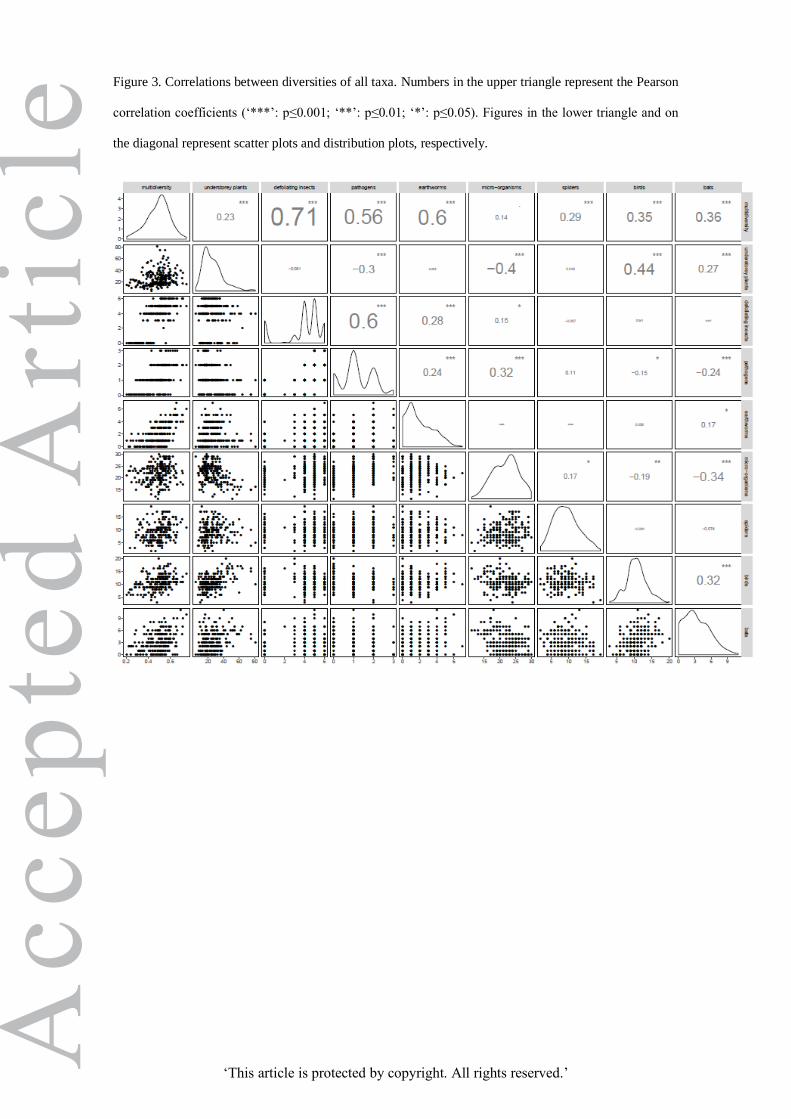
The diversities of the different forest-associated taxa were often related. In general, there were more
positive than negative correlations between diversities (60% were positive). The average correlation was
0.02 and thus also slightly positive (Fig. 3). We found strong correlations between multidiversity and the
diversities of defoliating insects, foliar fungal pathogens and earthworms. Diversities of pathogens and
Acc
epte
d A
rtic
le
‘This article is protected by copyright. All rights reserved.’
defoliating insects were strongly positively correlated, while diversities of understorey plants, bats and
birds were all negatively correlated with diversities of microorganisms and pathogens. The proportion of
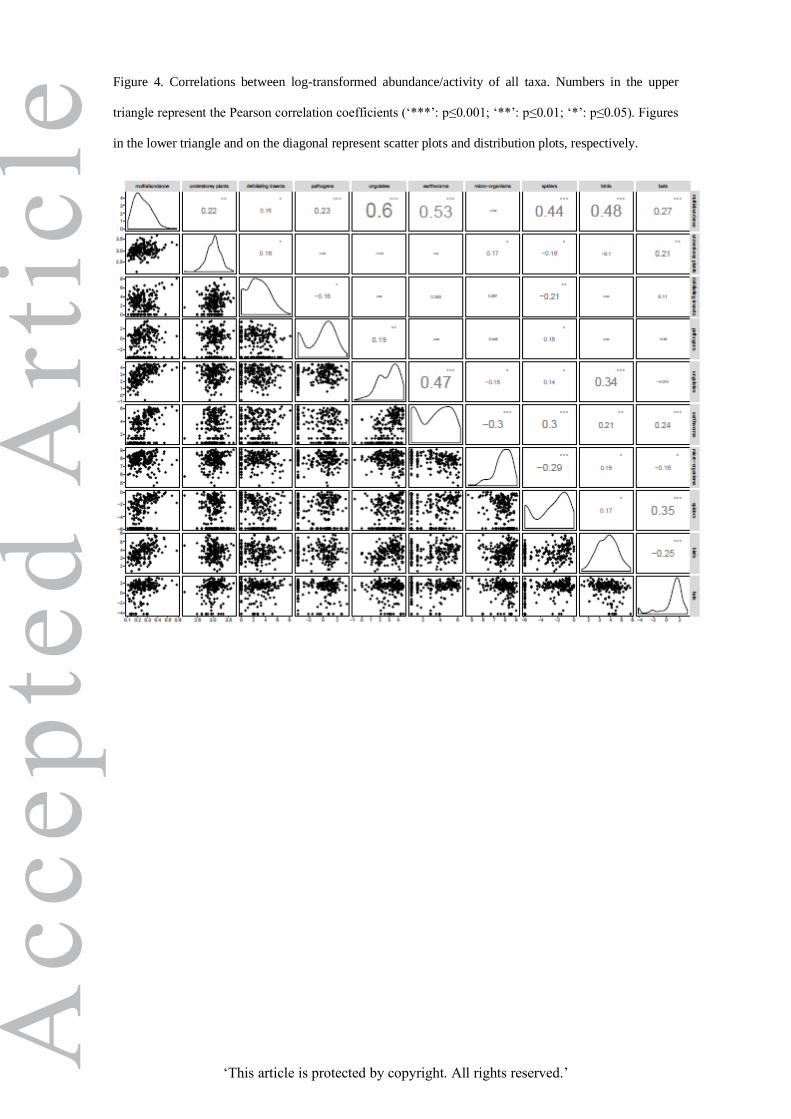
positive correlations was higher between the abundance/activity of the taxa (68%) where the average
correlation was 0.04 (Fig. 4). Multiabundance/activity was strongly correlated with the
abundance/activity of ungulates, earthworms, spiders and bats. Abundance/activity of ungulates,
earthworms, spiders and bats were negatively correlated with the abundance of microorganisms.
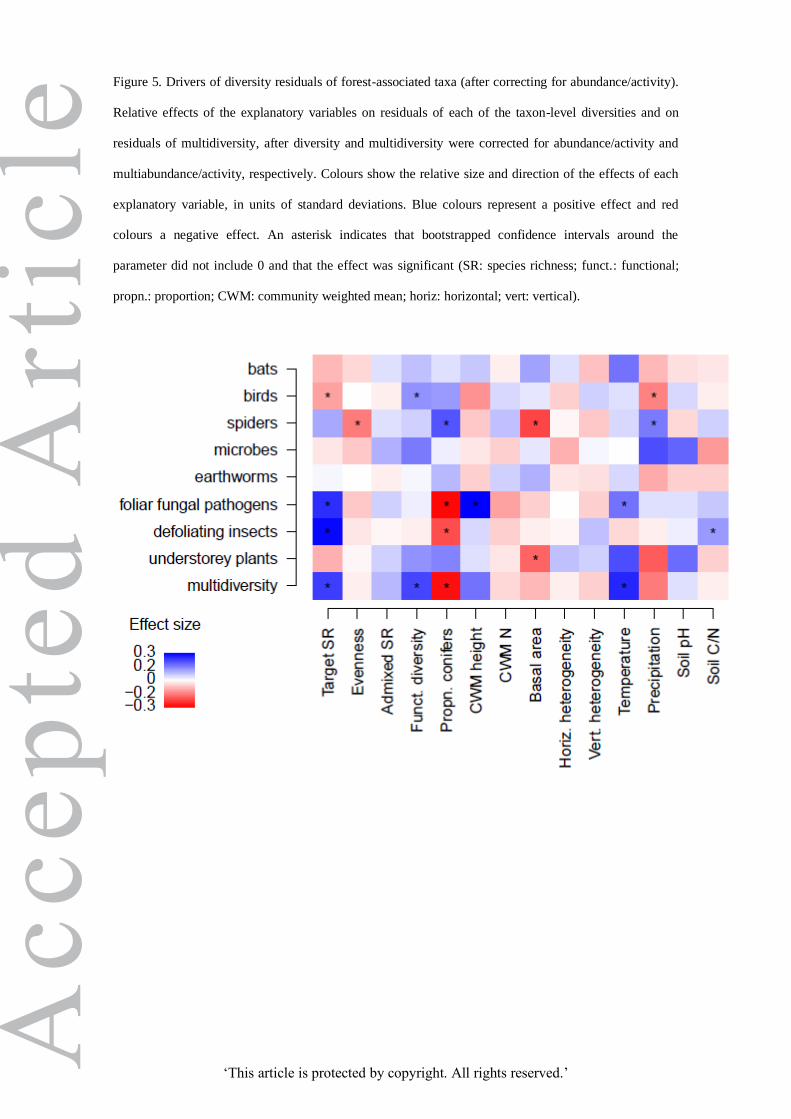
Diversity and abundance/activity were correlated for defoliating insects, pathogens, earthworms, spiders,
birds and bats (Supporting Information Appendix S8), which means that effects on diversity may be
driven by changes in abundance. For this reason, we refitted the same linear mixed effect models with the
residuals of diversity (or multidiversity), after correcting for abundance/activity (or
multiabundance/diversity). This indicated that all of the effects on multidiversity and most of the effects
on diversity of individual taxa remained significant and were thus not driven by abundance (Fig. 5). Some
effects on diversity disappeared: the effect of Target SR on spiders, the effect of CWM height on
earthworms, the effects of vertical heterogeneity on bats and the effect of soil pH on foliar fungal
pathogens. As abundance is also affected in these cases, effects on diversity are driven by abundance. A
few effects on diversity disappeared even though abundance did not respond significantly: effects of
CWM N on spiders and foliar fungal pathogens, effects of vertical heterogeneity on defoliating insects
and in these cases effects seem jointly mediated by abundance and diversity changes. There were also
new effects on diversity that appeared, which indicate that abundance variation was obscuring the effects
of certain variables on diversity: a positive effect of CWM height on foliar fungal pathogens, a positive
effect of temperature on foliar fungal pathogens and multidiversity, negative effects of precipitation on
birds but a positive effect on spiders, and a positive effect of soil C/N on defoliating insects.
Discussion
Our analysis showed that tree diversity and functional composition were the most important drivers of the
diversity and abundance/activity of forest-associated taxa. Tree diversity measures were the only ones
that had consistent effects on overall multidiversity. Tree functional composition tended to have more
contrasting effects on individual groups and therefore fewer overall effects on diversity. However, a high
proportion of conifers reduced multidiversity (although this effect is driven by the defoliating insects that
are hard to assess in conifer stands). The overall abundance of associated taxa was driven more by tree
functional composition (CWM height) and forest structure (vertical heterogeneity). Abiotic factors were
Acc
epte
d A
rtic
le
‘This article is protected by copyright. All rights reserved.’
less important but affected some groups. In general, the diversity and abundance/activity of spiders,
defoliating insects and understorey plants were better explained by key forest features in comparison with
bats, birds, microorganisms, earthworms, ungulates and foliar fungal pathogens. This would partially
support the idea that lower trophic levels (producers, primary consumers) are more directly affected by
stand characteristics and that effects on higher trophic levels are more indirect. However, not all groups
responded in the expected fashion (spiders, foliar pathogens), which shows that it is challenging to predict
the responses of individual groups and this underlines the importance of multitaxa approaches to
understand the drivers of forest biodiversity.
Tree diversity was a key driver of forest-associated multidiversity and both target tree species richness
and tree functional diversity were important. Target tree species richness was particularly important in
increasing the diversity of foliar fungal pathogens and defoliating insects. These taxa may be species-
specific and may therefore respond more strongly to target tree species richness than tree functional
diversity (Gilbert et al. 2012). Although a high diversity of pathogens and insects is likely to be beneficial
from a conservation perspective, it might not always be welcomed by forest managers (see extended
discussion in Supporting Information Appendix S2). Tree functional diversity increased overall
multidiversity, showing it tended to have positive effects on average. Functional diversity was always
positively associated with the diversity of the separate taxa but only significantly increased bird diversity
individually. Forest stands with trees that vary in their resource use strategies are likely to provide a
greater diversity of resources for consumers and higher heterogeneity in soil resources and microclimate
(Keller et al. 2013). This should provide more niches and therefore allow a larger number of forest-
associated species to coexist (Levine and HilleRisLambers 2009). The negative effects of target species
richness on bird diversity (and abundance) are surprising but are driven by the inclusion of functional
diversity in the models. This means that bird diversity was lower in stands dominated by many
functionally similar tree species and that a high functional diversity of trees is crucial to maintain high
bird diversity. These effects on birds are likely to be indirect and may arise if low tree functional diversity
results in a low diversity and activity of defoliating insects. This could have negative cascading effects on
bird diversity and abundance, if bird species differ in their feeding preferences (Zhang et al. 2013,
Charbonnier et al. 2016). The importance of both tree species richness and tree functional diversity show
that multiple dimensions of tree diversity are important for promoting overall forest biodiversity.
Tree species evenness and admixed species richness had few effects on forest-associated taxa. This is
probably due to the plot selection. Forest stands were only included if they had an evenness of at least
Acc
epte
d A
rtic
le
‘This article is protected by copyright. All rights reserved.’
60% of the maximum possible, which resulted in a rather small variation between the plots. In addition,
admixed species never exceeded 10% of the total basal area and therefore are unlikely to have had large
effects on any of the forest-associated taxa (Baeten et al. 2013). In general, although plots were selected
to differ in tree diversity, whilst minimising confounding effects of environmental variation or spatial
position, in an observation study such as ours we cannot rule out the possibility that tree diversity effects
were caused by unmeasured variables that are correlated with tree diversity. Experimental manipulations,
e.g. biodiversity experiments, in which tree diversity is varied in a controlled fashion, are necessary to
fully test the causality of the effects found here. However, the currently available tree diversity
experiments are still relatively young and the approach used here remains the only option to evaluate the
effects of tree diversity in mature forest stands.
The abundance/activity of forest-associated taxa also responded to tree diversity although none of the
diversity dimensions tested here had a significant effect on multiabundance/activity. Target tree species
richness increased the activity of foliar fungal pathogens. Trees may experience associational
susceptibility to foliar fungal pathogens infestation in forest stands with a higher target tree species
richness (Barbosa et al. 2009, Nguyen et al. 2016), as a result of more suitable microclimates for fungi
(Jules et al. 2014), lower fitness of the trees due to competition (Pollastrini et al. 2013) or spillovers of
generalist foliar fungal pathogen species between trees (Parker et al. 2015). The positive effect of tree
species richness on spider abundance may be due to cascading effects, where tree diversity affects
predators via a change in prey diversity/abundance (Scherber et al. 2010, Castagneyrol and Jactel 2012).
However, we found little evidence for correlations between herbivores and predators and effects of tree
diversity on spider abundance need to be treated with caution (see Supplementary Information Appendix
S2). In addition, tree species richness increased the activity of ungulates. The optimal foraging theory
states that these browsers should consume more in areas of high forage quality to maximize their
instantaneous rate of intake (Stephens and Krebs 1986). Foraging in tree species rich stands offers the
benefit of diet mixing, allowing greater and complementary intake of nutrients, as well as buffering
against the accumulation of a particular source of digestion-inhibiting or toxic secondary metabolites
(Wang et al. 2010, Milligan and Koricheva 2013). In general, tree diversity had stronger effects on the
diversity rather than on the abundance/activity of forest-associated taxa and effects of tree diversity were
not mediated by changes in abundance (in contrast with some of the effects of tree functional
composition). Tree diversity effects on the diversity of forest-associated taxa are therefore likely to be
mediated more by changes in resource heterogeneity than resource quantity (Borer et al. 2012). These
Acc
epte
d A
rtic
le
‘This article is protected by copyright. All rights reserved.’
differing effects of tree diversity on species richness and abundance/activity show the importance of
considering both aspects to understand effects of plant diversity on forest-associated taxa.
Tree functional composition also had a clear impact on several forest-associated taxa. Forest stands
dominated by conifers had a lower diversity and activity of foliar fungal pathogens and defoliating
insects. Conifers typically have a denser canopy (and cooler, wetter microclimate) and produce litter with
a lower pH and nutrient concentrations and a higher lignin content than broadleaved species (e.g. Sardans
et al. 2011, Augusto et al. 2015). This likely has a direct negative effect on organisms feeding on leaves
(e.g. Brändle and Brandl 2001). Moreover, it is well known in European forests that the number of insect
herbivores species, and specifically defoliators like Lepidoptera, is significantly lower on conifer than on
broadleaved species (Kennedy and Southwood 1984, Brändle and Brandl 2001). However, it is also more
challenging to assess herbivory in conifer stands, which may have led to an underestimation of herbivore
activity in conifer forests (Guyot et al. 2016). In addition, the level of leaf area loss differs among the
observed insect guilds, which means that our measure of insect herbivore activity might be dominated by
certain feeding guilds, such as leaf chewers. In contrast to the primary consumers, spider diversity was
higher in conifer-dominated plots. Conifers probably provide a more diverse spectrum of microhabitats
than deciduous trees (Korenko et al. 2011) and their dense canopies lower the searching efficiency of
birds (Whelan 2001). Multidiversity was lower in conifer stands, although this was driven by the
defoliating insects.
In addition to the dominance of conifers, tree size and nutrient traits were also important in affecting the
forest-associated taxa. Forest stands dominated by potentially taller trees (high CWM height) had a lower
abundance overall and lower understorey cover and earthworm abundance in particular. Martens et al.
(2000) found that light availability on the forest floor decreased as tree height increased. As light is the
major limiting factor for forest understorey cover (Jennings et al. 1999, Barbier et al. 2008), higher CWM
height probably reduced understorey productivity by reducing light levels. The negative effect of CWM
height on earthworm abundance may be an indirect effect mediated by soil quality, as CWM height was
negatively correlated with soil pH and low soil pH is known to reduce earthworm abundance (Reich et al.
2005). However, we did not find direct effects of the soil variables on earthworm abundance. For other
groups, variation in temperature and humidity might be more important (Barkman 1992). Forest stands
with taller trees are likely to be moister and to have a more stable temperature, which might provide an
ideal habitat for foliar fungal pathogens and microorganisms, whose diversity and abundance respectively
were higher in stands with potentially taller trees. Tree nutrient levels (CWM N) affected the diversity of
Acc
epte
d A
rtic
le
‘This article is protected by copyright. All rights reserved.’
spiders and pathogens and these effects were partially mediated by biomass. Effects on spiders are likely
indirect and mediated by an increase in prey. The effects on pathogens are surprising but could indicate
that trees with more nitrogen rich leaves also produce nitrogen-based defences against pathogens. Tree
functional composition is therefore a key driver of forest-associated taxa and in addition to well-known
effects of conifers, other tree traits seem to be important in determining the abundance and diversity of
several groups.
Effects of forest structure were less important than the effects of tree diversity and tree functional
composition. However, plots with a higher basal area had a less diverse understorey and spider
community. A higher basal area means denser and darker stands, which reduces the understorey (Barbier
et al. 2008) and therefore potentially the habitat for spiders. Bat activity was reduced by vertical
heterogeneity, probably due to the reduction of foraging space in heterogeneous stands. Most bat species
avoid dense forest layers because it makes flying and locating prey more difficult (Jung et al. 2012).
Ungulate activity was higher in forest stands with a higher vertical heterogeneity. This probably results
from the way vertical heterogeneity was calculated. A higher understorey cover resulted in a higher value
of vertical heterogeneity. As ungulates only browse in the lower forest layers, a higher understorey cover
may also increase ungulate activity. Vertical heterogeneity increased multiabundance/activity as well
because most individual taxa tended to increase in abundance/activity in more structurally heterogeneous
plots. Hence, promoting structurally heterogeneous forests, and ensuring an abundant understorey,
generally increases the abundance/activity of forest-associated taxa, but there are trade-offs because it
reduces the activity of bats.
Abiotic drivers were also less important but had effects on some groups. Higher temperatures were
associated with lower abundance overall but with a higher diversity of foliar fungal pathogens and a
higher multidiversity, which is likely to be because Mediterranean forests had a higher diversity but lower
abundance of several groups, such as plants and spiders. Increasing precipitation increased spider
diversity, which agrees with results of Robertson and Aviles (2019) who found that rainfall positively
affected spiders by increasing vegetation cover. The lower activity of foliar fungal pathogens and higher
activity of defoliating insects that were found in more acid soils, could be due to changes in leaf
chemistry (Izuta et al. 2001), which affected the palatability of the leaves for foliar fungal pathogens and
defoliating insects. It is likely that considering a wider range of soil variables would have shown greater
effects on soil microorganisms and earthworms, two groups that were not well explained by our models.
In general, abiotic factors often had contrasting effects on diversity and abundance, e.g. precipitation for
Acc
epte
d A
rtic
le
‘This article is protected by copyright. All rights reserved.’
spiders and soil CN for defoliating insects, which often led to larger effects of abiotic factors on diversity
after correcting for abundance.
In general, we found more synergies than trade-offs between the diversities of different taxa, even though
effects of explanatory variables were not always significant. This might be driven by functional links, i.e.
high diversity at lower trophic levels increases the diversity of organisms that feed on them (Haddad et al.
2009, Scherber et al. 2010), or by shared responses to forest or environmental drivers, which is the most
likely explanation for the correlation between pathogen and defoliator diversity. The synergies mean that
changes in forest management could benefit multiple taxa. However, some negative correlations did
occur, consistent with findings that the species richness of above- and belowground taxa may respond to
different drivers (Gossner et al. 2016). Theses trade-offs might indicate some top-down control in
addition to the bottom-up effects of tree diversity, and indicate that it is not possible to maximise the
diversity of all taxa at the local scale of a forest stand. Instead, a variety of different stands might be
necessary to maintain high diversity at the forest scale (van der Plas et al. 2016b).
Our analysis of a unique dataset, from a network of mature forest plots distributed across Europe, shows
that high tree diversity is most important for promoting a high overall diversity of forest-associated taxa.
This supports previous results from grasslands and suggests that bottom-up effects of plant diversity are a
major driver of diversity at other trophic levels. Since the key driver of differences in tree diversity
between our plots was silvicultural management, this study suggests that well-designed forest
management can support a high biodiversity of many taxa. In general, forest managers should consider
promoting mixed stands, and more specifically, favouring functionally dissimilar tree species. Tree
functional composition, and in particular the presence of conifers, had contrasting effects on diversity of
different taxa, so management that promotes variation in conifer abundance, or other aspects of functional
composition, between stands is likely to support the highest biodiversity. Lowering basal area could also
have beneficial effects on forest-associated biodiversity. In general, biodiversity at the landscape-scale
could be optimized by creating a mosaic of forest stands differing in tree species composition, as trade-
offs exist between diversities of some forest-associated taxa.
Overall, a change in tree diversity can influence multiple forest-related ecosystem functions and services
(Scherer-Lorenzen 2014, van der Plas et al. 2016a). For example, previous research indicated that
increasing tree diversity increases tree productivity (Paquette and Messier 2011), soil carbon storage
(Ruiz-Benito et al. 2014), berry and game production (e.g. Gamfeldt et al. 2013). Our results clearly
Acc
epte
d A
rtic
le
‘This article is protected by copyright. All rights reserved.’
showed that mixing tree species is essential for maintaining a generally high biodiversity in forests. Forest
managers should therefore also consider increasing tree species richness and functional diversity as an
effective way to provide the multitaxa and multiguild biodiversity that is needed to support the resilient
provisioning of multiple ecosystem services under global change.
Data accessibility statement
Data are available from the Dryad Digital Repository: <http://dx.doi.org/10.5061/dryad.xxxxx>
(Ampoorter et al. 2019).
Acknowledgements – We want to thank the site managers O. Bouriaud, H. Bruelheide, F. Bussotti, L.
Finér, B. Jaroszewicz and F. Valladares and their field teams for installing the FunDivEUROPE
Exploratory Platform and for performing basic measurements. We also thank S. Müller for organisational
support for the field surveys and M. Liebergesell for collating the tree trait data on mean tree life span and
maximum tree height.
Funding – This study is performed within the framework of the FunDivEUROPE project and has received
funding from the European Union Seventh Framework Programme (FP7/2007-2013) under grant
agreement no. 265171. EA was supported via an ERC Consolidator Grant awarded to KV
(PASTFORWARD project, Grant no 614839).
Author contributions – AmE, BarL, JH, BaeL, CY, DWH, KJ, MH, SLM, vdPF, VK and AlE conceived
the ideas and designed methodology; AmE, BarL, JH, BJ, CM, CB, CY, DSM, DM, DSP, DWH, GV,
HS, JFX, KJ, MH, MB, ND, RS, RRK, VKJ and VL collected the data; AlE led the data analysis; AmE
led the writing of the manuscript. All authors contributed critically to the drafts and gave final approval
for publication.
References
Allan, E. et al. 2014. Interannual variation in land-use intensity enhances grassland multidiversity. - Proc.
Natl Acad. Sci USA 111: 308-313.
Acc
epte
d A
rtic
le
‘This article is protected by copyright. All rights reserved.’
Ampoorter, E. et al. 2016. Driving mechanisms of overstorey-understorey diversity relationships in
European forests. – Perspect. Plant Ecol. Evol. Syst. 19: 21-29.
Ampoorter, E. et al. 2019. Data from: Tree diversity is key for promoting the diversity and abundance of
forest-associated taxa in Europe. – Dryad Digital Repository,
<http://dx.doi.org/10.5061/dryad.xxxxx>.
Augusto, L. et al. 2015. Influences of evergreen gymnosperm and deciduous angiosperm tree species on
the functioning of temperate and boreal forests. – Biol. Rev. 90: 444–466.
Baeten, L. et al. 2013. A novel comparative research platform designed to determine the functional
significance of tree species diversity in European forests. - Perspect. Plant Ecol. Evol. Syst. 15: 281-291.
Barbaro, L. et al. 2014. Bird functional diversity enhances insectivory at forest edges: a transontinental
experiment. - Divers. Distrib. 20: 149-159.
Barbaro, L. et al. 2019. Biotic predictors complement models of bat and bird responses to climate and tree
diversity in European forests. - Proc. R. Soc. B. 286.
Barbati, A. et al. 2007. European forest types. Categories and types for sustainable forest management
reporting and policy. - European Environment Agency Technical Report no. 9/2006. Copenhagen.
Barbier, S. et al. 2008. Influence of tree species on understory vegetation diversity and mechanisms
involved – a critical review for temperate and boreal forests. – For. Ecol. Manage. 254: 1-15.
Barbier, S. et al. 2009. Influence of several tree traits on rainfall partitioning in temperate and boreal
forests: a review. – Ann. For. Sc. 66: 602-602.
Barbosa, P. et al. 2009. Associational resistance and associational susceptibility: having right or wrong
neighbors. - Annu. Rev. Ecol. Evol. Syst. 40: 1-20.
Barkman, J.J. 1992. Canopies and microclimate of tree species mixtures. In: Cannell, M.G.R. et al. (Eds.)
The Ecology of mixed-species stands of trees. Blackwell Scientific Publications, Oxford.
Basset, Y. et al. 2012. Arthropod diversity in a tropical forest. - Science 14: 1481-1484.
Bates, D. et al. 2013. Lme4: linear mixed-effects models using Eigen and S4. R package version 1.0-4.
Borer, E. T. et al. 2012. Plant diversity controls arthropod biomass and temporal stability. – Ecol. Lett.
15: 1457–1464.
Acc
epte
d A
rtic
le
‘This article is protected by copyright. All rights reserved.’
Boulangeat, I. et al. 2012. Accounting for dispersal and biotic interactions to disentangle the drivers of
species distributions and their abundances. – Ecol. Lett. 15: 584-593.
Brändle, M. and Brandl, R. 2001. Species richness of insects and mites on trees: expanding Southwood. –
J. Anim. Ecol. 70: 194-504.
Brose, U. 2003. Bottom-up control of carabid beetle communities in early successional wetlands.
Mediated by vegetation structure or plant diversity? - Oecologia 135: 407–413.
Butchart, S.H.M. et al. 2010. Global biodiversity: indicators of recent declines. - Science 328: 1164-1168.
Cardinale, B.J. et al. 2006. Effects of biodiversity on the functioning of trophic groups and ecosystems. -
Nature 443: 989-992.
Carnol, M. and Bazgir, M. 2013. Nutrient return to the forest floor through litter and throughfall under 7
forest species after conversion from Norway spruce. - For. Ecol. Manage. 309: 66–75.
Castagneyrol, B. and Jactel, H. 2012. Unraveling plant-animals diversity relationships: a meta-regression
analysis. - Ecology 93: 2115-2124.
Cavard, X. et al. 2011. Importance of mixedwoods for biodiversity conservation: evidence for understory
plants, songbirds, soil fauna, and ectomycorrhizae in northern forests. – Env. Rev. 19: 142-161.
Chamagne, J. et al. 2016. Do the rich get richer? Varying effects of tree species identity and diversity on
the richness of understory taxa. - Ecology 97: 2364-2373.
Charbonnier, Y.M. et al. 2016. Bat and bird diversity along independent gradients of latitude and tree
composition in European forests. - Oecologia 182: 529-537.
Diaz, S. et al. 2016. The global spectrum of plant form and function. - Nature 529: 167-171.
Dormann, C.F. et al. 2013. Collinearity: a review of methids to deal with it and a simulation study
evaluating their performance. – Ecography 36:027-046.
Engelbrecht, B.M.J. et al. 2007. Drought sensitivity shapes species distribution patterns in tropical forests.
– Nature 447: 80-U2.
Fornoff, F. et al. 2019. Tree diversity increases robustness of multi-trophic interactions. - Proc. Biol. Sci.
13: 20182399.
Acc
epte
d A
rtic
le
‘This article is protected by copyright. All rights reserved.’
Gamfeldt, L. et al. 2013. Higher levels of multiple ecosystem services are found in forests with more tree
species. - Nature Communications 4: 1340.
Gilbert, G.S. et al. 2012. Evolutionary tools for phytosanitary risk analysis: phylogenetic signal
as a predictor of host range of plant pests and pathogens. – Evol. Appl. 5: 869–878.
Gossner, M.M. et al. 2016. Land-use intensification causes multitrophic homogenization of grassland
communities. - Nature 540: 266–269.
Guyot, V. et al. 2016. Tree diversity reduces pest damage in mature forests across Europe. – Biol. Lett.
12: 20151037.
Haddad, N.M. et al. 2009. Plant species loss decreases arthropod diversity and shifts trophic structure. –
Ecol. Lett. 12: 1029-1039.
Hobbie, S.E. et al. 2006. Tree species effects on decomposition and forest floor dynamics in a common
garden. - Ecology 87: 2288-2297.
Izuta, T. et al. 2001. Growth, net photosynthetic rate, nutrient status and secondary xylem anatomical
characteristics of Fagus crenata seedlings grown in brown forest soil acidified with H2SO4 solution. -
Water, Air and Soil Pollution 130: 1007-1012.
Jennings, S.B. et al. 1999. Assessing forest canopies and understorey illumination: canopy closure,
canopy cover and other measures. - Forestry 72: 59-73.
Jucker, T. et al. 2014. Stabilizing effects of diversity on aboveground wood production in forest
ecosystems: linking patterns and processes. – Ecol. Lett. 17: 1560-1569.
Jules, E.S. et al. 2014. Host heterogeneity influences the impact of a non-native disease invasion on
populations of a foundation tree species. - Ecosphere 5: 105.
Jung, K. et al. 2012. Moving in three dimensions: effects of structural complexity on occurrence and
activity of insectivorous bats in managed forest stands. – J. Appl. Ecol. 49: 523-531.
Keller, A.B. et al. 2013. Effects of canopy tree species on belowground biogeochemistry in a lowland wet
tropical forest. - Soil Biol. Biochem. 58: 61-69.
Acc
epte
d A
rtic
le
‘This article is protected by copyright. All rights reserved.’
Kennedy, C.E.J. and Southwood, T.R.E. 1984. The number of species of insects associated with British
trees: a re-analysis. – J An Ecol 53: 455-478.
Korenko, S. et al. 2011. Are arboreal spiders associated with particular tree canopies? - North-Western J.
Zool. 7: 261-269.
Laliberté, E. 2014. FD: measuring functional diversity (FD) from multiple traits, and other tools for
functional ecology. R Package Version 1.0-12.
Laliberté, E. and Legendre, P. 2010. A distance-based framework for measuring functional diversity from
multiple traits. - Ecology 91: 299-305.
Lefcheck, J. 2016. PiecewiseSEM: Piecewise Structural Equation Modelling. R package version 1.2.1.
Levine, J.M. and HilleRisLambers, J. 2009. The importance of niches for the maintenance of species
diversity. - Nature 461: 254-258.
Lindenmayer, D. and Franklin, J.F. 2002. Conserving forest biodiversity: a comprehensive multiscaled
approach - Island Press.
Martens, S.N. et al. 2000. Spatial distributions of understory light along the grassland/forest continuum:
effects of cover, height, and spatial pattern of tree canopies.- Ecol. Model. 126: 79-93.
Mason, N.W.H. et al. 2005. Functional richness, functional evenness and functional divergence: the
primary components of functional diversity. - Oikos 111: 112-118.
Messier, C. et al. 1998. Effects of overstory and understory vegetation on the understory light
environment in mixed boreal forests. – J. Veg. Science 9: 511-520.
Milligan, H.T. and Koricheva, J. 2013. Effects of tree species richness and composition on moose winter
browsing damage and foraging selectivity: an experimental study. – J. Anim. Ecol. 82: 739-748.
Nakagawa, S. and Schielzeth, H. 2013. A general and simple method for obtaining R² from generalized
linear mixed-effects models. - Methods Ecol. Evol. 4: 133–142.
Nguyen, D. et al. 2016. Fungal disease incidence along tree diversity gradients depends on latitude in
European forests. - Ecol Evol 6: 2426-2438.
Acc
epte
d A
rtic
le
‘This article is protected by copyright. All rights reserved.’
Paquette, A. and Messier, C. 2011. The effect of biodiversity on tree productivity: from temperate to
boreal forests. - Global Ecol Biogeo 20: 170-180.
Parker, I.M. et al. 2015. Phylogenetic structure and host abundance drive disease pressure in
communities. – Nature 520: 542-544.
Petchey, O.L. and Gaston, K.J. 2006. Functional diversity: back to basics and looking forward. – Ecol.
Lett. 9: 741-758.
Plath, M. et al. 2012. Associational resistance and associational susceptibility: specialist herbivores show
contrasting responses to tree stand diversification. – Oecologia 169: 477-487.
Pollastrini, M. et al. 2013. Interactions and competition processes among tree species in young
experimental mixed forests, assessed with chlorophyll fluorescence and leaf morphology. – Plant Biol.
16: 323-331.
Potts, S.G. et al. 2003. Linking bees and flowers: how do floral communities structure pollinator
communities? – Ecology 84: 2628-2642.
R Core Team. 2014. R: a language and environment for statistical computing. R Foundation for Statistical
Computing, Vienna, Austria. (www.R-project.org)
Reich, P.B. et al. 2005. Linking litter calcium, earthworms and soil properties: a common garden test with
14 tree species. – Ecol. Lett. 8: 811-818.
Ricotta, C. and Moretti, M. 2011. CWM and Rao’s quadratic diversity: a unified framework for
functional ecology. - Oecologia 167: 181-188.
Robertson, M. and Aviles, L. 2019. Rain, predators and vegetation lushness may structure web-building
spider communities along precipitation gradients. - Ecological Entomology 44: 217-226.
Rosch, C. et al. 2002. Biodiversity of denitrifying and dinitrogen-fixing bacteria in an acid forest soil. –
Appl. Env. Microbiol. 68: 3818-3829.
Rowe, E.C. et al. 2006. Fertilizer application during primary succession changes the structure of
plant and herbivore communities. – Biol. Conserv. 131: 510-522.
Acc
epte
d A
rtic
le
‘This article is protected by copyright. All rights reserved.’
Ruiz-Benito, P. et al. 2014. Diversity increases carbon storage and tree productivity in Spanish
forests. Global Ecol. Biogeo. – 23: 311-322.
Sardans, J. et al. 2011. Factors affecting nutrient concentration and stoichiometry of forest trees in
Catalonia (NE Spain). - For. Ecol. Manage. 262: 2024-2034.
Scherber, C. et al. 2010. Bottom-up effects of plant diversity on multitrophic interactions on a
biodiversity experiment. - Nature 468: 553-556.
Scherer-Lorenzen, M. 2014. The functional role of biodiversity in the context of global change. - In:
Burslem, D. et al. (eds), Forests and Global Change. Cambridge Univ. Press, pp. 195-238.
Schielzeth, H. 2010. Simple means to improve the interpretability of regression coefficients. - Methods
Ecol Evol 1:103–113.
Schuldt, A. et al. 2019. Multiple plant diversity components drive consumer communities across
ecosystems. - Nature Communications 10: 1460.
Siemann, E. 1998. Experimental tests of effects of plant productivity and diversity on grassland arthropod
diversity. - Ecology 79: 2057–2070.
Siemann, E. et al. 1998. Experimental tests of the dependence of arthropod diversity on plant diversity. -
American Naturalist 152, 738-750.
Silvertown, J. 2004. Plant coexistence and the niche. - Trends in Ecology & Evolution 19: 605-611.
Sobek, S. et al. 2009. Sapling herbivory, invertebrate herbivores and predators across a natural tree
diversity gradient in Germany’s largest connected deciduous forest. - Oecologia 160: 279-288.
Soliveres, S. et al. 2016. Biodiversity at multiple trophic levels is needed for ecosystem
multifunctionality. - Nature 536: 456-459.
Stephens, D.W. and Krebs, J.R. 1986. Foraging Theory - Princeton Univ. Press.
van der Plas, F. et al. 2016a. Jack-of-all-trades effects drive biodiversity-ecosystem multifunctionality
relationships in European forests. - Nature Comm. 7: 11109.
van der Plas, F. et al. 2016b. Biotic homogenization can decrease landscape-scale forest
multifunctionality. – Proc. Natl Acad. Sci. USA 113: 3557-3562.
Acc
epte
d A
rtic
le
‘This article is protected by copyright. All rights reserved.’
Wang, L. et al. 2010. Mechanisms linking plant species richness to foraging of a large herbivore. – J.
Appl. Ecol. 47: 868-875.
Whelan, C.J. 2001. Foliage structure influences foraging of insectivorous forest birds: an experimental
study. - Ecology 82: 219-231.
WorldClim Version 1 – Global Climate Data. http://www.worldclim.org/node/1. 2015.
Zhang, J. et al. 2013. Local forest structure, climate and human disturbances determine regional
distribution of boreal bird species richness in Alberta, Canada. – J. Biogeogr. 40: 1131-1142.
Zhang K. et al. 2016. Plant diversity accurately predicts insect diversity in two tropical landscapes. - Mol.
Biol. 25: 4407-4419.
Acc
epte
d A
rtic
le
‘This article is protected by copyright. All rights reserved.’
Figure Legends
Figure 1. Drivers of diversity of forest-associated taxa. Relative effects of the explanatory variables on
each of the taxon-level diversities and on multidiversity. Colours show the relative size and direction of
the effects of each explanatory variable, in units of standard deviations. Blue colours represent a positive
effect and red colours a negative effect. An asterisk indicates that bootstrapped confidence intervals
around the parameter did not include 0 and that the effect was significant. Marginal and conditional R² are
indicated for each model. Brackets for the effect of proportion of coniferous species on multidiversity
indicate that this effect may be partially spurious, see text (SR: species richness; funct.: functional;
propn.: proportion; CWM: community weighted mean; horiz: horizontal; vert: vertical; Marg: marginal;
Cond: conditional).
Acc
epte
d A
rtic
le
‘This article is protected by copyright. All rights reserved.’
Figure 2. Drivers of abundance/activity of forest-associated taxa. Relative effects of the explanatory
variables on the taxon-level abundance/activity and on multiabundance/activity For details, see legend of
Fig. 1. The effect of vertical heterogeneity on understorey plant abundance is not shown (black box) as
this effect is spurious.
Acc
epte
d A
rtic
le
‘This article is protected by copyright. All rights reserved.’
Figure 3. Correlations between diversities of all taxa. Numbers in the upper triangle represent the Pearson
correlation coefficients (‘***’: p≤0.001; ‘**’: p≤0.01; ‘*’: p≤0.05). Figures in the lower triangle and on
the diagonal represent scatter plots and distribution plots, respectively.
Acc
epte
d A
rtic
le
‘This article is protected by copyright. All rights reserved.’
Figure 4. Correlations between log-transformed abundance/activity of all taxa. Numbers in the upper
triangle represent the Pearson correlation coefficients (‘***’: p≤0.001; ‘**’: p≤0.01; ‘*’: p≤0.05). Figures
in the lower triangle and on the diagonal represent scatter plots and distribution plots, respectively.
Acc
epte
d A
rtic
le
‘This article is protected by copyright. All rights reserved.’
Figure 5. Drivers of diversity residuals of forest-associated taxa (after correcting for abundance/activity).
Relative effects of the explanatory variables on residuals of each of the taxon-level diversities and on
residuals of multidiversity, after diversity and multidiversity were corrected for abundance/activity and
multiabundance/activity, respectively. Colours show the relative size and direction of the effects of each
explanatory variable, in units of standard deviations. Blue colours represent a positive effect and red
colours a negative effect. An asterisk indicates that bootstrapped confidence intervals around the
parameter did not include 0 and that the effect was significant (SR: species richness; funct.: functional;
propn.: proportion; CWM: community weighted mean; horiz: horizontal; vert: vertical).