Embed Size (px)
Citation preview

Arboriculture & Urban Forestry 43(1): January 2017
©2017 International Society of Arboriculture
1
F.D. Cowett and Nina Bassuk
Street Tree Diversity in Three Northeastern U.S. States
Abstract. Street tree diversity is widely viewed as a key component in the resilience of street tree populations to pests, diseases, and climate change. Assessment of street tree diversity is considered integral to sustainable street tree management and preservation of the ecosystem services and social benefits that street trees provide. This paper assesses street tree diversity in three northeastern U.S. states—New Jersey, New York, and Pennsylvania—by analyzing municipal street tree inventory data stratified by the 2012 USDA Plant Hardi-ness Zones. Despite the lesson learned from the historical devastation of overplanted American elms (Ulmus americana) by Dutch elm disease, and awareness of the contemporary threats posed to ashes (Fraxinus spp.) by the emerald ash borer (Agrilus planipennis) and to maples (Acer spp.), and other tree genera by the Asian longhorned beetle (Anoplophora glabripennis), results presented here indi-cate a current concentration of street trees among a relatively small number of species and genera, and in particular the dominance of maples as street trees. Results also show a positive relationship between street tree diversity and warmer average minimum winter temperatures. Consequently, there is a clear need in all three states for greater species and genus diversity in statewide and munici-pal street tree populations. However, meaningful impediments exist to increasing street tree diversity, especially in the short term. Key Words. Acer spp.; Diversity Indices; Ecosystem Services; New Jersey; New York; Pennsylvania; Resilience; Street Trees.
Arboriculture & Urban Forestry 2017. 43(1):1–14
Biological diversity at the species level has been associated with the stability and productivity of non-urban vegetated ecosystems (Bezemer and van der Putten 2006; Tilman et al. 2006; Cadotte et al. 2012), including non-urban forest ecosystems (Thompson et al. 2009). Urban forest ecosystems differ meaning-fully from non-urban forest ecosystems, since factors typically found in urban environments, including but not limited to buildings, impervious surfaces, anthropogenic soils, pollution, and the urban heat is-land, may not be found in non-urban environments or at least not to the same degree (Nock et al. 2013). Despite these differences, however, and similar to the non-urban forest, urban tree diversity has been associated with the stability and productivity of the urban forest and with continued provision of ecosys-tem services and social benefits (Manes et al. 2012).
Street trees growing in public street rights-of-way typically comprise a minority of the urban forest and the services and benefits they provide (Dwyer et al. 2000). Nevertheless, they have received special atten-tion and have been a focus of urban forestry due to their public function (Clark et al. 1997; Cumming et
al. 2008). Because of the devastation wrought many years ago by Dutch elm disease on American elms (Ulmus americana) (Campanella 2003) and more current threats, such as those posed to ashes (Fraxinus spp.) by the emerald ash borer (Agrilus planipen-nis) (Poland and McCullough 2006) and to maples (Acer spp.) and other genera by the Asian long-horned beetle (Anoplophora glabripennis) (Smith and Wu 2008), diversity in street tree plantings is widely viewed as a key component in the resilience of street tree populations to pests, diseases, and cli-mate change, and assessment of street tree diversity is considered integral to sustainable street tree man-agement (Raupp et al. 2006; Sjöman et al. 2012).
Street tree diversity has been assessed at a vari-ety of geographic levels. It has most commonly been assessed at the level of the individual municipality from data collected in a complete or sample street tree inventory (Clark et al. 1997). In Syracuse, New York, U.S., for example, Sanders (1981) assessed street tree diversity for the city as a whole and for 17 city neighborhoods from a complete inventory of 32,517 street trees. In Davis, California, U.S., Maco

Cowett and Bassett: Street Tree Diversity in Three Northeastern U.S. States
©2017 International Society of Arboriculture
2
and McPherson (2003) assessed street tree diversity for the city as a whole and for 11 sampling zones from a sample of 3,089 public and privately man-aged trees located within the city’s right-of-way.
Street tree diversity also has been assessed at broader geographic levels, such as a region or state. Lesser (1996) assessed street tree diversity in south-ern California based on inventory data from 21 cities, Ball et al. (2007) assessed street tree diver-sity in South Dakota, U.S., based on inventory data from 34 communities statewide, and Raupp et al. (2006) assessed street tree diversity in the temperate zone of eastern North America based on inven-tory data from 12 cities and one college campus.
Finally, street tree diversity has been assessed at still broader geographic levels involving multi-ple countries and continents. Sjöman et al. (2012) assessed Nordic street tree diversity based on inven-tory data from 10 cities in four countries, and Kendal et al. (2014) assessed global street tree diversity based on tree species lists from 108 cities in six continents. In all the studies cited here, deficiencies were found in street tree diversity using a variety of metrics.
One common metric employed to assess street tree diversity is frequency distribution, where the relative abundances of street trees belonging to botanic species, genera, and families are calcu-lated as percentages of the population as a whole. Relative abundance metrics were popularized by Santamour (1990), who advocated for more even distributions of street tree species, genera, and families in municipal street tree populations. Santamour proposed as a general rule that no tree species should comprise more than 10%, no tree genus should comprise more than 20%, and no tree family should comprise more than 30% of a municipality’s street tree population. Thus, Sand-ers (1981) found Norway maple (Acer platanoides) to comprise 37.5% of all street trees in Syracuse, New York, U.S.; Lesser (1996) found American sweetgum (Liquidambar styraciflua) to comprise 14.27% of all street trees in 21 southern California cities; and Ball et al. (2007) found ashes (Fraxinus spp.) to comprise 36.3% of all street trees in 34 South Dakota communities. Santamour’s 10-20-30 benchmarks have become a widely accepted rule-of-thumb, even though there is a lack of scientific or empirical evidence to validate those numbers as effective thresholds. Additionally, it has been
argued that applying the 10-20-30 rule in some urban landscapes may be counterproductive to street tree management by replacing well-adapted tree species with underperforming ones (Richards 1993; Kendal et al. 2014). Conversely, more strin-gent standards than Santamour’s have been offered before and since. Barker (1975) proposed that no tree species should comprise more than 5% of the street tree population, Bassuk et al. (2009) proposed limiting any one street tree species to between 5% and 10% of the street tree population, and Ball (2015) proposed that no tree genus should com-prise more than 5% of the street tree population.
A diversity index is another metric employed in assessing street tree diversity. Many indices have been utilized in ecology and environmental science to make comparisons between biological populations. These indices usually consider more than simply relative abundance and include such factors as population size and species richness (the number of species in the population) in their calculation. Two indices often used in assessing street tree diversity are Simpson’s Diversity Index (Simpson 1949) and the Shannon-Wiener Diver-sity Index (Shannon 1948). Simpson’s Diversity Index calculates the proportion of species i rela-tive to the total number of species (pi), sums the squared proportions for all the species, and then takes the reciprocal, according to the formula:
[1]
The Shannon-Wiener Diversity Index calcu-lates the proportion of species i relative to the total number of species (pi), which is then mul-tiplied by the natural logarithm of this propor-tion (lnpi), summed across all species, and then multiplied by -1, according to the formula:
[2]
Simpson is sometimes preferred to Shannon-Wiener because it gives more weight to the more abundant species and is therefore more sensi-tive to the distribution evenness advocated by Santamour than to species richness; Shannon-
[1]
𝐷𝐷𝐷𝐷 = 1/�𝑝𝑝𝑝𝑝i2
𝑠𝑠𝑠𝑠
𝑖𝑖𝑖𝑖=1
[2]
𝐻𝐻𝐻𝐻 = −�𝑝𝑝𝑝𝑝i
𝑠𝑠𝑠𝑠
𝑖𝑖𝑖𝑖=1
ln𝑝𝑝𝑝𝑝i
[1]
𝐷𝐷𝐷𝐷 = 1/�𝑝𝑝𝑝𝑝i2
𝑠𝑠𝑠𝑠
𝑖𝑖𝑖𝑖=1
[2]
𝐻𝐻𝐻𝐻 = −�𝑝𝑝𝑝𝑝i
𝑠𝑠𝑠𝑠
𝑖𝑖𝑖𝑖=1
ln𝑝𝑝𝑝𝑝i
Arboriculture & Urban Forestry 43(1): January 2017
©2017 International Society of Arboriculture
3
Wiener is sometimes preferred to Simpson because it gives more weight to less abundant species and is more sensitive to sample size (Bar-bour et al. 1987; Colwell 2009). Despite these distinctions, Simpson and Shannon-Wiener have been applied somewhat interchangeably in assessing street tree diversity. For example, Maco et al. (2005) used Simpson’s Diversity Index to assess street tree diversity in Berkeley, California, Dobbs et al. (2013) used the Shannon-Wiener Diversity Index to compare tree species composi-tion between streets, parks, and private property in Melbourne, Australia, and Jim and Chen (2009) and Kara (2012) used both the Simpson and Shannon-Wiener indices to assess street tree diversity in Taipei, Taiwan, and Aydin, Tur-key, respectively. Additionally, Sun (1992) and Sreetheran et al. (2011) used the inverse of Simp-son’s Diversity Index (1/SDI) to equate an inverse SDI value of 10 with Santamour’s 10% rule for species and an Inverse SDI value of 20 with a 5% benchmark for species; Subburayalu and Sydnor (2012) used a Simpson Diversity Index weighted by environmental benefits, pest vulnerability, and taxon adaptability to identify areas requiring increased street tree diversity in four Ohio, U.S., communities. As with Santamour’s 10-20-30 rule, results reported for the Simpson and Shannon- Wiener indices have not been equated scien-tifically with effective thresholds for street tree diversity. However, the Simpson and Shannon- Wiener indices and relative abundance metrics have been employed not only to make quan-titative comparisons for street tree diversity between neighborhoods, municipalities, regions, and other geographic levels, but also to explore explanatory factors. Thus, McPherson and Rown-tree (1989) and Pauleit (2002) found greater street tree diversity to be associated with warmer climate, Jim and Chen (2009) found greater street tree diversity in older neighborhoods, and Kara (2012) found differences in street tree diversity based on land use and street type.
This paper assesses street tree diversity for three states in the northeastern United States—New Jersey, New York, and Pennsylvania—based on street tree inventory data obtained from municipalities in these states. It quantifies dif-ferences in diversity, between municipalities
and between states, and considers explanatory factors. Finally, this paper makes recommenda-tions for increasing diversity so as to enhance the resilience of street tree populations to pests, diseases, and climate change, and ensure the continued provision of ecosystem services and social benefits associated with street trees.
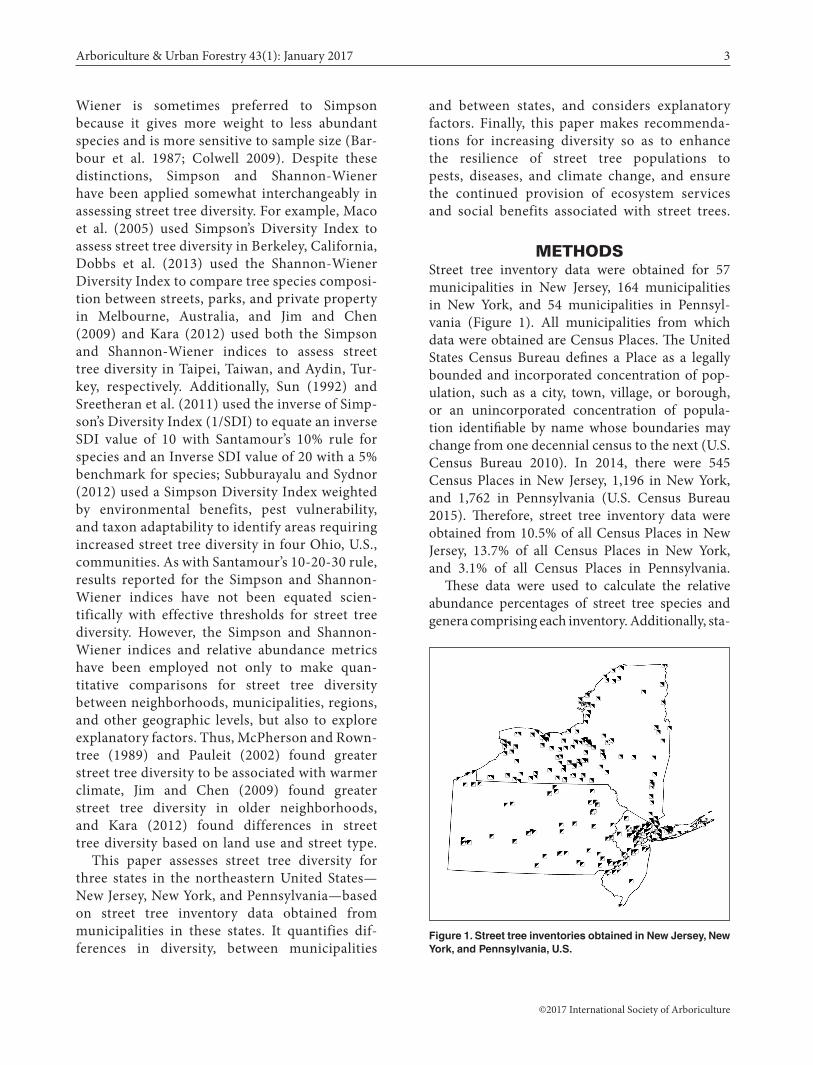
METHODSStreet tree inventory data were obtained for 57 municipalities in New Jersey, 164 municipalities in New York, and 54 municipalities in Pennsyl-vania (Figure 1). All municipalities from which data were obtained are Census Places. The United States Census Bureau defines a Place as a legally bounded and incorporated concentration of pop-ulation, such as a city, town, village, or borough, or an unincorporated concentration of popula-tion identifiable by name whose boundaries may change from one decennial census to the next (U.S. Census Bureau 2010). In 2014, there were 545 Census Places in New Jersey, 1,196 in New York, and 1,762 in Pennsylvania (U.S. Census Bureau 2015). Therefore, street tree inventory data were obtained from 10.5% of all Census Places in New Jersey, 13.7% of all Census Places in New York, and 3.1% of all Census Places in Pennsylvania.
These data were used to calculate the relative abundance percentages of street tree species and genera comprising each inventory. Additionally, sta-
Figure 1. Street tree inventories obtained in New Jersey, New York, and Pennsylvania, U.S.
Cowett and Bassett: Street Tree Diversity in Three Northeastern U.S. States
©2017 International Society of Arboriculture
4
tistics for Simpson’s Diversity Index, the Shannon- Wiener Diversity Index, and distribution evenness (Buzas and Gibson 1969) at species and genus levels were calculated using PAST Paleontological Statis-tics software Version 3.0 (Hammer et al. 2001). Sta-tistics for the inverse of Simpson’s Diversity Index were also determined. Some municipalities either collected data for genus and not species, or collected data at the species level for some but not all genera. Therefore, the number of municipalities for which relative abundance percentages and diversity-index statistics can be calculated at the genus level exceeds the number of municipalities for which relative abundance percentages and diversity-index statistics can be calculated at the species level.
Because the relative abundance percentages and diversity-index statistics mentioned comprise a non-random sample, there is a potential for selec-tion bias and geographic variability to compromise the accuracy of further statistical analysis. Post-stratification of data and weighting with auxiliary information is a technique often used to correct for selection bias due to non-random sampling (Bethle-hem 2010). A New York State street tree assessment conducted previously by the authors (Cowett and Bassuk 2014), based on a non-random sample, strat-ified data by the 1990 USDA Plant Hardiness Zones (U.S. National Arboretum 1990) and then weighted the stratified data by a measure of street length con-tained within each zone. To correct for potential selection bias due to non-random sampling, a simi-lar technique was considered for this assessment.
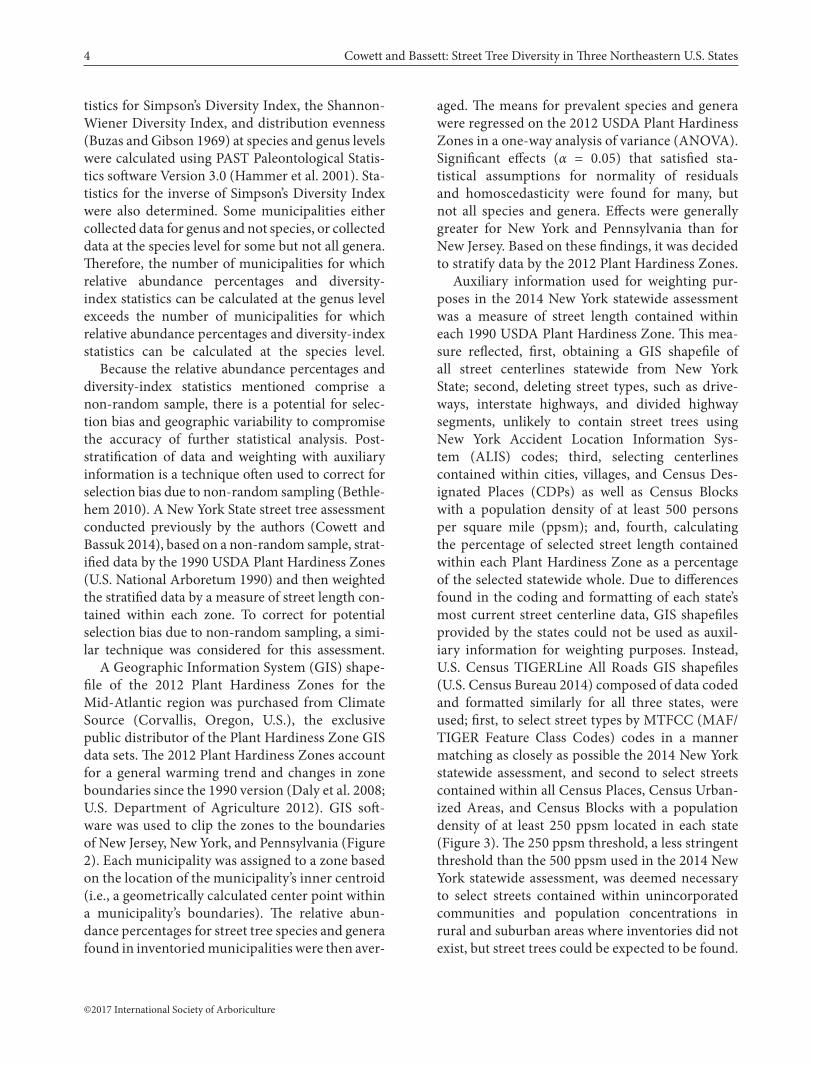
A Geographic Information System (GIS) shape-file of the 2012 Plant Hardiness Zones for the Mid-Atlantic region was purchased from Climate Source (Corvallis, Oregon, U.S.), the exclusive public distributor of the Plant Hardiness Zone GIS data sets. The 2012 Plant Hardiness Zones account for a general warming trend and changes in zone boundaries since the 1990 version (Daly et al. 2008; U.S. Department of Agriculture 2012). GIS soft-ware was used to clip the zones to the boundaries of New Jersey, New York, and Pennsylvania (Figure 2). Each municipality was assigned to a zone based on the location of the municipality’s inner centroid (i.e., a geometrically calculated center point within a municipality’s boundaries). The relative abun-dance percentages for street tree species and genera found in inventoried municipalities were then aver-
aged. The means for prevalent species and genera were regressed on the 2012 USDA Plant Hardiness Zones in a one-way analysis of variance (ANOVA). Significant effects (α = 0.05) that satisfied sta-tistical assumptions for normality of residuals and homoscedasticity were found for many, but not all species and genera. Effects were generally greater for New York and Pennsylvania than for New Jersey. Based on these findings, it was decided to stratify data by the 2012 Plant Hardiness Zones.
Auxiliary information used for weighting pur-poses in the 2014 New York statewide assessment was a measure of street length contained within each 1990 USDA Plant Hardiness Zone. This mea-sure reflected, first, obtaining a GIS shapefile of all street centerlines statewide from New York State; second, deleting street types, such as drive-ways, interstate highways, and divided highway segments, unlikely to contain street trees using New York Accident Location Information Sys-tem (ALIS) codes; third, selecting centerlines contained within cities, villages, and Census Des-ignated Places (CDPs) as well as Census Blocks with a population density of at least 500 persons per square mile (ppsm); and, fourth, calculating the percentage of selected street length contained within each Plant Hardiness Zone as a percentage of the selected statewide whole. Due to differences found in the coding and formatting of each state’s most current street centerline data, GIS shapefiles provided by the states could not be used as auxil-iary information for weighting purposes. Instead, U.S. Census TIGERLine All Roads GIS shapefiles (U.S. Census Bureau 2014) composed of data coded and formatted similarly for all three states, were used; first, to select street types by MTFCC (MAF/TIGER Feature Class Codes) codes in a manner matching as closely as possible the 2014 New York statewide assessment, and second to select streets contained within all Census Places, Census Urban-ized Areas, and Census Blocks with a population density of at least 250 ppsm located in each state (Figure 3). The 250 ppsm threshold, a less stringent threshold than the 500 ppsm used in the 2014 New York statewide assessment, was deemed necessary to select streets contained within unincorporated communities and population concentrations in rural and suburban areas where inventories did not exist, but street trees could be expected to be found.
Arboriculture & Urban Forestry 43(1): January 2017
©2017 International Society of Arboriculture
5
The percentage of selected street length con-tained within each 2012 Plant Hardiness Zone as a percentage of the selected statewide whole was cal-culated (Table 1). Substantial differences between
zones and states were found. For example, Zone 7 contained a majority of street length in New Jersey and the most street length in New York, whereas Zone 6 contained a majority of street length in Pennsylvania. These percentages were used to cre-ate weights for each state according to the formula:
[3] [(w1 • m1) + (w2 • m2) + (w3 • m3) + (w4 • m4)] / (w1 + w2 + w3 + w4)
Where m1, m2, m3, and m4 denote the group means (i.e., means for species and genus composi-tion in the 2012 USDA Plant Hardiness Zones) and w1, w2, w3, and w4 denote the different weights for each group (i.e., the relative percentage of summed selected street length in each 2012 USDA Plant Hardiness Zone). Zones 5, 6, and 7 can be found in all three states. The Zone 5 area in New Jersey is very small and is not associated with any municipal street tree data, containing only 0.006% of selected New Jersey street length. Therefore, for weighting purposes, selected New Jersey street length con-tained in Zone 5 was aggregated with selected street length contained in Zone 6. Zones 3 and 4 are found
Figure 2. 2012 USDA Plant Hardiness Zones for New Jersey, New York, and Pennsylvania, U.S.
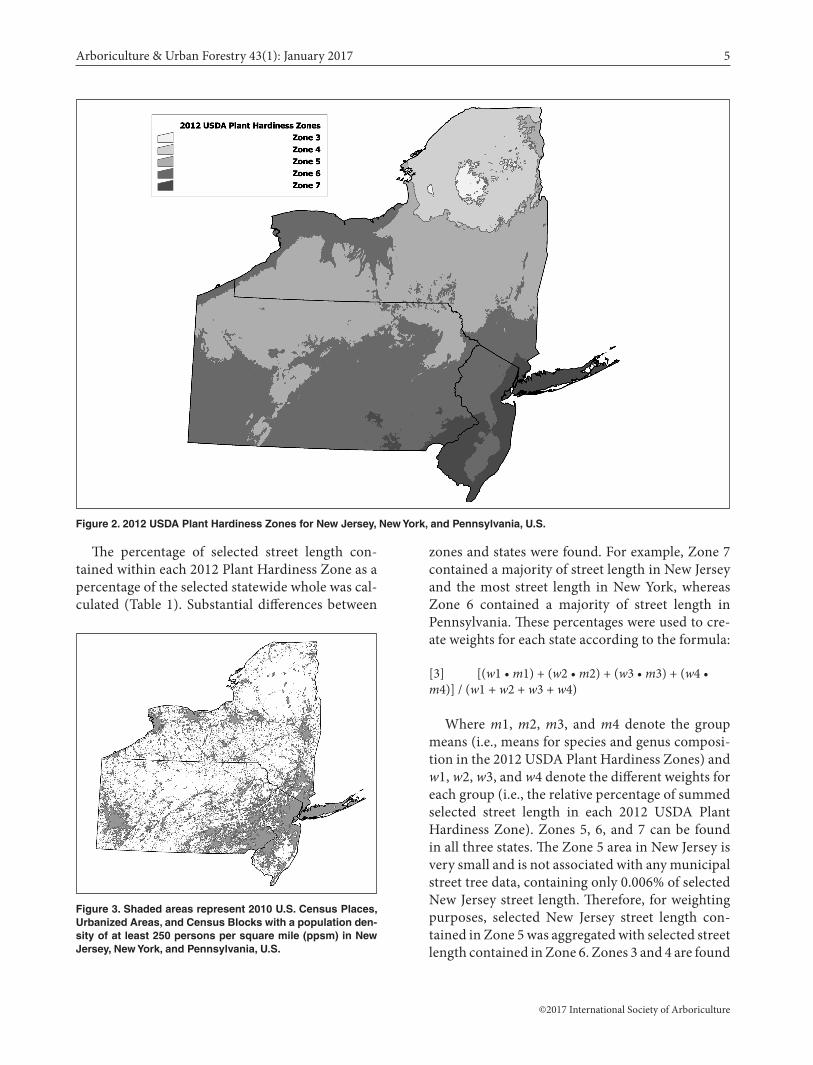
Figure 3. Shaded areas represent 2010 U.S. Census Places, Urbanized Areas, and Census Blocks with a population den-sity of at least 250 persons per square mile (ppsm) in New Jersey, New York, and Pennsylvania, U.S.

Cowett and Bassett: Street Tree Diversity in Three Northeastern U.S. States
©2017 International Society of Arboriculture
6
only in New York State. Zone 3 is sparsely popu-lated and not associated with any municipal street tree data, containing only 0.059% of all selected New York State street length. Therefore, for weight-ing purposes, selected New York State street length contained in Zone 3 was aggregated with selected street length contained in Zone 4. Finally, a regional weighted mean was created from the statewide weighted means based on the percentage of each state’s selected street length relative to the sum of selected street length found in all three states.
RESULTS
Species and Genus CompositionWeighted statewide relative abundance percentages were calculated for street tree species and genera from collated street tree inventory data (Table 2; Table 3). Acer platanoides (Norway maple) was found to be the most prevalent street tree species in all three states, with a regional weighted mean of 16.34% (14.63% in New Jersey, 19.80% in New York, and 15.08% in Pennsylvania). Acer spp. (ma-ple) was found to be the most prevalent street tree genus in all three states, with a regional weighted mean of 38.94% (36.72% in New Jersey, 40.91% in New York, and 38.96% in Pennsylvania). On both regional and statewide levels, these results exceed Santamour’s 10% rule for species, and his 20% rule for genus, and reflect abundance percentages found on the municipal level. Municipal species composition revealed that, for those municipalities from which street tree inventory data at the spe-cies level were obtained, 47 of 50 municipalities in New Jersey (94.0%), 152 of 153 municipalities in New York (99.3%), and 38 of 43 municipalities in Pennsylvania (88.4%) exceeded the 10% rule
proposed by Santamour. In most but not all cases, this was due to the percentage of street trees that were Acer platanoides (Norway maple), although in many municipalities the percentages of Acer rubrum (red maple), Acer saccharum (sugar maple), Gleditsia triacanthos (honeylocust), Platanus × acerifolia (London planetree), Pyrus calleryana (Callery pear), Quercus palustris (pin oak), and/or Quercus rubra (northern red oak) surpassed 10%. Municipal genus composition revealed that, for those municipalities from which street tree in-ventory data at the genus level were obtained, 56 of 57 municipalities in New Jersey (98.2%), 162 of 164 municipalities in New York (98.8%), and 53 of 54 municipalities in Pennsylvania (98.1%) exceeded the 20% rule proposed by Santamour. In most but not all cases, this was due to the per-centage of street trees belonging to the Acer genus, although in many municipalities the percentages of Gleditsia spp., Malus spp. (crabapple), Platanus spp. (planetree), Pyrus spp. (pear), Quercus spp. (oak), and/or Tilia spp. (linden) surpassed 20%.
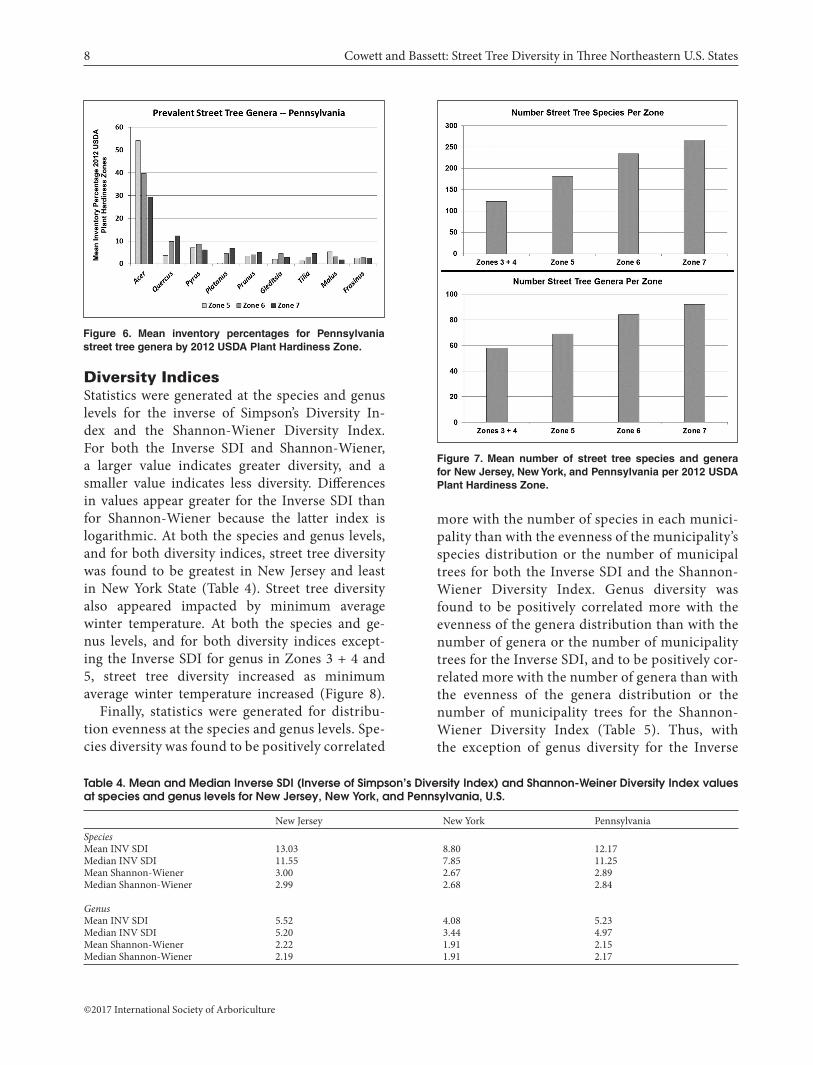
Minimum average winter temperature as repre-sented by the 2012 USDA Plant Hardiness Zones appeared to impact species and genus composition, as substantial differences were found between the zones for many but not all species and genera. Differences were more pronounced in New York and Pennsylva-nia than in New Jersey. For example, in New Jersey, differences were found for some, but not all, street tree genera (Figure 4); in New York, differences were found for most street tree species (Figure 5); and in Pennsylvania, differences were found for most street tree genera (Figure 6). In addition, the mean num-ber of street tree species and genera per zone for the three states was found to increase as minimum average winter temperature increased (Figure 7).
Table 1. Summed selected street length contained within the 2012 USDA Plant Hardiness Zones in New Jersey, New York, and Pennsylvania, U.S.
2012 Plant Hardiness Zone Zone 3 Zone 4 Zone 5 Zone 6 Zone 7New JerseyStreet Length in Meters 0 0 3,394 16,915,805 39,159,020Percent of Statewide Total 0.000% 0.000% 0.006% 30.165% 69.829%
New YorkStreet Length in Meters 51,687 3,043,301 24,698,158 25,043,999 35,072,884Percent of Statewide Total 0.059% 3.462% 28.095% 28.488% 39.896%
Pennsylvania Street Length in Meters 0 0 7,830,965 70,396,700 17,736,544Percent of Statewide Total 0.000% 0.000% 8.160% 73.357% 18.482%

Arboriculture & Urban Forestry 43(1): January 2017
©2017 International Society of Arboriculture
7
Table 2. Weighted, statewide, relative abundance percentages for street tree species in New Jersey, New York, and Pennsylvania, U.S.
Species NJ NY PA Mean Acer platanoides 14.63 19.80 15.08 16.34Acer rubrum 10.79 5.23 8.78 8.27Acer saccharum 4.74 8.47 9.43 7.92Pyrus calleryana 6.59 5.63 7.68 6.80Quercus palustris 8.92 3.87 5.85 6.08Platanus × acerifolia 6.14 6.09 4.20 5.26Gleditsia triacanthos 3.02 5.03 4.29 4.17Acer saccharinum 3.05 4.94 3.82 3.94Quercus rubra 3.31 1.91 3.02 2.77Tilia cordata 1.79 2.61 1.85 2.14Malus spp. 0.85 2.28 2.80 2.06Fraxinus pennsylvanica 1.56 1.98 1.30 1.57Zelkova serrata 2.11 1.13 1.37 1.50Liquidambar styraciflua 1.50 0.80 1.11 1.12Fraxinus americana 1.48 0.85 0.75 0.97Picea abies 0.70 1.18 0.88 0.92Pinus strobus 0.91 1.22 0.54 0.91Ginkgo biloba 0.71 0.88 1.05 0.84
Table 3. Weighted, statewide, relative abundance percentages for street tree genera in New Jersey, New York, and Penn-sylvania, U.S.
Genus NJ NY PA MeanAcer 36.72 40.91 38.96 38.94Quercus 15.12 8.44 9.73 10.77Pyrus 6.39 6.36 7.95 7.08Platanus 6.92 6.30 4.61 5.71Gleditsia 2.78 4.76 3.98 3.89Prunus 3.75 3.09 4.07 3.70Tilia 3.97 4.09 3.14 3.63Fraxinus 4.18 3.29 2.62 3.23Picea 1.57 2.70 2.64 2.38Malus 0.78 2.26 3.03 2.22Zelkova 2.02 1.16 1.40 1.49Pinus 1.27 1.71 1.19 1.36Ulmus 1.15 1.38 1.30 1.29Cornus 1.18 0.98 1.32 1.19Liquidambar 1.38 0.84 0.99 1.05Ginkgo 0.73 0.81 1.12 0.93Robinia 0.74 1.08 0.32 0.65
Figure 4. Mean inventory percentages for New Jersey street tree genera by 2012 USDA Plant Hardiness Zone.
Figure 5. Mean inventory percentages for New York street tree species by 2012 USDA Plant Hardiness Zone.
Cowett and Bassett: Street Tree Diversity in Three Northeastern U.S. States
©2017 International Society of Arboriculture
8
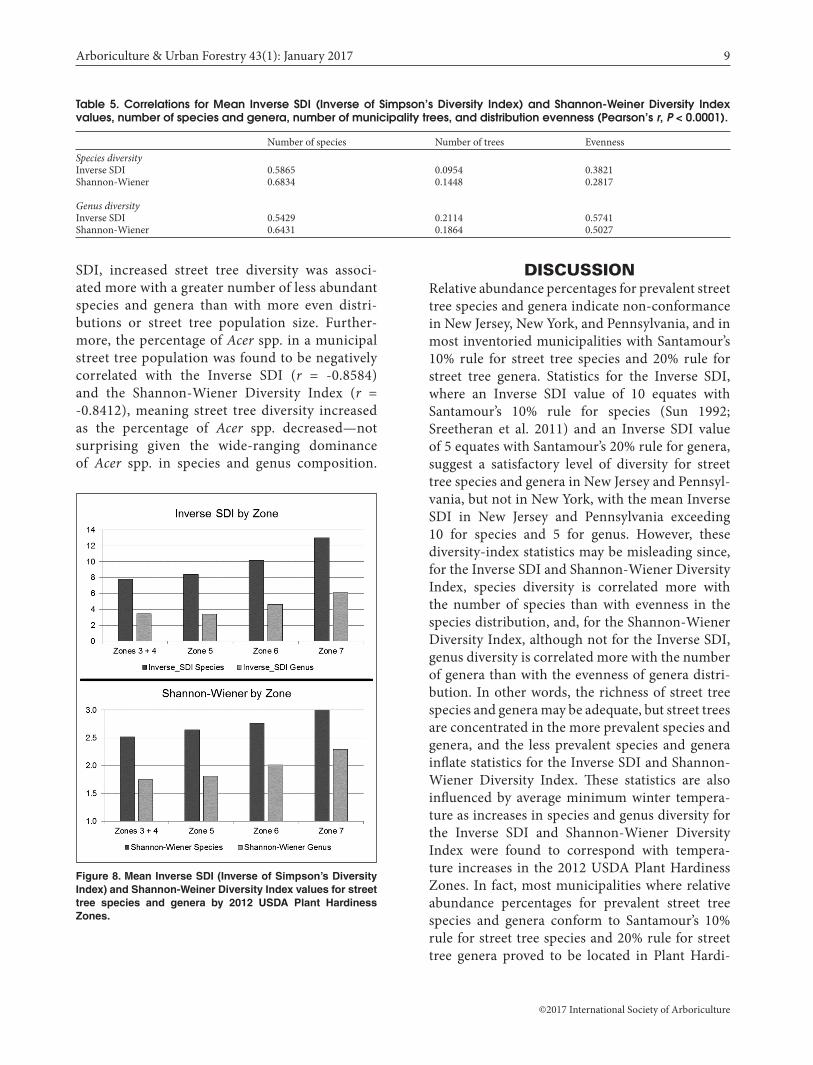
Diversity IndicesStatistics were generated at the species and genus levels for the inverse of Simpson’s Diversity In-dex and the Shannon-Wiener Diversity Index. For both the Inverse SDI and Shannon-Wiener, a larger value indicates greater diversity, and a smaller value indicates less diversity. Differences in values appear greater for the Inverse SDI than for Shannon-Wiener because the latter index is logarithmic. At both the species and genus levels, and for both diversity indices, street tree diversity was found to be greatest in New Jersey and least in New York State (Table 4). Street tree diversity also appeared impacted by minimum average winter temperature. At both the species and ge-nus levels, and for both diversity indices except-ing the Inverse SDI for genus in Zones 3 + 4 and 5, street tree diversity increased as minimum average winter temperature increased (Figure 8).
Finally, statistics were generated for distribu-tion evenness at the species and genus levels. Spe-cies diversity was found to be positively correlated
more with the number of species in each munici-pality than with the evenness of the municipality’s species distribution or the number of municipal trees for both the Inverse SDI and the Shannon-Wiener Diversity Index. Genus diversity was found to be positively correlated more with the evenness of the genera distribution than with the number of genera or the number of municipality trees for the Inverse SDI, and to be positively cor-related more with the number of genera than with the evenness of the genera distribution or the number of municipality trees for the Shannon-Wiener Diversity Index (Table 5). Thus, with the exception of genus diversity for the Inverse
Figure 7. Mean number of street tree species and genera for New Jersey, New York, and Pennsylvania per 2012 USDA Plant Hardiness Zone.
Table 4. Mean and Median Inverse SDI (Inverse of Simpson’s Diversity Index) and Shannon-Weiner Diversity Index values at species and genus levels for New Jersey, New York, and Pennsylvania, U.S.
New Jersey New York PennsylvaniaSpecies Mean INV SDI 13.03 8.80 12.17Median INV SDI 11.55 7.85 11.25Mean Shannon-Wiener 3.00 2.67 2.89Median Shannon-Wiener 2.99 2.68 2.84 GenusMean INV SDI 5.52 4.08 5.23Median INV SDI 5.20 3.44 4.97Mean Shannon-Wiener 2.22 1.91 2.15Median Shannon-Wiener 2.19 1.91 2.17
Figure 6. Mean inventory percentages for Pennsylvania street tree genera by 2012 USDA Plant Hardiness Zone.
Arboriculture & Urban Forestry 43(1): January 2017
©2017 International Society of Arboriculture
9
SDI, increased street tree diversity was associ-ated more with a greater number of less abundant species and genera than with more even distri-butions or street tree population size. Further-more, the percentage of Acer spp. in a municipal street tree population was found to be negatively correlated with the Inverse SDI (r = -0.8584) and the Shannon-Wiener Diversity Index (r = -0.8412), meaning street tree diversity increased as the percentage of Acer spp. decreased—not surprising given the wide-ranging dominance of Acer spp. in species and genus composition.
DISCUSSIONRelative abundance percentages for prevalent street tree species and genera indicate non-conformance in New Jersey, New York, and Pennsylvania, and in most inventoried municipalities with Santamour’s 10% rule for street tree species and 20% rule for street tree genera. Statistics for the Inverse SDI, where an Inverse SDI value of 10 equates with Santamour’s 10% rule for species (Sun 1992; Sreetheran et al. 2011) and an Inverse SDI value of 5 equates with Santamour’s 20% rule for genera, suggest a satisfactory level of diversity for street tree species and genera in New Jersey and Pennsyl-vania, but not in New York, with the mean Inverse SDI in New Jersey and Pennsylvania exceeding 10 for species and 5 for genus. However, these diversity-index statistics may be misleading since, for the Inverse SDI and Shannon-Wiener Diversity Index, species diversity is correlated more with the number of species than with evenness in the species distribution, and, for the Shannon-Wiener Diversity Index, although not for the Inverse SDI, genus diversity is correlated more with the number of genera than with the evenness of genera distri-bution. In other words, the richness of street tree species and genera may be adequate, but street trees are concentrated in the more prevalent species and genera, and the less prevalent species and genera inflate statistics for the Inverse SDI and Shannon-Wiener Diversity Index. These statistics are also influenced by average minimum winter tempera-ture as increases in species and genus diversity for the Inverse SDI and Shannon-Wiener Diversity Index were found to correspond with tempera-ture increases in the 2012 USDA Plant Hardiness Zones. In fact, most municipalities where relative abundance percentages for prevalent street tree species and genera conform to Santamour’s 10% rule for street tree species and 20% rule for street tree genera proved to be located in Plant Hardi-
Table 5. Correlations for Mean Inverse SDI (Inverse of Simpson’s Diversity Index) and Shannon-Weiner Diversity Index values, number of species and genera, number of municipality trees, and distribution evenness (Pearson’s r, P < 0.0001).
Number of species Number of trees EvennessSpecies diversityInverse SDI 0.5865 0.0954 0.3821Shannon-Wiener 0.6834 0.1448 0.2817
Genus diversityInverse SDI 0.5429 0.2114 0.5741Shannon-Wiener 0.6431 0.1864 0.5027
Figure 8. Mean Inverse SDI (Inverse of Simpson’s Diversity Index) and Shannon-Weiner Diversity Index values for street tree species and genera by 2012 USDA Plant Hardiness Zones.

Cowett and Bassett: Street Tree Diversity in Three Northeastern U.S. States
©2017 International Society of Arboriculture
10
ness Zone 7, which has the warmest average mini-mum winter temperatures of all zones associated with New Jersey, New York, and Pennsylvania.
Thus, the results suggest insufficient species and genus diversity for street trees at regional, statewide, and municipal levels in three northeastern states. Lack of street tree diversity appears to be more of a pressing concern in New York than in New Jersey or Pennsylvania, owing at least in part to New York’s greater preponderance of Acer spp., less species and genera richness, and colder average minimum win-ter temperatures. However, street tree populations in New Jersey and Pennsylvania would also benefit from greater species and genus diversity. Unfortu-nately, increasing street tree diversity is easier said than done due to a variety of issues discussed in the following, many of which have been addressed by Polakowski et al. (2011) and Lohr (2013).
(1) The public street right-of-way, where most street trees are found, is typically an unhospitable environment for tree growth, health, and longevity. Air pollution, urban heat-island effect, drought, flooding, soil compaction, inadequate soil vol-ume, nutrient imbalances and deficiencies, winter street salt, and utility pruning are some of the many stressors associated with public street right-of-way planting locations. These stressors not only negatively impact street tree growth and acceler-ate tree mortality but also limit the number of tree species and genera adaptable to such conditions.
(2) Not all tree species adaptable to tough urban conditions make good street trees. Some tree species are poorly suited to be street trees due to their growth and branching habits. For example, silver maples (Acer saccharinum) are a fast-growing species toler-ant of wet and dry soils and easy to transplant. How-ever, they are also “weak-wooded,” prone to rot and decay, and vulnerable to sudden catastrophic branch failure capable of harming persons and property even when in apparently good condition, due to their characteristically narrow, v-shaped branch unions.
(3) Planting evenly spaced, even-aged trees of the same species along streets, avenues, and bou-levards to achieve an aesthetically pleasing visual uniformity is a formal planting scheme dating back to sixteenth century Europe (Couch 1992), which continues to be recommended (Gerhold and Porter 2000; Simons and Johnson 2008) and remains operative today. For example, the Monumental
Core Framework Plan to preserve Washington, D.C.’s National Mall calls for allées of Dutch-elm-disease-resistant Ulmus americana to be planted along major streets and park roads as a unify-ing landscape element (Sherald 2009), such as 88 ‘Princeton’ American elms planted in 2005 along Pennsylvania Avenue in front of the White House.
(4) Recognizing biodiversity as an important ecological concept does not necessarily translate into actions increasing plant diversity. For example, in a survey of plant nursery workers, Polakowski et al. (2011) found general acknowledgement among respondents that diversity of plant species in land-scapes is ecologically important, but also insufficient understanding as to why this is so or about the ways in which diversity relates to landscape practices, such as implementation of Santamour’s 10-20-30 rule.
(5) Less prevalent street tree species and genera are often unavailable from local suppliers or are unavailable in large enough numbers to significantly increase diversity. For example, Iles and Vold (2003) found that Iowa, U.S., nurseries overproduce, and Iowa landscape professionals specify a dispropor-tionately small number of species and cultivars; Ries (2009) interviewed numerous municipal foresters who were either unable to obtain from local suppli-ers less prevalent tree species for new plantings or were forced to obtain these tree species from more distant, non-local suppliers. Sydnor et al. (2010) found that only 3% to 5% of the trees desired by Ohio urban foresters were available from Ohio nurseries.
Many of these issues can be mitigated. Planting conditions for street tree species and genera can be improved by practices such as selecting the correct tree for a planting location based on above- and belowground conditions, watering newly planted trees during establishment and during extreme heat and/or drought, converting tree pits to continuous soil trenches, and using structural soil to facilitate root growth under paving into adjacent lawn areas. Visual uniformity can be accomplished while also satisfying the need for species diversity by group-ing trees that are visually compatible based on size, shape, branching density, and foliage texture (Bas-suk et al. undated). Better understanding of diversity importance can be achieved through increased edu-cation (Polakowski et al. 2011) and perhaps through a change in terminology by stressing the reduction of species and genera overuse (Ball et al. 2007).

Arboriculture & Urban Forestry 43(1): January 2017
©2017 International Society of Arboriculture
11
A more difficult issue to mitigate may be the avail-ability of less prevalent street tree species and gen-era. One possible strategy for improving availability is to implement forward contracting, in which the municipality enters into a formal agreement with a tree supplier to grow a stipulated number of trees and tree species at a predetermined price for delivery at a future date. For example, to meet the demands of its MillionTreesNYC tree planting cam-paign and increase street tree diversity, New York City contracted with a number of nurseries to grow less prevalent tree species and genera (Ries 2009). Another possible strategy is for a municipality to grow its own street trees. For example, in the 1990s, unable to obtain a desired mix of new plantings, Columbus, Ohio, decided to expand its municipal nursery to produce the trees required (Sydnor et al. 2010). However, while forward contracting and municipal tree production may be successful strate-gies for improving the availability of less prevalent street tree species and genera, as well as increasing street tree diversity, they may not be feasible for many if not most municipalities, especially munici-palities of smaller size who must buy from the exist-ing stock of wholesale tree nurseries. This stock was depleted by the “great recession” of 2008–2009, when many tree growers either went out of business or downsized. As a result, there is currently a short-age in the United States of 7.6 cm caliper trees for new plantings until at least 2017 (McClellan 2014; KAT 2015). Nevertheless, the demand for less prev-alent street tree species and genera exists and may in fact be increasing, due at least in part to shortages of previously overproduced species, such as red maple, zelkova, and pin oak (Rodda 2014), and also to the need for alternatives to ash in response to emer-ald ash borer (Zawislak 2015). Therefore, there is a need to better understand the factors influencing nursery growing decisions and how to best encour-age nurseries to make diverse species and genera available for sale (Conway and Vander Vecht 2015).
Implicit in this discussion are issues of time and scale. Just as it takes four to five years for growers to get trees to selling size (KAT 2015), increases in municipal street tree diversity cannot be achieved overnight. Apart from preemptive removals to deal with an invasive pest or disease, municipalities are not going to remove healthy, well-performing street trees simply to increase diversity. Therefore, although
most municipalities have no shortage of vacant sites where new street trees can be planted, significant structural change in municipal street tree species and genus composition can likely only take place through a consistent, long-term strategy of replacing more prevalent species and genera that have reached the end of their life cycles with less prevalent spe-cies and genera appropriate to planting conditions. For municipalities where the street tree population is more aged, the transition to greater diversity may be accomplished more quickly than in municipali-ties where the street tree population is younger.
Scale will also play a role, since, strictly in terms of the number of trees required, it is an easier task to increase species and genus diversity in a smaller sized municipality that has fewer street trees overall than in a larger sized municipality with more trees. For example, the percentages of Acer spp. in the street tree populations of Syracuse, New York, and Hastings-on-Hudson, New York, based on 2014 and 2013 street tree inventories, respectively, are relatively similar, with 35% in Syracuse and 39% in Hastings-on-Hudson. Syracuse is a much larger municipality with a much larger street tree popu-lation. Lowering the percentage of maples in Syra-cuse to 20% of the overall street tree population would entail replacing 4,800 street trees with other street tree genera, whereas to accomplish the same goal in Hastings-on-Hudson would entail replac-ing only 200 street trees. Lowering the percentage of maples in Syracuse to 10% of the overall street tree population would entail replacing 8,500 street trees with other street tree genera, whereas to accomplish the same goal in Hastings-on-Hudson would entail replacing only 300 street trees.
CONCLUSIONIncreasing street tree diversity is not a panacea for maintaining municipal street tree populations at their existing levels and thereby preserving the eco-system services and social benefits they provide. Many other factors have impacted or will impact street tree populations, including urban develop-ment, state and municipal budgets, and climate change. Even so, increasing street tree diversity by making the most common species a little less preva-lent is a big step in the right direction toward sustain-able street tree management. Based on the results presented here, indicating a current concentration

Cowett and Bassett: Street Tree Diversity in Three Northeastern U.S. States
©2017 International Society of Arboriculture
12
of New Jersey, New York, and Pennsylvania street trees among a relatively small number of species and genera, and in particular the dominance of maples (Acer spp.), which are vulnerable to the Asian long-horned beetle, there is a clear need in these states for greater species and genus diversity in state-wide and municipal street tree populations. While meaningful impediments exist to increasing diver-sity, especially in the short-term, it is a policy well worth pursuing at both state and municipal levels.
Acknowledgements. The authors thank the USDA Forest Service for its financial support.
LITERATURE CITEDBall, J. 2015. The 5 percent rule. American Nurseryman, Janu-
ary:8–11.Ball, J., S. Mason, A. Kiesz, D. McCormick, and C. Brown. 2007.
Assessing the hazard of emerald ash borer and other exotic stressors to community forests. Arboriculture & Urban Forestry 33:350–359.
Barbour, M.G., J.H. Buck, and W.D. Pitts. 1987. Terrestrial Plant Ecology, second edition. Benjamin/Cummings Publishing Company, Menlo Park, California, U.S.
Barker, P. 1975. Ordinance control of street trees. Journal of Arbor-iculture 1:212–215.
Bassuk, N., D.F. Curtis, B.Z. Marranca, and B. Neal. 2009. Recom-mended Urban Trees: Site Assessment and Tree Selection for Stress Tolerance. Urban Horticulture Institute, Cornell Univer-sity, Ithaca, New York, U.S.
Bassuk, N., P. Trowbridge, and C. Grohs. Undated. Visual similarity and biological diversity: Street tree selection and design. Accessed 10 December 2015. <www.hort.cornell.edu/uhi/ outreach/pdfs/visually_compatible_trees.pdf>
Bethlehem, J. 2010. Selection bias in web surveys. International Statistical Review 78:161–188.
Bezemer, T.M., and W.H. van der Putten. 2006. Diversity and stability in plant communities. Nature 446:E6–E7.
Buzas, M.A., and T.G. Gibson. 1969. Benthonic foraminifera in western North Atlantic. Science 163:72–75.
Cadotte, M.W., R. Dinnage, and D. Tilman. 2012. Phylogenetic diversity promotes ecosystem stability. Ecology 93:S223–S233.
Campanella, T. 2003. Republic of Shade: New England and the Amer-ican Elm. Yale University Press, New Haven, Connecticut, U.S.
Clark, J.R., N.P. Matheny, G. Cross, and V. Wake. 1997. A model of urban forestry sustainability. Journal of Arboriculture 23:17–30.
Colwell, R.K. 2009. Biodiversity: Concepts, patterns, and measure-ment. In :The Princeton Guide to Ecology. Princeton University Press, Princeton, New Jersey, U.S. pp. 257–263.
Conway, T.M., and J. Vander Vecht. 2015. Growing a diverse urban forest: Species selection decisions by practitioners planting and supplying trees. Landscape and Urban Planning 138:1–10.
Couch, S.M. 1992. The practice of avenue planting in the seven-teenth and eighteenth centuries. Garden History 20:173–200.
Cowett, F.D., and N.L. Bassuk. 2014. Statewide assessment of street trees in New York State, USA. Urban Forestry & Urban Green-ing 13:213–220.
Cumming, A.B., D.B. Twardus, R. Hoehn, D.J. Nowak, M. Mielke, R. Rideout, H. Butalla, and P. Lebow. 2008. Wisconsin Street Tree Assessment 2002–2003. USDA Forest Service, Northeast Area State and Private Forestry, NA-FR-02-08. Accessed 13 February 2015. <http://na.fs.fed.us/pubs/fhm/street_trees/wi_street_tree_assessment_hr.pdf>
Daly, C., M. Halbleib, J.I. Smith, W.P. Gibson, M.K. Doggett, G.H. Taylor, J. Curtis, and P.P. Pasteris. 2008. Physiographically sen-sitive mapping of climatological temperature and precipitation across the conterminous United States. International Journal of Climatology 28:2031–2064.
Dobbs, C., D. Kendal, and C. Nitschke. 2013. The effects of land ten-ure and land use on the urban forest structure and composition of Melbourne. Urban Forestry & Urban Greening 12:417–425.
Dwyer, J.F., D.J. Nowak, M.H. Noble, and S.M. Sisinni. 2000. Connecting people with ecosystems in the 21st century: An assessment of our nation’s urban forests. Gen. Tech. Rep. PNW-GTR-490. Portland, Oregon, U.S. U.S. Department of Agriculture, Forest Service, Pacific Northwest Research Sta-tion: 483 pp. Accessed 13 February 2015. <www.ncrs.fs.fed.us/pubs/2517>
Gerhold, H.D., and W. Porter. 2000. Selecting trees for community landscapes. pp.154–168. In: J.E. Kuser (Ed.). Handbook of Urban Forestry. Kluwer Academic, New York, New York, U.S. 434 pp.
Hammer, Ø., D.A.T. Harper, and P.D. Ryan. 2001. PAST: Paleon-tological Statistics Software Package for Education and Data Analysis. Palaeontologia Electronica 9 pp.
Iles, J.K., and A.M. Vold. 2003. Landscape tree cultivar preferences in Iowa, U.S. Journal of Arboriculture 29:331–336.
Jim, C.Y., and W.Y. Chen. 2009. Diversity and distribution of land-scape trees in the compact Asian city of Taipei. Applied Geog-raphy 29:577–587.
Kara, B. 2012. Assessment of the distribution and diversity of street tree species in Aydin, Turkey. Journal of Food, Agriculture & Environment 10:919–928.
KAT. 2015. Plant shortages: How the recession is still affecting the availability of landscape plants. KAT Wholesale Outdoor Blog, 02 October 2015. Accessed 14 December 2015. <http://blog.kat-wholesaleoutdoor.com/archive/2015/10>
Kendal, D., C. Dobbs, and V.I. Lohr. 2014. Global patterns of diversity in the urban forest: Is there evidence to support the 10/20/30 rule? Urban Forestry & Urban Greening 13:411–417.
Lesser, L.M. 1996. Street tree diversity and dbh in southern Califor-nia. Journal of Arboriculture 22:180–186.
Lohr, V.I. 2013. Diversity in landscape plantings: Broader un-derstanding and more teaching needed. HortTechnology 23:126–129.
Maco, S.E., and E.G. McPherson. 2003. A practical approach to assessing structure, function, and value of street tree popula-tions in small communities. Journal of Arboriculture 2:84–97.
Maco, S.E., E.G. McPherson, J.R. Simpson, and P.J. Peper. 2005. City of Berkeley, California Municipal Tree Resource Analy-sis. Center for Urban Forest Research, USDA Forest Service, Pacific Southwest Research Station. Accessed 25 February2015. <www.fs.fed.us/psw/programs/uesd/uep/products/cufr589_BerkeleyMBCA.pdf>
Arboriculture & Urban Forestry 43(1): January 2017
©2017 International Society of Arboriculture
13
Manes, F., G. Incerti, E. Salvatori, M. Vitale, C. Ricotta, and R. Costanza. 2012. Urban ecosystem services: Tree diversity and stability of tropospheric ozone removal. Ecological Applications 22:349–360.
McClellan, M. 2014. Northeast regional report: Growing in Pennsyl-vania. Nursery Management. March 2014. Accessed 11 April 2016. <www.nurserymag.com/article/nm0314-northeast-regional- report>
McPherson, E.G., and R.A. Rowntree. 1989. Using structural mea-sures to compare twenty-two U.S. street tree populations. Land-scape Journal 8:13–23.
Nock, C.A., A. Paquette, M. Follett, D.J. Nowak, and C. Messier. 2013. Effects of urbanization on tree species functional diversity in eastern North America. Ecosystems 16:1487–1497.
Pauleit, S., N. Jones, G. Garcia-Martin, J. Garcia-Valdecantos, L. Rivière, L. Vidal-Beaudet, M. Bodson, and T. Randrup. 2002. Tree establishment practice in towns and cities: Results from a European survey. Urban Forestry & Urban Greening 1:83–96.
Polakowski, N.R, V.I. Lohr, and T. Cerny-Koenig. 2011. Survey of wholesale production nurseries indicates need for more educa-tion on the importance of plant species diversity. Arboriculture & Urban Forestry 37:259–264.
Poland, T.M., and D.G. McCullough. 2006. Emerald ash borer: Invasion of the urban forest and the threat to North America’s ash resource. Journal of Forestry 104:118–124.
Raupp, M.J., A.B. Cumming, and E.C. Raupp. 2006. Street tree diversity in eastern North America and its potential for tree loss to exotic borers. Arboriculture & Urban Forestry 32:297–304.
Richards, N.A. 1993. Reasonable guidelines for street tree diversity. Journal of Arboriculture 19:344–350.
Ries, P.D. 2009. The search for species diversity. Digger September: 49–53. Accessed 10 December 2015. <www.oan.org/resource/resmgr/imported/digger/Digger_200909_pp49-53.pdf>
Rodda, K. 2014. Missing: Three-inch red maples for sale in the green industry. Nursery Management. January 2014. Accessed 11 April 2016. <www.nurserymag.com/article/nm0114-trees-market-shortage>
Sanders, R.A. 1981. Diversity in the street trees of Syracuse, New York. Urban Ecology 5:33–43.
Santamour, F.S., Jr. 1990. Trees for urban planting: Diversity, unifor-mity, and common sense. Proceedings 7th Conference Metro-politan Tree Improvement Alliance (METRIA) 7:57–65.
Shannon, C.E. 1948. A mathematical theory of communication. Bell System Technical Journal 27:379–423.
Sherald, J.L. 2009. Elms of the Monumental Core: History and man-agement plan. Natural Resource Report, National Park Service, Washington, D.C.
Simons, K., and G.R. Johnson. 2008. The Road to a Thoughtful Street Tree Master Plan: A Practical Guide to Systematic Planning and Design. Minnesota Department of Transportation. Accessed 09 April 2016. <www.myminnesotawoods.umn.edu/wp-content/uploads/2008/12/Street-Tree-Manual.REVISED_20082.pdf>
Simpson, E.H. 1949. Measurement of diversity. Nature 163:688.Sjöman, H., J. Östberg, and O. Bühle. 2012. Diversity and distri-
bution of the urban tree population in ten major Nordic cities. Urban Forestry & Urban Greening 11:31–39.
Smith, M.T, and J. Wu. 2008. Asian longhorned beetle: Renewed threat to northeastern USA and implications worldwide. Inter-national Pest Control 50:311–316.
Sreetheran, M., M. Adnan, and A.K. Khairil Azuar. 2011. Street tree inventory and tree risk assessment of selected major roads in Kuala Lumpur, Malaysia. Arboriculture & Urban Forestry 37:226–235.
Subburayalu, S., and T.D. Sydnor. 2012. Assessing street tree diver-sity in four Ohio communities using the weighted Simpson in-dex. Landscape and Urban Planning 106:44–50.
Sun, W.Q. 1992. Quantifying species diversity of streetside trees in our cities. Journal of Arboriculture 18:91–93.
Sydnor, T.D., S. Subburayalu, and M. Bumgardner. 2010. Contrast-ing Ohio nursery stock availability with community planting needs. Arboriculture & Urban Forestry 36:47–54.
Thompson, I.D., B. Mackey, S. McNulty, and A. Mosseler. 2009. Forest resilience, biodiversity, and climate change: A synthesis of the biodiversity/resilience/stability relationship in forest eco-systems. Secretariat of the Convention on Biological Diversity, Montreal. Technical Series No. 43. Accessed 13 February 2015. <www.cbd.int/doc/publications/cbd-ts-43-en.pdf>
Tilman, D., P.B. Reich, and J.M.H. Knops. 2006. Biodiversity and ecosystem stability in a decade-long grassland experiment. Nature 441:629–632.
U.S. Census Bureau. 2010. Geographic Terms and Concepts—Place. Accessed 25 December 2015. <www.census.gov/geo/reference/gtc/gtc_place.html>
U.S. Census Bureau. 2014. 2014 TIGER/Line Shapefiles. Accessed 20 March 2015. <www.census.gov/geo/maps-data/data/tiger-line.html>
U.S. Census Bureau. 2015. American Community Survey, 5-Year Estimates, 2009–2013. Accessed 19 March 2015. <www.census.gov/geo/maps-data/data/tiger-data.html>
U.S. Department of Agriculture, 2012. Plant Hardiness Zone Map. USDA Agricultural Research Service.
U.S. National Arboretum. 1990. USDA Plant Hardiness Zone Map. USDA Miscellaneous Publication No. 1475. January 1990.
Zawislak, M. 2015. Emerald ash borer helps nursery industry make a comeback. Daily Herald. Accessed 11 November 2016. <www.dailyherald.com/article/20151019/business/151018770>
F.D. Cowett (corresponding author)Post-doctoral Associate Department of Horticulture Cornell University134 Plant Sciences Bldg. Ithaca, New York 14853, [email protected]
Nina BassukCornell University Horticulture Section, School of Integrative Plant ScienceIthaca, New York 14853, U.S.

Cowett and Bassett: Street Tree Diversity in Three Northeastern U.S. States
©2017 International Society of Arboriculture
14
Résumé. La diversité des arbres de rues est tenue comme étant un élément clé dans la résistance des populations d’arbres d'ali-gnement face aux ravageurs, aux maladies et aux changements climatiques. L'analyse de la diversité des arbres de rues est consi-dérée comme une constituante de la gestion durable des arbres d'alignement et de la préservation des services écosystémiques et des avantages sociaux que procurent ces arbres. Cet article ana-lyse la diversité des arbres d'alignement de trois États du nord-est des États-Unis, soit le New Jersey, New York et la Pennsylvanie, en examinant les données d'inventaire municipal d’arbres de rues en superposition avec la carte des zones de rusticité des végétaux 2012 du Département de l’agriculture des États-Unis (USDA). Malgré la leçon tirée de la dévastation historique des ormes d’Amérique (Ulmus americana), plantés en très grand nombre, par la maladie hollandaise de l'orme, la prise de conscience toute contemporaine de la menace posée aux frênes par l’agrile du frêne (Agrilus planipen-nis), ainsi que les risques que présentent aux érables (Acer spp.) et à certaines autres essences d'arbres, le longicorne asiatique (Ano-plophora glabripennis), les résultats de ces données démontrent une actuelle concentration d'un nombre relativement petit d'espèces et de genres parmi les arbres de rue, en particulier la dominance des érables chez les arbres d'alignement. Les résultats établissent égale-ment une indéniable relation entre la diversité des arbres de rues et les températures minimales moyennes plus chaudes durant l'hiver. Par conséquent, il y a une nécessité évidente pour ces trois États d'accroître la diversité des espèces et des genres dans les populations municipales d'arbres de rue ainsi qu'à l'échelle de l'état. Cependant, il existe des obstacles significatifs à l'accroissement de la diversité des arbres d'alignement, particulièrement à court terme.
Zusammenfassung. Die Artenvielfalt von Straßenbäumen wird weitgehend als Schlüsselkomponente für die Widerstandkraft von Straßenbaumpopulationen gegenüber Schädlingen, Krankheiten und klimatischen Veränderungen betrachtet. Die Untersuchung der Artenvielfalt bei Straßenbäumen wird als integrativ in einem nachhaltigen Straßenbaummanagement und zur Erhaltung der Ökosystemleistungen und auch der sozialen Vorteile, die Straßen-bäume liefern, eingeschätzt. Diese Studie untersucht die Artenviel-falt bei Straßenbäumen in drei nordöstlichen Staaten der USA—New Jersey, New York, and Pennsylvania— durch eine Analyse der kommunalen Baumkatasterdaten, die stratifiziert sind durch die 2012 USDA Plant Hardiness Zones. Ungeachtet der Erfahrungen aus dem historischen Schwund der überpflanzten Amerikanischen Ulmen durch die Holländische Ulmenkrankheit und dem Bewusst-sein gegenüber zeitgenössischer Bedrohungen von Eschen durch den Eschenbohrer (EAB) und von Ahornen und anderen Baumar-ten durch den Asiatischen Laubbock zeigen die hier präsentierten Ergebnisse auf eine gegenwärtige Konzentration von Straßenbäu-men innerhalb einer relativ kleinen Anzahl von Arten und Gattun-gen und besonders eine Dominanz von Ahornen bei Straßenbäu-men. Die Ergebnisse zeigen auch eine positive Beziehung zwischen Straßenbaumvielfalt und wärmeren Durchschnittstemperaturen im Winter. Schlussendlich gibt es einen klaren Bedarf in allen drei Staaten nach größerer Arten- und Gattungsvielfalt in bundesweiten und kommunalen Straßenbaumpopulationen. Dennoch existieren bedeutsame Hemmschwellen, die Vielfalt von Straßenbäumen, ins-besondere kurzfristig, zu erhöhen.