Embed Size (px)
Citation preview

Treasury solutions Treasury Management – Challenges for 2014
Society of District Council Treasurers10th January 2014
Presented byCecilie Booth, Director

January 2014 2
2014 Challenges:
• Market Update
• Capita Asset Services’ forecast
• The Balance Sheet / Balance Sheet Review
• Investment Opportunities
• Debt Management
• Potential areas for budget savings

3
Economic Summary – UK
• The UK economy continued to show positive growth in Q3 2013 at 0.8%
• BoE’s November Inflation Report indicate CPI will drop below 2% by Q1 2015
• Debt as a percentage of GDP (currently 76.6%) to start falling from 2015/16
• Loss of the UK’s ‘AAA’ credit rating emphasised the performance in the economy.
• UK economy is still in danger of weak growth in the next two years.
• Consumers are likely to remain focused on paying down debt
• Coalition government - promoting growth vs. the need to tackle the budget deficit
• Little sign of private sector funding to finance major expansion of infrastructure
January 2014

January 2014 4
GDP
-3
-2.5
-2
-1.5
-1
-0.5
0
0.5
1
1.5
2
(%)
GDP q/q
UK q/q US q/q EZ q/q

January 2014 5
U.K. Interest Rate ForecastsBank Rate
NOW Mar-14 Jun-14 Sep-14 Dec-14 Mar-15 Jun-15 Sep-15 Dec-15 Mar-16 Jun-16 Sep-16 Dec-16 Mar-17
Capita Asset Services 0.50% 0.50% 0.50% 0.50% 0.50% 0.50% 0.50% 0.50% 0.50% 0.50% 0.75% 1.00% 1.00% 1.25%
UBS 0.50% 0.50% 0.50% 0.50% 0.50% 0.50% 0.50% 0.75% 1.00% - - - - -
Capital Economics 0.50% 0.50% 0.50% 0.50% 0.50% 0.50% 0.50% 0.50% 0.50% - - - - -
5yr PWLB Rate
NOW Mar-14 Jun-14 Sep-14 Dec-14 Mar-15 Jun-15 Sep-15 Dec-15 Mar-16 Jun-16 Sep-16 Dec-16 Mar-17
Capita Asset Services 2.72% 2.50% 2.60% 2.70% 2.70% 2.80% 2.80% 2.90% 3.00% 3.10% 3.20% 3.30% 3.40% 3.40%
UBS 2.72% - - - - - - - - - - - - -
Capital Economics 2.72% 2.30% 2.30% 2.30% 2.30% 2.30% 2.50% 2.90% 3.30% - - - - -
10yr PWLB Rate
NOW Mar-14 Jun-14 Sep-14 Dec-14 Mar-15 Jun-15 Sep-15 Dec-15 Mar-16 Jun-16 Sep-16 Dec-16 Mar-17
Capita Asset Services 3.85% 3.60% 3.70% 3.80% 3.80% 3.90% 3.90% 4.00% 4.10% 4.20% 4.30% 4.30% 4.40% 4.50%
UBS 3.85% 3.70% 3.80% 3.90% 4.10% 4.10% 4.30% 4.60% 4.60% - - - - -
Capital Economics 3.85% 3.55% 3.55% 3.55% 3.55% 3.55% 3.55% 3.55% 3.80% - - - - -
25yr PWLB Rate
NOW Mar-14 Jun-14 Sep-14 Dec-14 Mar-15 Jun-15 Sep-15 Dec-15 Mar-16 Jun-16 Sep-16 Dec-16 Mar-17
Capita Asset Services 4.41% 4.40% 4.50% 4.50% 4.60% 4.60% 4.70% 4.80% 4.90% 5.00% 5.10% 5.10% 5.10% 5.10%
UBS 4.41% 4.60% 4.60% 4.80% 4.80% 5.10% 5.10% 5.30% 5.30% - - - - -
Capital Economics 4.41% 4.25% 4.25% 4.25% 4.25% 4.25% 4.25% 4.25% 4.35% - - - - -
50yr PWLB Rate
NOW Mar-14 Jun-14 Sep-14 Dec-14 Mar-15 Jun-15 Sep-15 Dec-15 Mar-16 Jun-16 Sep-16 Dec-16 Mar-17
Capita Asset Services 4.35% 4.40% 4.50% 4.50% 4.60% 4.70% 4.80% 4.90% 5.00% 5.10% 5.20% 5.20% 5.20% 5.20%
UBS 4.35% 4.50% 4.50% 4.70% 4.70% 4.90% 4.90% 5.10% 5.10% - - - - -
Capital Economics 4.35% 4.40% 4.40% 4.40% 4.40% 4.40% 4.40% 4.40% 4.50% - - - - -
Please note – The current PWLB rates and forecast shown above have taken into account the 20 basis point certainty Rate reduction effective as of the 1st November 2012

January 2014 6
The Balance Sheet
The Balance Sheet provides information as of the end of the yearIt includes:-
• balances, reserves and cash investments• Sets out capital (indebtedness) and treasury position (borrowings)• working capital (debtors and creditors)
The Balance Sheet is also a powerful tool for forward planningIt identifies:-
• under-borrowed positions• lower or higher cash / investment balances• potential for falling CFR’s • Reserve / Balance positions in the years ahead.

7January 2014
Investments - Asset Yield Curves
0.00%
0.50%
1.00%
1.50%
2.00%
2.50%
3.00%
O/N 15 Day 1 Month 3 Month 6 Month 9 Month 1 Year 2 Years 3 Years 4 Years 5 Years
Yiel
d
Fixed Deposit Building Socs. DMADF T-Bill Gilt CD - Banks
CD - Building Socs. MMF EIB Bonds Call Account (Instant) Call Account (15 day) Call Account (30 Days)
• Given their same credit risk, T-Bills should be chosen over DMADF in the 6 month period.• Bank deposits give the best yield in all periods.• Overnight (call) bank deposits provide plenty of credit premium over DMADF overnight. • Call accounts, notice accounts and MMFs are offering competitive rates.• All rates are obtainable in the market by counterparties suggested by Capita Asset Services.

January 2014 8
Debt Management
• We expect short term rates to remain low in the near term
• Inter-authority borrowing is available in the region of 0.3% - 0.4%
• Long-term rates (25-50 years) are expected to stay at around 4.5% for a
year or so, but the Euro-zone & US developments mean some volatility
• These are only forecasts – not fact! Always keep an eye on managing the
refinancing risk and internal borrowing position
• Some market based options continue to provide an attractive option to
manage risk out of future dates

January 2014 9
Funding options
Borrow internally (partially) and draw down on cash balances:
• suits a low risk appetite authority with significant cash resources in the short to medium term
• typical cost of this activity is 0.5% - 1%
Temporary borrowing up to 2 years, typically at:
• 1 year 0.3% - 0.5%• 18 months 0.8%• makes sense for internally borrowed and budget pressured authorities

January 2014 10
Other funding options
Fund forward
• tie back to your TMSS PIs and appetite for certainty
LA Bond (LGA initiative)
• an alternative to PWLB funding - just in case margins are increased
January 2014 11
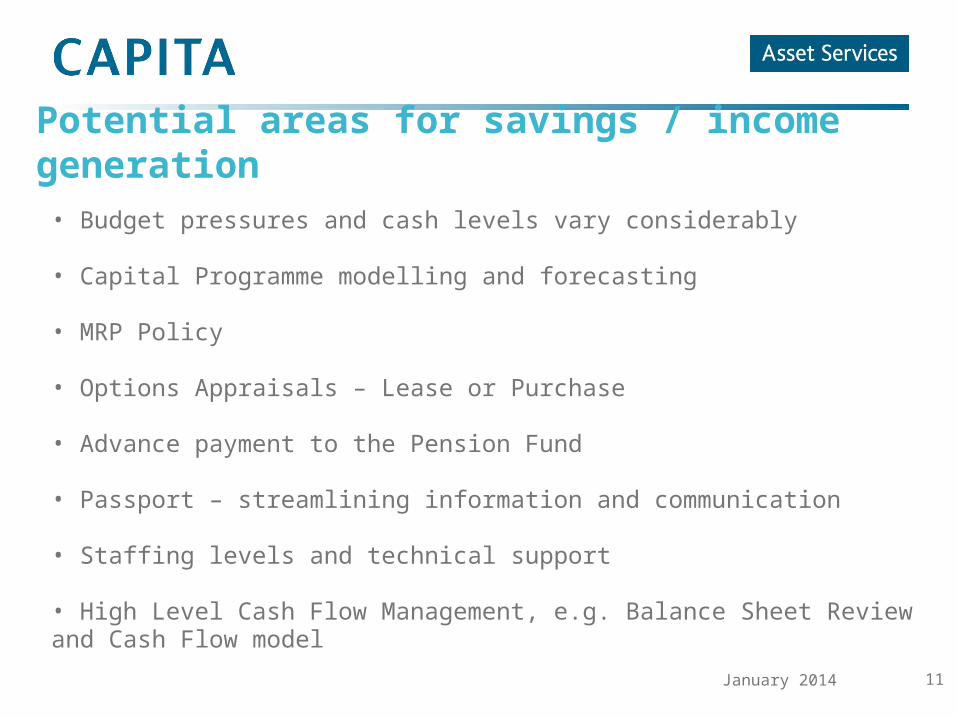
Potential areas for savings / income generation
• Budget pressures and cash levels vary considerably
• Capital Programme modelling and forecasting
• MRP Policy
• Options Appraisals – Lease or Purchase
• Advance payment to the Pension Fund
• Passport – streamlining information and communication
• Staffing levels and technical support
• High Level Cash Flow Management, e.g. Balance Sheet Review and Cash Flow model

January 2014 12
Potential areas for savings / income generation
• Alternative investment options – e.g. Property Funds
• Enhanced rates and access to good quality counterparties available from our Agency Treasury Services
• Filling resource / skills gaps
• Benchmarking Security / Liquidity / Yield – improved performance and reduced risk
• Salary Sacrifice Car Scheme
• Help negotiate lease expiry terms – substantial savings identified
• Asset management on outsourced services

January 2014 13
Potential areas for savings / income generation
• Housing related schemes, e.g. LAMS, Self Build, Regeneration Grants / Loans – different ways to raise funding • Loans to RPs / Housing Associations
• Client Focus Group