Embed Size (px)
Citation preview
Travel Demand ModelingTravel Demand Modeling
Don Don MayleMayleJennifer OsborneJennifer OsborneKaren Karen FaussettFaussett
Michigan Department of TransportationMichigan Department of TransportationStatewide and Urban Travel Analysis SectionStatewide and Urban Travel Analysis Section
December 3, 2008December 3, 2008

Presentation GoalPresentation Goal
Improve the utilization of travel demand Improve the utilization of travel demand models for Project level analysismodels for Project level analysisDescribe how travel demand models work Describe how travel demand models work Interpreting model outputs Interpreting model outputs Different types of analysis available Different types of analysis available
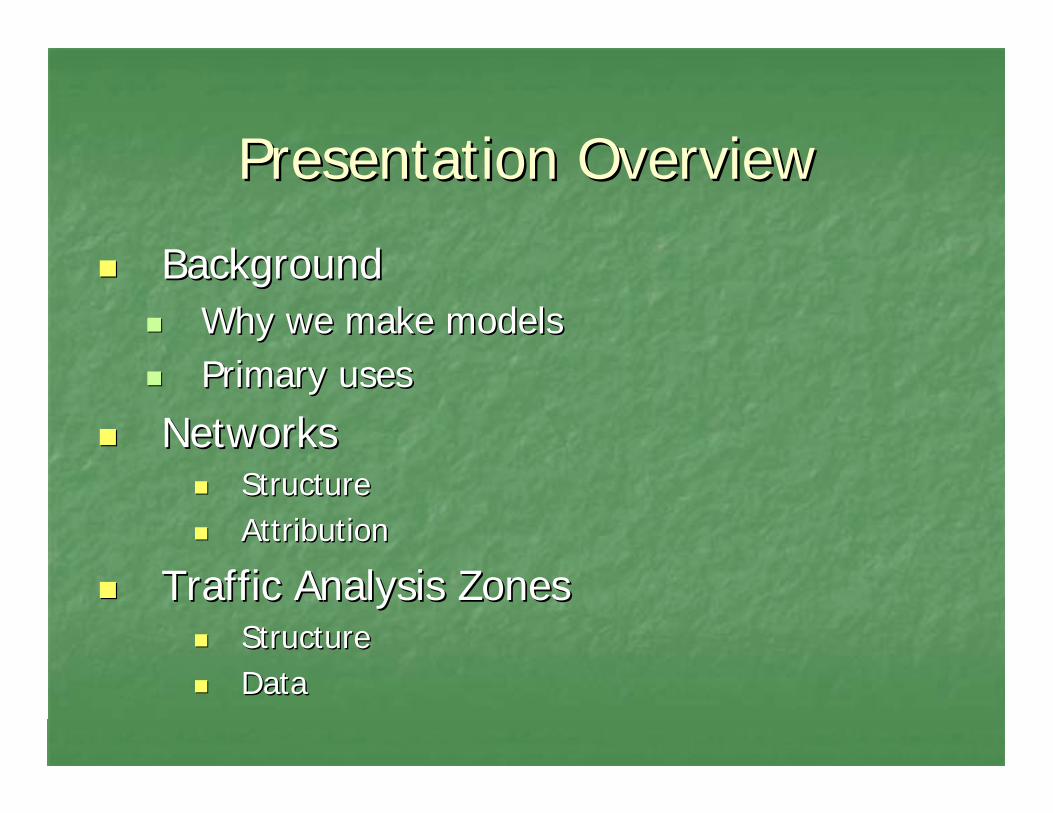
Presentation OverviewPresentation Overview
BackgroundBackgroundWhy we make modelsWhy we make modelsPrimary usesPrimary uses
NetworksNetworksStructure Structure AttributionAttribution
Traffic Analysis ZonesTraffic Analysis ZonesStructure Structure DataData

Presentation OverviewPresentation Overview
Trip generationTrip generationNumber of person trips by Traffic Analysis Number of person trips by Traffic Analysis Zone (TAZ)Zone (TAZ)
Trip distributionTrip distributionTAZ to TAZ TAZ to TAZ
Mode SplitMode SplitConvert person trips to different modes of Convert person trips to different modes of traveltravel
AssignmentAssignmentAssign the route for the vehicle tripsAssign the route for the vehicle trips

Presentation OverviewPresentation OverviewCalibration and Validation Calibration and Validation
Standards for performanceStandards for performance
Different capabilities of different urban Different capabilities of different urban modelsmodels
All model utilize different techniques All model utilize different techniques depending on the model areadepending on the model area
Statewide model Statewide model General model assumptionsGeneral model assumptions
The basis for equations The basis for equations

Presentation OverviewPresentation Overview
Model applications Model applications Uses of the model Uses of the model
Discussion on using travel demand models Discussion on using travel demand models for project level analysisfor project level analysis
Information request processInformation request processLevels and types of analysis Levels and types of analysis Working together to enhance the final productWorking together to enhance the final product

Why Urban Models are Why Urban Models are DevelopedDeveloped
Metropolitan Planning Organizations (MPOs) are Metropolitan Planning Organizations (MPOs) are required to have an objective method to required to have an objective method to evaluate the federal aid road system as part of evaluate the federal aid road system as part of their Long Range Plan (LRP)their Long Range Plan (LRP)MDOT holds the models for Small MDOT holds the models for Small MPOsMPOs
50,000 50,000 –– 200,000200,000
Transportation Management Areas (Transportation Management Areas (TMAsTMAs) are ) are required to have a model and staff that are required to have a model and staff that are knowledgeable in modelingknowledgeable in modeling
Over 200,000Over 200,000

MPO Model BoundariesMPO Model Boundaries

Primary Uses of ModelPrimary Uses of Model
Forecasts Forecasts How changes in SocioHow changes in Socio--Economic data (SEEconomic data (SE--data) affect traffic flows data) affect traffic flows Predict future traffic congestionPredict future traffic congestionTest solutionsTest solutions
System wide analysis System wide analysis How changes in the network affect traffic How changes in the network affect traffic flowsflows

Primary Uses of ModelPrimary Uses of ModelDevelopment of Development of MPOsMPOs LRP Project list LRP Project list Test alternative methods for alleviating Test alternative methods for alleviating congestioncongestion
Not just widening roadsNot just widening roadsParallel corridorParallel corridorConnectivity improvements Connectivity improvements
Congestion management Congestion management Use a volume over capacity (V/C) ratio to Use a volume over capacity (V/C) ratio to identify deficiencies or congestionidentify deficiencies or congestionHierarchy of congestion Hierarchy of congestion

Air QualityAir Quality
Travel demand model outputs provide the Travel demand model outputs provide the inputs for air quality modelsinputs for air quality models
Vehicle Miles Traveled (VMT) Vehicle Miles Traveled (VMT) Vehicle Hours Traveled (VHT) Vehicle Hours Traveled (VHT) congested speedcongested speed

What is ModeledWhat is Modeled
Collectors and aboveCollectors and aboveAll capacity projects need to be in the LRP All capacity projects need to be in the LRP and the Transportation Improvement and the Transportation Improvement Program (TIP)Program (TIP)
LRP has at least a 20 year horizonLRP has at least a 20 year horizonTIP has a four year horizonTIP has a four year horizon
All future capacity projects identified in All future capacity projects identified in the LRP need to be modeled in forecaststhe LRP need to be modeled in forecasts

What is ModeledWhat is Modeled
A build network represents all of the A build network represents all of the capacity projects to be completed by the capacity projects to be completed by the year of the networkyear of the networkA noA no--build network represents the existing build network represents the existing road system road system A TIP or Existing plus Committed (E + C) A TIP or Existing plus Committed (E + C) network represents current conditions and network represents current conditions and the capacity projects in the TIPthe capacity projects in the TIP

Model UpdatesModel Updates
The model inputs are developed, reviewed The model inputs are developed, reviewed and approved by the MPO committee as and approved by the MPO committee as part of their LRP processpart of their LRP processUrban models are updated for each LRP Urban models are updated for each LRP
Air quality nonAir quality non--attainment or maintenance attainment or maintenance areas every 4 years areas every 4 years Air quality attainment areas every 5 years Air quality attainment areas every 5 years

Model UpdatesModel Updates
Updates can range from developing new Updates can range from developing new SESE--data to a complete rebuilddata to a complete rebuildInterim updatesInterim updatesTip amendments involving capacity Tip amendments involving capacity projects require new air quality conformity projects require new air quality conformity analysisanalysis

What is a Travel Demand ModelWhat is a Travel Demand Model
A travel demand model is a series of A travel demand model is a series of mathematical equations which are used to mathematical equations which are used to estimate traffic conditionsestimate traffic conditions

NetworksNetworks

Network StructureNetwork StructureBase Year Road NetworkBase Year Road Network
Michigan Geographic FrameworkMichigan Geographic FrameworkFederal Aid Roads (Collector and above)Federal Aid Roads (Collector and above)Add Local roads as neededAdd Local roads as needed
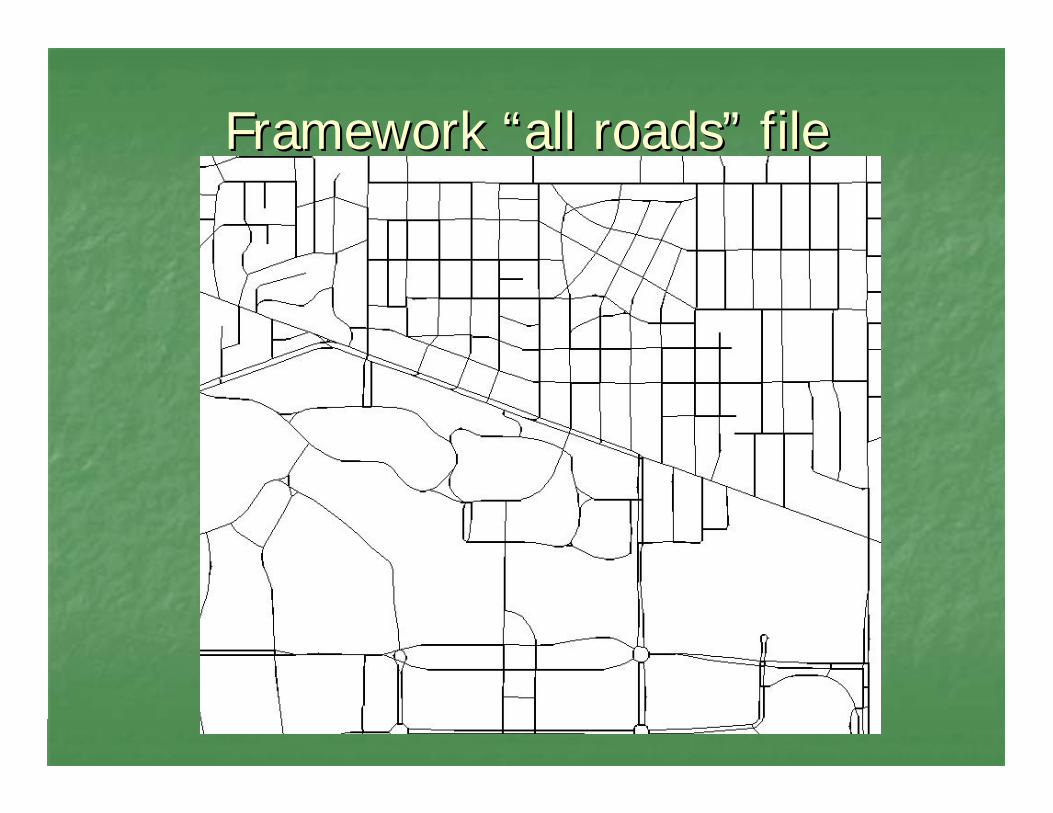
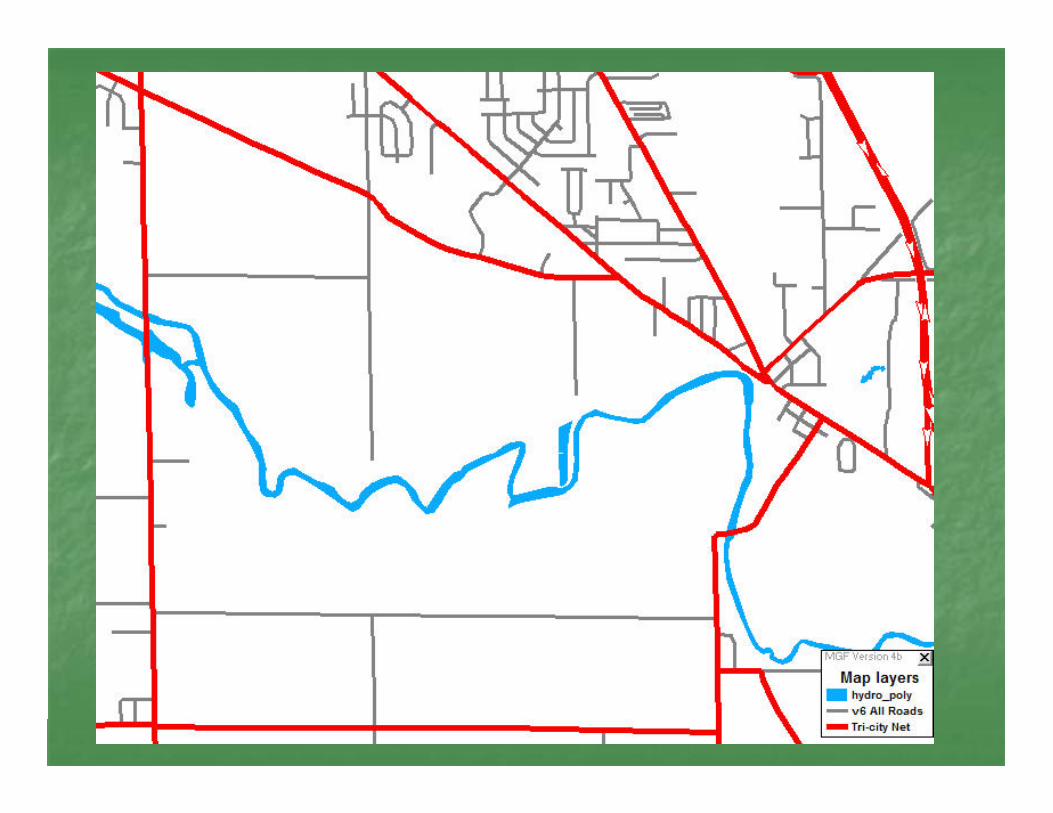
Framework “all roads” fileFramework “all roads” file

Framework with model networkFramework with model network

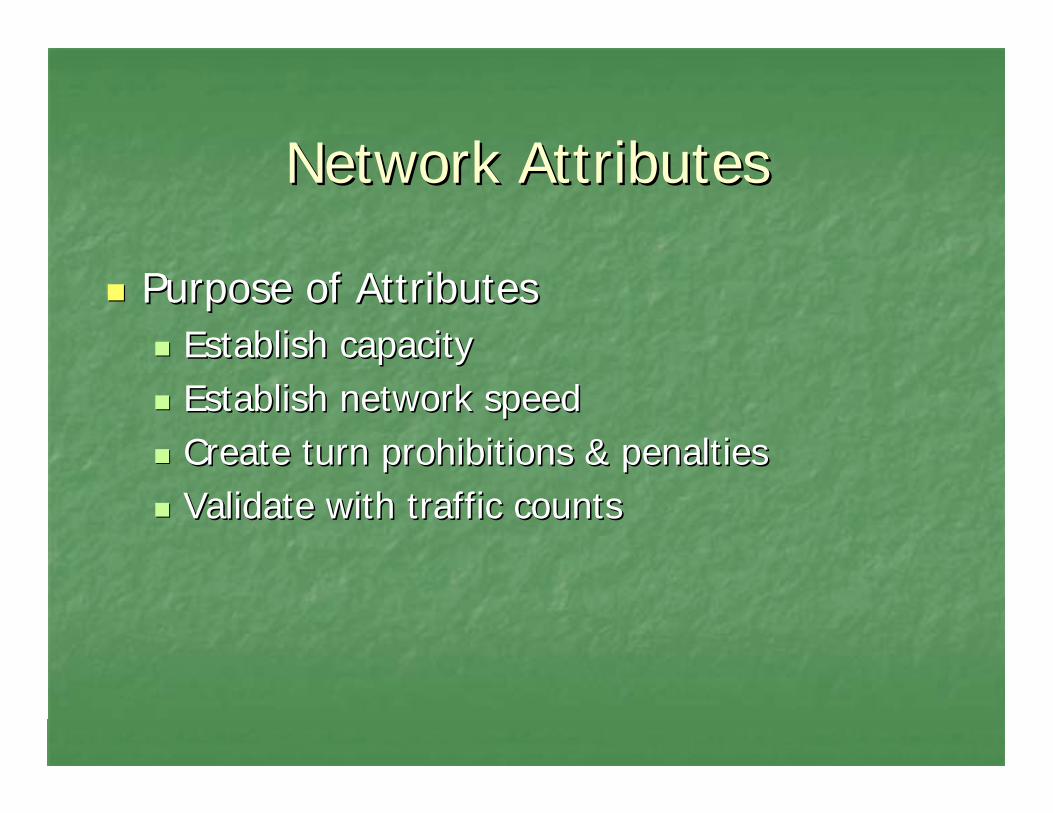
Network AttributesNetwork Attributes
Number of Thru LanesNumber of Thru LanesPosted SpeedPosted SpeedLane WidthLane WidthParking AllowedParking AllowedCenter Turn Lane PresentCenter Turn Lane PresentArea Type Area Type -- Urban, Rural, etc.Urban, Rural, etc.Percent Commercial TrafficPercent Commercial TrafficTraffic CountsTraffic Counts
Network AttributesNetwork Attributes
Purpose of AttributesPurpose of AttributesEstablish capacityEstablish capacityEstablish network speedEstablish network speedCreate turn prohibitions & penaltiesCreate turn prohibitions & penaltiesValidate with traffic countsValidate with traffic counts

CapacityCapacityMain uses:Main uses:
Equilibrium AssignmentEquilibrium AssignmentVolume to Capacity Ratio (VC Ratio)Volume to Capacity Ratio (VC Ratio)
Base Capacities are Level of Service (LOS) Base Capacities are Level of Service (LOS) D or E not Design CapacityD or E not Design Capacity
Daily CapacityDaily Capacity
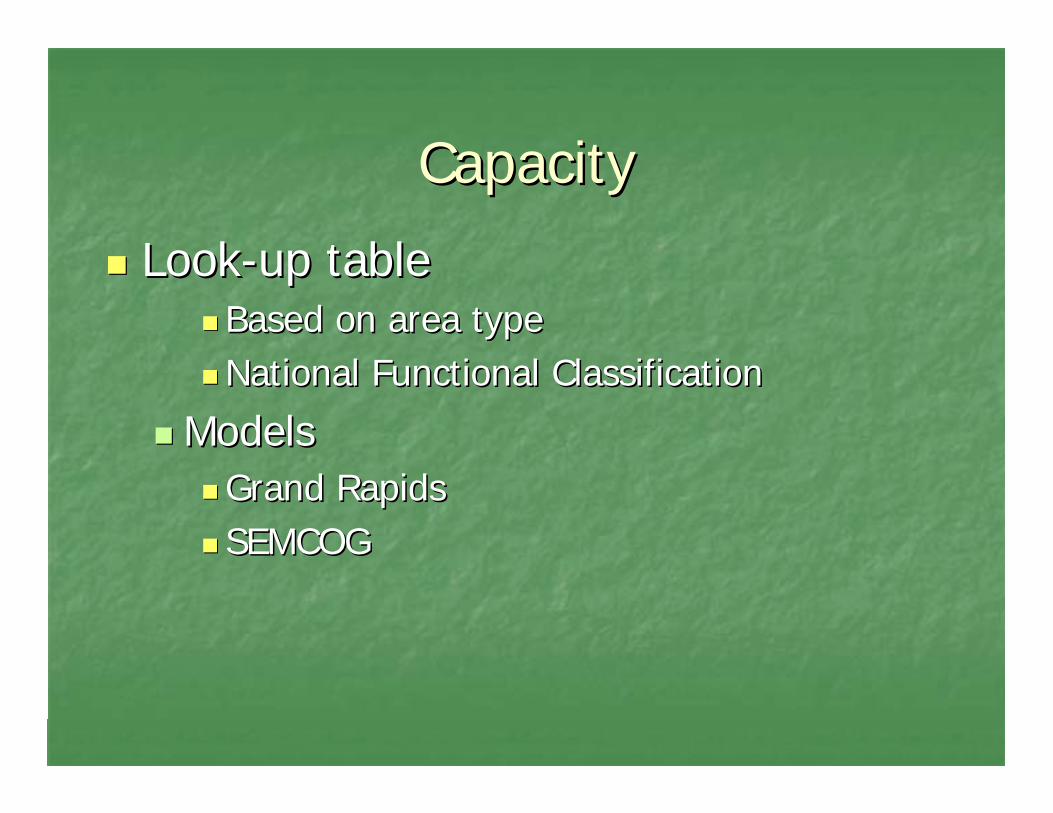
CapacityCapacity
LookLook--up table up table Based on area typeBased on area typeNational Functional ClassificationNational Functional Classification
ModelsModelsGrand RapidsGrand RapidsSEMCOGSEMCOG

Capacity LookCapacity Look--up Tableup Table
7700770044Divided Divided ArterialArterial
CBDCBD
7500750022Divided Divided ArterialArterial
CBDCBD
187001870044FreewayFreewayResidentialResidential
179001790022FreewayFreewayCBDCBD
Capacity Per Capacity Per LaneLane
Number of Number of LanesLanes
Facility TypeFacility TypeArea TypeArea Type

CapacityCapacity
All other Models use:All other Models use:Capacity CalculatorCapacity Calculator
Developed by Lansing TMADeveloped by Lansing TMAUses 2000 and 1997 Highway Capacity Uses 2000 and 1997 Highway Capacity ManualManualUpdated in 2006 to 2000 HCMUpdated in 2006 to 2000 HCM
Some Model Capacities adjusted by Some Model Capacities adjusted by localslocals

CapacityCapacity
Attributes used in Calculating CapacityAttributes used in Calculating CapacityArea typeArea typeLink typeLink typeTraffic Operation CodeTraffic Operation CodeNumber of thru lanesNumber of thru lanesLane widthLane width-- Travel LaneTravel LaneOne or Two Way TrafficOne or Two Way TrafficPercentage CommercialPercentage CommercialTrunklineTrunklineParking AllowedParking Allowed

CapacityCapacity
Uses default green time based on Area Uses default green time based on Area Type and Facility TypeType and Facility Type
Adjustments to base capacity based on Adjustments to base capacity based on each attributeeach attribute
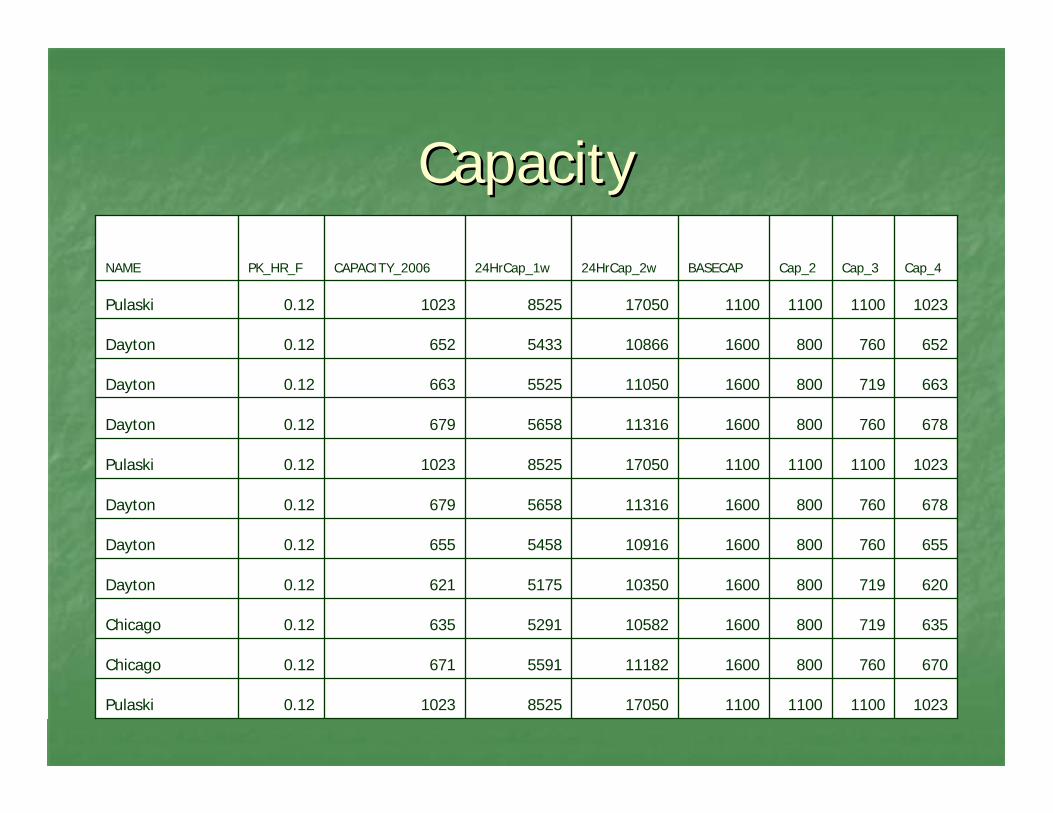
CapacityCapacity
102311001100110017050852510230.12Pulaski
67076080016001118255916710.12Chicago
63571980016001058252916350.12Chicago
62071980016001035051756210.12Dayton
65576080016001091654586550.12Dayton
67876080016001131656586790.12Dayton
102311001100110017050852510230.12Pulaski
67876080016001131656586790.12Dayton
66371980016001105055256630.12Dayton
65276080016001086654336520.12Dayton
102311001100110017050852510230.12Pulaski
Cap_4Cap_3Cap_2BASECAP24HrCap_2w24HrCap_1wCAPACITY_2006PK_HR_FNAME

SpeedSpeedUsed as a measure of time (how fast you Used as a measure of time (how fast you can travel)can travel)Important for Network PathsImportant for Network PathsReflects roadway conditions without the Reflects roadway conditions without the effect of congestioneffect of congestion

SpeedSpeed
Determining SpeedsDetermining SpeedsPosted speed limitPosted speed limit
Limit set by a jurisdictionLimit set by a jurisdiction
LookLook--up tablesup tablesBased on area type, facility type, number of lanes, Based on area type, facility type, number of lanes, posted speedposted speed
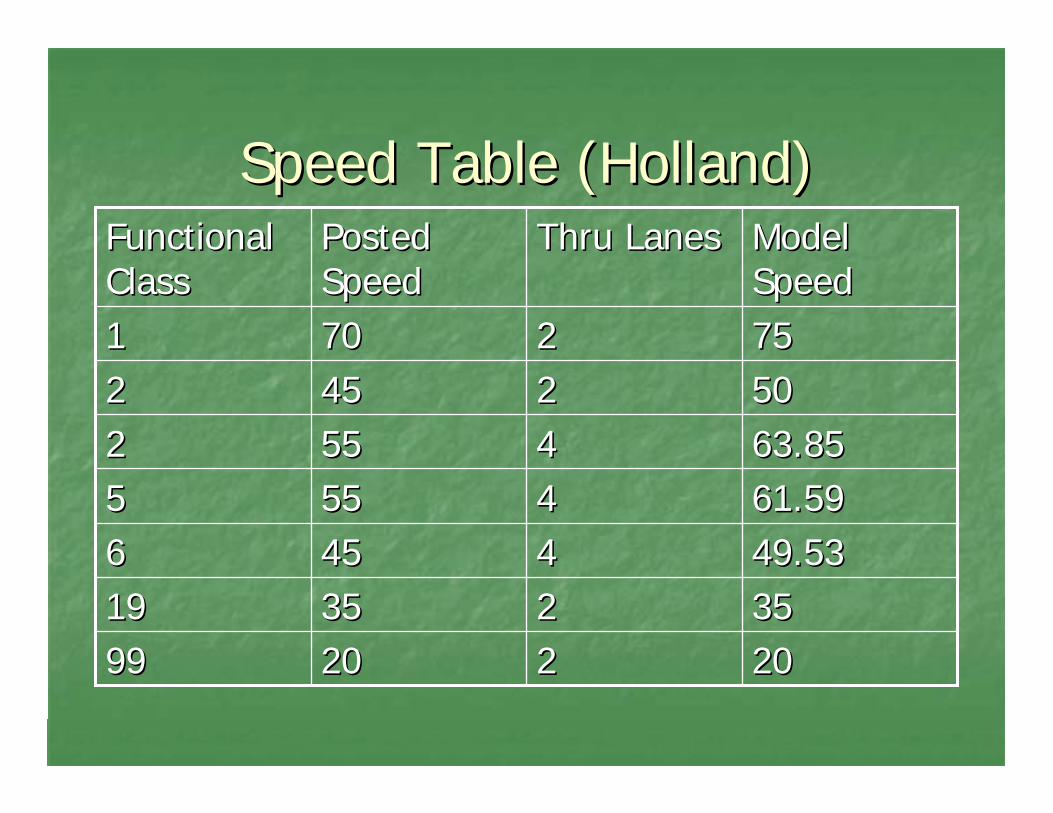
Speed Table (Holland)Speed Table (Holland)
202022202099993535223535191949.5349.534445456661.5961.594455555563.8563.8544555522505022454522757522707011
Model Model SpeedSpeed
Thru LanesThru LanesPosted Posted SpeedSpeed
Functional Functional ClassClass

Speed Table (Relative)Speed Table (Relative)
1 MPH added based on number of lanes, including center turn lane1 MPH added based on number of lanes, including center turn laneform default of 2.form default of 2.
42423535303025252020AllAll66CollColl--ectorector
494945453737303025253344Major Major ArtArt
535349494141343429292233Trunk Trunk lineline
656565656060555550501111FreeFree--wayway
RuralRuralFringeFringeSubSubUrbanUrbanCBDCBDRoadRoadLinkLinkFacilityFacility

Turning MovementsTurning Movements
No Intersection right and left turn lanesNo Intersection right and left turn lanesNo Traffic lightsNo Traffic lightsTurns ProhibitedTurns Prohibited
Added to rampsAdded to rampsIntersectionsIntersections
Turn Penalties (sometimes used)Turn Penalties (sometimes used)GlobalGlobalSpecificSpecific

Turning MovementsTurning Movements

Traffic Analysis Zones (TAZ)Traffic Analysis Zones (TAZ)

What Are Traffic Analysis Zones What Are Traffic Analysis Zones (TAZs)(TAZs)
Small geographic subdivisions of the study Small geographic subdivisions of the study areaareaBuilt from adjacent census blocks that Built from adjacent census blocks that have similar land use have similar land use
Allows the aggregation of census block data Allows the aggregation of census block data for households and populationfor households and population

Merged Census BlocksMerged Census Blocks

CentroidsCentroids
A point or node in the network A point or node in the network Corresponding to a TAZCorresponding to a TAZTrips loaded from Trips loaded from centroidscentroidsTrips travel from Trips travel from centroidscentroids to to centroidcentroidGenerally placed at center of TAZ activityGenerally placed at center of TAZ activity

Merged Census BlocksMerged Census Blocks

CentroidCentroid ConnectorsConnectors
Connectors represent the local roads not Connectors represent the local roads not in the network and all driveway cuts along in the network and all driveway cuts along a road segmenta road segment
Loading points Loading points Statewide model utilizes single point loadingStatewide model utilizes single point loading


Developing Developing TAZsTAZs
TAZsTAZs are developed before the are developed before the centroidcentroidconnectorsconnectors
designed so that the connectors can be designed so that the connectors can be properly createdproperly created
Building ConnectorsBuilding ConnectorsNo intersectionsNo intersectionsNo connections where physical barrierNo connections where physical barrierConnect where road isConnect where road is

Developing Developing TAZsTAZs
Constrained by the networkConstrained by the networkThis facilitates the loading of trips to the This facilitates the loading of trips to the network network


Developing TAZsDeveloping TAZs
Constrained by natural featuresConstrained by natural featuresThis helps prevent impossible loadingsThis helps prevent impossible loadings


Developing Developing TAZsTAZs
Constrained by political boundariesConstrained by political boundariesThis aids in developing the socioThis aids in developing the socio--economic economic data data TAZ data for a jurisdiction can be added up TAZ data for a jurisdiction can be added up and compared to control totals and compared to control totals


SocioSocio--Economic Data (SEEconomic Data (SE--Data)Data)Households and PopulationHouseholds and Population
Households and populationHouseholds and populationStart with census block dataStart with census block dataAdjust to base year Adjust to base year Forecast to future yearsForecast to future years
Demographics specialist Garth Demographics specialist Garth BanningaBanninga creates creates growth rates or control totals utilizing REMI, growth rates or control totals utilizing REMI, Woods and Poole and other sources that most Woods and Poole and other sources that most small small MPOsMPOs utilizeutilizeSpecific information on the area is requested from Specific information on the area is requested from local agencies and incorporated local agencies and incorporated

SocioSocio--Economic Data (SEEconomic Data (SE--Data)Data)Employment DataEmployment Data
Employment data usually comes from Employment data usually comes from ClaritasClaritas and MESA and MESA
The data is cleaned in house and then The data is cleaned in house and then reviewed by local road agencies and officialsreviewed by local road agencies and officials
It is in the form of a point fileIt is in the form of a point fileEach record is tagged with a TAZ numberEach record is tagged with a TAZ number


SocioSocio--Economic Data (SEEconomic Data (SE--Data)Data)Employment DataEmployment Data
The number of employees for each The number of employees for each business are aggregated by the type of business are aggregated by the type of employment (retail, nonemployment (retail, non--retail, service and retail, service and other) to TAZ totalsother) to TAZ totals

Average Autos AvailableAverage Autos Available
Start with Block Group dataStart with Block Group dataAverage number of autos available per Average number of autos available per household methodhousehold methodCategories autos methodCategories autos method
Number of 0, 1, 2, 3+ car householdsNumber of 0, 1, 2, 3+ car households
IncomeIncome
Start with census block dataStart with census block dataCan use average or categories Can use average or categories

TAZ Level SETAZ Level SE--DataData
Aggregated dataAggregated dataPopulationPopulationNumber of occupied householdsNumber of occupied householdsPersons per householdPersons per household
Average or categorized Average or categorized
Number of employees by business typeNumber of employees by business typeNumber of autos per householdNumber of autos per household
Average or categorizedAverage or categorized
Some models use household incomeSome models use household incomeAverage or categorizedAverage or categorized

SocioSocio--Economic Data (SEEconomic Data (SE--Data)Data)
The base and future years SEThe base and future years SE--Data is Data is reviewed and approved through the MPO reviewed and approved through the MPO committee structurecommittee structure

Trip GenerationTrip Generation
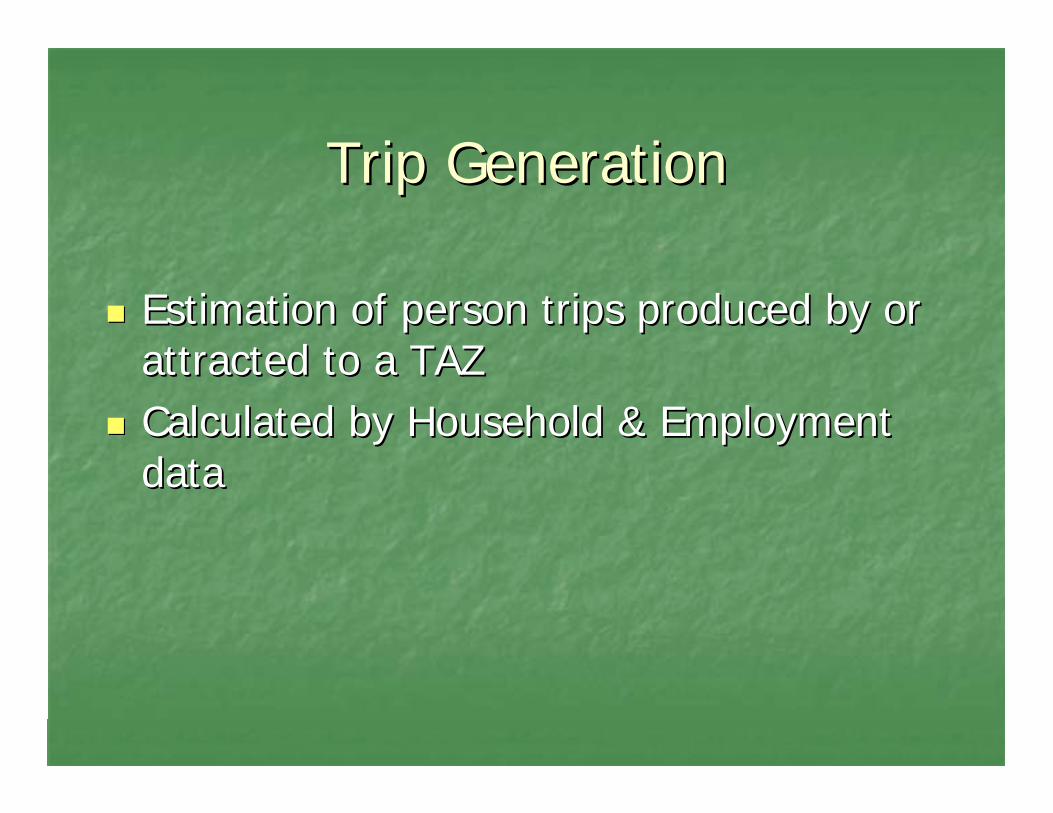
Trip GenerationTrip Generation
Estimation of person trips produced by or Estimation of person trips produced by or attracted to a TAZattracted to a TAZCalculated by Household & Employment Calculated by Household & Employment datadata

Data SourcesData Sources
National Cooperative Highway Research National Cooperative Highway Research Program (NCHRP)Program (NCHRP)
NCHRP 365 Report NCHRP 365 Report ––Travel Estimation Travel Estimation Techniques for Urban PlanningTechniques for Urban Planning
MI Travel CountsMI Travel CountsMichigan statewide household travel survey Michigan statewide household travel survey
2004/20052004/2005

PurposesPurposesHomeHome--Based & NonBased & Non--Home Based WorkHome Based WorkHomeHome--Based & NonBased & Non--Home Based OtherHome Based OtherHomeHome--Based School & NonBased School & Non--Home Based Home Based SchoolSchoolHomeHome--Based Shopping & NonBased Shopping & Non--Home Based Home Based ShoppingShoppingHomeHome--Based University & NonBased University & Non--Home Based Home Based UniversityUniversity
Trip Purpose Trip Purpose

Trip Production & Trip AttractionTrip Production & Trip Attraction
Trip production is where the trip is Trip production is where the trip is generatedgeneratedTrip attraction is where the trip is Trip attraction is where the trip is attractedattractedFor HomeFor Home--based trips the home end is based trips the home end is always the production endalways the production end

Trip PurposeTrip Purpose
HomeW ork
Home Based Work Home Based Other
Non-Home Based
Retail Mall

Cross Classification TableCross Classification TableBased on Autos and HH Size forBased on Autos and HH Size for
HomeHome--Based Other Daily Trip PurposeBased Other Daily Trip Purpose
9.216.613.610.67.63.7Avg
13.218.015.111.98.44.03+
10.616.713.310.68.14.026.313.711.59.26.74.01
3.911.29.27.44.82.60Autos Per
House hold
Avg5+4321
Persons Per Household

ProductionsProductionsNumber of HouseholdsNumber of Households
8533+
2812162821321
121290Autos Per
House hold
Total5+4321
Persons Per HouseholdTAZ 2156 HH
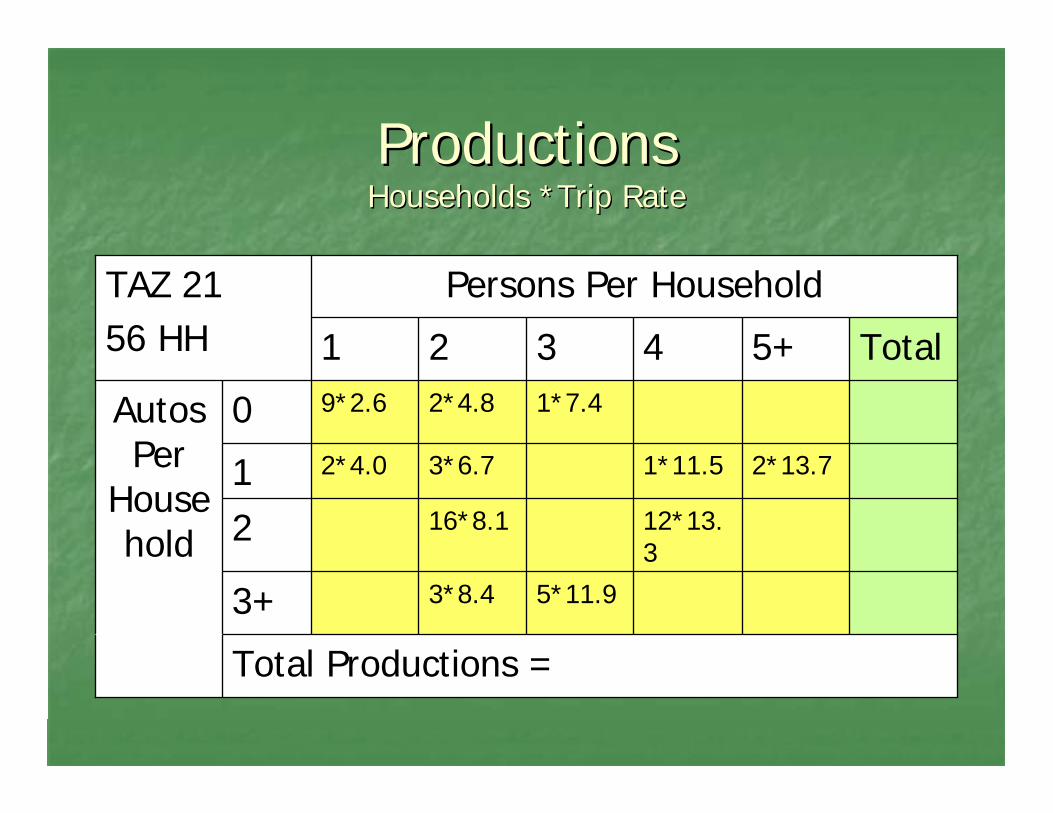
ProductionsProductionsHouseholds *Trip RateHouseholds *Trip Rate
Total Productions =
5*11.93*8.43+
12*13.3
16*8.12
2*13.71*11.53*6.72*4.01
1*7.42*4.89*2.60Autos Per
House hold
Total5+4321
Persons Per HouseholdTAZ 2156 HH

ProductionsProductionsDaily HBO TripsDaily HBO Trips
Total Productions = 481.3
84.759.525.23+
289.2159.6129.62
6727.411.520.18.01
40.47.49.623.40Autos Per
House hold
Total5+4321
Persons Per HouseholdTAZ 2156 HH
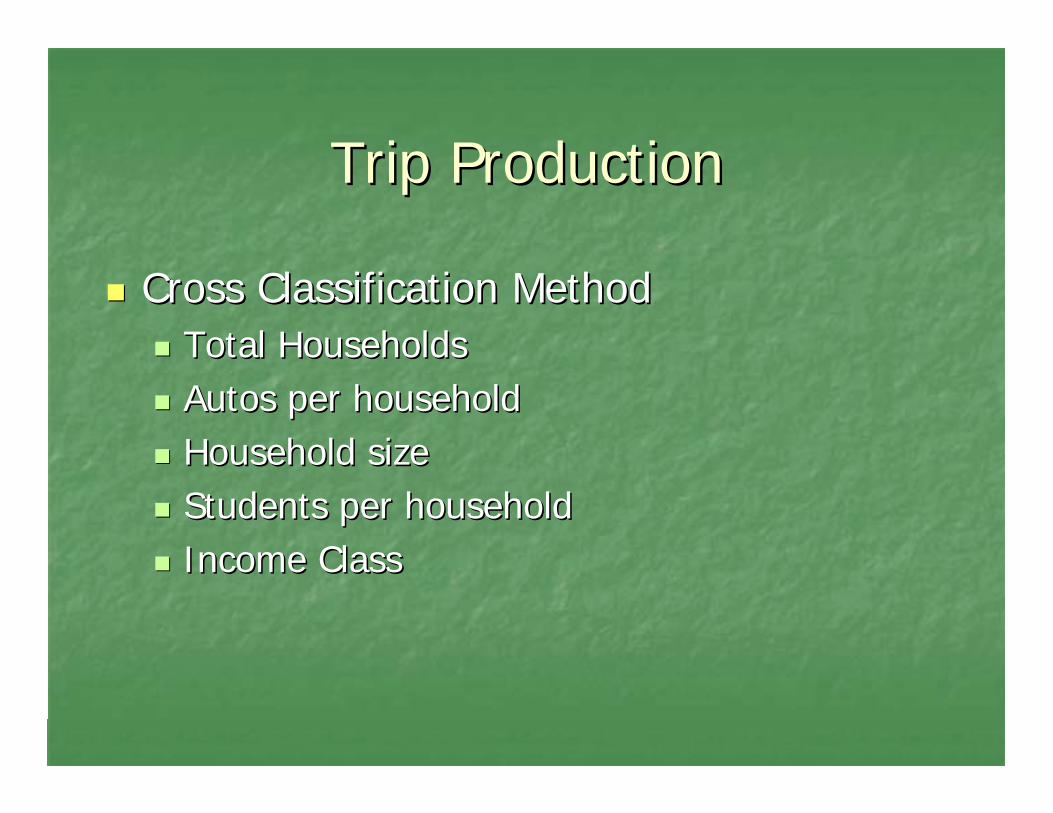
Trip ProductionTrip Production
Cross Classification MethodCross Classification MethodTotal Households Total Households Autos per household Autos per household Household size Household size Students per householdStudents per householdIncome ClassIncome Class

Trip AttractionTrip Attraction
Regression equationsRegression equationsTotal occupied householdsTotal occupied householdsTotal employmentTotal employmentRetail employmentRetail employmentService employmentService employmentOther (non retail or service) employmentOther (non retail or service) employmentArea typeArea type

Trip AttractionTrip AttractionExampleExample
HBO= (9.0*RE)+(1.7*SE)+(0.5*OE)+(0.9*HH)HBO= (9.0*RE)+(1.7*SE)+(0.5*OE)+(0.9*HH)HBO= (9.0*25)+(1.7*68)+(0.5*10)+(0.9*56) = HBO= (9.0*25)+(1.7*68)+(0.5*10)+(0.9*56) =
396 396 HomeHome--Based Other Person Trip AttractionsBased Other Person Trip Attractions
TAZ 12TAZ 12Households = 56Households = 56Retail Employment = 25Retail Employment = 25Service Employment = 68Service Employment = 68Other Employment = 10Other Employment = 10

Special GeneratorSpecial Generator
Special GeneratorsSpecial GeneratorsLand use with unusually high or low generation Land use with unusually high or low generation characteristicscharacteristics
AirportAirportUniversityUniversityMilitary baseMilitary baseHospitalsHospitals
Trip Generation HandbookTrip Generation HandbookMethods for IncludingMethods for Including
Add to TAZAdd to TAZReplace TAZ Productions & AttractionsReplace TAZ Productions & Attractions

Special GeneratorSpecial Generator
Models with Special GeneratorsModels with Special GeneratorsLansingLansingTriTri--City (BayCity (Bay--MidlandMidland--Saginaw)Saginaw)KalamazooKalamazooMuskegonMuskegonJacksonJacksonFlintFlintSEMCOGSEMCOGAnn ArborAnn Arbor

Trip ProductionTrip Production
78078089089016381638201420141307130715921592TotalTotal
22227537535355351585158532532513671367205205
654654121278078015156986981111204204
88909011112162161515156156203203
969635353123121981982692695858202202
NHBANHBANHBPNHBPHBOAHBOAHBOPHBOPHBWAHBWAHBWPHBWPTAZTAZ

BalancingBalancing
Total Productions & Attractions need to be equalTotal Productions & Attractions need to be equalIf a trip is made to work, there needs to be a return If a trip is made to work, there needs to be a return trip.trip.
Balance by Productions for HomeBalance by Productions for Home--based Purposebased PurposeBalance by Attractions for NonBalance by Attractions for Non--Home PurposeHome Purpose

Trip ProductionTrip Production
7807802014201415921592
7808901638201413071592Total
22753*% or Replace
535*%1585325*%1367205
65412*% or Replace
780 *%15698*%11204
890*% or Replace
11*%21615*%156203
9635*% or Replace
312*%198269*%58202
NHBANHBPHBOAHBOPHBWAHBWPTAZ

Trip ProductionTrip Production
7807802014 (+376)
20141592 (+285)
1592Total
2222658 (+123)
1585396 (+71)
1367205
654654959 (+179)
15850 (+152)
11204
8814 (+3)21618 (+3)156203
9696383 (+71)
198 328 (+59)
58202
NHBANHBPHBOAHBOPHBWAHBWPTAZ

Trip DistributionTrip Distribution

Trip DistributionTrip DistributionTrip distribution joins the productions to Trip distribution joins the productions to the attractionsthe attractionsGravity model Gravity model
Interaction between two Interaction between two TAZsTAZsThe relative size of the TAZThe relative size of the TAZTravel time on the network and friction Travel time on the network and friction factors measure the distance between factors measure the distance between TAZsTAZs
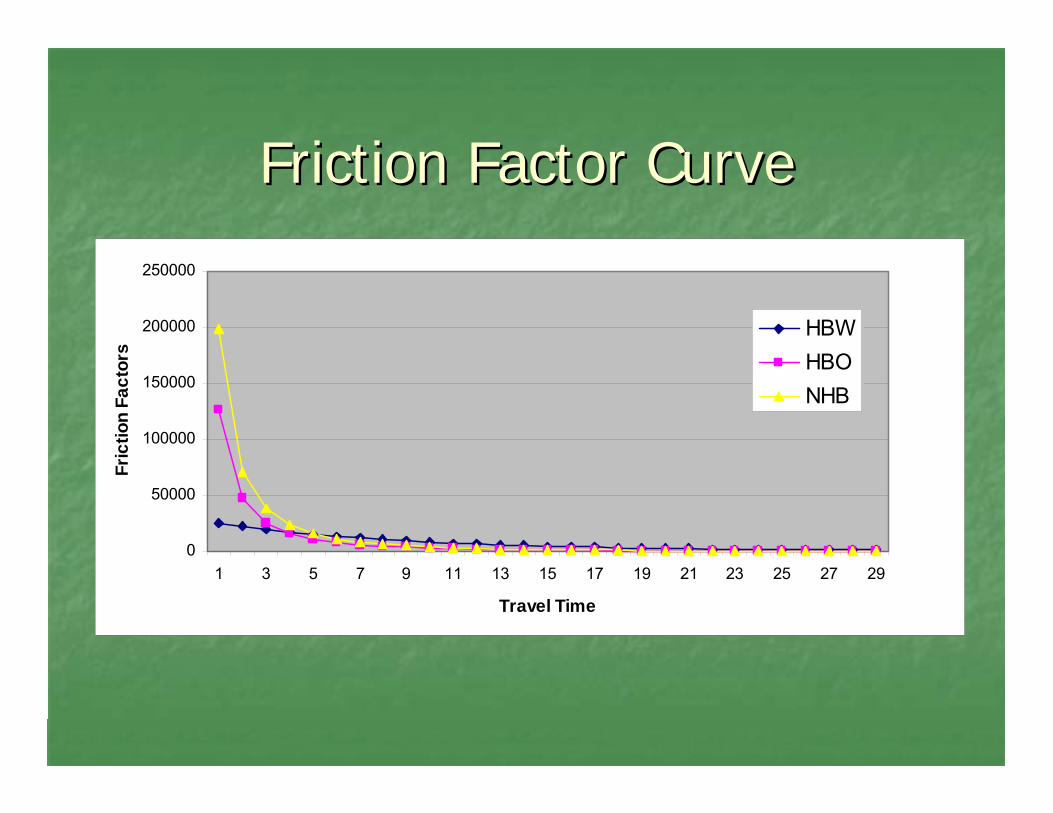
Friction Factor CurveFriction Factor Curve
0
50000
100000
150000
200000
250000
1 3 5 7 9 11 13 15 17 19 21 23 25 27 29
Travel Time
Fric
tion
Fact
ors
HBWHBONHB

400 HBW P
350 HBW A
150 HBW A
100 HBW A
250 HBW
50 HBW
100 HBW

Distribution MatrixDistribution Matrix

Mode ChoiceMode Choice

Mode ChoiceMode Choice
What is Mode Choice?What is Mode Choice?Assigning Person Trips to mode of travelAssigning Person Trips to mode of travelWhat models have Mode Choice?What models have Mode Choice?
TMA ModelsTMA Models
LogitLogit ModelModel

Mode ChoiceMode Choice
Example Different Modes used:Example Different Modes used:Drive AloneDrive Alone2 Person shared ride2 Person shared ride3+ Person shared ride3+ Person shared rideTransitTransitNonNon--motorizedmotorized
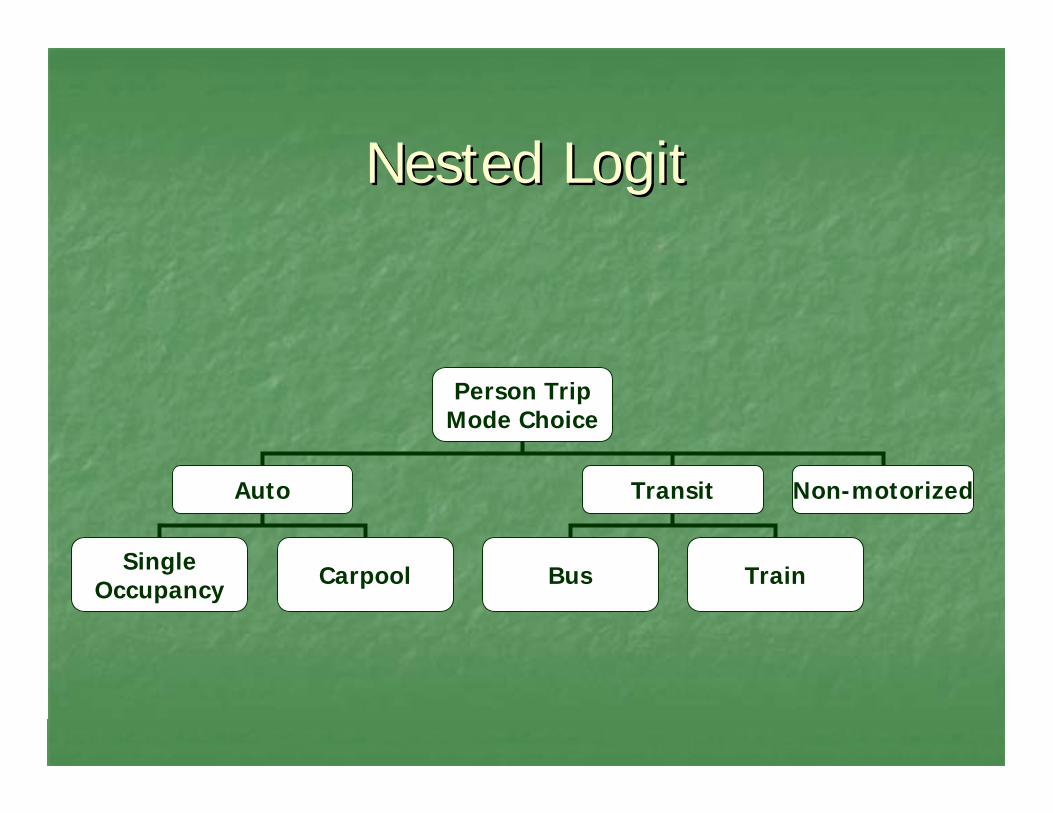
Nested Nested LogitLogit
Person TripMode Choice
Auto Transit Non-motorized
SingleOccupancy Bus TrainCarpool
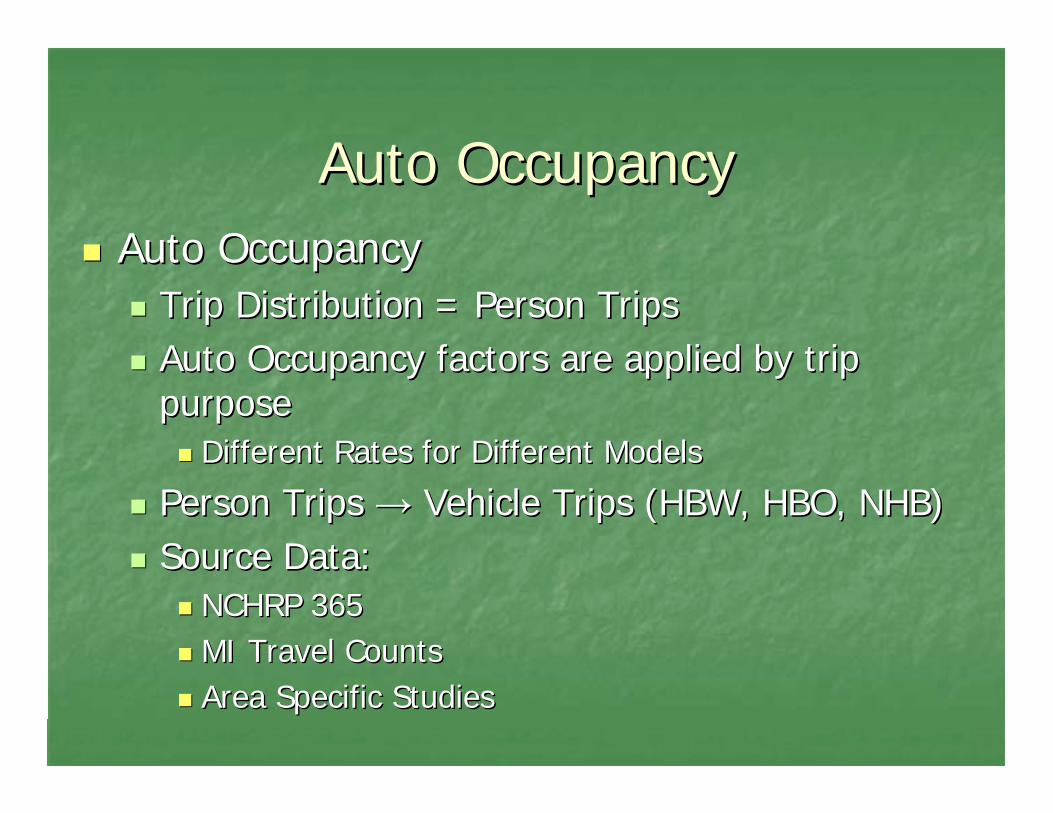
Auto OccupancyAuto OccupancyAuto Occupancy Auto Occupancy
Trip Distribution = Person TripsTrip Distribution = Person TripsAuto Occupancy factors are applied by trip Auto Occupancy factors are applied by trip purposepurpose
Different Rates for Different ModelsDifferent Rates for Different Models
Person Trips Person Trips →→ Vehicle Trips (HBW, HBO, NHB)Vehicle Trips (HBW, HBO, NHB)Source Data:Source Data:
NCHRP 365NCHRP 365MI Travel CountsMI Travel CountsArea Specific StudiesArea Specific Studies

Auto Occupancy RatesAuto Occupancy Rates
NCHRP 365NCHRP 365
1.661.66NHBNHB
1.671.67HBOHBO
1.111.11HBWHBW

Auto OccupancyAuto Occupancy
22.422.484.384.3444.5444.564.364.353.753.755
118.5118.519.819.814.614.6222.9222.933.933.944
156.8156.875.475.410.310.389.989.914.314.333
43.943.955.955.9864.5864.512.612.622.222.222
146.8146.812.512.589.489.453.953.921.221.211
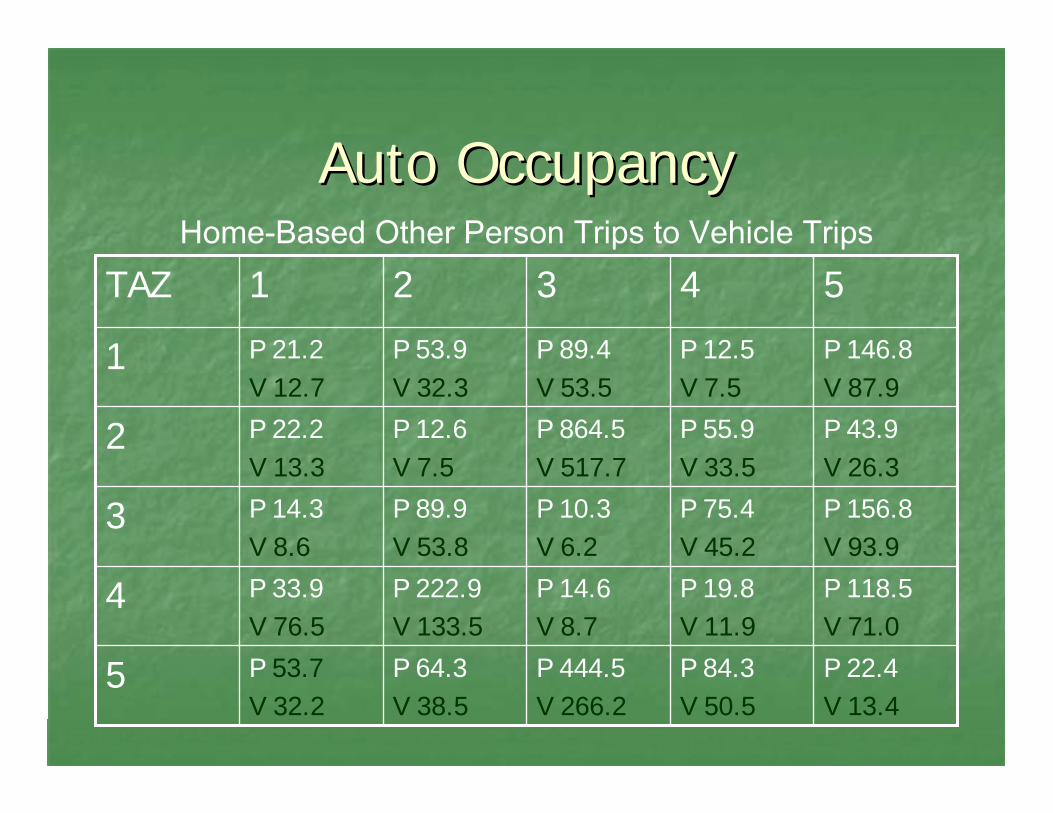
5544332211TAZTAZHome-Based Other Person Trips

Auto OccupancyAuto Occupancy
22.422.484.384.3444.5444.564.364.353.753.755
118.5118.519.819.814.614.6222.9222.933.933.944
156.8156.875.475.410.310.389.989.914.314.333
43.943.955.955.9864.5864.512.612.622.222.222
146.8146.812.512.589.489.453.9/1.6753.9/1.6721.2/1.6721.2/1.6711
5544332211TAZTAZHome-Based Other Person Trips to Vehicle Trips-1.67
Auto OccupancyAuto Occupancy
P 22.4V 13.4
P 84.3V 50.5
P 444.5V 266.2
P 64.3V 38.5
P 53.7V 32.2
5
P 118.5V 71.0
P 19.8V 11.9
P 14.6V 8.7
P 222.9V 133.5
P 33.9V 76.5
4
P 156.8V 93.9
P 75.4V 45.2
P 10.3V 6.2
P 89.9V 53.8
P 14.3V 8.6
3
P 43.9V 26.3
P 55.9V 33.5
P 864.5V 517.7
P 12.6V 7.5
P 22.2V 13.3
2
P 146.8V 87.9
P 12.5V 7.5
P 89.4V 53.5
P 53.9V 32.3
P 21.2V 12.7
1
54321TAZHome-Based Other Person Trips to Vehicle Trips
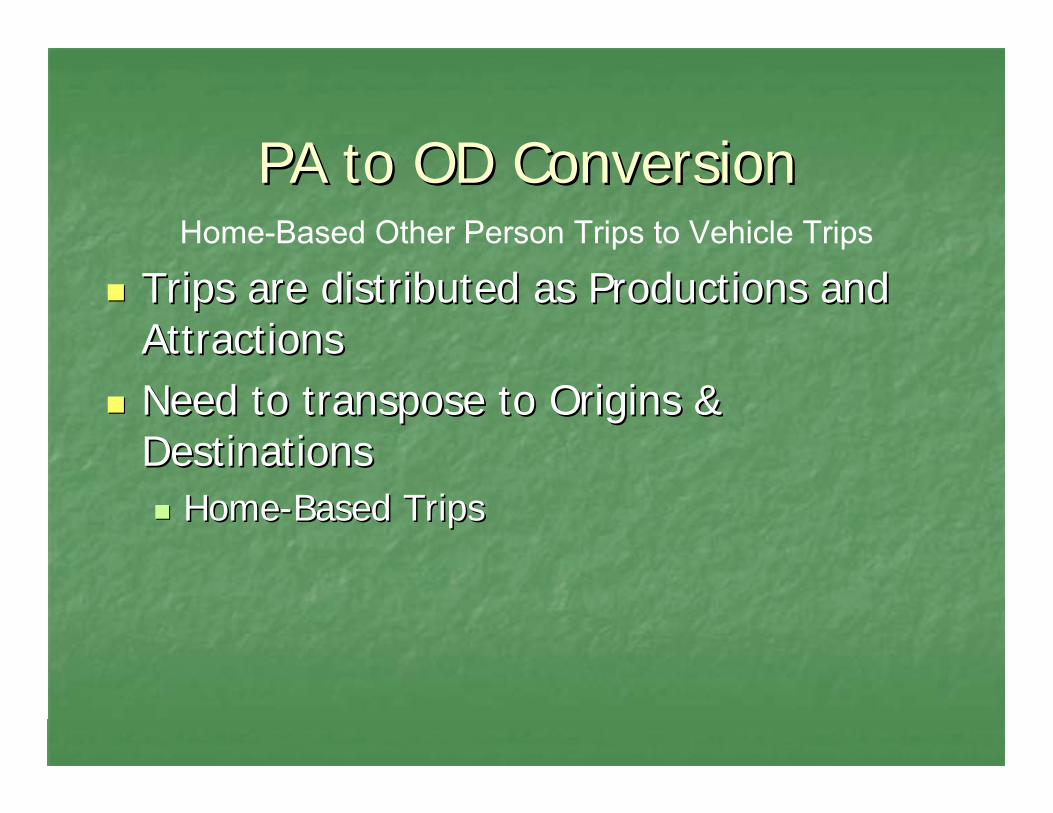
PA to OD ConversionPA to OD Conversion
Trips are distributed as Productions and Trips are distributed as Productions and AttractionsAttractionsNeed to transpose to Origins & Need to transpose to Origins & DestinationsDestinations
HomeHome--Based TripsBased Trips
Home-Based Other Person Trips to Vehicle Trips

PA to OD ConversionPA to OD Conversion
Home
Work
Production
Attraction
Destination
Origin

AssignmentAssignment

Delay function Delay function -- BPR CurveBPR Curve
An equation that tells the model how to An equation that tells the model how to adjust the speed of a link depending on adjust the speed of a link depending on the V/C ratiothe V/C ratioC_timeC_time = F_time(1 + = F_time(1 + a(v/c)a(v/c)bb))Can be adjusted globally and/or on an Can be adjusted globally and/or on an individual link basis individual link basis

BPR curveBPR curve

Traffic AssignmentTraffic Assignment
Inputs: Inputs: Final Total O&D Matrix of Vehicle TripsFinal Total O&D Matrix of Vehicle Trips
Road Network Road Network Travel TimeTravel Time11--Way CapacityWay CapacityOptional specific Alpha and Beta valuesOptional specific Alpha and Beta valuesTurn prohibition/penalty file Turn prohibition/penalty file

MethodsMethodsAll or NothingAll or Nothing –– assigns all trips to shortest assigns all trips to shortest path (capacity is not a factor)path (capacity is not a factor)
Statewide Model uses All or NothingStatewide Model uses All or Nothing
User EquilibriumUser EquilibriumAssigns all trips to shortest path until traffic Assigns all trips to shortest path until traffic volumes become congested then assigns the volumes become congested then assigns the remainder to the new shortest pathremainder to the new shortest pathGoes through a series of iterations until it reaches Goes through a series of iterations until it reaches a level of convergencea level of convergence
Traffic AssignmentTraffic Assignment

Time of DayTime of Day
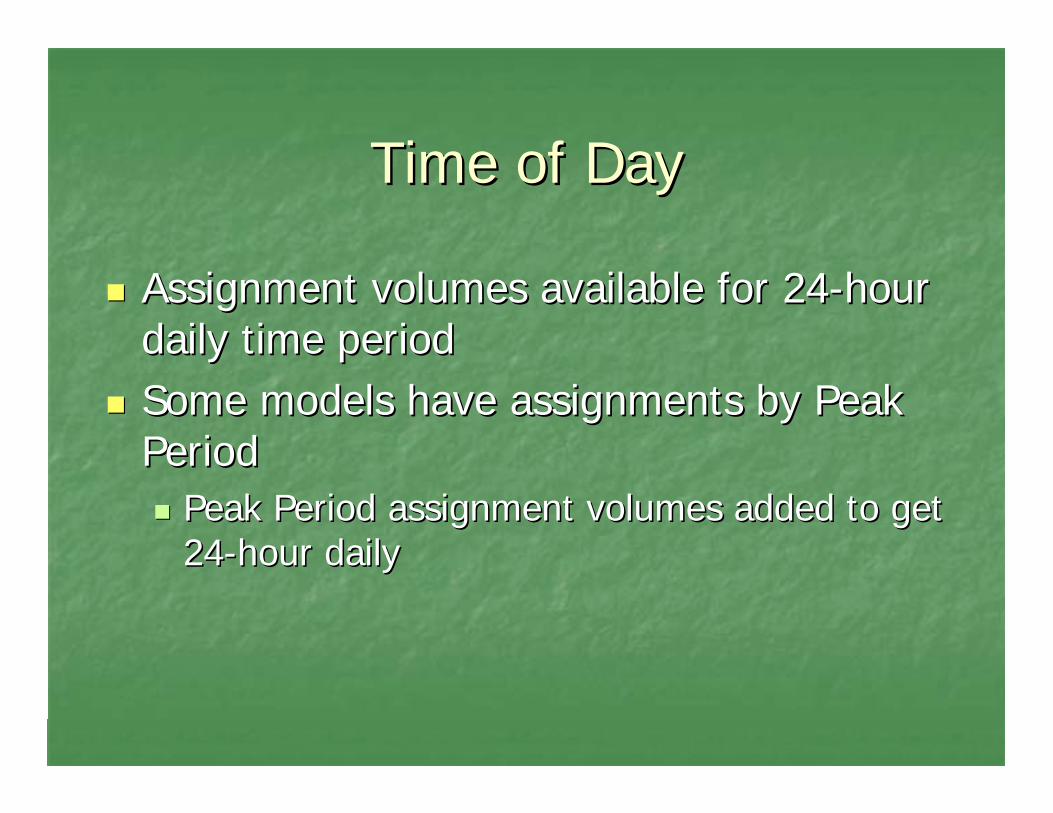
Time of DayTime of Day
Assignment volumes available for 24Assignment volumes available for 24--hour hour daily time perioddaily time periodSome models have assignments by Peak Some models have assignments by Peak PeriodPeriod
Peak Period assignment volumes added to get Peak Period assignment volumes added to get 2424--hour dailyhour daily

Time of DayTime of Day
Models with Peak Period assignmentModels with Peak Period assignmentHollandHollandLansingLansingSEMCOGSEMCOGFlint Flint Ann ArborAnn Arbor

Time of DayTime of Day
Peak PeriodsPeak PeriodsAM Peak AM Peak -- 7am7am--9am, 6am9am, 6am--9am (Flint)9am (Flint)PM Peak PM Peak -- 3pm3pm--6pm6pmOff Peak Off Peak -- all other hours (Lansing, Holland)all other hours (Lansing, Holland)MidMid--Day Day –– 9am9am--3pm (SEMCOG, AA, Flint)3pm (SEMCOG, AA, Flint)EveningEvening--7pm7pm--6am (SEMCOG, AA)6am (SEMCOG, AA)EveningEvening--6pm6pm--6am (Flint)6am (Flint)

Calibration & ValidationCalibration & Validation

CalibrationCalibration
CalibrationCalibrationAdjustments made to achieve desired resultsAdjustments made to achieve desired results
ValidationValidationHow well the results match the criteria at How well the results match the criteria at each stepeach step

Calibration Flow ChartCalibration Flow ChartModel Inputs
Validation
Trip Generation
Validation
Trip Distribution
Validation
Mode Choice
Validation
Trip Assignment
Validation

CalibrationCalibration
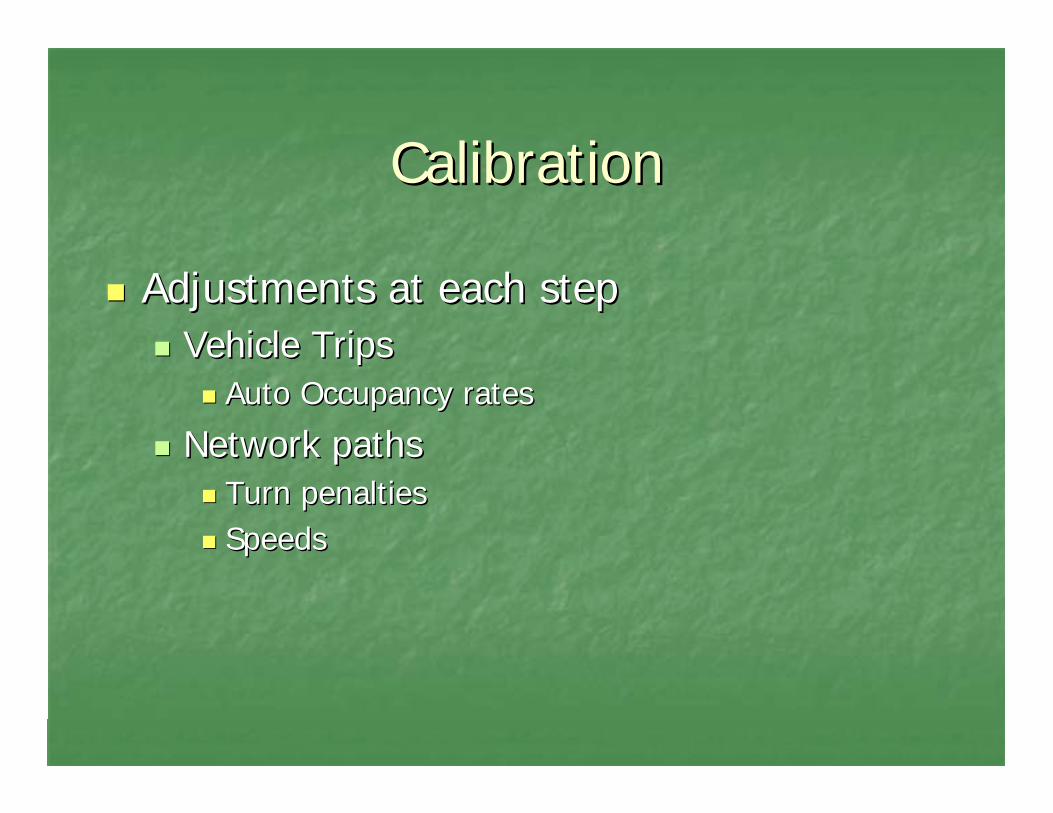
Adjustments at each stepAdjustments at each stepTrip GenerationTrip Generation
Adjust Trip rate tablesAdjust Trip rate tablesUse Area TypesUse Area TypesUse different variablesUse different variables
WorkersWorkersAverages or CategoriesAverages or Categories
Adjust Attraction EquationsAdjust Attraction Equations

CalibrationCalibration
Adjustments at each stepAdjustments at each stepTrip DistributionTrip Distribution
Adjust Friction FactorsAdjust Friction FactorsAdjust method of applying friction factorsAdjust method of applying friction factors
AssignmentAssignmentAdjust the BPR CurveAdjust the BPR Curve
CalibrationCalibration
Adjustments at each stepAdjustments at each stepVehicle TripsVehicle Trips
Auto Occupancy ratesAuto Occupancy rates
Network pathsNetwork pathsTurn penaltiesTurn penaltiesSpeedsSpeeds

Network PathsNetwork PathsReasonable PathsReasonable Paths
Use Shortest Path toolsUse Shortest Path toolsShortest PathShortest PathK Shortest PathK Shortest Path
WhyWhyConnectivityConnectivityTravel TimesTravel TimesIllogical travel patternsIllogical travel patterns

Network PathsNetwork Paths

Traffic CountsTraffic Counts
Traffic counts for base yearTraffic counts for base yearModified raw countsModified raw counts
Seasonal VariationSeasonal Variation
Average annual daily traffic (AADT)Average annual daily traffic (AADT)TrunklineTrunkline & local roads& local roads
CountsCounts+/+/-- 2 years from Base Year.2 years from Base Year.

Traffic CountsTraffic Counts
Where counts come fromWhere counts come fromMDOTMDOTLocal Road CommissionsLocal Road CommissionsPlanning AgenciesPlanning Agencies

MDOT Assignment Validation MDOT Assignment Validation StandardsStandards
Area wide VMT: +/Area wide VMT: +/-- 5% 5% (Assignment/count)(Assignment/count)Area Type +/Area Type +/--10%10%
CBD, Urban, Suburban, Fringe, RuralCBD, Urban, Suburban, Fringe, RuralScreenline: +/Screenline: +/-- 5% 5% Cutline: +/Cutline: +/-- 10% 10%

LINK TYPE LINK TYPE Validation StandardsValidation Standards
+/+/-- 25%25%+/+/-- 20%20%CollectorCollector
+/+/-- 20%20%+/+/-- 10%10%Minor Arterial Minor Arterial
+/+/-- 10%10%+/+/-- 7%7%Major Arterial Major Arterial
NO STANDARDNO STANDARD+/+/-- 6%6%TrunklineTrunkline
NO STANDARDNO STANDARDNO STANDARDNO STANDARDRampsRamps
+/+/-- 7%7%+/+/-- 6%6%FreewayFreeway
FHWA FHWA StandardsStandards
MDOT MDOT Standards Standards
LINK TYPELINK TYPE

VOLUME GROUP VOLUME GROUP Validation StandardsValidation Standards
Individual link targets (percent deviation of Individual link targets (percent deviation of assignment/count volumes on a linkassignment/count volumes on a link--byby--link basis) link basis)
+/+/-- 47%47%+/+/-- 100%100%1,000 1,000 –– 2,5002,500
+/+/-- 60%60%+/+/-- 200%200%< 1,000 < 1,000
+/+/-- 36%36%+/+/-- 50%50%2,500 2,500 –– 5,0005,000
+/+/-- 29%29%+/+/-- 25%25%5,000 to 10,0005,000 to 10,000
+/+/-- 25%25%+/+/-- 20%20%10,000 to 25,00010,000 to 25,000
+/+/-- 22%22%+/+/-- 15%15%25,000 25,000 –– 50,00050,000
+/+/-- 21%21%+/+/-- 10%10%> 50,000> 50,000
FHWA StandardsFHWA StandardsMDOT StandardsMDOT StandardsVolume GroupVolume Group

ValidationValidation
Only calculate validation criteria using Only calculate validation criteria using links with countslinks with countsPercent of links validated to volume group Percent of links validated to volume group
Should be above 80%Should be above 80%

Model DifferencesModel Differences

Model DifferencesModel Differences
Years AvailableYears AvailableDifferent Base YearsDifferent Base YearsDifferent Horizon YearsDifferent Horizon YearsDifferent Air Quality Years Different Air Quality Years
Projects are group by these yearsProjects are group by these years

Model YearsModel Years
1998 Base Year1998 Base YearKalamazoo (updating to 2008)Kalamazoo (updating to 2008)
2000 Base Year2000 Base YearHolland (updating to 2009)Holland (updating to 2009)GVMC (updating to 2009)GVMC (updating to 2009)Traverse CityTraverse City
2002 Base Year2002 Base YearMuskegon (updating to 2009)Muskegon (updating to 2009)Battle Creek Battle Creek
2004 Base Year2004 Base YearJacksonJackson
Model YearsModel Years
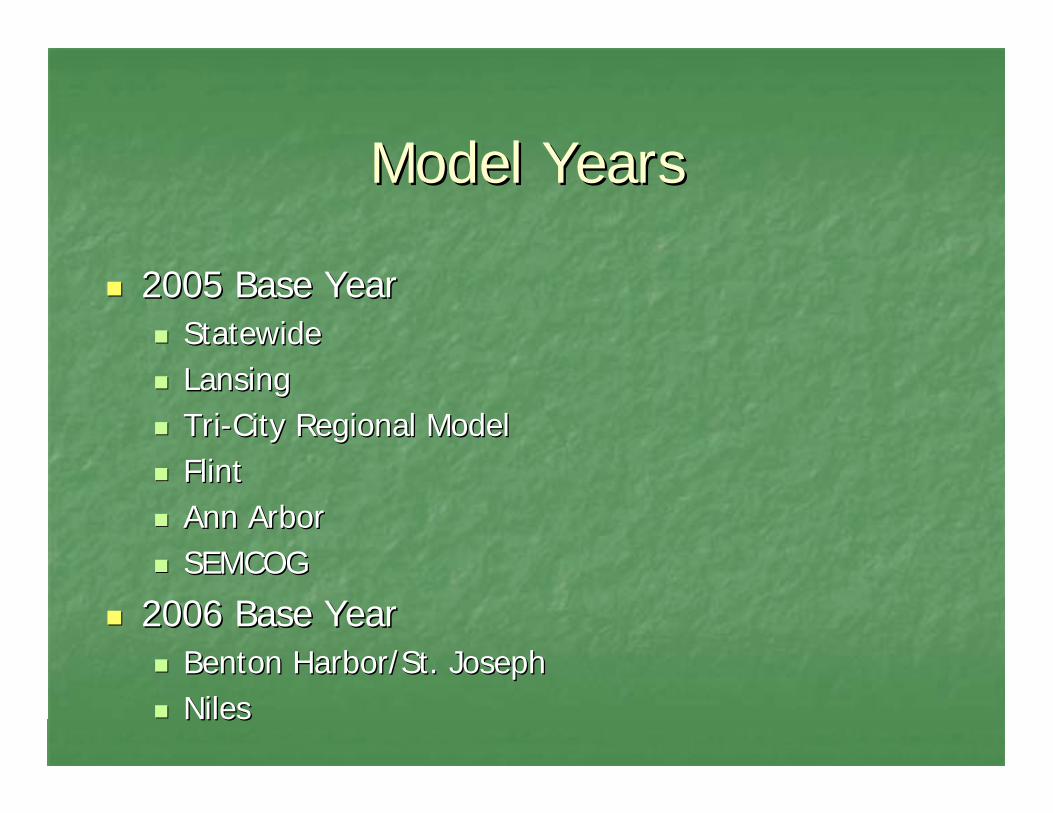
2005 Base Year2005 Base YearStatewideStatewideLansing Lansing TriTri--City Regional ModelCity Regional ModelFlintFlintAnn ArborAnn ArborSEMCOGSEMCOG
2006 Base Year2006 Base YearBenton Harbor/St. JosephBenton Harbor/St. JosephNilesNiles

Model YearsModel Years
2030 Horizon Year2030 Horizon YearAnn ArborAnn ArborSEMCOGSEMCOGKalamazooKalamazooBattle CreekBattle Creek
2035 Horizon Year2035 Horizon YearAll other modelsAll other models

Model DifferencesModel Differences
Update CyclesUpdate CyclesLRP Cycle LRP Cycle -- 4 or 5 year cycle4 or 5 year cycle
Jackson & TriJackson & Tri--city on 5 Yearcity on 5 Year
Interim UpdatesInterim UpdatesProject plan updatesProject plan updates
Project plan updatesProject plan updatesAny year that is not the base yearAny year that is not the base yearWhenever there is a capacity project Whenever there is a capacity project amendment to the TIP or LRPamendment to the TIP or LRP
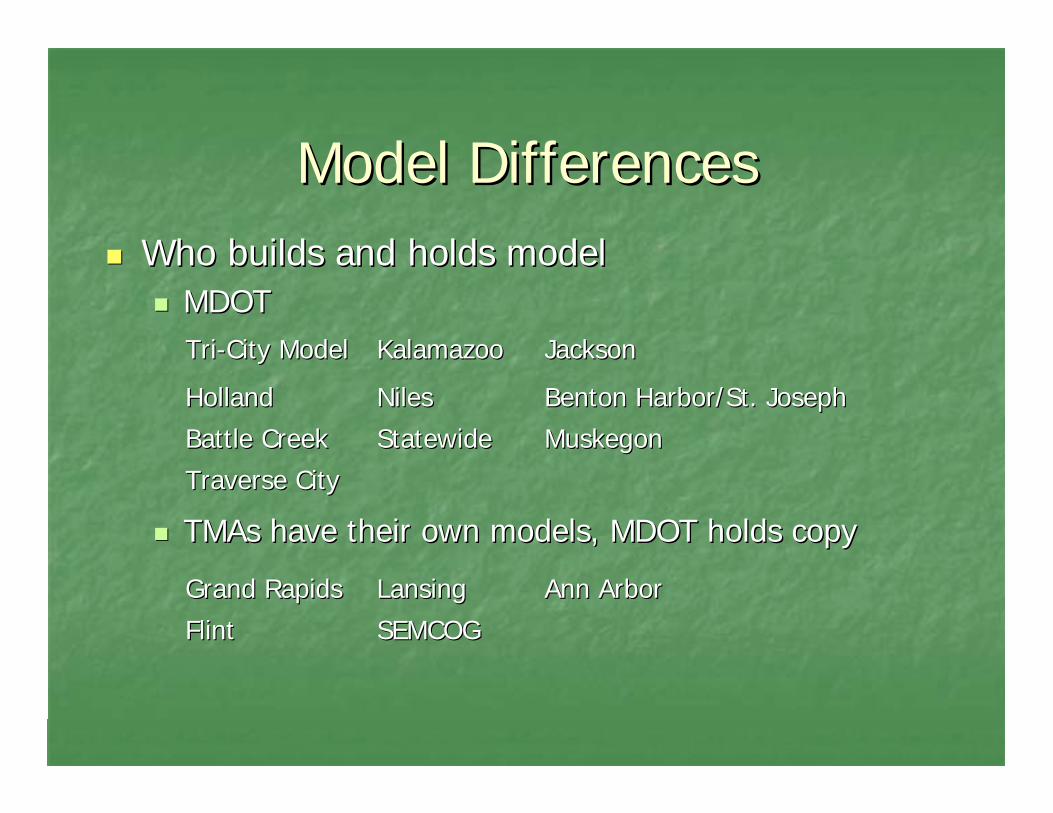
Model DifferencesModel DifferencesWho builds and holds modelWho builds and holds model
MDOTMDOT
TMAsTMAs have their own models, MDOT holds copyhave their own models, MDOT holds copy
SEMCOGSEMCOGFlintFlintAnn ArborAnn ArborLansingLansingGrand RapidsGrand Rapids
StatewideStatewideNilesNiles
KalamazooKalamazoo
Traverse CityTraverse CityMuskegonMuskegonBattle CreekBattle CreekBenton Harbor/St. JosephBenton Harbor/St. JosephHollandHolland
JacksonJacksonTriTri--City ModelCity Model

Model DifferencesModel Differences
Peak Period CapabilitiesPeak Period CapabilitiesTransit ModelsTransit Models
Lansing Lansing -- integratedintegratedFlint Flint -- integratedintegratedSEMCOG SEMCOG -- integrated integrated Grand Rapids Grand Rapids –– stand alonestand alone
Capacity DifferencesCapacity Differences

Model DifferencesModel Differences
Model DesignModel DesignData SourcesData SourcesChanges made during CalibrationChanges made during Calibration

Statewide ModelStatewide Model

Statewide Model NetworkStatewide Model Network

Network ComparisonNetwork ComparisonStatewide Model TriStatewide Model Tri--County ModelCounty Model

Zones and Loadings ComparisonZones and Loadings ComparisonStatewide Model TriStatewide Model Tri--County ModelCounty Model

Urban Models:Urban Models: Statewide Model:Statewide Model:
Home Based WorkHome Based Work Home Based Work/BusinessHome Based Work/BusinessHome Based OtherHome Based Other Home Based Social RecreationHome Based Social Recreation
Home Based OtherHome Based Other
NonNon--Home BasedHome Based NonNon--Home Based Work/BusinessHome Based Work/BusinessNonNon--Home Based OtherHome Based Other
Trip PurposesTrip Purposes

Urban Models:Urban Models: Statewide Model:Statewide Model:
Households (Households (avgavg or by cat)or by cat) Households by Size (1Households by Size (1--5+ persons)5+ persons)Autos per Household Autos per Household Households by IncomeHouseholds by IncomeIncomeIncome per Household per Household (low, medium, high)(low, medium, high)
Total EmploymentTotal Employment Manufacturing EmploymentManufacturing EmploymentRetail EmploymentRetail Employment Other Basic (farming, fishing, mining) Other Basic (farming, fishing, mining) Service Employment RetailService Employment RetailOther Employment WholesaleOther Employment Wholesale
ServiceServiceOther (insurance, real estate, finance)Other (insurance, real estate, finance)
Data RequirementsData Requirements

Statewide Model:Statewide Model:AllAll--OrOr--Nothing Traffic AssignmentNothing Traffic Assignment
All the traffic traveling between two zonesAll the traffic traveling between two zonesuses the shortest path between the zones.uses the shortest path between the zones.

Traffic traveling between two zones uses the shortest path untilTraffic traveling between two zones uses the shortest path until congestion congestion causes the speed to drop, at which time it diverts to another facauses the speed to drop, at which time it diverts to another faster path.ster path.
Urban Models:Urban Models:Equilibrium Traffic AssignmentEquilibrium Traffic Assignment

Why not use an Equilibrium Assignment Why not use an Equilibrium Assignment with the Statewide Model?with the Statewide Model?
The Statewide Model is mainly concerned The Statewide Model is mainly concerned with rural areas and freeway corridors in with rural areas and freeway corridors in which congestion is not as much of a which congestion is not as much of a problem as in urban areasproblem as in urban areas
The Statewide Model network is sparse The Statewide Model network is sparse and does not offer many opportunities for and does not offer many opportunities for traffic to divert in the event of congestion traffic to divert in the event of congestion

When should theWhen should theStatewide Model be used?Statewide Model be used?
When the analysis area is outside the urban When the analysis area is outside the urban model areasmodel areas
When a project may have significant impacts When a project may have significant impacts beyond the boundaries of an urban modelbeyond the boundaries of an urban model
When comparing two or more areas that would When comparing two or more areas that would fall in different urban modelsfall in different urban models
SUTA staff can recommend which model should SUTA staff can recommend which model should be used for a given analysisbe used for a given analysis

What are we doing toWhat are we doing toimprove the models?improve the models?
Models are currently being developedModels are currently being developedfrom the MI Travel Counts survey datafrom the MI Travel Counts survey data
Socioeconomic data has recently been Socioeconomic data has recently been updated with the latest REMI forecastsupdated with the latest REMI forecasts
A statewide truck model for commercial A statewide truck model for commercial traffic is under developmenttraffic is under development

AssumptionsAssumptions

AssumptionsAssumptions
Everyone has perfect knowledge of Everyone has perfect knowledge of networknetworkEveryone wants to minimize travel timeEveryone wants to minimize travel timeEveryone wants to go to closest Everyone wants to go to closest destinationdestination

AssumptionsAssumptions
Not ConsideredNot ConsideredTraffic SignalsTraffic SignalsAccess ManagementAccess ManagementGeometricsGeometricsHuman Behavior/PreferencesHuman Behavior/Preferences

Model Outputs & ApplicationsModel Outputs & Applications

Model OutputsModel Outputs
Travel demand models were designed for Travel demand models were designed for system wide analysissystem wide analysisPatterns and Changes not necessarily Patterns and Changes not necessarily specific numbersspecific numbers

Model OutputsModel Outputs
VolumesVolumesTotal VolumesTotal VolumesVolume ChangesVolume ChangesGrowth FactorsGrowth Factors
Congested SpeedsCongested SpeedsUrban only Urban only
Vehicle Miles TraveledVehicle Miles TraveledVehicle Hours TraveledVehicle Hours Traveled

Model OutputsModel Outputs
Volume to Capacity RatiosVolume to Capacity RatiosPost processing for StatewidePost processing for Statewide
Statewide model can post process for Statewide model can post process for commercial traffic utilizing the percent commercial traffic utilizing the percent commercial from Sufficiency commercial from Sufficiency

Types of AnalysisTypes of Analysis
Alternative TestingAlternative TestingProject SelectionProject Selection
Detour AnalysisDetour AnalysisAssignment differences based on temporary change Assignment differences based on temporary change in networkin networkDistribution remains the sameDistribution remains the same
Permanent Network ChangePermanent Network ChangeAssignment differences based on permanent change Assignment differences based on permanent change in networkin networkDistribution ChangesDistribution Changes

Types of AnalysisTypes of Analysis
Project AnalysisProject AnalysisExpand/Decrease CapacityExpand/Decrease CapacityNew RoadsNew RoadsOneOne--Way ChangesWay ChangesSpeed ChangesSpeed ChangesChanges in ConnectivityChanges in Connectivity
Select Link AnalysisSelect Link AnalysisAll the trips that pass thru that link All the trips that pass thru that link Flows to and from a specific linkFlows to and from a specific link

Types of AnalysisTypes of Analysis
Major Land Use ChangesMajor Land Use ChangesNew MallNew MallMajor Housing DevelopmentMajor Housing Development
SubSub--Area AnalysisArea AnalysisCorridorsCorridorsSmall Communities/AreasSmall Communities/Areas

Questions about Questions about Travel Demand Travel Demand
Models?Models?

Discussion Discussion Where do we go from here Where do we go from here
Presentation from Project Planning Presentation from Project Planning Cross divisional team Cross divisional team
Review of NCHRP Report 255Review of NCHRP Report 255Highway Traffic Data for Urbanized Area Project Highway Traffic Data for Urbanized Area Project Planning and DesignPlanning and Design
Review methods of other DOTSReview methods of other DOTSSet standards for requests and levels of Set standards for requests and levels of analysisanalysis

Thank you for participating! Thank you for participating!