Embed Size (px)
Citation preview
1
Trauma Services Annual Report Medicine Hat Regional Hospital
2011/2012
2
TABLE OF CONTENTS Medicine Hat Regional Hospital Annual Report ............................................................ 1 Alberta Health Services Mission and Strategy .............................................................. 4 Trauma Services Vision and Mission ............................................................................. 6 Message from the Trauma Medical Director – MHRH ................................................... 7 Acknowledgements ........................................................................................................ 8 How Do We Collect Our Data .......................................................................................... 9 What is Trauma Registry? ................................................................................................. 9 Which patients qualify for the trauma registry? .................................................................. 9 How do you identify trauma patient? .................................................................................. 10 What data is collected? ...................................................................................................... 10 Why is this data collected? ................................................................................................ 10 What Was Trauma Services up to in 2011/12 Clinical ............................................................................................................................... 11 Education .......................................................................................................................... 11 Quality Assurance/Improvement ........................................................................................ 11 Administration .................................................................................................................... 12 Who Experienced Serious Trauma in 2011/12 .............................................................. 13 Gender ............................................................................................................................... 13 Age ..................................................................................................................................... 14 When Did These Traumas Occur? ................................................................................. 15 Admissions by Month ........................................................................................................ 15 Admissions by Day of Week .............................................................................................. 16 Admissions by Shift……………………………………………………………………………… 17 How Did These Injuries Occur? ...................................................................................... 18 Mechanism of Injury ........................................................................................................... 18 How many of these injuries were work-related? ................................................................ 19 Falls ................................................................................................................................... 20 Transportation .................................................................................................................... 21 Violence ............................................................................................................................. 22 Other MOI ......................................................................................................................... 23 MOI by age range .............................................................................................................. 25 Where Were These Patients Injured? ............................................................................. 26 Places of injury ................................................................................................................... 26 What Injuries Did These Patients Sustain? ........................................................................ 27 Type of injury ..................................................................................................................... 27 Blunt injury ......................................................................................................................... 28 Penetrating injury ............................................................................................................... 28
3
Burn injury .......................................................................................................................... 29 Injury Severity Score (ISS) and type of injury. ................................................................... 30 What Happened to the Patients Before They Arrived at MHRH? ................................. 31 What happened at the scene? ........................................................................................... 31 Where are the patients coming from? ................................................................................ 32 What happened at the other hospitals? ............................................................................. 33 How did the patients get to the MHRH? ............................................................................. 34 On Scene Times …………………………………………………………………… ................... 35 What Happened When the Patients Arrived at the Trauma Centre? ........................... 36 Documentation .................................................................................................................... 36 Trauma Team Activation (TTA) .......................................................................................... 37 Where did the patient go after they left the Emergency Department? ............................... 37 Emergency Department Length of Stay (LOS) .................................................................. 38 Admitting Service .............................................................................................................. 39 What Non-Operative Procedures Were Performed for Major Trauma Patient? ................. 40 Survival .............................................................................................................................. 41 Total number of trauma deaths …………………………………… ....................................... 42 Mechanism of Injury Outcome ………………………………………………………… ............ 42 Where were our Patients Discharged to? ………………………………………………… .. 43 Appendix A MHRH Performance Indicator and Provincial Audit Filters .......................................... 44
4
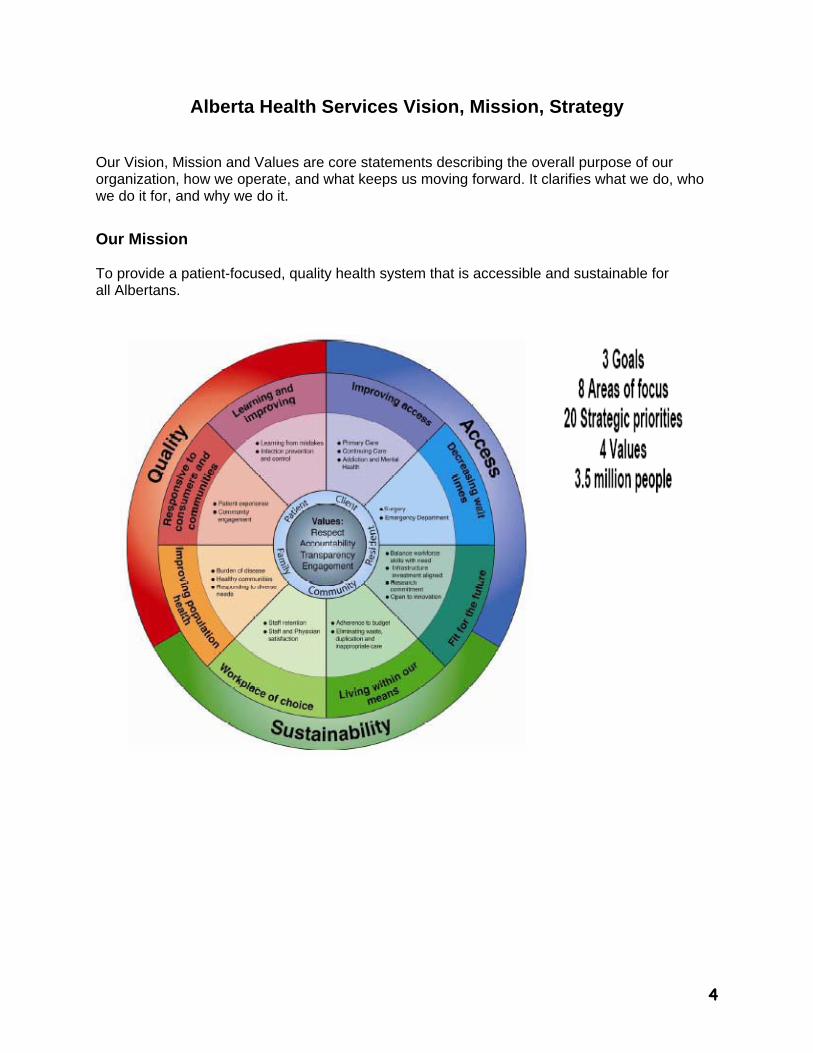
Alberta Health Services Vision, Mission, Strategy Our Vision, Mission and Values are core statements describing the overall purpose of our organization, how we operate, and what keeps us moving forward. It clarifies what we do, who we do it for, and why we do it.
Our Mission To provide a patient-focused, quality health system that is accessible and sustainable for all Albertans.
5
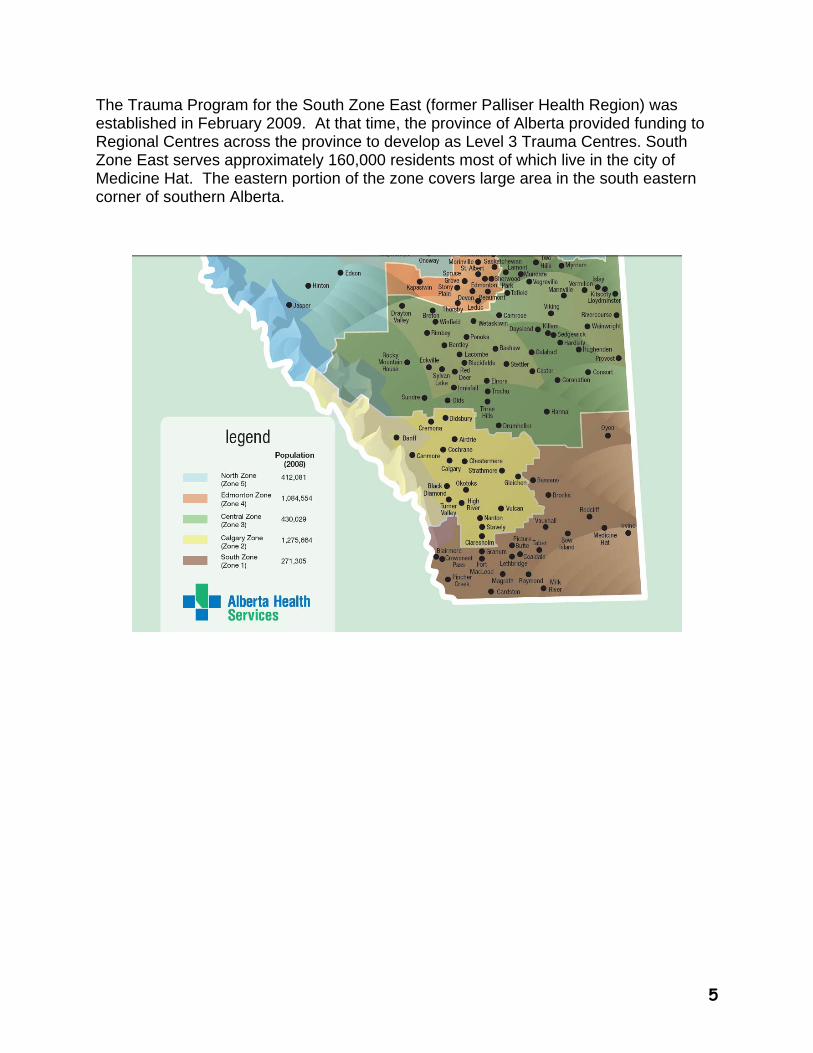
The Trauma Program for the South Zone East (former Palliser Health Region) was established in February 2009. At that time, the province of Alberta provided funding to Regional Centres across the province to develop as Level 3 Trauma Centres. South Zone East serves approximately 160,000 residents most of which live in the city of Medicine Hat. The eastern portion of the zone covers large area in the south eastern corner of southern Alberta.
6
Trauma Services Vision and Mission Trauma Services Vision
Excellence in trauma service.
Trauma Services Mission
The mission of the Southeast Zone trauma program is to develop and maintain a comprehensive trauma system for the prevention, treatment, and rehabilitation of injury focusing on the individual, family, and community. To get the injured person to the right treatment at the right trauma facility in the shortest time.
7
Message from the Trauma Medical Director – MHRH
Another year has passed, and our trauma program continues to grow and improve. Our health care providers are working hard to deliver optimal trauma care at all facets of the trauma patient's journey within the acute care system: pre-hospital care, emergency stabilization, in-hospital treatment, all the way through to rehabilitation. Thanks to the ongoing efforts of all team members, our level III regional trauma center continues to provide stellar care to all trauma patients within our region. Over the past three years, the trauma program has focused on trying to optimize care through standardization of trauma care delivery. Our focus has been on improving care through the implementation and routine utilization of a number of policies and standardized trauma practices: pre-hospital scene time processes and goals, trauma team activation protocols, standardized trauma admission policies, and improved trauma care documentation templates. In addition to improved processes, we have steadily improved our collection and analysis of our trauma data. It is our belief that the data should drive our program's growth, and that we should continue to apply resources to areas of need indentified by the objective data. One of the clear trends supported by our data is that yearly our trauma numbers continue to increase. Not only are we treating more and more trauma patients, but a greater proportion of them are being admitted and treated locally within our hospital. This clear trend has highlighted the need for our program to focus on bolstering in-patient trauma care through increased training opportunities and improved trauma hospital based resources. In the upcoming year one of the ongoing challenges for our evolving program will be to continue to identify trauma patients that are appropriate for care locally, and to identify ways to standardize and improve our in-patient trauma care delivery. We know that we are faced with keeping growing numbers of complicated poly-trauma patients, and our next steps must be the growth of our in-patient trauma services so that health care providers have the training and resources necessary to provide the best care possible. Our trauma program has come a long way, but we still have room for improvement. Through the continued collection of our own local trauma data, we will continue to optimize our trauma care throughout all phases of the trauma patient’s journey through our system.
Dr. Paul Parks Trauma Medical Director, Medicine Hat Regional Hospital
8
Acknowledgments
Ms. Linda Iwasiw, Vice President Medicine Hat Regional Hospital
Dr. Paul Parks, Medical Director, Trauma Services
Ms. Brenda Ashman,
Ms. Carolyn Whitfield, Analyst, Trauma Services
Ms. Paula Doyle-Weigel, Trauma Coordinator, Trauma Services
Dr. Ron Witzke, Chief of Surgery
Other Contributors
Marguerite Dorchak, Supervisor Emergency
9
How Do We Collect Our Data?
What is the Trauma Registry?
As part of the Trauma Association of Canada (TAC) guidelines, an accredited trauma center requires a trauma registry. A trauma registry is a system that provides the statistical ground work for quality assurance activities that can lead to improved quality of care for trauma patients. Trauma Services uses the software, Collector, which was developed by an American company and is supported by Digital Innovation based out of Maryland, USA. This application is used by over 200 hospitals worldwide including hospitals in Canada, the U.S., Australia, New Zealand and Sweden. It is a complete data management tool and report writing package.
Which patients qualify for the trauma registry?
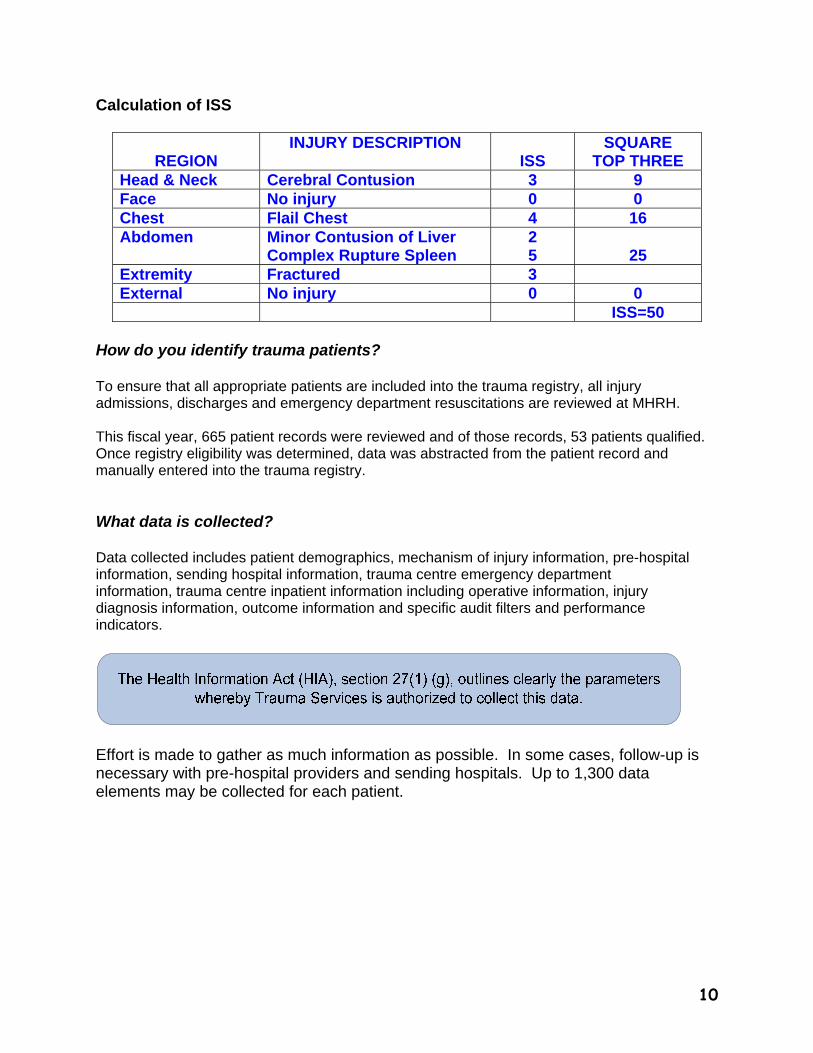
Patients are entered into the Trauma Registry if their Injury Severity Score (ISS) is greater than or equal (>) 12 and if they are admitted transferred to another hospital or pass away at MHRH. Patients who die at the scene of their traumatic event are not represented in this report. Injury Severity Score (ISS) is an anatomical scoring system that provides an overall score for patients with multiple injuries. Each injury is assigned an Abbreviated Injury Scale (AIS) score and is allocated to one of six body regions (Head, Face, Chest, Abdomen, Extremities (including Pelvis), and External). Only the highest AIS score in each body region is used. The 3 most severely injured body regions have their score squared and added together to produce the ISS score. It is a summary score to characterize the multiple injuries typically sustained by the trauma patient. The ISS ranges from 12-75 with the assumption that the higher the score, the more serious the injury.
10
Calculation of ISS
REGION
INJURY DESCRIPTION ISS
SQUARE TOP THREE
Head & Neck Cerebral Contusion 3 9 Face No injury 0 0 Chest Flail Chest 4 16 Abdomen Minor Contusion of Liver
Complex Rupture Spleen 2 5
25
Extremity Fractured 3 External No injury 0 0 ISS=50
How do you identify trauma patients?
To ensure that all appropriate patients are included into the trauma registry, all injury admissions, discharges and emergency department resuscitations are reviewed at MHRH. This fiscal year, 665 patient records were reviewed and of those records, 53 patients qualified. Once registry eligibility was determined, data was abstracted from the patient record and manually entered into the trauma registry. What data is collected? Data collected includes patient demographics, mechanism of injury information, pre-hospital information, sending hospital information, trauma centre emergency department information, trauma centre inpatient information including operative information, injury diagnosis information, outcome information and specific audit filters and performance indicators.
Effort is made to gather as much information as possible. In some cases, follow-up is necessary with pre-hospital providers and sending hospitals. Up to 1,300 data elements may be collected for each patient.
11
Why is this data collected? Data is retrieved and analyzed for internal quality improvement initiatives with Regional Trauma Services and with departments involved in the care of the trauma patient. Following the appropriate approval process, the registry is also used as a source of data for research, resource utilization, education and injury prevention initiatives, and outcome studies. Collector supports unique projects by providing the ability to customize the Trauma Registry and to write queries and reports. MHRH also submit data to the Alberta Trauma Registry (ATR) central site based at the University of Alberta Hospital (U of A) in Edmonton, Alberta. The central site also captures data from the Foothills Medical Hospital, Alberta Children’s Hospital in Calgary, Lethbridge Regional Hospital, Red Deer, Grand Prairie, Fort McMurray, the U of A Hospital, and the Royal Alexandra Hospital in Edmonton. Data is then submitted from the central site to
the National Trauma Registry of Canada.
12
What Was Trauma Services up to in 2011/12
Clinical Ongoing clinical work included: Ongoing clinical care and comprehensive management of over injured patients. Ongoing review and revision of clinical protocols and guidelines Ongoing review of Trauma chart’s and feedback to all involved
Education Educational activities included: Ongoing education and feedback to staff Trauma Education Days Trauma Nursing Core Course (TNCC) Emergency Nursing Pediatric Course (ENPC) Advanced Pediatric Life Support Course Outreach Education – Pediatric Human Patient Simulation Program by ACH TAC conference
New Guidelines and Algorithms : Physician Trauma Record Nursing Trauma Record
Quality Assurance/Improvement
Retrospective review of all trauma patients in the trauma registry with flagged
performance indicators and/or audit filters A new process was started where the Trauma Coordinator started tracking trends in
addition to taking individual cases for review with the Medical Director, Dr. Parks Review of all deaths within 24 hours and other deaths as needed
Work continues to be done on creating operational definitions and coding notes for our
data dictionary Work continues to be done on increasing the number of data validation checks
13
Administration Administrative support is essential to the co-ordination and achievement of the various Trauma Services activities. Many administration support activities were included in the previous sections. Additional administrative support activities included: Ongoing participation in the Provincial Trauma Committee Maintaining ongoing links with the Trauma Association of Canada
We wish to thank all of the staff at the Medicine Hat Regional Hospital and our rural partners who have had an impact on the Trauma Program and continue to support our goals in caring for critically injured adults and children. We also would like to thank the Foothills Medical Center Trauma Program, Alberta Children’s Hospital Trauma Program, and the University of Alberta/Stollery Trauma Programs for their leadership and support for the development of our trauma program.
14
Who Experienced Serious Trauma in 2010/2011?
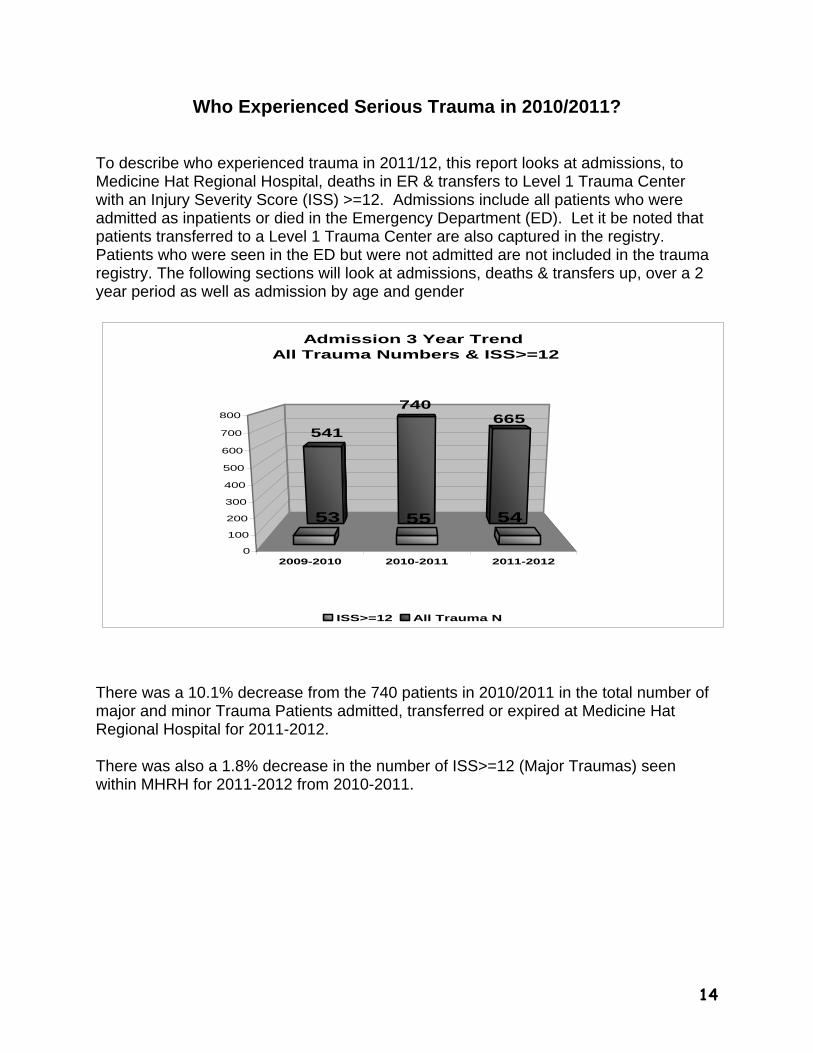
To describe who experienced trauma in 2011/12, this report looks at admissions, to Medicine Hat Regional Hospital, deaths in ER & transfers to Level 1 Trauma Center with an Injury Severity Score (ISS) >=12. Admissions include all patients who were admitted as inpatients or died in the Emergency Department (ED). Let it be noted that patients transferred to a Level 1 Trauma Center are also captured in the registry. Patients who were seen in the ED but were not admitted are not included in the trauma registry. The following sections will look at admissions, deaths & transfers up, over a 2 year period as well as admission by age and gender
2009-2010 2010-2011 2011-2012
541665
740
53 5455
0
100
200
300
400
500
600
700
800
Admission 3 Year Trend All Trauma Numbers & ISS>=12
ISS>=12 All Trauma N
There was a 10.1% decrease from the 740 patients in 2010/2011 in the total number of major and minor Trauma Patients admitted, transferred or expired at Medicine Hat Regional Hospital for 2011-2012. There was also a 1.8% decrease in the number of ISS>=12 (Major Traumas) seen within MHRH for 2011-2012 from 2010-2011.
15
Admission by Gender
Female (n=15) 27.8%
Male (n=39) 72.2%
Gender Age
10
2 2
14
3
9
3
9
0
4
7
0
2
4
6
8
10
12
14
<5years 5-14 15-44 45-64 65-74 75+
Age Group
Age Distribution
Males Females
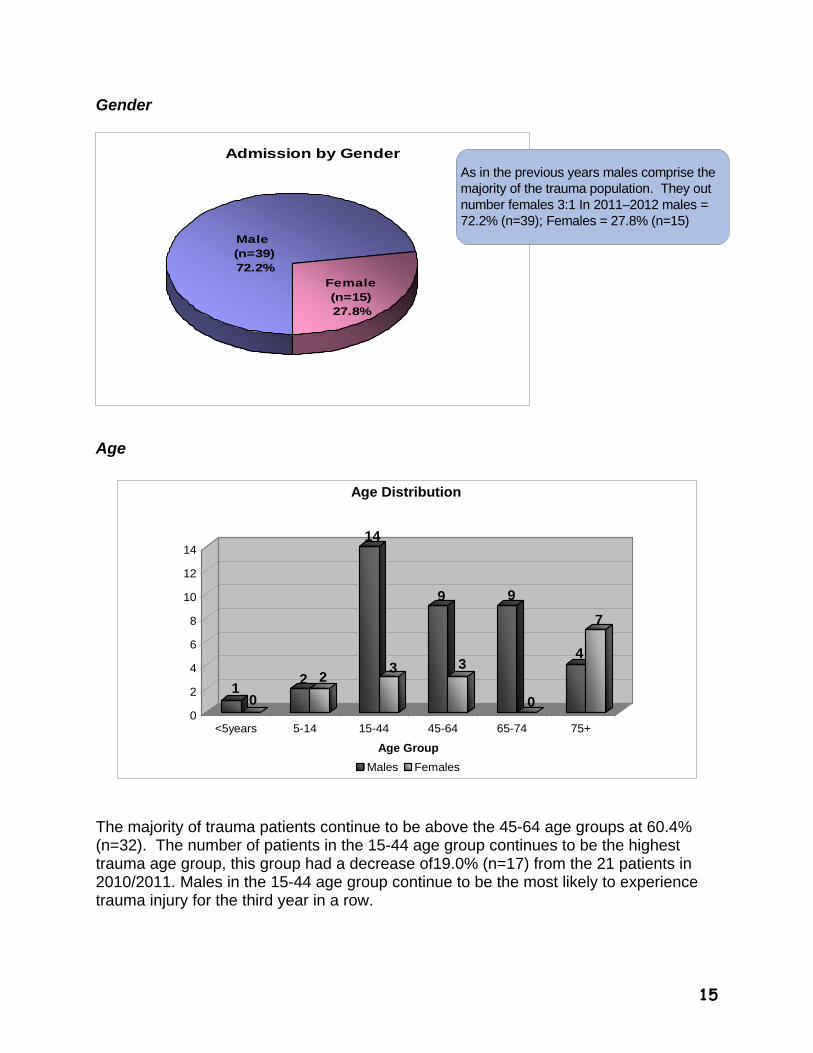
The majority of trauma patients continue to be above the 45-64 age groups at 60.4% (n=32). The number of patients in the 15-44 age group continues to be the highest trauma age group, this group had a decrease of19.0% (n=17) from the 21 patients in 2010/2011. Males in the 15-44 age group continue to be the most likely to experience trauma injury for the third year in a row.
As in the previous years males comprise the majority of the trauma population. They out number females 3:1 In 2011–2012 males = 72.2% (n=39); Females = 27.8% (n=15)
16
4
7
2
3
2
7
8
7
5
7
5
6 6
7
6
554 4
5
6
4
33 3
2
3 3
2
3
5
2
4
1
8
5
0
1
2
3
4
5
6
7
8
APRIL MAY JUNE JULY AUG SEPT OCT NOV DEC JAN FEB MAR
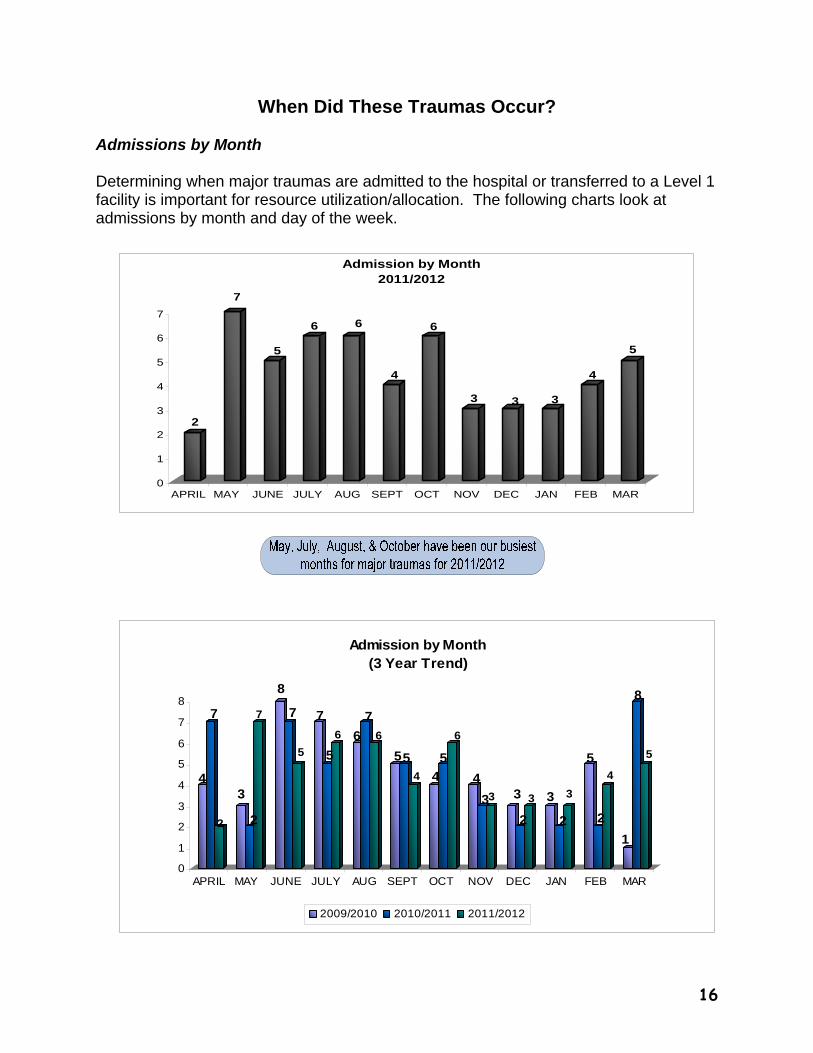
Admission by Month (3 Year Trend)
2009/2010 2010/2011 2011/2012
When Did These Traumas Occur?
Admissions by Month Determining when major traumas are admitted to the hospital or transferred to a Level 1 facility is important for resource utilization/allocation. The following charts look at admissions by month and day of the week.
2
7
5
6 6
4
6
3 3 3
4
5
0
1
2
3
4
5
6
7
APRIL MAY JUNE JULY AUG SEPT OCT NOV DEC JAN FEB MAR
Admission by Month2011/2012
17
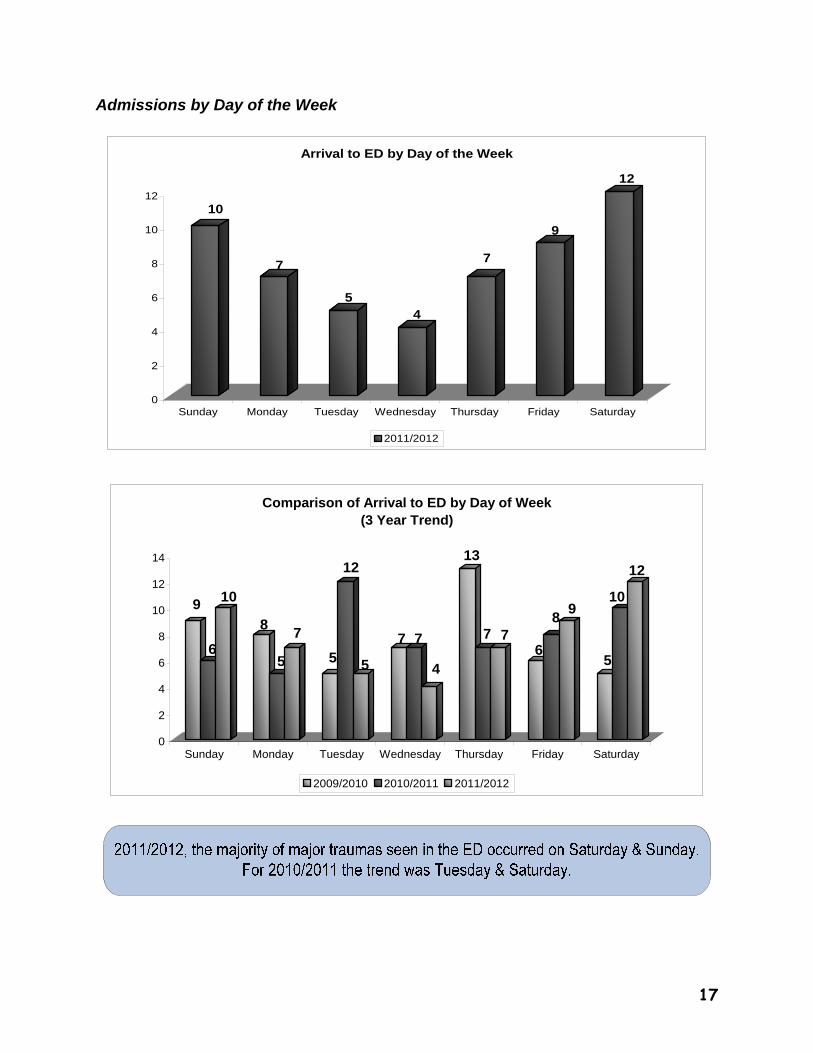
Admissions by Day of the Week
10
7
54
7
9
12
0
2
4
6
8
10
12
Sunday Monday Tuesday Wednesday Thursday Friday Saturday
Arrival to ED by Day of the Week
2011/2012
9
6
10
8
5
7
5
12
5
7 7
4
13
7 76
89
5
10
12
0
2
4
6
8
10
12
14
Sunday Monday Tuesday Wednesday Thursday Friday Saturday
Comparison of Arrival to ED by Day of Week(3 Year Trend)
2009/2010 2010/2011 2011/2012
18
2523
6
0
5
10
15
20
25
1st Shift (0700-1459)
2nd shift(1500-2259)
3rd Shift(2300-0659)
Time of Shift
ED Arrival by Shifts
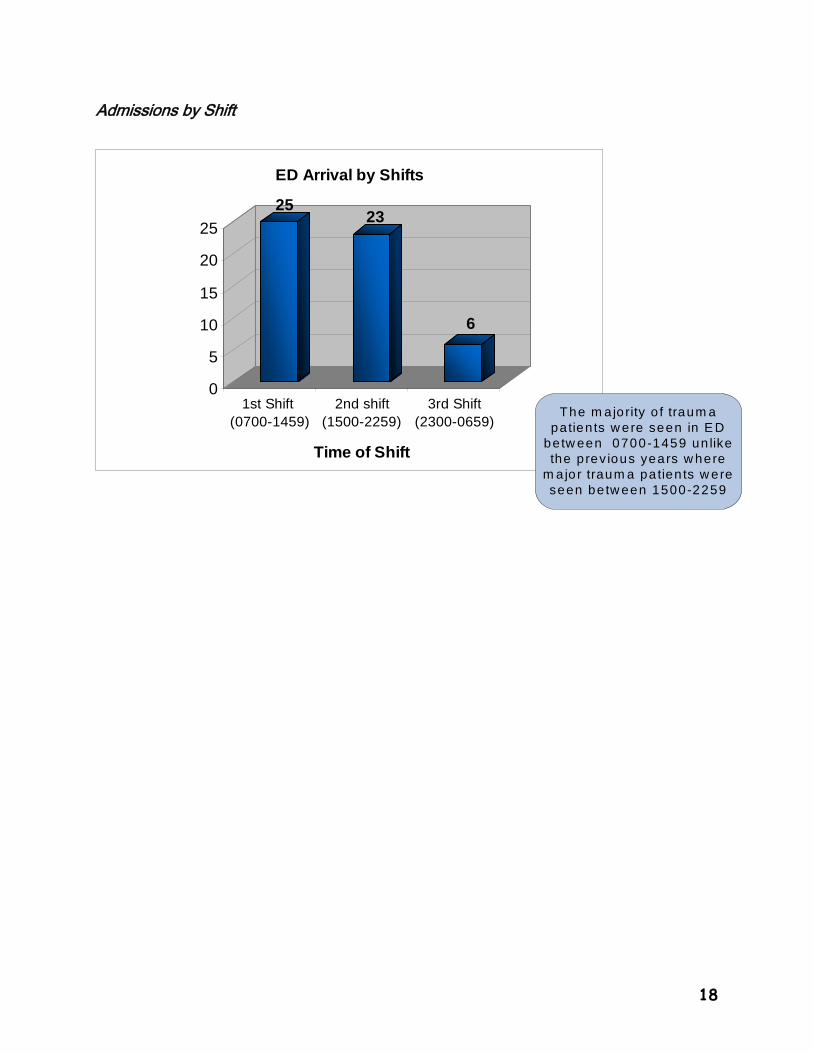
Admissions by Shift
The m ajority o f traum a patients w ere seen in E D
betw een 0700-1459 un like the p rev ious years w here
m a jor traum a pa tien ts w ere seen be tw een 1500-2259
19
How Did These Injuries Occur?
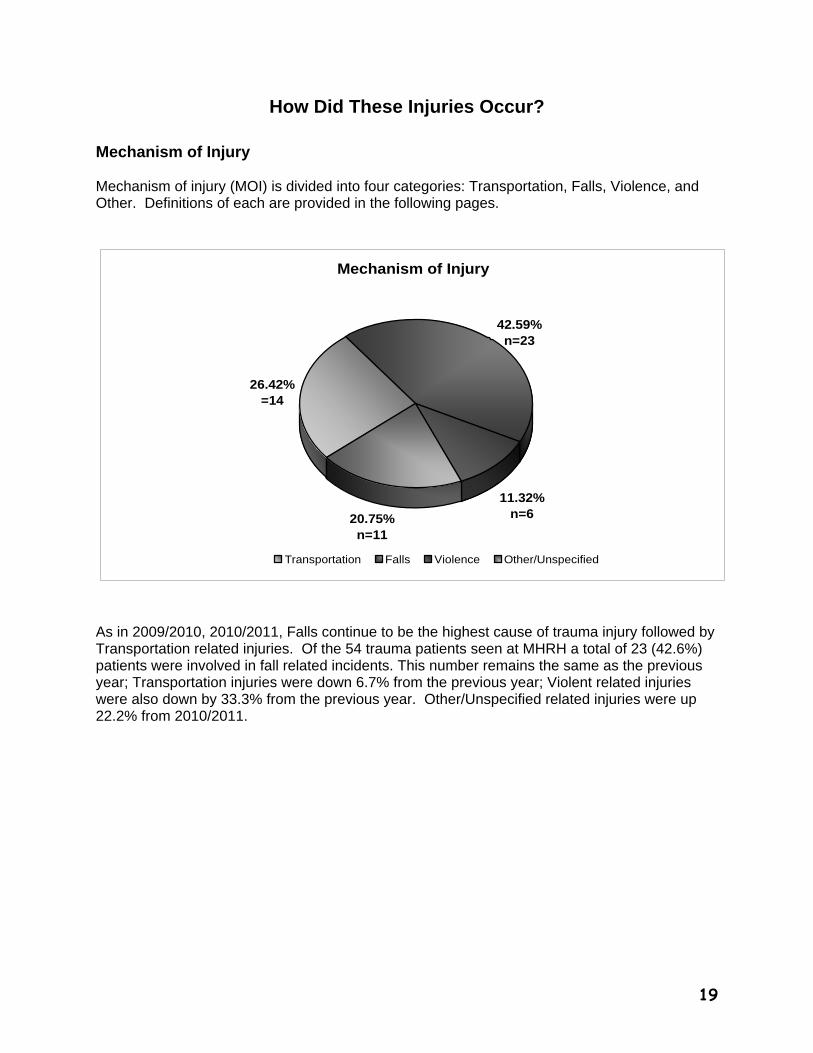
Mechanism of Injury Mechanism of injury (MOI) is divided into four categories: Transportation, Falls, Violence, and Other. Definitions of each are provided in the following pages.
Mechanism of Injury
26.42%=14
20.75%n=11
11.32% n=6
42.59%n=23
Transportation Falls Violence Other/Unspecified
As in 2009/2010, 2010/2011, Falls continue to be the highest cause of trauma injury followed by Transportation related injuries. Of the 54 trauma patients seen at MHRH a total of 23 (42.6%) patients were involved in fall related incidents. This number remains the same as the previous year; Transportation injuries were down 6.7% from the previous year; Violent related injuries were also down by 33.3% from the previous year. Other/Unspecified related injuries were up 22.2% from 2010/2011.
20
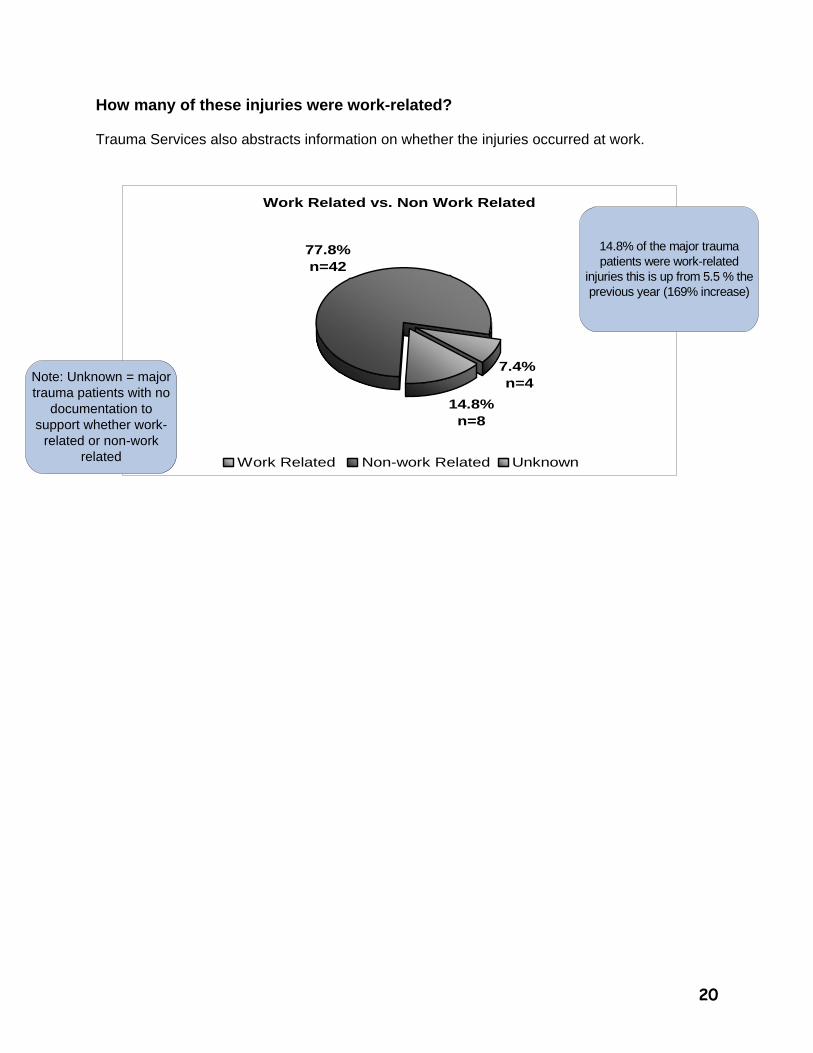
How many of these injuries were work-related? Trauma Services also abstracts information on whether the injuries occurred at work.
Work Related vs. Non Work Related
14.8%n=8
77.8%n=42
7.4% n=4
Work Related Non-work Related Unknown
14.8% of the major trauma patients were work-related
injuries this is up from 5.5 % the previous year (169% increase)
Note: Unknown = major trauma patients with no
documentation to support whether work-
related or non-work related
21
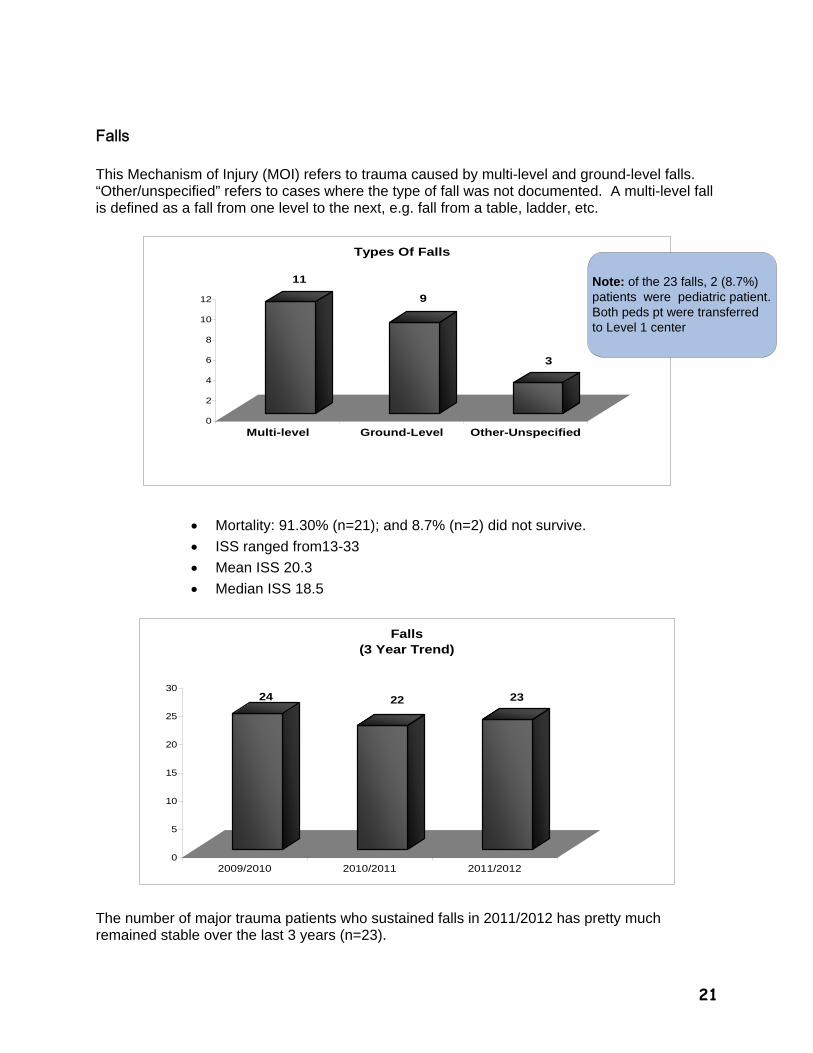
Falls This Mechanism of Injury (MOI) refers to trauma caused by multi-level and ground-level falls. “Other/unspecified” refers to cases where the type of fall was not documented. A multi-level fall is defined as a fall from one level to the next, e.g. fall from a table, ladder, etc.
11
9
3
0
2
4
6
8
10
12
Multi-level Ground-Level Other-Unspecified
Types Of Falls
Mortality: 91.30% (n=21); and 8.7% (n=2) did not survive.
ISS ranged from13-33
Mean ISS 20.3
Median ISS 18.5
24 22 23
0
5
10
15
20
25
30
2009/2010 2010/2011 2011/2012
Falls (3 Year Trend)
The number of major trauma patients who sustained falls in 2011/2012 has pretty much remained stable over the last 3 years (n=23).
Note: of the 23 falls, 2 (8.7%) patients were pediatric patient. Both peds pt were transferred to Level 1 center
22
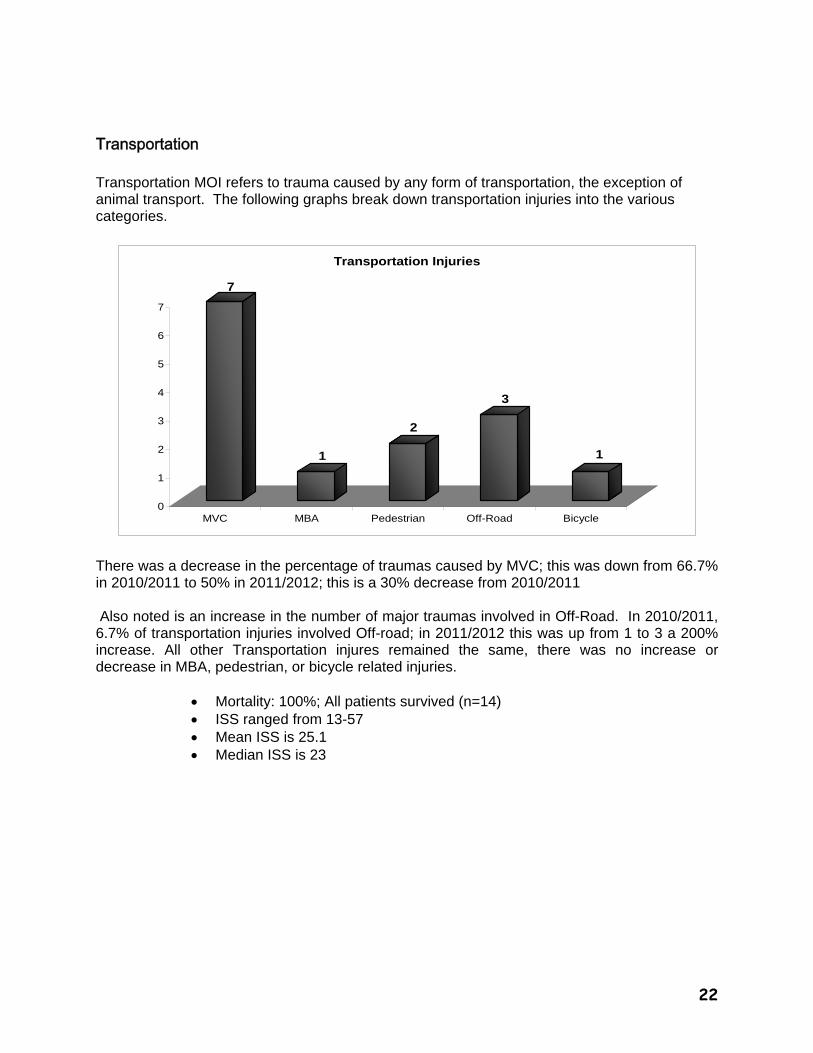
Transportation Transportation MOI refers to trauma caused by any form of transportation, the exception of animal transport. The following graphs break down transportation injuries into the various categories.
7
1
2
3
1
0
1
2
3
4
5
6
7
MVC MBA Pedestrian Off-Road Bicycle
Transportation Injuries
There was a decrease in the percentage of traumas caused by MVC; this was down from 66.7% in 2010/2011 to 50% in 2011/2012; this is a 30% decrease from 2010/2011 Also noted is an increase in the number of major traumas involved in Off-Road. In 2010/2011, 6.7% of transportation injuries involved Off-road; in 2011/2012 this was up from 1 to 3 a 200% increase. All other Transportation injures remained the same, there was no increase or decrease in MBA, pedestrian, or bicycle related injuries.
Mortality: 100%; All patients survived (n=14) ISS ranged from 13-57 Mean ISS is 25.1 Median ISS is 23
23
2009/2010 2010/2011 2011/2012
17
1514
0
2
4
6
8
10
12
14
16
18
Transportation Injuries (3 Year Trend)
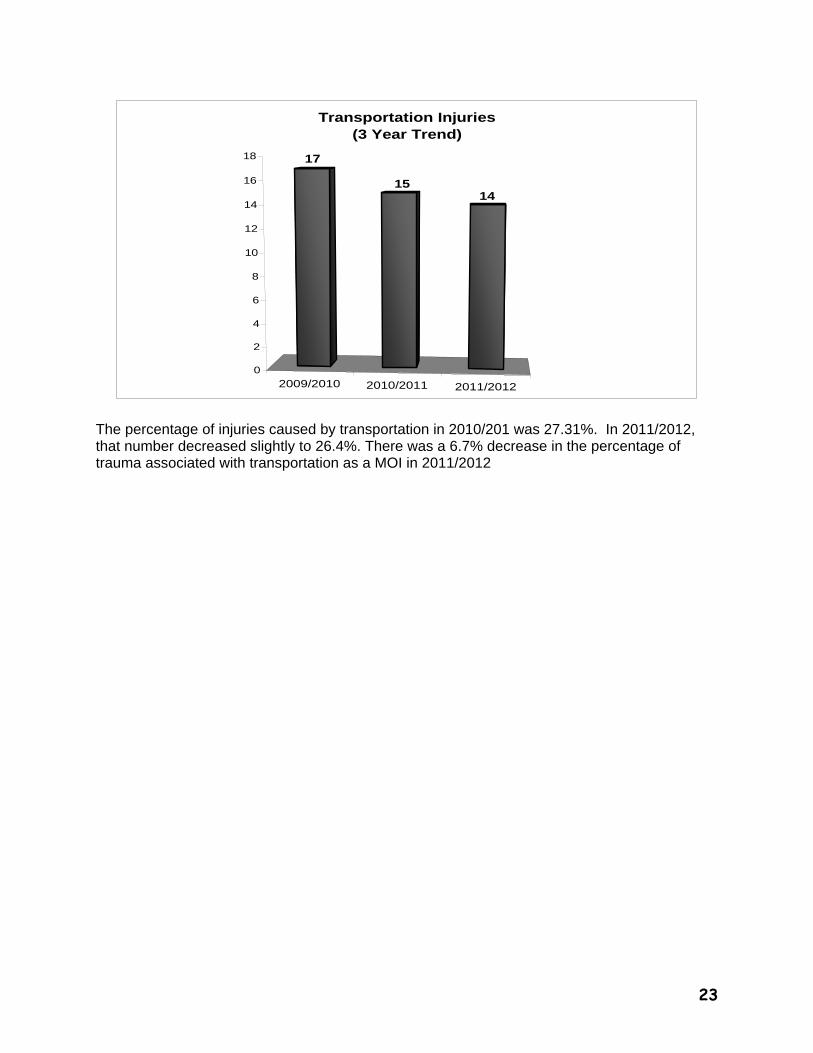
The percentage of injuries caused by transportation in 2010/201 was 27.31%. In 2011/2012, that number decreased slightly to 26.4%. There was a 6.7% decrease in the percentage of trauma associated with transportation as a MOI in 2011/2012
24
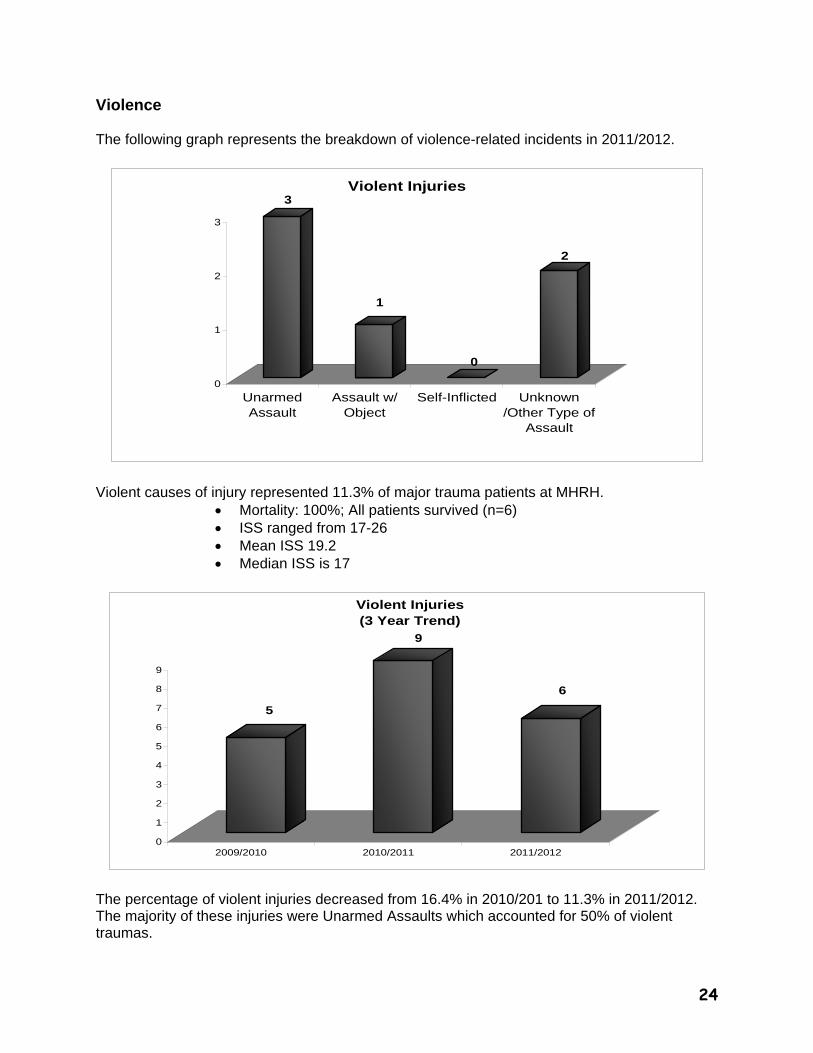
Violence The following graph represents the breakdown of violence-related incidents in 2011/2012.
3
1
0
2
0
1
2
3
UnarmedAssault
Assault w/Object
Self-Inflicted Unknown/Other Type of
Assault
Violent Injuries
Violent causes of injury represented 11.3% of major trauma patients at MHRH.
Mortality: 100%; All patients survived (n=6) ISS ranged from 17-26 Mean ISS 19.2 Median ISS is 17
5
9
6
0
1
2
3
4
5
6
7
8
9
2009/2010 2010/2011 2011/2012
Violent Injuries (3 Year Trend)
The percentage of violent injuries decreased from 16.4% in 2010/201 to 11.3% in 2011/2012. The majority of these injuries were Unarmed Assaults which accounted for 50% of violent traumas.
25
7
9
11
0
2
4
6
8
10
12
2009/2010 2010/2011 2011/2012
Other Injuries (3 Year Trend)
Other MOI
2
5
0
4
0
0.5
1
1.5
2
2.5
3
3.5
4
4.5
5
Mechanical Animal Struck byFalling Object
Other &unspecified
Other MOI
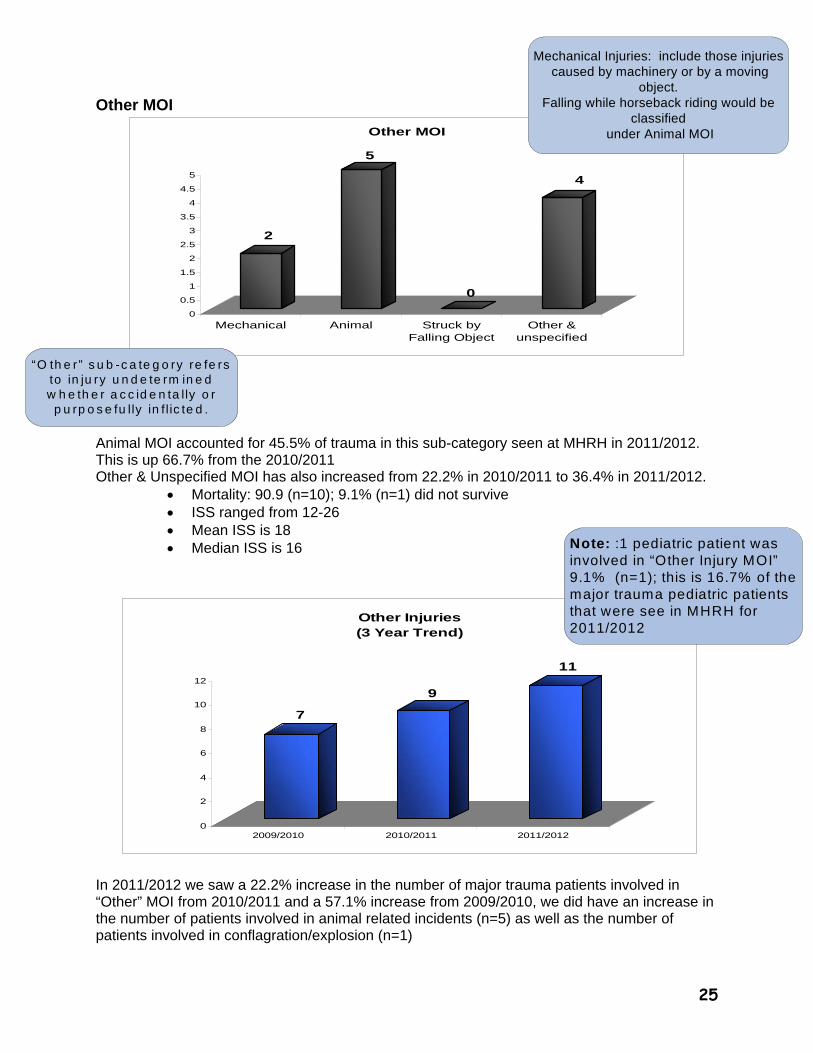
Animal MOI accounted for 45.5% of trauma in this sub-category seen at MHRH in 2011/2012. This is up 66.7% from the 2010/2011 Other & Unspecified MOI has also increased from 22.2% in 2010/2011 to 36.4% in 2011/2012.
Mortality: 90.9 (n=10); 9.1% (n=1) did not survive ISS ranged from 12-26 Mean ISS is 18 Median ISS is 16
In 2011/2012 we saw a 22.2% increase in the number of major trauma patients involved in “Other” MOI from 2010/2011 and a 57.1% increase from 2009/2010, we did have an increase in the number of patients involved in animal related incidents (n=5) as well as the number of patients involved in conflagration/explosion (n=1)
Mechanical Injuries: include those injuries caused by machinery or by a moving
object. Falling while horseback riding would be
classified under Animal MOI
“O th e r” s u b -c a te g o ry re fe rs to in ju ry u n d e te rm in e d w h e th e r a c c id e n ta lly o r
p u rp o s e fu lly in f l ic te d .
Note: :1 pediatric patient was involved in “Other Injury MOI” 9.1% (n=1); this is 16.7% of the major trauma pediatric patients that were see in MHRH for 2011/2012
26
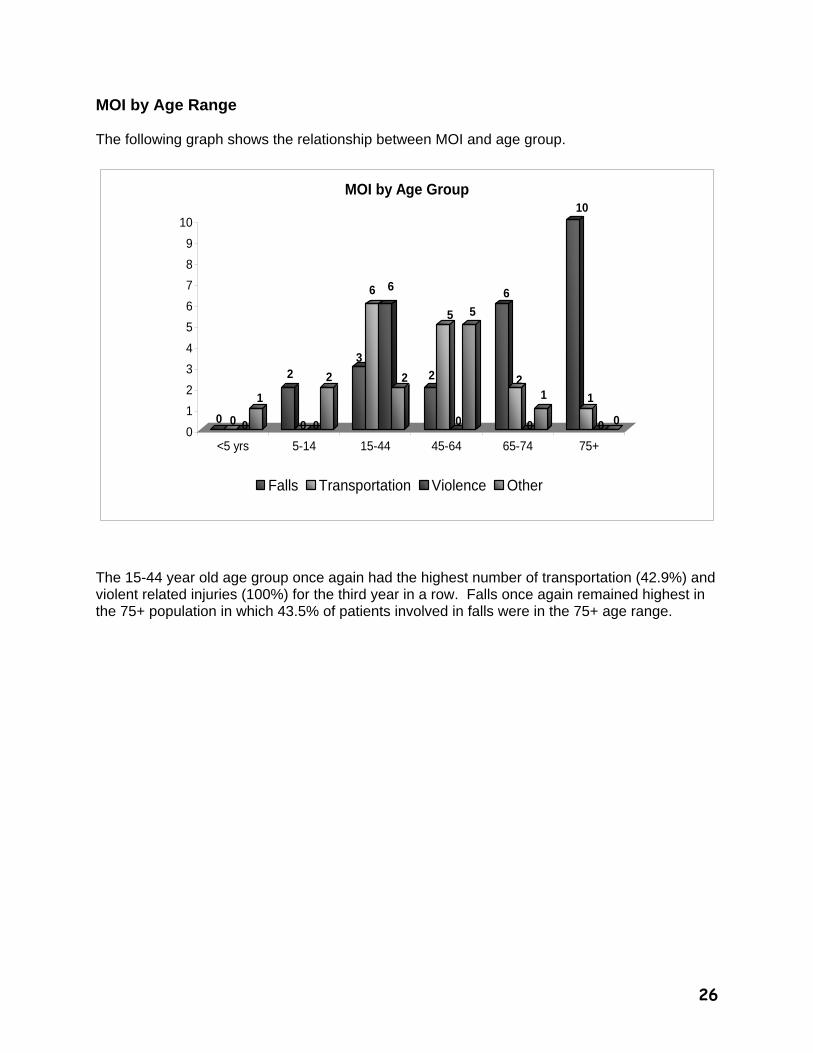
MOI by Age Range The following graph shows the relationship between MOI and age group.
0 0 0
1
2
0 0
2
3
6 6
2 2
5
0
5
6
2
0
1
10
1
0 00
1
2
3
4
5
6
7
8
9
10
<5 yrs 5-14 15-44 45-64 65-74 75+
MOI by Age Group
Falls Transportation Violence Other
The 15-44 year old age group once again had the highest number of transportation (42.9%) and violent related injuries (100%) for the third year in a row. Falls once again remained highest in the 75+ population in which 43.5% of patients involved in falls were in the 75+ age range.
27
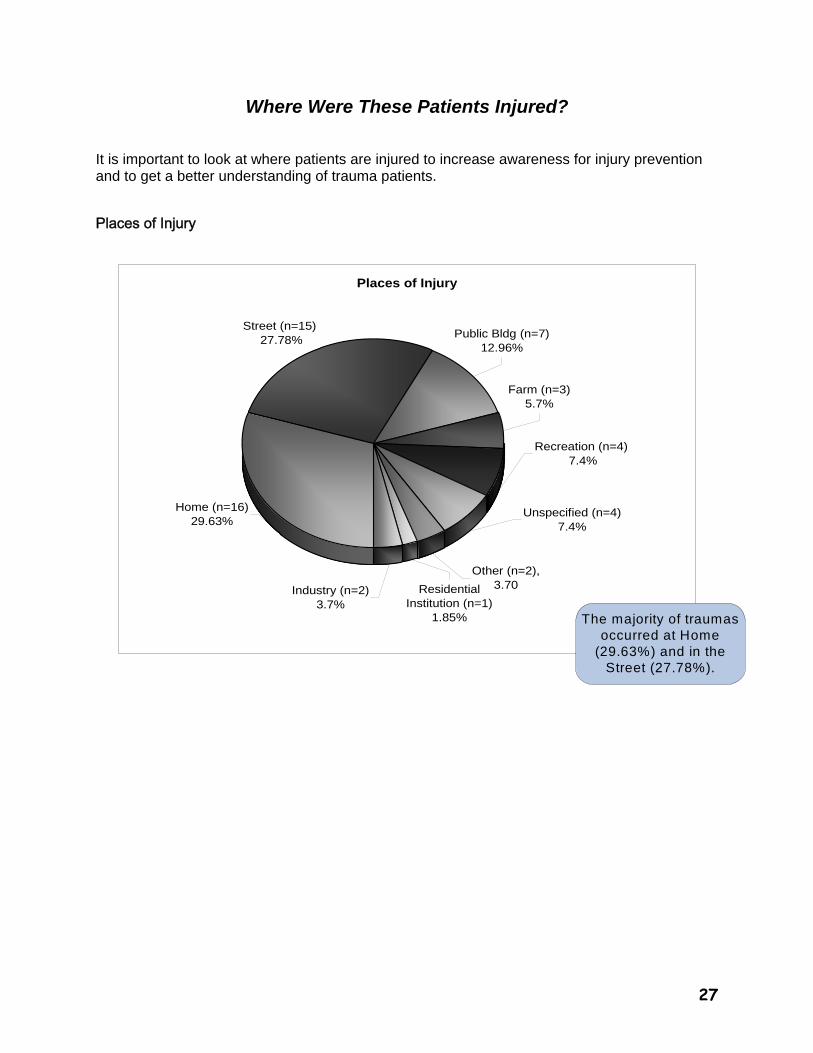
Where Were These Patients Injured? It is important to look at where patients are injured to increase awareness for injury prevention and to get a better understanding of trauma patients.
Places of Injury
Places of Injury
Other (n=2), 3.70
Recreation (n=4) 7.4%
Unspecified (n=4)7.4%
Industry (n=2)3.7%
Residential Institution (n=1)
1.85%
Farm (n=3)5.7%
Public Bldg (n=7) 12.96%
Home (n=16)29.63%
Street (n=15) 27.78%
The majority of traumas occurred at Home
(29.63%) and in the Street (27.78%).
28
What Injuries Did These Patients Sustain?
Type of Injury
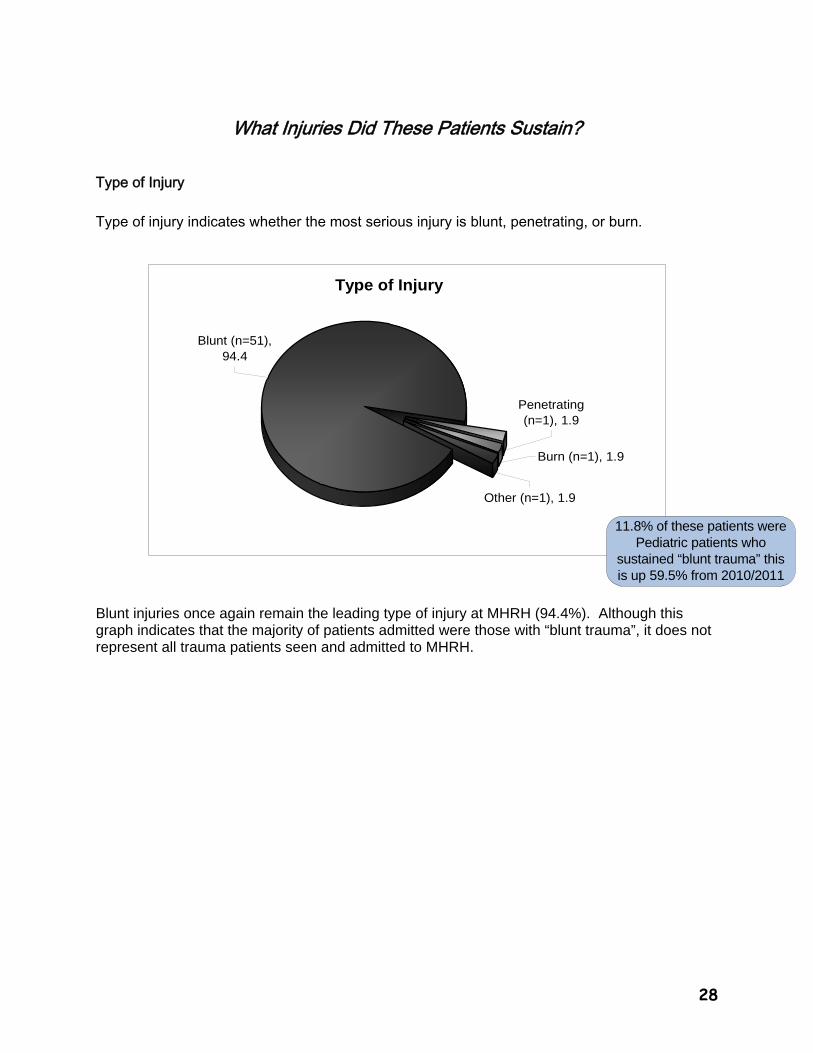
Type of injury indicates whether the most serious injury is blunt, penetrating, or burn.
Type of Injury
Burn (n=1), 1.9
Penetrating (n=1), 1.9
Other (n=1), 1.9
Blunt (n=51), 94.4
Blunt injuries once again remain the leading type of injury at MHRH (94.4%). Although this graph indicates that the majority of patients admitted were those with “blunt trauma”, it does not represent all trauma patients seen and admitted to MHRH.
11.8% of these patients were Pediatric patients who
sustained “blunt trauma” this is up 59.5% from 2010/2011
29
Blunt Injury
51
54
51
49.5
50
50.5
51
51.5
52
52.5
53
53.5
54
2009-2010 2010-2011 2011-2012
Blunt Injury (3 Year Trend)
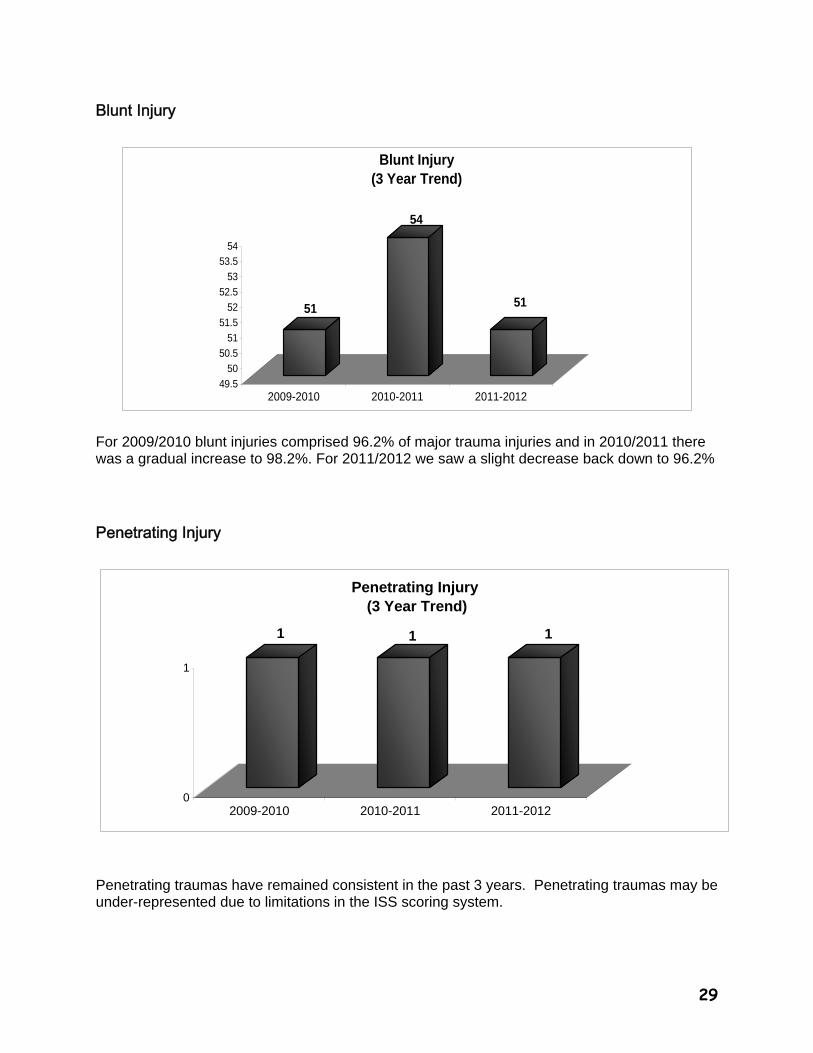
For 2009/2010 blunt injuries comprised 96.2% of major trauma injuries and in 2010/2011 there was a gradual increase to 98.2%. For 2011/2012 we saw a slight decrease back down to 96.2%
Penetrating Injury
1 1 1
0
1
2009-2010 2010-2011 2011-2012
Penetrating Injury (3 Year Trend)
Penetrating traumas have remained consistent in the past 3 years. Penetrating traumas may be under-represented due to limitations in the ISS scoring system.
30
Burn Injury
1
0
1
0
1
2009-2010 2010-2011 2011-2012
Burn Injury(3 Year Trend)
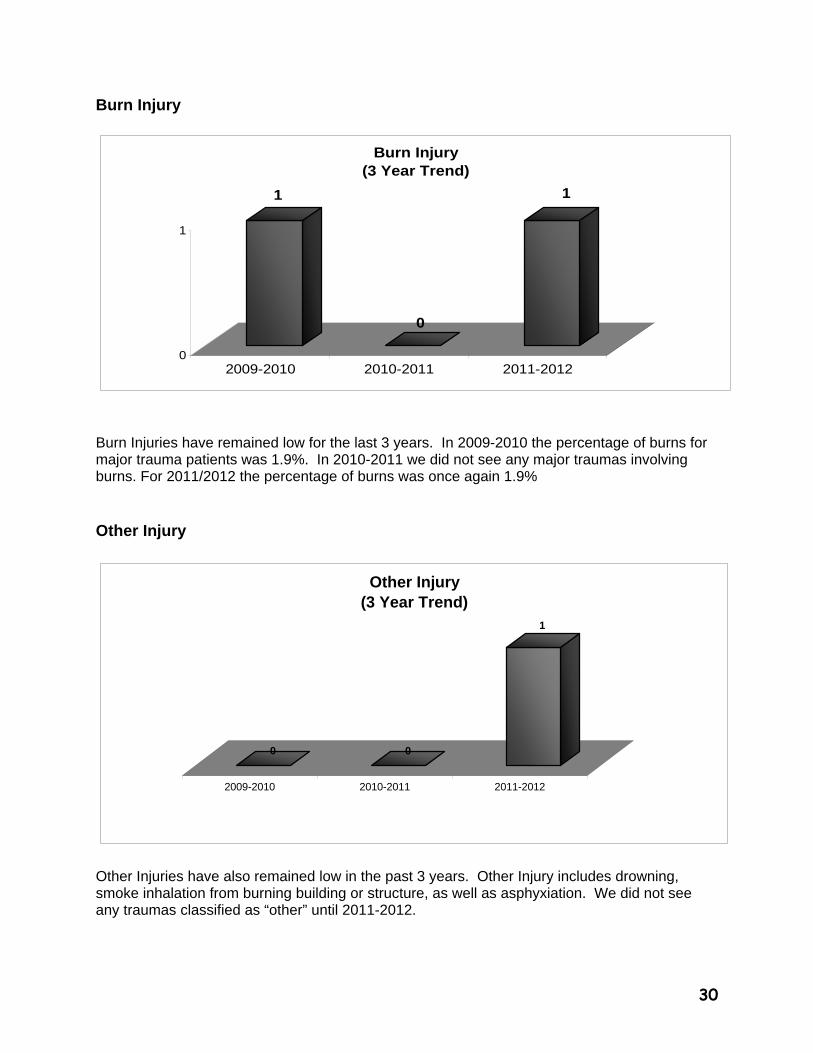
Burn Injuries have remained low for the last 3 years. In 2009-2010 the percentage of burns for major trauma patients was 1.9%. In 2010-2011 we did not see any major traumas involving burns. For 2011/2012 the percentage of burns was once again 1.9% Other Injury
0 0
1
2009-2010 2010-2011 2011-2012
Other Injury (3 Year Trend)
Other Injuries have also remained low in the past 3 years. Other Injury includes drowning, smoke inhalation from burning building or structure, as well as asphyxiation. We did not see any traumas classified as “other” until 2011-2012.
31
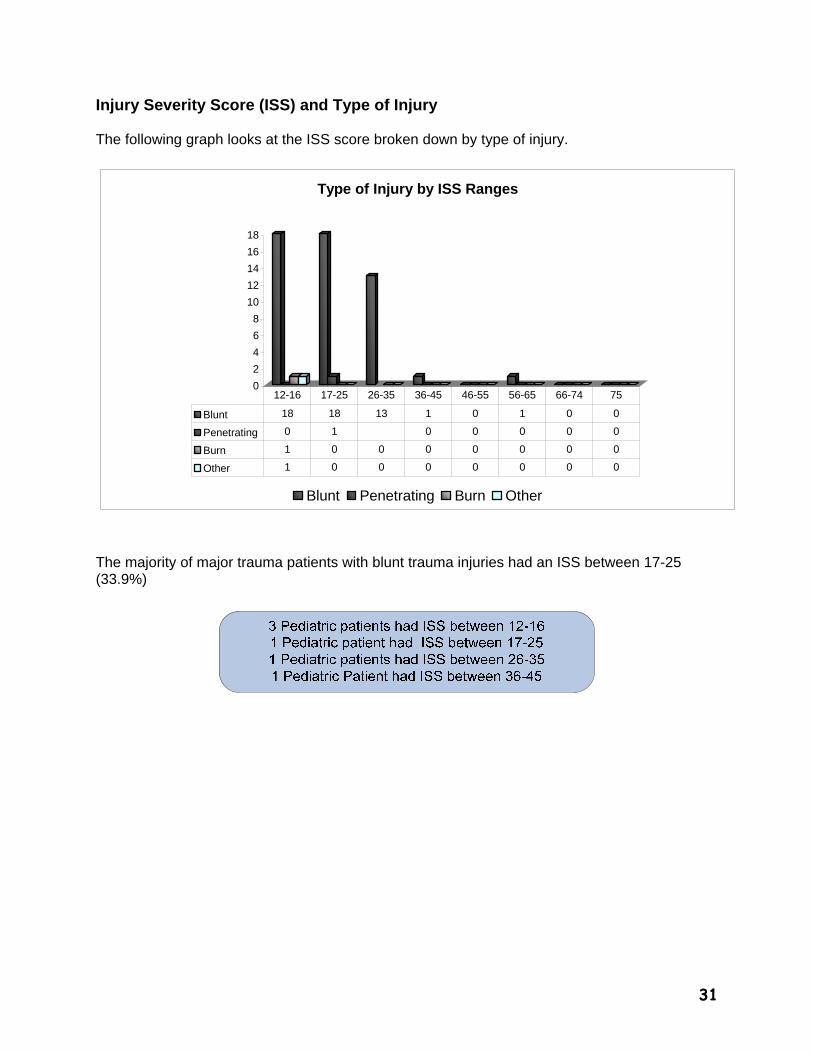
Injury Severity Score (ISS) and Type of Injury The following graph looks at the ISS score broken down by type of injury.
0
2
4
6
8
10
12
14
16
18
Type of Injury by ISS Ranges
Blunt Penetrating Burn Other
Blunt 18 18 13 1 0 1 0 0
Penetrating 0 1 0 0 0 0 0
Burn 1 0 0 0 0 0 0 0
Other 1 0 0 0 0 0 0 0
12-16 17-25 26-35 36-45 46-55 56-65 66-74 75
The majority of major trauma patients with blunt trauma injuries had an ISS between 17-25 (33.9%)
32
What Happened to the Trauma Patients Before They Arrived at MHRH?
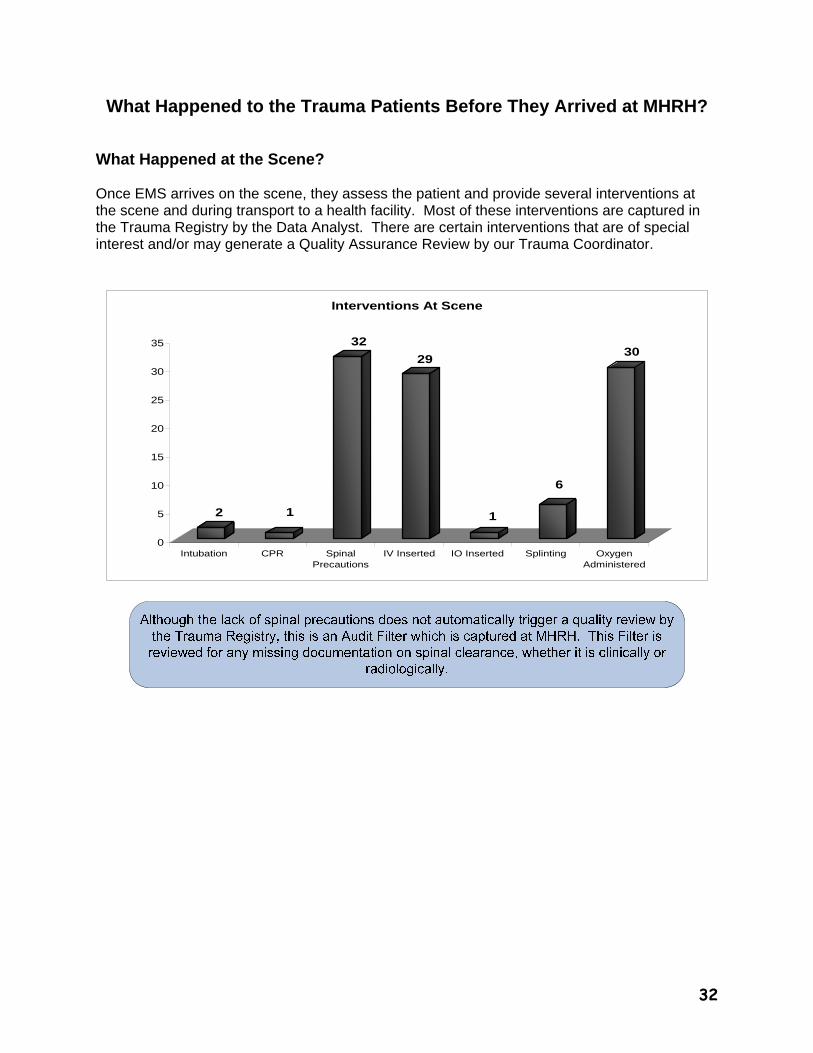
What Happened at the Scene? Once EMS arrives on the scene, they assess the patient and provide several interventions at the scene and during transport to a health facility. Most of these interventions are captured in the Trauma Registry by the Data Analyst. There are certain interventions that are of special interest and/or may generate a Quality Assurance Review by our Trauma Coordinator.
2 1
32
29
1
6
30
0
5
10
15
20
25
30
35
Intubation CPR SpinalPrecautions
IV Inserted IO Inserted Splinting OxygenAdministered
Interventions At Scene
33
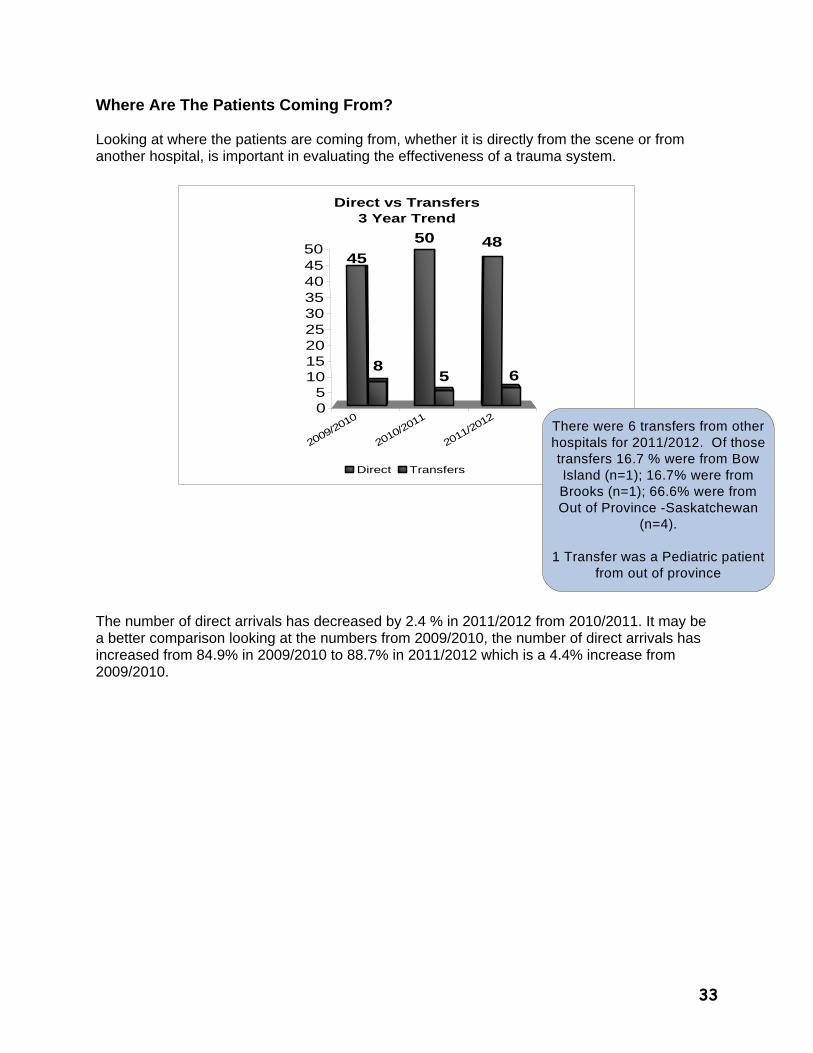
Where Are The Patients Coming From? Looking at where the patients are coming from, whether it is directly from the scene or from another hospital, is important in evaluating the effectiveness of a trauma system.
2009/2010
2010/2011
2011/2012
45
86
4850
5
05
101520253035404550
Direct vs Transfers3 Year Trend
Direct Transfers
The number of direct arrivals has decreased by 2.4 % in 2011/2012 from 2010/2011. It may be a better comparison looking at the numbers from 2009/2010, the number of direct arrivals has increased from 84.9% in 2009/2010 to 88.7% in 2011/2012 which is a 4.4% increase from 2009/2010.
There were 6 transfers from other hospitals for 2011/2012. Of those transfers 16.7 % were from Bow Island (n=1); 16.7% were from Brooks (n=1); 66.6% were from Out of Province -Saskatchewan
(n=4).
1 Transfer was a Pediatric patient from out of province
34
2
6
2
3 3
2
1
0
1
2
3
4
5
6
2009-2010 2010-2011 2011-2012
>2 Hours At Rural Hospital
Yes No Unknown
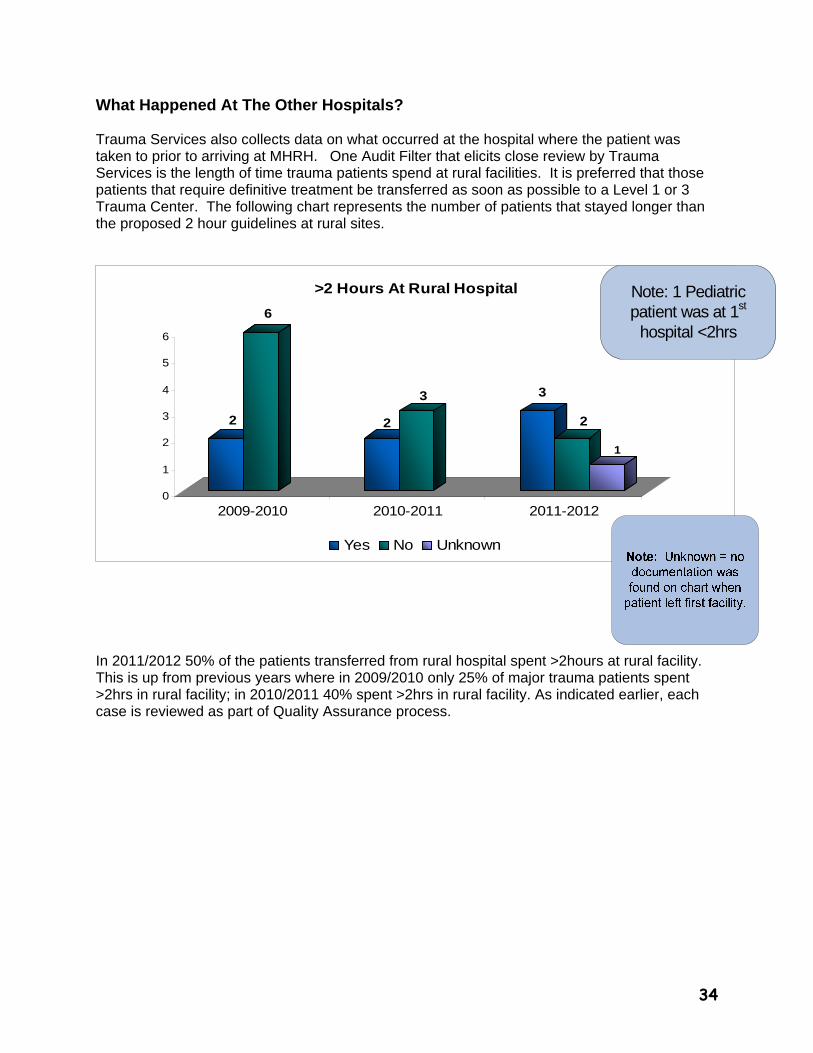
What Happened At The Other Hospitals? Trauma Services also collects data on what occurred at the hospital where the patient was taken to prior to arriving at MHRH. One Audit Filter that elicits close review by Trauma Services is the length of time trauma patients spend at rural facilities. It is preferred that those patients that require definitive treatment be transferred as soon as possible to a Level 1 or 3 Trauma Center. The following chart represents the number of patients that stayed longer than the proposed 2 hour guidelines at rural sites.
In 2011/2012 50% of the patients transferred from rural hospital spent >2hours at rural facility. This is up from previous years where in 2009/2010 only 25% of major trauma patients spent >2hrs in rural facility; in 2010/2011 40% spent >2hrs in rural facility. As indicated earlier, each case is reviewed as part of Quality Assurance process.
Note: 1 Pediatric patient was at 1st
hospital <2hrs
35
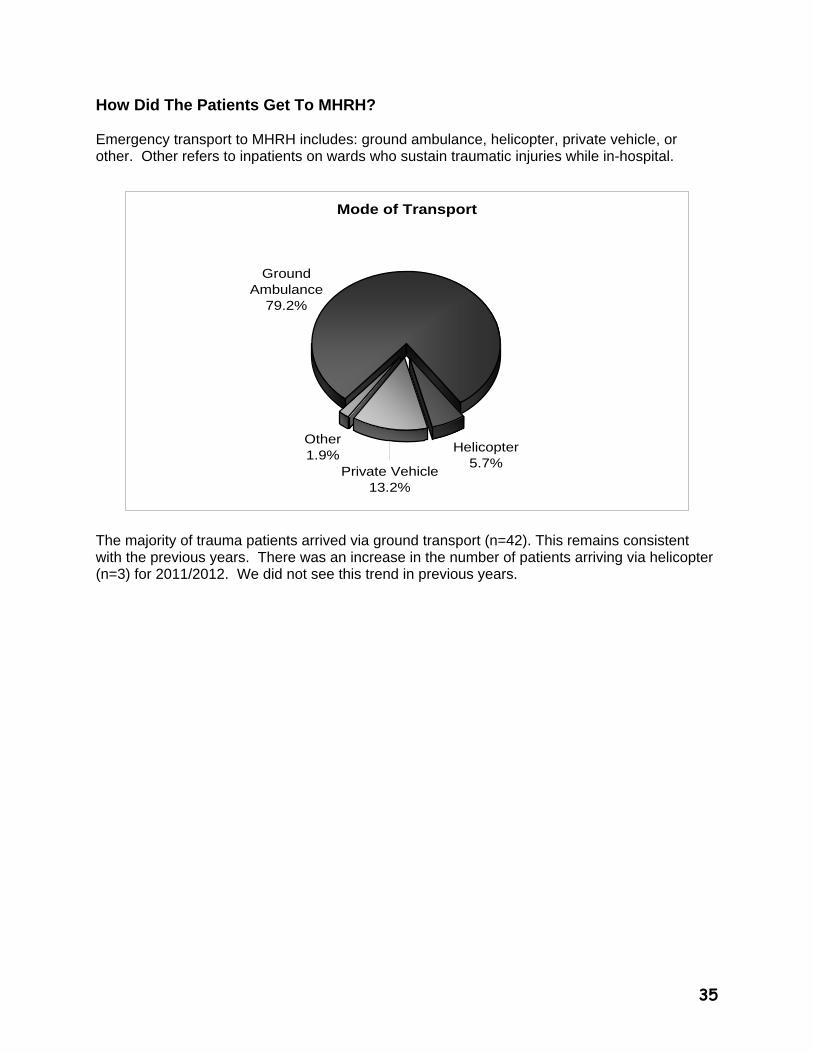
How Did The Patients Get To MHRH? Emergency transport to MHRH includes: ground ambulance, helicopter, private vehicle, or other. Other refers to inpatients on wards who sustain traumatic injuries while in-hospital.
Mode of Transport
Ground Ambulance
79.2%
Other1.9%
Private Vehicle13.2%
Helicopter5.7%
The majority of trauma patients arrived via ground transport (n=42). This remains consistent with the previous years. There was an increase in the number of patients arriving via helicopter (n=3) for 2011/2012. We did not see this trend in previous years.
36
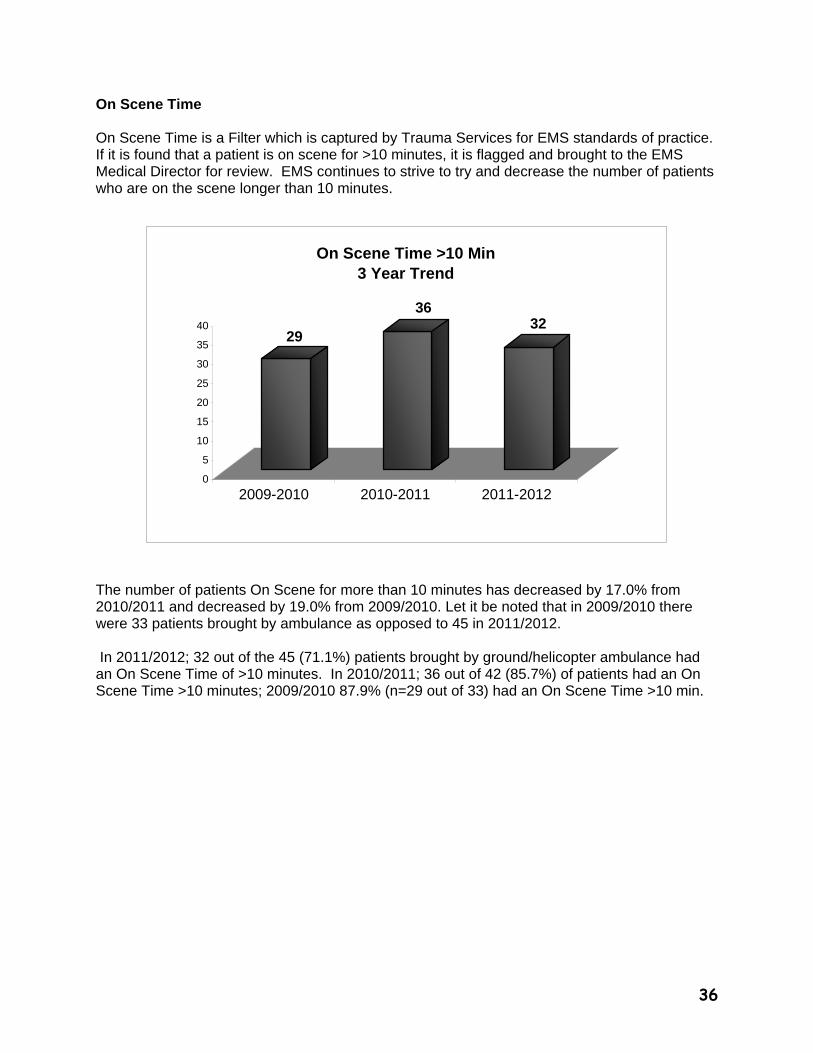
On Scene Time On Scene Time is a Filter which is captured by Trauma Services for EMS standards of practice. If it is found that a patient is on scene for >10 minutes, it is flagged and brought to the EMS Medical Director for review. EMS continues to strive to try and decrease the number of patients who are on the scene longer than 10 minutes.
29
3632
0
5
10
15
20
25
30
35
40
2009-2010 2010-2011 2011-2012
On Scene Time >10 Min3 Year Trend
The number of patients On Scene for more than 10 minutes has decreased by 17.0% from 2010/2011 and decreased by 19.0% from 2009/2010. Let it be noted that in 2009/2010 there were 33 patients brought by ambulance as opposed to 45 in 2011/2012. In 2011/2012; 32 out of the 45 (71.1%) patients brought by ground/helicopter ambulance had an On Scene Time of >10 minutes. In 2010/2011; 36 out of 42 (85.7%) of patients had an On Scene Time >10 minutes; 2009/2010 87.9% (n=29 out of 33) had an On Scene Time >10 min.
37
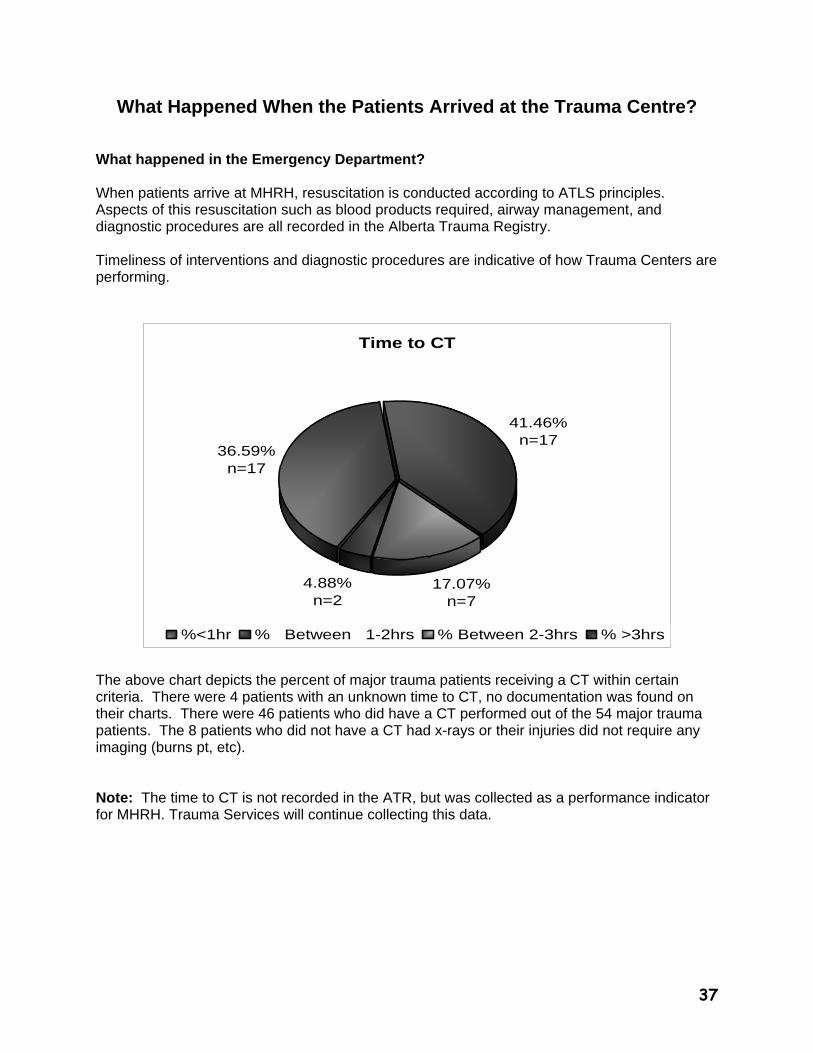
What Happened When the Patients Arrived at the Trauma Centre? What happened in the Emergency Department? When patients arrive at MHRH, resuscitation is conducted according to ATLS principles. Aspects of this resuscitation such as blood products required, airway management, and diagnostic procedures are all recorded in the Alberta Trauma Registry. Timeliness of interventions and diagnostic procedures are indicative of how Trauma Centers are performing.
Time to CT
41.46%n=17
36.59%n=17
4.88%n=2
17.07%n=7
%<1hr % Between 1-2hrs % Between 2-3hrs % >3hrs
The above chart depicts the percent of major trauma patients receiving a CT within certain criteria. There were 4 patients with an unknown time to CT, no documentation was found on their charts. There were 46 patients who did have a CT performed out of the 54 major trauma patients. The 8 patients who did not have a CT had x-rays or their injuries did not require any imaging (burns pt, etc). Note: The time to CT is not recorded in the ATR, but was collected as a performance indicator for MHRH. Trauma Services will continue collecting this data.
38
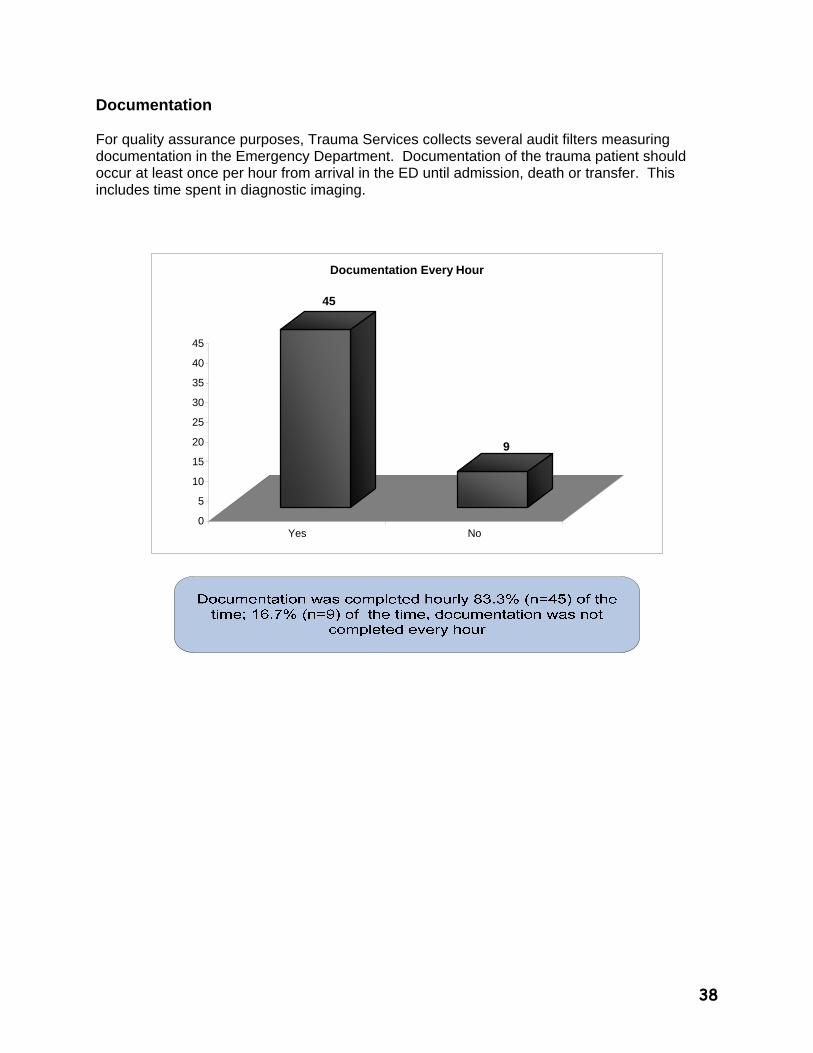
Documentation For quality assurance purposes, Trauma Services collects several audit filters measuring documentation in the Emergency Department. Documentation of the trauma patient should occur at least once per hour from arrival in the ED until admission, death or transfer. This includes time spent in diagnostic imaging.
45
9
0
5
10
15
20
25
30
35
40
45
Yes No
Documentation Every Hour
39
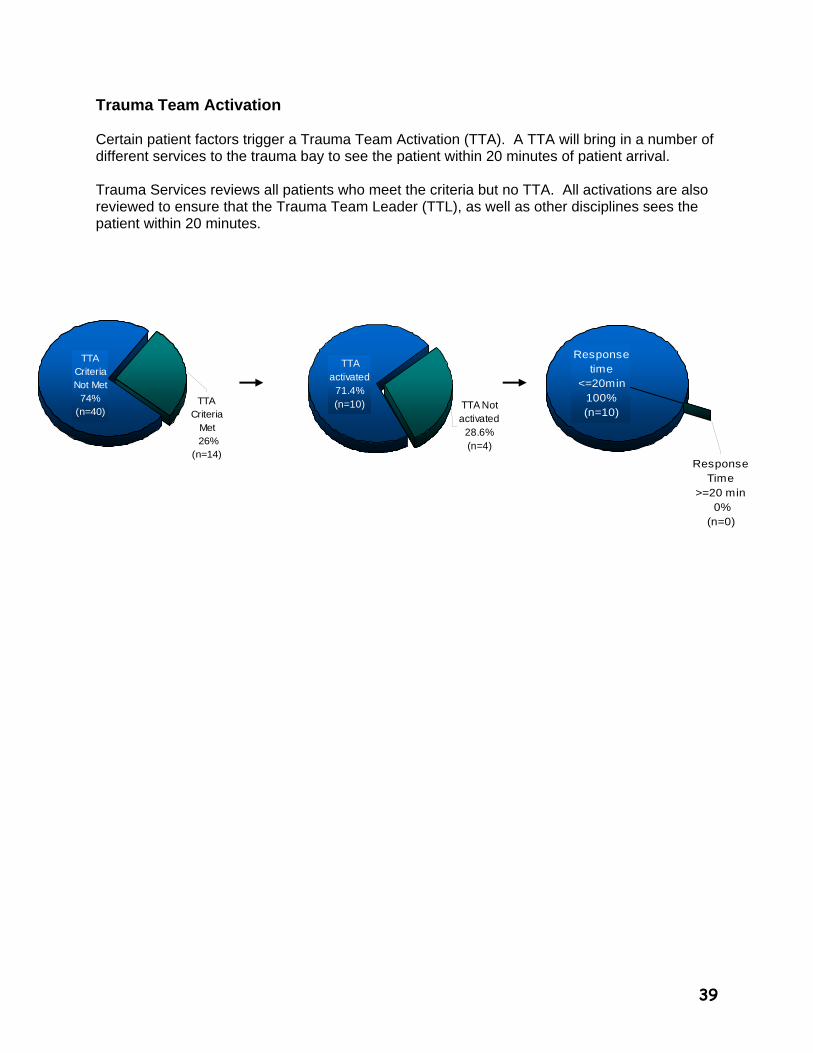
TTA Criteria
Met 26%
(n=14)
TTA Criteria Not Met
74% (n=40)
TTA activated
71.4% (n=10) TTA Not
activated 28.6% (n=4)
Response Time
>=20 min 0%
(n=0)
Response time
<=20min 100% (n=10)
Trauma Team Activation Certain patient factors trigger a Trauma Team Activation (TTA). A TTA will bring in a number of different services to the trauma bay to see the patient within 20 minutes of patient arrival. Trauma Services reviews all patients who meet the criteria but no TTA. All activations are also reviewed to ensure that the Trauma Team Leader (TTL), as well as other disciplines sees the patient within 20 minutes.
40
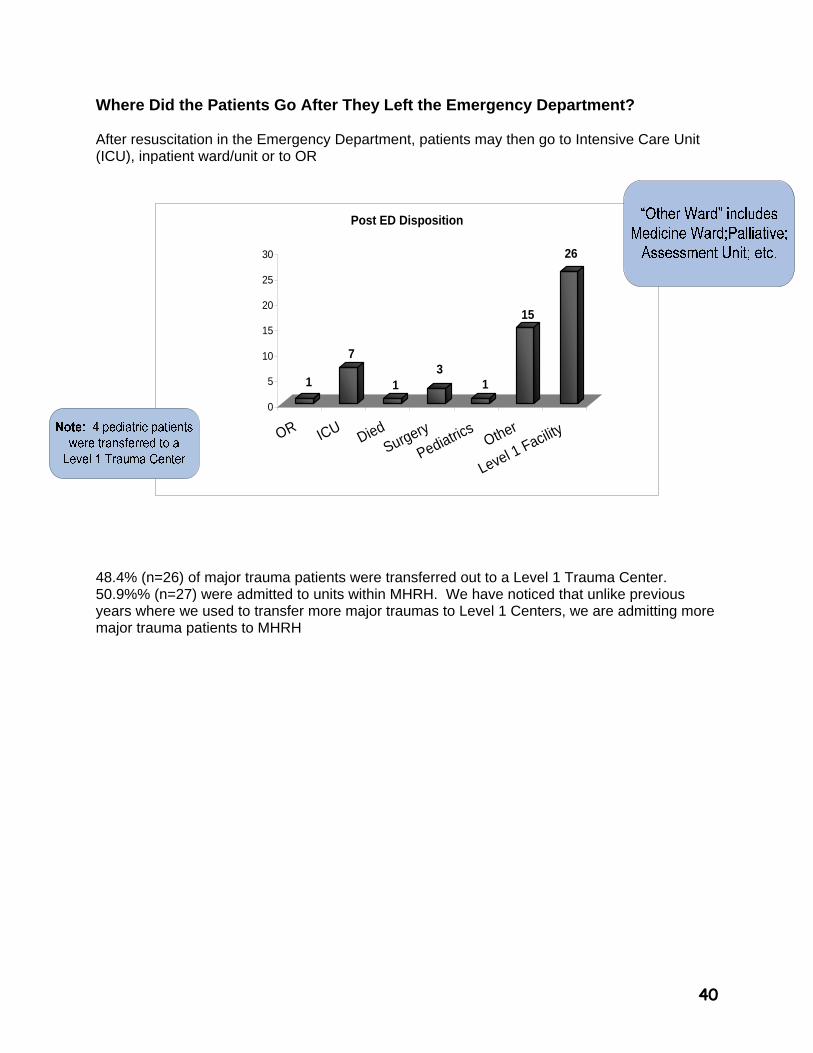
Where Did the Patients Go After They Left the Emergency Department? After resuscitation in the Emergency Department, patients may then go to Intensive Care Unit (ICU), inpatient ward/unit or to OR
1
7
13
1
15
26
0
5
10
15
20
25
30
OR ICUDied
Surgery
Pediatrics
Other
Level 1 Facility
Post ED Disposition
48.4% (n=26) of major trauma patients were transferred out to a Level 1 Trauma Center. 50.9%% (n=27) were admitted to units within MHRH. We have noticed that unlike previous years where we used to transfer more major traumas to Level 1 Centers, we are admitting more major trauma patients to MHRH
41
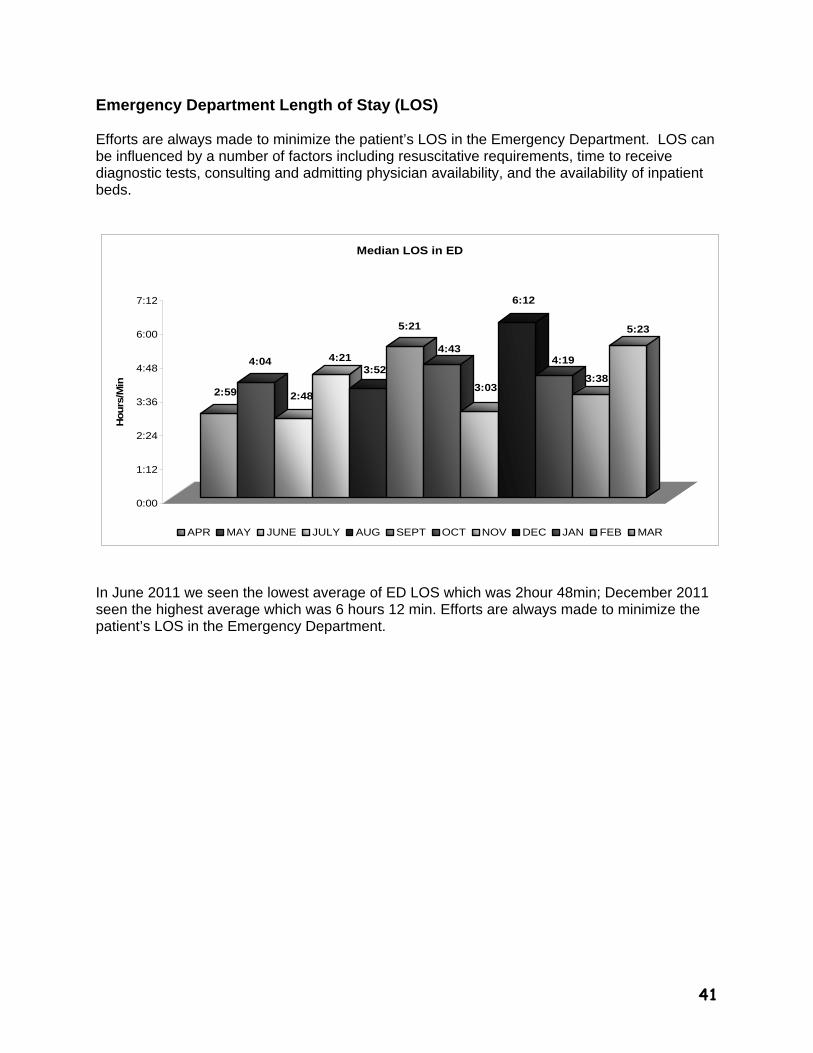
Emergency Department Length of Stay (LOS) Efforts are always made to minimize the patient’s LOS in the Emergency Department. LOS can be influenced by a number of factors including resuscitative requirements, time to receive diagnostic tests, consulting and admitting physician availability, and the availability of inpatient beds.
2:59
4:04
2:48
4:213:52
5:21
4:43
3:03
6:12
4:19
3:38
5:23
0:00
1:12
2:24
3:36
4:48
6:00
7:12
Hours
/Min
Median LOS in ED
APR MAY JUNE JULY AUG SEPT OCT NOV DEC JAN FEB MAR
In June 2011 we seen the lowest average of ED LOS which was 2hour 48min; December 2011 seen the highest average which was 6 hours 12 min. Efforts are always made to minimize the patient’s LOS in the Emergency Department.
42
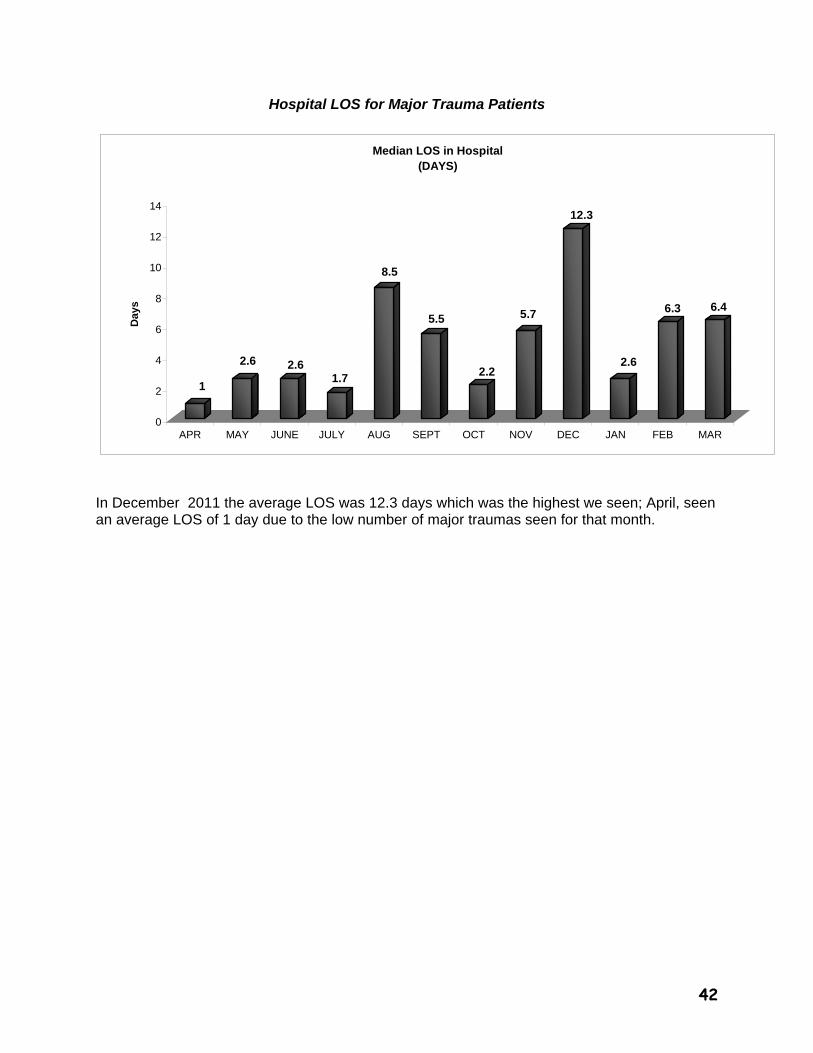
Hospital LOS for Major Trauma Patients
1
2.6 2.61.7
8.5
5.5
2.2
5.7
12.3
2.6
6.3 6.4
0
2
4
6
8
10
12
14
Day
s
APR MAY JUNE JULY AUG SEPT OCT NOV DEC JAN FEB MAR
Median LOS in Hospital(DAYS)
In December 2011 the average LOS was 12.3 days which was the highest we seen; April, seen an average LOS of 1 day due to the low number of major traumas seen for that month.
43
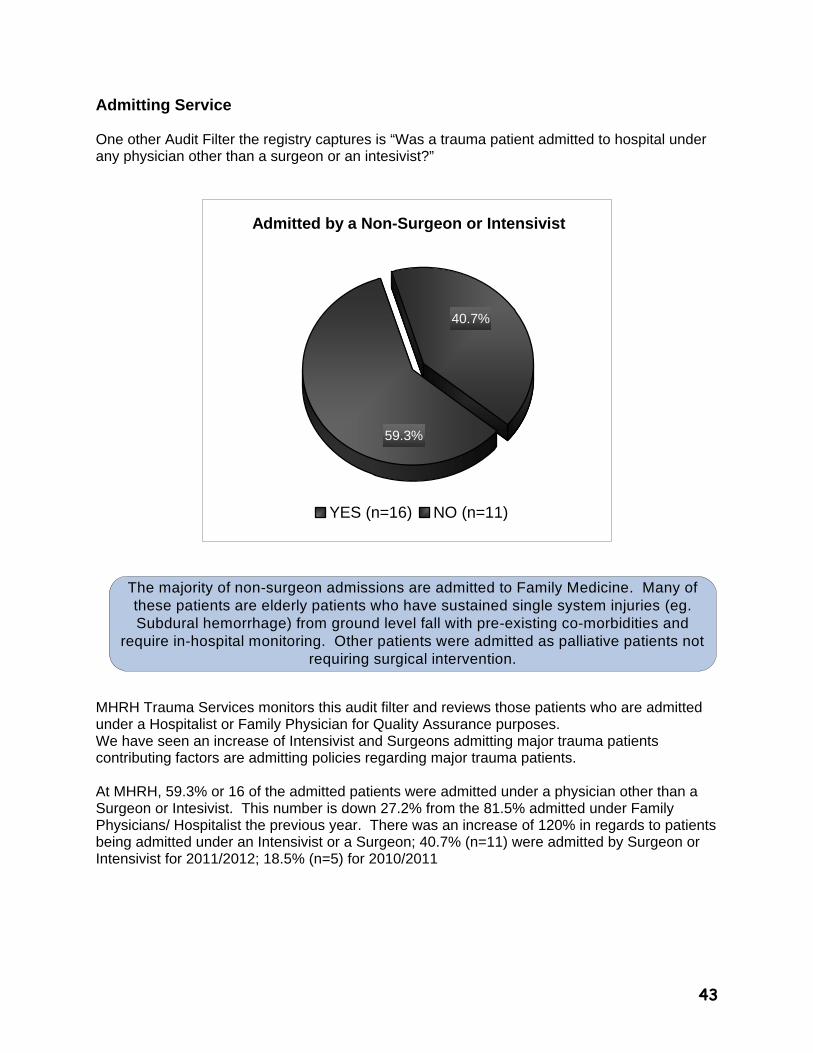
Admitting Service One other Audit Filter the registry captures is “Was a trauma patient admitted to hospital under any physician other than a surgeon or an intesivist?”
Admitted by a Non-Surgeon or Intensivist
59.3%
40.7%
YES (n=16) NO (n=11)
MHRH Trauma Services monitors this audit filter and reviews those patients who are admitted under a Hospitalist or Family Physician for Quality Assurance purposes. We have seen an increase of Intensivist and Surgeons admitting major trauma patients contributing factors are admitting policies regarding major trauma patients. At MHRH, 59.3% or 16 of the admitted patients were admitted under a physician other than a Surgeon or Intesivist. This number is down 27.2% from the 81.5% admitted under Family Physicians/ Hospitalist the previous year. There was an increase of 120% in regards to patients being admitted under an Intensivist or a Surgeon; 40.7% (n=11) were admitted by Surgeon or Intensivist for 2011/2012; 18.5% (n=5) for 2010/2011
The majority of non-surgeon admissions are admitted to Family Medicine. Many of these patients are elderly patients who have sustained single system injuries (eg. Subdural hemorrhage) from ground level fall with pre-existing co-morbidities and
require in-hospital monitoring. Other patients were admitted as palliative patients not requiring surgical intervention.
44
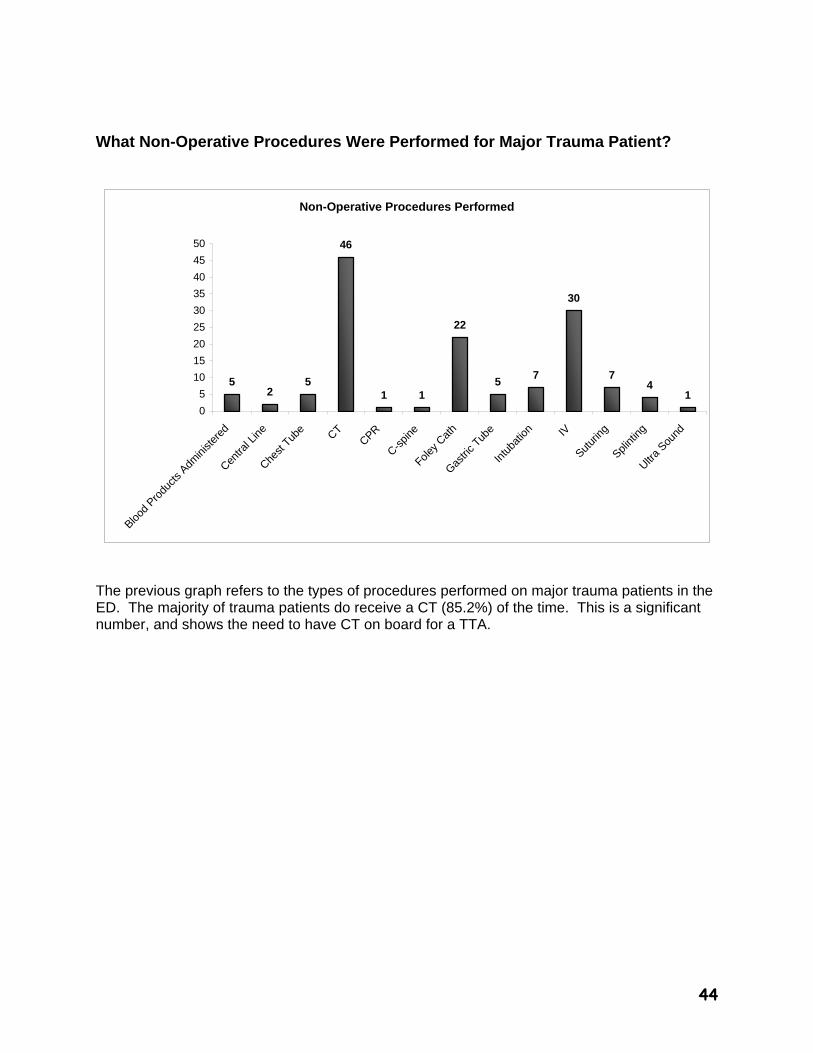
What Non-Operative Procedures Were Performed for Major Trauma Patient?
Non-Operative Procedures Performed
52
5
46
1 1
22
57
30
74
1
0
5
10
15
20
25
30
35
40
45
50
Blood
Produ
cts A
dmini
stere
d
Centra
l Line
Chest
Tube CT
CPR
C-spin
e
Foley C
ath
Gastri
c Tub
e
Intu
batio
n IV
Sutur
ing
Splint
ing
Ultra
Sound
The previous graph refers to the types of procedures performed on major trauma patients in the ED. The majority of trauma patients do receive a CT (85.2%) of the time. This is a significant number, and shows the need to have CT on board for a TTA.
45
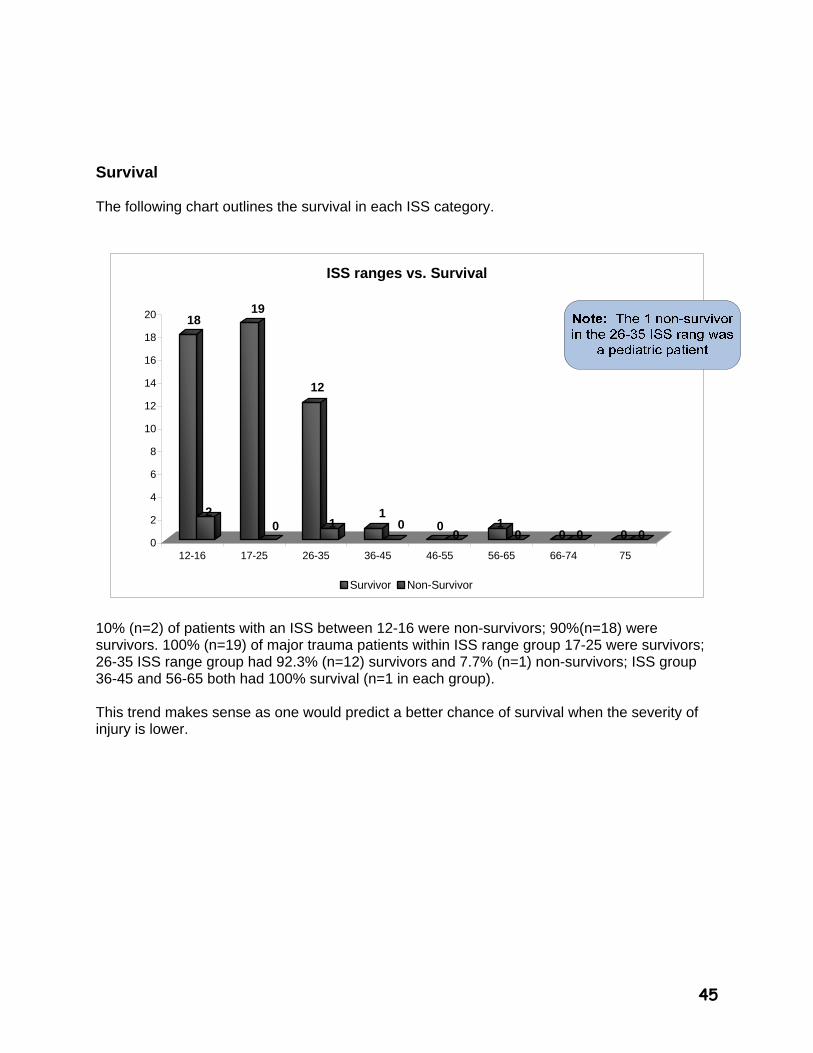
Survival The following chart outlines the survival in each ISS category.
18
2
19
0
12
11
0 00
10 0 0 0 0
0
2
4
6
8
10
12
14
16
18
20
12-16 17-25 26-35 36-45 46-55 56-65 66-74 75
ISS ranges vs. Survival
Survivor Non-Survivor
10% (n=2) of patients with an ISS between 12-16 were non-survivors; 90%(n=18) were survivors. 100% (n=19) of major trauma patients within ISS range group 17-25 were survivors; 26-35 ISS range group had 92.3% (n=12) survivors and 7.7% (n=1) non-survivors; ISS group 36-45 and 56-65 both had 100% survival (n=1 in each group). This trend makes sense as one would predict a better chance of survival when the severity of injury is lower.
46
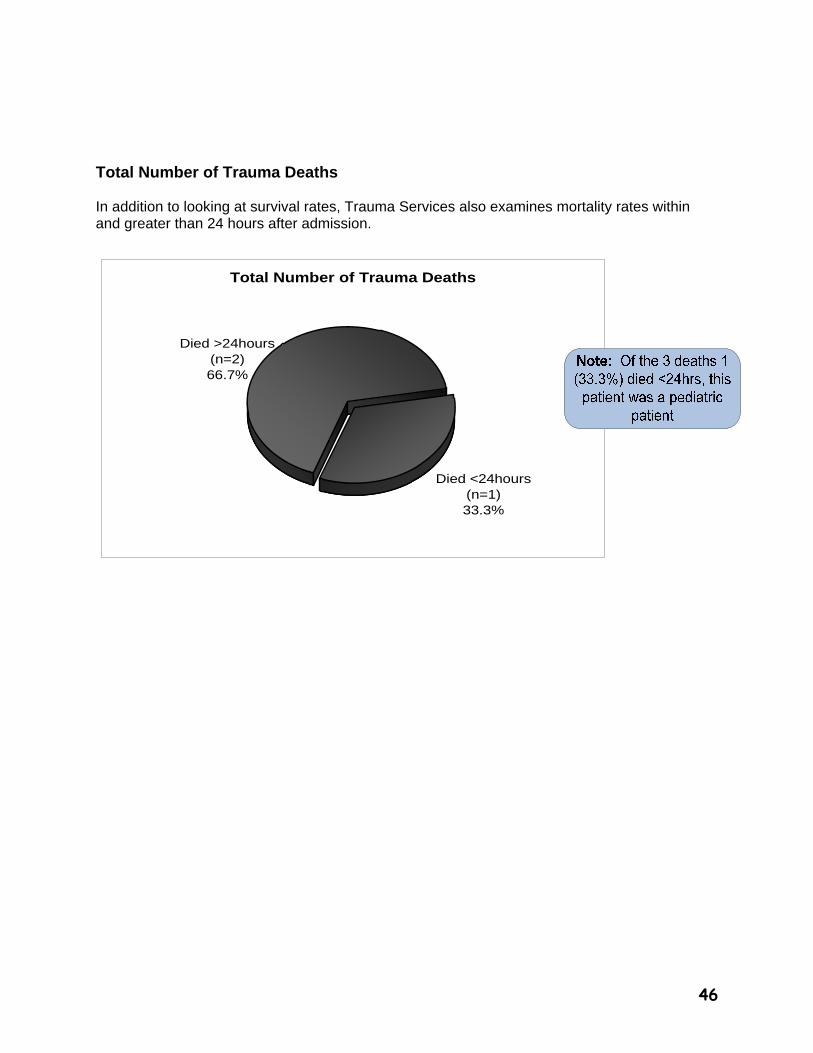
Total Number of Trauma Deaths In addition to looking at survival rates, Trauma Services also examines mortality rates within and greater than 24 hours after admission.
Total Number of Trauma Deaths
Died <24hours(n=1)33.3%
Died >24hours(n=2)66.7%
47
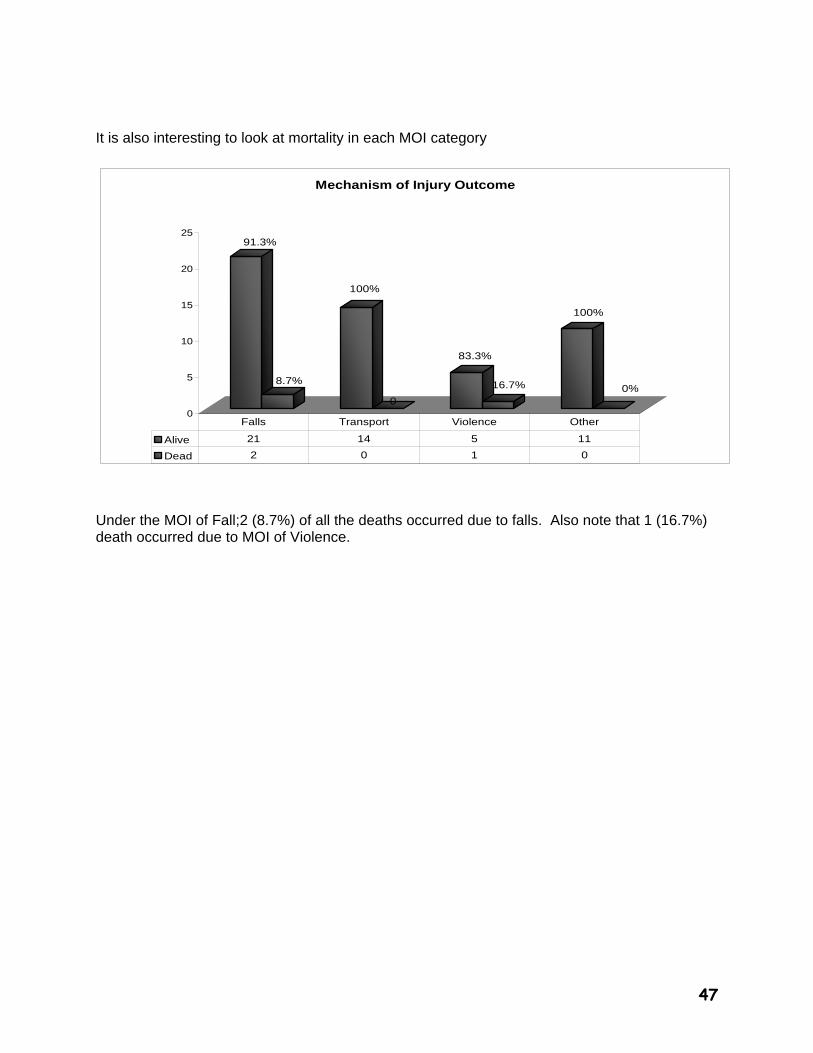
It is also interesting to look at mortality in each MOI category
91.3%
8.7%
100%
0
83.3%
16.7%
100%
0%
0
5
10
15
20
25
Mechanism of Injury Outcome
Alive 21 14 5 11
Dead 2 0 1 0
Falls Transport Violence Other
Under the MOI of Fall;2 (8.7%) of all the deaths occurred due to falls. Also note that 1 (16.7%) death occurred due to MOI of Violence.
48
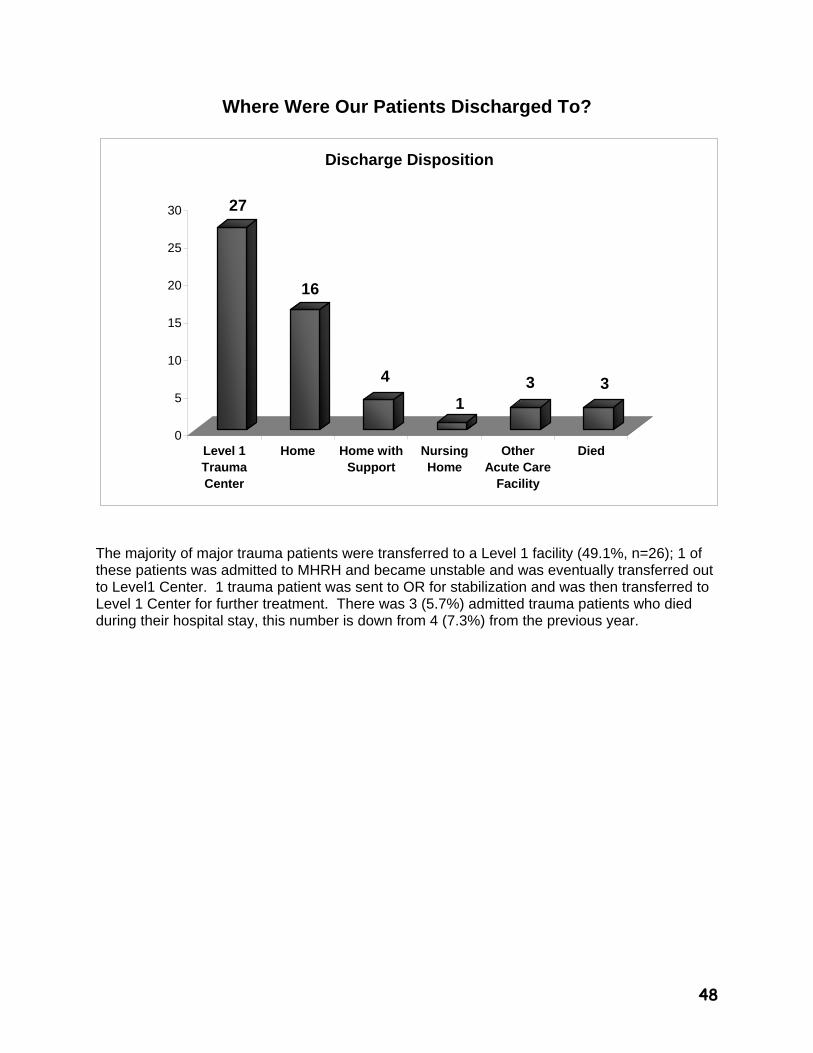
Where Were Our Patients Discharged To?
27
16
4
13 3
0
5
10
15
20
25
30
Level 1TraumaCenter
Home Home withSupport
NursingHome
OtherAcute Care
Facility
Died
Discharge Disposition
The majority of major trauma patients were transferred to a Level 1 facility (49.1%, n=26); 1 of these patients was admitted to MHRH and became unstable and was eventually transferred out to Level1 Center. 1 trauma patient was sent to OR for stabilization and was then transferred to Level 1 Center for further treatment. There was 3 (5.7%) admitted trauma patients who died during their hospital stay, this number is down from 4 (7.3%) from the previous year.
49
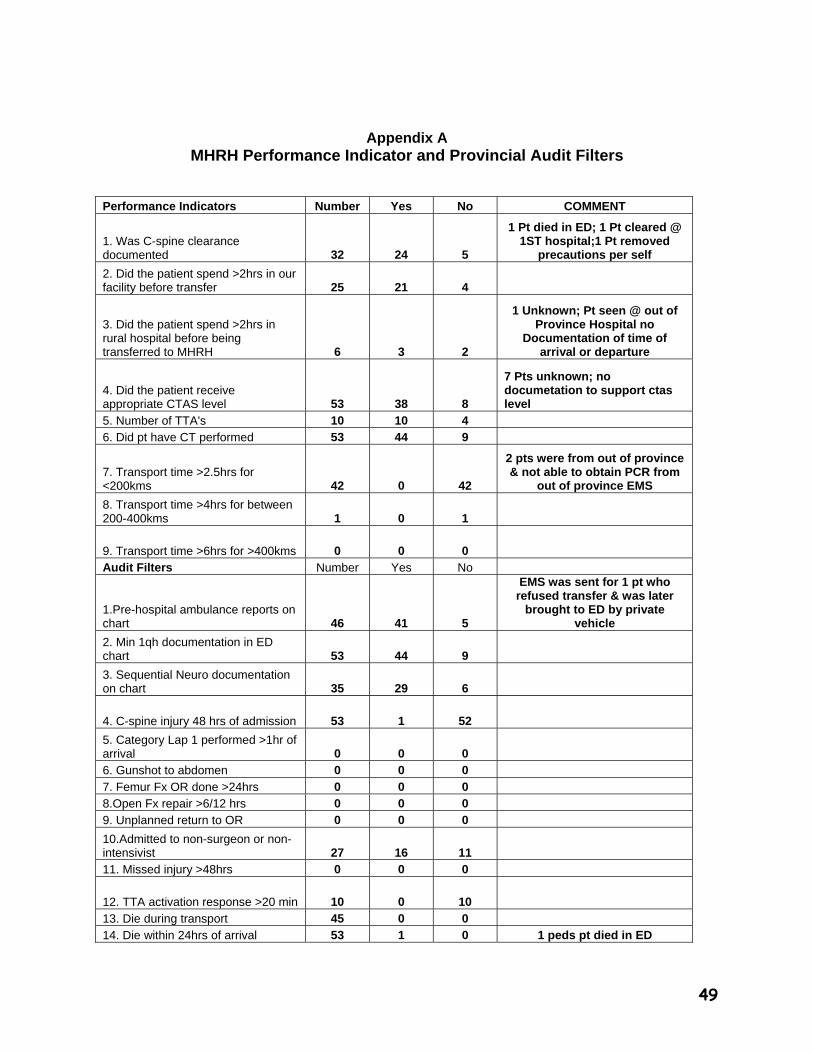
Appendix A MHRH Performance Indicator and Provincial Audit Filters
Performance Indicators Number Yes No COMMENT
1. Was C-spine clearance documented 32 24 5
1 Pt died in ED; 1 Pt cleared @ 1ST hospital;1 Pt removed
precautions per self
2. Did the patient spend >2hrs in our facility before transfer 25 21 4
3. Did the patient spend >2hrs in rural hospital before being transferred to MHRH 6 3 2
1 Unknown; Pt seen @ out of Province Hospital no
Documentation of time of arrival or departure
4. Did the patient receive appropriate CTAS level 53 38 8
7 Pts unknown; no documetation to support ctas level
5. Number of TTA's 10 10 4 6. Did pt have CT performed 53 44 9
7. Transport time >2.5hrs for <200kms 42 0 42
2 pts were from out of province & not able to obtain PCR from
out of province EMS
8. Transport time >4hrs for between 200-400kms 1 0 1
9. Transport time >6hrs for >400kms 0 0 0 Audit Filters Number Yes No
1.Pre-hospital ambulance reports on chart 46 41 5
EMS was sent for 1 pt who refused transfer & was later
brought to ED by private vehicle
2. Min 1qh documentation in ED chart 53 44 9
3. Sequential Neuro documentation on chart 35 29 6
4. C-spine injury 48 hrs of admission 53 1 52
5. Category Lap 1 performed >1hr of arrival 0 0 0 6. Gunshot to abdomen 0 0 0
7. Femur Fx OR done >24hrs 0 0 0 8.Open Fx repair >6/12 hrs 0 0 0 9. Unplanned return to OR 0 0 0
10.Admitted to non-surgeon or non-intensivist 27 16 11 11. Missed injury >48hrs 0 0 0
12. TTA activation response >20 min 10 0 10
13. Die during transport 45 0 0 14. Die within 24hrs of arrival 53 1 0 1 peds pt died in ED

50