Embed Size (px)
Citation preview
TRANSPORTING TURKISH EXAM TAKERS: A NEW USE FOR AN OLD MODEL
Nurhan Davutyan and Mert C. Demir
Working Paper 0401
Send correspondence to: Dr. Nurhan Davutyan, Associate Professor, Department of Industrial Engineering, Marmara University-Goztepe Campus 34722, Istanbul, Turkey, E-mail:[email protected]
Abstract
This paper argues that the transportation model of linear programming can be used to administer the Public Personnel Language Exam of Turkey in many different locations instead of just one, as is the current practice. It shows the resulting system to be much less costly. Furthermore, once the decision about number of locations is made, the resulting system can be managed either in a centralized or decentralized manner. A mixed mode of management is outlined, some historical perspectives on the genesis of the transportation model are offered and some ideas regarding the reasons for the current wasteful practices are presented. The possibility of applying the same policy reform in other MENA (Middle East and North Africa) countries is discussed in brief.
ملخص
تناقش هذه الورقة إمكانية استخدام نموذج االنتقال ذو البرمجة الخطية إلدارة إمتحان اللغة للعاملين في المصالح العامة . أن النظام الناتج أقل تكلفة بكثيرمما يتضح منه. في تركيا في مواقع عديدة بدالً من موقع واحد، كما هو المطبق حالياً
ويتم تحديد . أنه بمجرد التوصل لقرار حول عدد المواقع، فيمكن إدارة النظام الناتج بطريقة مركزية أو المركزيةكما صول نموذج االنتقال، باإلضافة إلى بعض األفكار ض الرؤى التاريخية فيما يتعلق بأنمط مختلط لإلدارة، وتقديم بع
كما يتم مناقشة إمكانية تطبيق ذات السياسة االصالحية في . يةالحالية غير المجدالخاصة باألسباب وراء الممارسات . دول الشرق األوسط وشمال أفريقيا األخرى باختصار
1
1. Introduction Most optimization textbooks, without going into their history and evolution, present the transportation model as a well-known technique and link it to early work by the 1975 Nobel laureate Tjalling Koopmans prior to and during WWII. See for instance Denardo1. However, its roots go much deeper. Thompson and Thore2 explain that mathematician Gaspard Mongé first formulated the model in the 1790s. While working on the construction of military fortifications for Napoleon, he had encountered a “cut and fill” problem, that of moving piles of dirt from locations where it was not needed to locations where it was needed. He stated that problem – without solving it – in mathematical form as a kind of transportation problem.
For our purposes, it is important to stress the following point: Such a formulation requires recognizing the “work/effort” of the soldiers, who would presumably do the moving, as something valuable and worth optimizing. In our modern world – at least in the Western Hemisphere – where almost everything is explicitly priced, this point may appear self-evident but it is worth emphasizing. Moreover we should recall that unpaid labor of all sorts – known as corvée – was quite common prior to 1789, in Ancient Regime, France. In fact, we may conjecture about ideas regarding civil liberties ushered in at that time, and to which the abolition of corvée and Mongé’s formulation of the problem were related. The life and career of Gaspard Mongé, an ardent libertarian, support this view, Ball3. Schumpeter4 gives numerous examples of these kinds of related phenomena whereby the emergence of their “necessary conditions” spurs discoveries and innovations. In anticipation of making a point in our next section, we hope Turkey, in their accession talks with the European Union will play a triggering role, comparable to the 18th century abolition of corvée in France.
2. Setting Twice a year, in May and November, the Student Selection and Placement Center (SSPC), a governmental agency in Turkey, administers a language exam known as the Public Personnel Language Exam or PPLE by its acronym. The exam takes place in Ankara, the capital. Anyone in Turkey who wants to prove her/his proficiency officially, in a language other than Turkish has to take this exam once every five years. The career paths and salaries of the individuals involved are linked to their exam scores.
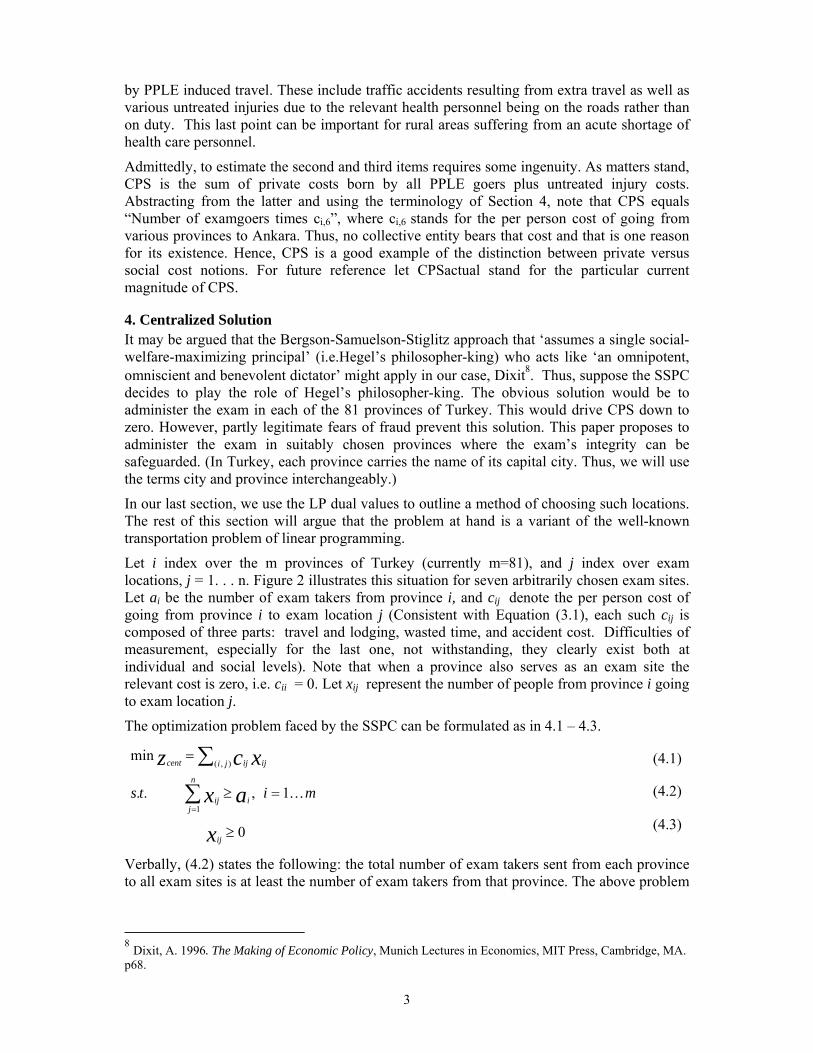
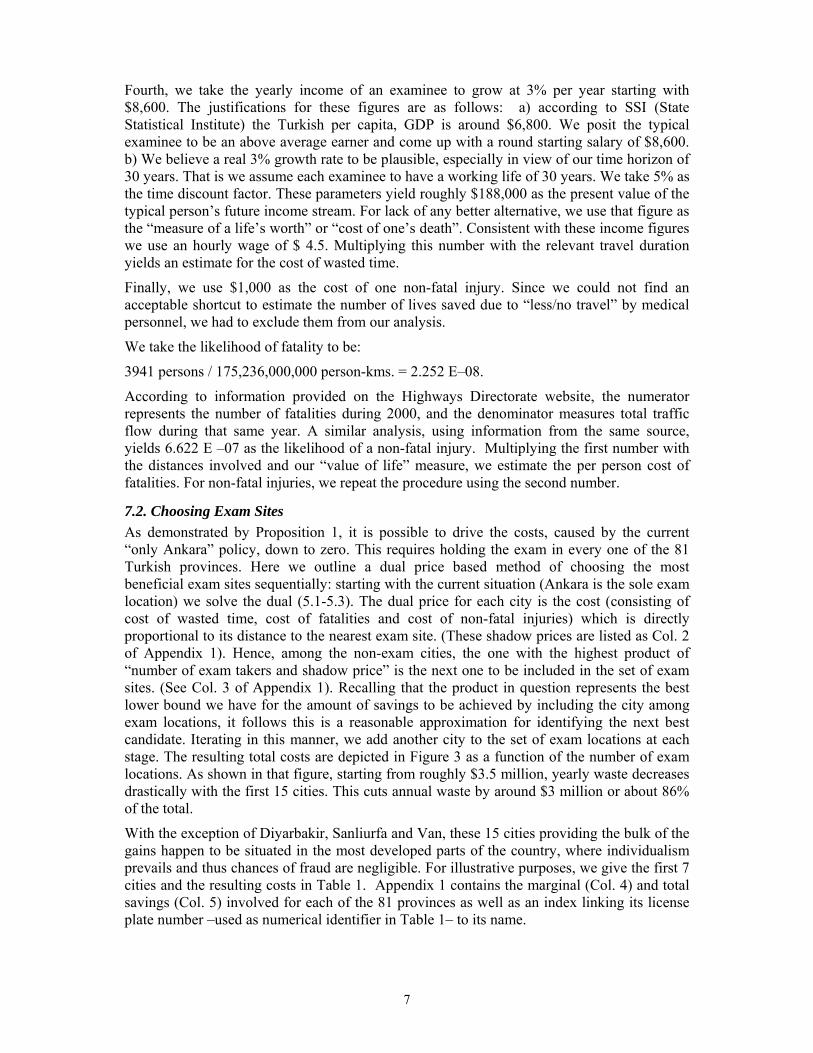
Not surprisingly, thousands of people converge to Ankara to take it (see Figure 1). After a three-hour exam, they return to their hometowns, which in most cases are hundreds/thousands of kilometers away. With only a change of dates, a similar exam is administered again in the spring and fall, this time exclusively for university personnel. As further discussed in our last section, a cautious guess of the yearly magnitude involved is one hundred thousand individuals. The people involved are essentially white collar workers from both the private and public sector: administrators, teachers, engineers, doctors and other health personnel etc.
The purpose of this centralized and illiberal examination policy, like so many others, is to accelerate modernization; in this particular case, by encouraging white collar workers to learn European languages. However, the means chosen – involving quasi-compulsory travel– is
1 Denardo, E. 2002. The Science of Decision-Making, John Wiley, New York, p107. 2 Thompson, G. and Thore, S. 1992. Computational Economics, Scientific Press, San Francisco, pp 6-7. 3 Ball, R. W. W. 1908. A Short Account of the History of Mathematics, 4th ed., www.maths.tcd.ie/pub/HistMath/People/Monge, transcribed by D.R. Wilkins. 4 Schumpeter, J A 1951, 1986. History of Economic Analysis, Oxford University Press, (Schumpeter E B ed.)
2
distinctly “unmodern” and discussed in numerous works on political history. For example, Atabaki and Zurcher5:
‘ . . The rights of the individual and his relationship with the state were of marginal rather than central significance in the eyes of Middle Eastern modernizers, and critical reason and individual autonomy seemed to have little relevance. The main reason for such discrepancy lay in the fact that the development of modern European societies was synchronized with and benefited from the age of European colonialism and imperialism and wars against the Orient. Modernization in the Middle East was a defensive reaction.’ (Italics added).
In short, what strikes us today as “un-modern” and, as we will demonstrate, “wasteful”, was and is part of an “authoritarian modernization” drive. For example, there is a practice that consists of requiring people about once every five years, to stay at home, on the last Sunday of November for the purpose of being physically counted. This way of conducting the population census -instead of using statistical sampling- is clearly wasteful. According to Kish6, a number of countries in Africa follow a similar practice, on the grounds that it enhances social/national cohesion.
In this particular instance, at least at its inception, the centralized exam fulfilled a twofold purpose: reinforcement of the nation building effort by having people, many of them provincial decision-makers, go to Ankara periodically and thereby strengthening the view that everything of importance is done at the capital city and the prevention of fraud especially in areas where sentiments of local patriotism is strong. We think that a country like Turkey, which is beginning accession talks with the European Union, should have enough self-confidence to put aside the first rationale and to recognize the counter productive potential of the second. Lejour and de Mooij7 provide an overall assessment of Turkey’s accession to the EU. Interestingly, they conclude, “if Turkey would succeed in reforming its domestic institutions in response to the EU-membership, consumption per capita in Turkey could rise by an additional 9%” (Italics added). The two examples of waste (the exam and the census practice) we provide – there are others – support this view.
Moreover as discussed in the next and last sections, the choice of exam locations can easily exclude regions where incidence of malfeasance is deemed likely to occur. Thus, we hope accession talks with the EU will provide the necessary impetus to rationalize every aspect of public life, thereby eliminating sundry wasteful practices, including the one we are discussing. In addition, given the similarities of the modernization experience in numerous MENA countries, similar considerations may apply as well, even in the absence of a formal EU integration process.
3. Costs Involved We now turn to the more narrow “economic” aspects of our problem. Let CPS stand for the “cost of the present situation” which can be represented as follows:
CPS = CT + CW + CA (3.1)
In (3.1), CT represents total travel and lodging expenses, CW, total opportunity cost of wasted time, and CA, total cost of deaths and various injuries caused directly and indirectly
5 Atabaki, T. and Zurcher, E. J. 2004). Men of Order: Authoritarian Modernization Under Ataturk and Reza Shah, IB Tauris, London and New York. pp 1-12. 6 Kish, L. 2003. Selected Papers (Kalton G and Heeringa S, Eds.), John Wiley, New York. 7 Lejour, A. M. and De Mooij, R. A. 2005. “Turkish Delight: Does Turkey’s Accession to the EU Bring Economic Benefits,” Kyklos, Vol. 58: pp. 87-120.
3
by PPLE induced travel. These include traffic accidents resulting from extra travel as well as various untreated injuries due to the relevant health personnel being on the roads rather than on duty. This last point can be important for rural areas suffering from an acute shortage of health care personnel.
Admittedly, to estimate the second and third items requires some ingenuity. As matters stand, CPS is the sum of private costs born by all PPLE goers plus untreated injury costs. Abstracting from the latter and using the terminology of Section 4, note that CPS equals “Number of examgoers times ci,6”, where ci,6 stands for the per person cost of going from various provinces to Ankara. Thus, no collective entity bears that cost and that is one reason for its existence. Hence, CPS is a good example of the distinction between private versus social cost notions. For future reference let CPSactual stand for the particular current magnitude of CPS.
4. Centralized Solution It may be argued that the Bergson-Samuelson-Stiglitz approach that ‘assumes a single social-welfare-maximizing principal’ (i.e.Hegel’s philosopher-king) who acts like ‘an omnipotent, omniscient and benevolent dictator’ might apply in our case, Dixit8. Thus, suppose the SSPC decides to play the role of Hegel’s philosopher-king. The obvious solution would be to administer the exam in each of the 81 provinces of Turkey. This would drive CPS down to zero. However, partly legitimate fears of fraud prevent this solution. This paper proposes to administer the exam in suitably chosen provinces where the exam’s integrity can be safeguarded. (In Turkey, each province carries the name of its capital city. Thus, we will use the terms city and province interchangeably.)
In our last section, we use the LP dual values to outline a method of choosing such locations. The rest of this section will argue that the problem at hand is a variant of the well-known transportation problem of linear programming.
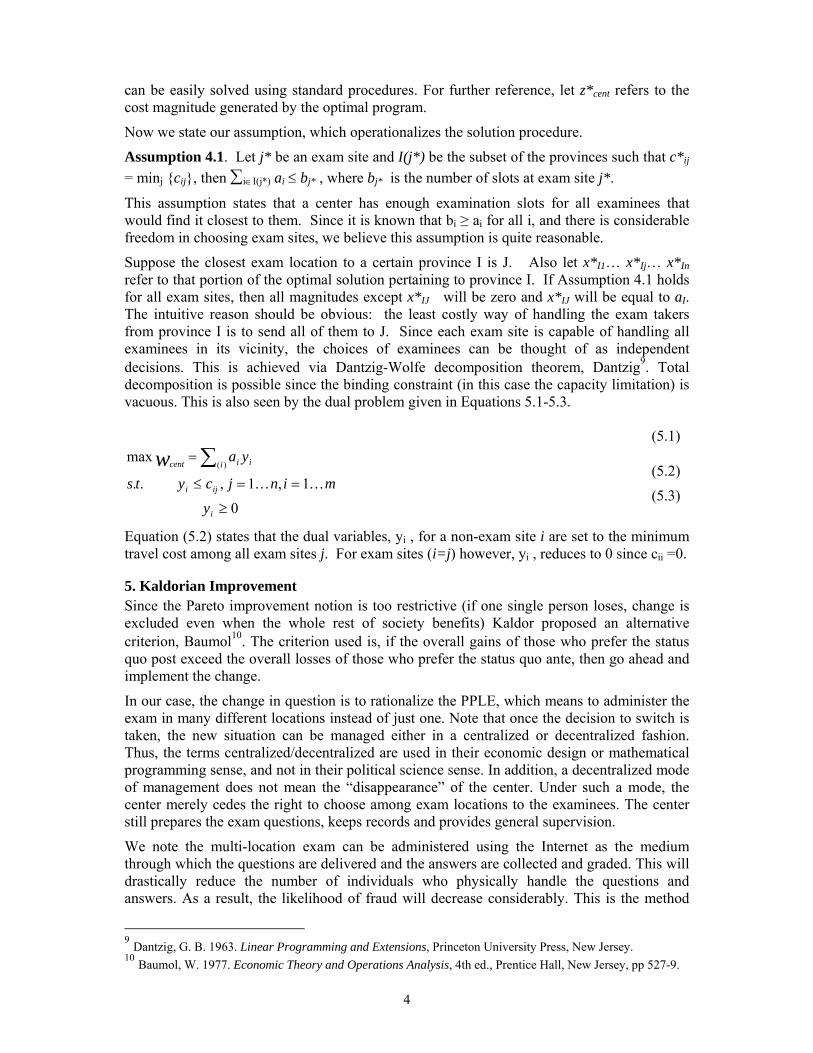
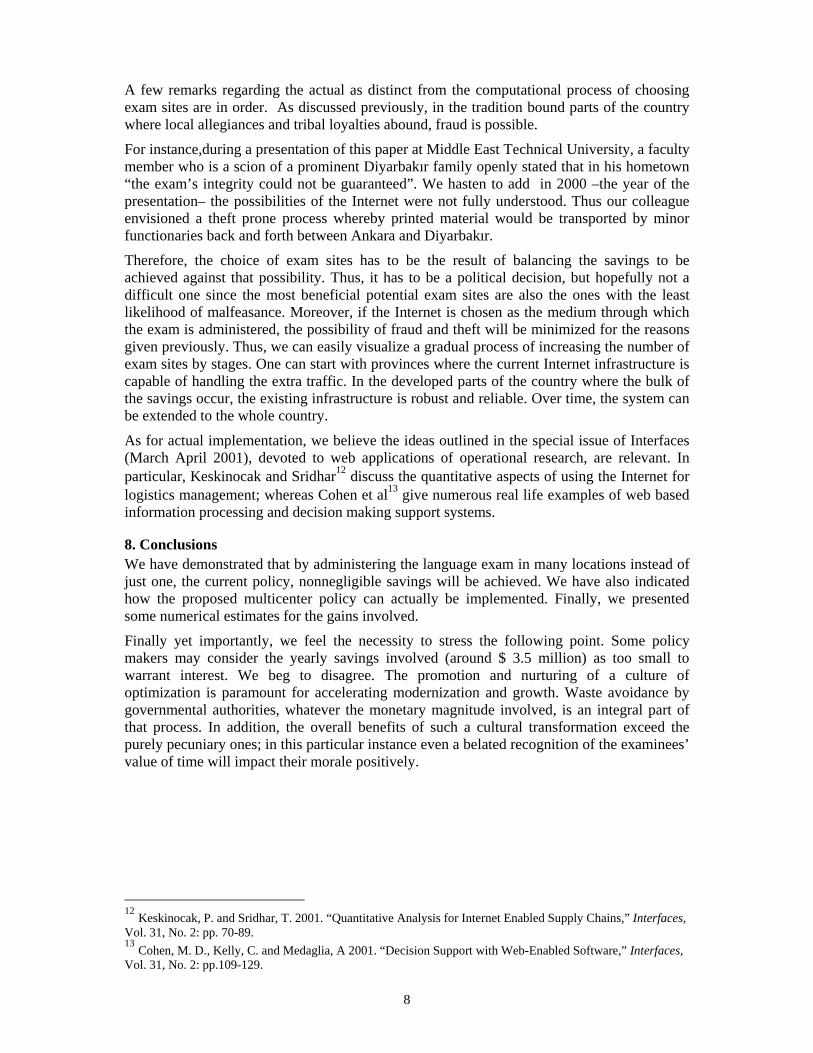
Let i index over the m provinces of Turkey (currently m=81), and j index over exam locations, j = 1. . . n. Figure 2 illustrates this situation for seven arbitrarily chosen exam sites. Let ai be the number of exam takers from province i, and cij denote the per person cost of going from province i to exam location j (Consistent with Equation (3.1), each such cij is composed of three parts: travel and lodging, wasted time, and accident cost. Difficulties of measurement, especially for the last one, not withstanding, they clearly exist both at individual and social levels). Note that when a province also serves as an exam site the relevant cost is zero, i.e. cii = 0. Let xij represent the number of people from province i going to exam location j.
The optimization problem faced by the SSPC can be formulated as in 4.1 – 4.3.
0
1,..
min
1
),(
≥
=≥
=
∑
∑
=
x
ax
xcz
ij
n
jiij
ji ijijcent
mits K
Verbally, (4.2) states the following: the total number of exam takers sent from each province to all exam sites is at least the number of exam takers from that province. The above problem
8 Dixit, A. 1996. The Making of Economic Policy, Munich Lectures in Economics, MIT Press, Cambridge, MA. p68.
(4.1)
(4.2)
(4.3)
4
can be easily solved using standard procedures. For further reference, let z*cent refers to the cost magnitude generated by the optimal program.
Now we state our assumption, which operationalizes the solution procedure.
Assumption 4.1. Let j* be an exam site and I(j*) be the subset of the provinces such that c*ij = minj {cij}, then ∑i∈I(j*) ai ≤ bj* , where bj* is the number of slots at exam site j*.
This assumption states that a center has enough examination slots for all examinees that would find it closest to them. Since it is known that bi ≥ ai for all i, and there is considerable freedom in choosing exam sites, we believe this assumption is quite reasonable.
Suppose the closest exam location to a certain province I is J. Also let x*I1… x*Ij… x*In refer to that portion of the optimal solution pertaining to province I. If Assumption 4.1 holds for all exam sites, then all magnitudes except x*IJ will be zero and x*IJ will be equal to aI. The intuitive reason should be obvious: the least costly way of handling the exam takers from province I is to send all of them to J. Since each exam site is capable of handling all examinees in its vicinity, the choices of examinees can be thought of as independent decisions. This is achieved via Dantzig-Wolfe decomposition theorem, Dantzig9. Total decomposition is possible since the binding constraint (in this case the capacity limitation) is vacuous. This is also seen by the dual problem given in Equations 5.1-5.3.
0
1,1,..
max)(
≥
==≤
= ∑
i
iji
i iicent
y
minjcyts
yawKK
Equation (5.2) states that the dual variables, yi , for a non-exam site i are set to the minimum travel cost among all exam sites j. For exam sites (i=j) however, yi , reduces to 0 since cii =0.
5. Kaldorian Improvement Since the Pareto improvement notion is too restrictive (if one single person loses, change is excluded even when the whole rest of society benefits) Kaldor proposed an alternative criterion, Baumol10. The criterion used is, if the overall gains of those who prefer the status quo post exceed the overall losses of those who prefer the status quo ante, then go ahead and implement the change.
In our case, the change in question is to rationalize the PPLE, which means to administer the exam in many different locations instead of just one. Note that once the decision to switch is taken, the new situation can be managed either in a centralized or decentralized fashion. Thus, the terms centralized/decentralized are used in their economic design or mathematical programming sense, and not in their political science sense. In addition, a decentralized mode of management does not mean the “disappearance” of the center. Under such a mode, the center merely cedes the right to choose among exam locations to the examinees. The center still prepares the exam questions, keeps records and provides general supervision.
We note the multi-location exam can be administered using the Internet as the medium through which the questions are delivered and the answers are collected and graded. This will drastically reduce the number of individuals who physically handle the questions and answers. As a result, the likelihood of fraud will decrease considerably. This is the method
9 Dantzig, G. B. 1963. Linear Programming and Extensions, Princeton University Press, New Jersey. 10 Baumol, W. 1977. Economic Theory and Operations Analysis, 4th ed., Prentice Hall, New Jersey, pp 527-9.
(5.1)
(5.2)
(5.3)
5
used in several EU countries to administer various proficiency exams. Geoffrion and Krishnan11 provide an overview of the complementarities between operations research and the Internet.
Proposition I. CPSactual > z*cent > 0 for n ≠ m
This states that so long as m (# of provinces) > n (# of exam sites), z*cent > 0, and obviously when m = n = 81, z*cent = 0.
Proof. CPSactual is the cost with only one exam site, namely Ankara. Also z*cent decreases with each additional exam site. Note that each such decreasing total cost has 3 components: CT +CW +CA. CT, namely the cost of travelling and lodging for examgoers, is a benefit item for hoteliers and bus operators; hence, the gain to examgoers is cancelled by the loss of hotel and bus operators. Note that this does not require any particular assumption, apart from the natural one of the analyst’s neutrality between these two groups. On the other hand, the other two are deadweight losses since nobody in society gains from their presence. Thus, when each one of these latter cost items diminishes with each additional exam site, the reductions represent a net social gain. This establishes the validity of our conjecture regarding Kaldorian improvement.
As for the second part, if the exam takes place in all provinces, there will be neither congestion and wasted time, nor any transportation cost; hence all three components of z*cent will be 0.
6. Decentralized Solution Let us now assume that the examinees in each province i act independently. We further assume that xk
ij denotes the action of the kth individual from province i. It can be argued, when given the option of choosing among n exam locations, the kth individual will face the following general linear programming problem (there are ai of these problems, one for each examinee, in province i):
0
1,1..
min
1
),(
≥
==
=
∑
∑
=
x
x
xcz
k
ij
n
j
k
ij
ji
k
ijij
ki
mits K
Let xk*I1… xk*IJ…. xk*In refer to the optimal values for an arbitrary person k in region I. Intuitively it should be clear that all values except xk*IJ will be zero and xk*IJ will be 1, because the least costly way for an examgoer in province I to take the exam is in the nearest exam location J.
Proposition II. axx iijk
k
ij
ai
==∑=
**1
for all i and j.
Proof. Note that (6.2), when summed up over k gives (4.2). The groups in each region are non-overlapping. Hence, the equivalence follows. Since this holds for any solution satisfying (6.2) and (4.2), it also holds for the optimum one.
Each examinee (irrespective of province) will have to solve the linear problem (6.1)-(6.3). Let
11 Geoffrion, A. and Krishnan, R. 2001. “Prospects for Operations Research in the E-Business Era,” Interfaces, Vol. 31, No. 2: pp. 6-36.
(6.1)
(6.2)
(6.3)
6
∑∑= =
=m
i k
kidecent
ai
zz1 1
**
be the optimum magnitude obtained when all individuals’ optimum costs are totalled for all provinces.
Proposition III. z*cent = z*decent
Proof. Noting that the costs in (4.1) and (6.1) are the same and using Proposition 2, the result follows.
Finally, a mixed mode of management is also possible. It can be achieved as follows: the examinees have the right to select their exam site and actually do so. Thus each one of them solves her/his linear problem. Let the resulting outcome be called the decentralized actual solution. The exam goers are required to inform the center of their province of origin – and of nothing else! Based on this knowledge, that is the ai’s and the costs (the cij’s) that it estimates, the center solves the LP problem of (4.1)-(4.3). Let the result be called the centralized notional solution. Propositions 2 and 3 show these two solutions would essentially coincide. Occasionally, the center may use this procedure to verify the overall integrity of the system.
7. Numerical Illustration 7.1. Parameters This section calculates the savings –in the form of reduced costs– to be achieved by implementing the ideas outlined in our paper. Throughout this exercise, we strive for realism.
Firstly, we do not include the costs of administering the exam itself. The reason is straightforward: we are comparing scenarios where the number of exam locations is gradually increased from one (only Ankara) to eighty-one, namely in every province. However, in each case, the language examination takes place and thus the administrative costs are incurred.
Secondly, we assume the number of examtakers to be the same irrespective of the number of exam locations. In reality, we can expect that number to increase somewhat as candidates have more places to choose from. The situation bears some similarity to the “discouraged worker effect” phenomenon. This involves unemployed people not looking for work when they reckon their chances are slim. To that extent measured unemployment falls short of true unemployment. By a similar logic if the cost of traveling to Ankara is prohibitive for some would be examtakers, then the actual number of examtakers that we estimate and use in our scenarios has a downward bias. As a result, the benefit figures we come up with need to be revised upward.
Third, we take one hundred thousand individuals to be a realistic estimate for the number of examinees. We arrived at this figure via the following logic. According to SSPC’s website, during May 2005, 40,000 individuals took the PPLE exam. The corresponding figures for the equivalent language examinations of university and medical personnel are 23,000 and 5,800 respectively. Since these are for the first half of that year, this sum (roughly) of 69,000 should be multiplied by two. Choosing to err on the side of caution, we ended up with 100,000 as our yearly estimate.
We allocated this total among our 81 provinces in accordance with the population share of the province in the 2000 census. For example, Adana whose population was 1.85 millions according to that census –the total being 67.8 million– has a share of 0.0273. Thus, under the status quo, 2730 people from Adana must travel to Ankara for exam purposes on a yearly basis.
7
Fourth, we take the yearly income of an examinee to grow at 3% per year starting with $8,600. The justifications for these figures are as follows: a) according to SSI (State Statistical Institute) the Turkish per capita, GDP is around $6,800. We posit the typical examinee to be an above average earner and come up with a round starting salary of $8,600. b) We believe a real 3% growth rate to be plausible, especially in view of our time horizon of 30 years. That is we assume each examinee to have a working life of 30 years. We take 5% as the time discount factor. These parameters yield roughly $188,000 as the present value of the typical person’s future income stream. For lack of any better alternative, we use that figure as the “measure of a life’s worth” or “cost of one’s death”. Consistent with these income figures we use an hourly wage of $ 4.5. Multiplying this number with the relevant travel duration yields an estimate for the cost of wasted time.
Finally, we use $1,000 as the cost of one non-fatal injury. Since we could not find an acceptable shortcut to estimate the number of lives saved due to “less/no travel” by medical personnel, we had to exclude them from our analysis.
We take the likelihood of fatality to be:
3941 persons / 175,236,000,000 person-kms. = 2.252 E–08.
According to information provided on the Highways Directorate website, the numerator represents the number of fatalities during 2000, and the denominator measures total traffic flow during that same year. A similar analysis, using information from the same source, yields 6.622 E –07 as the likelihood of a non-fatal injury. Multiplying the first number with the distances involved and our “value of life” measure, we estimate the per person cost of fatalities. For non-fatal injuries, we repeat the procedure using the second number.
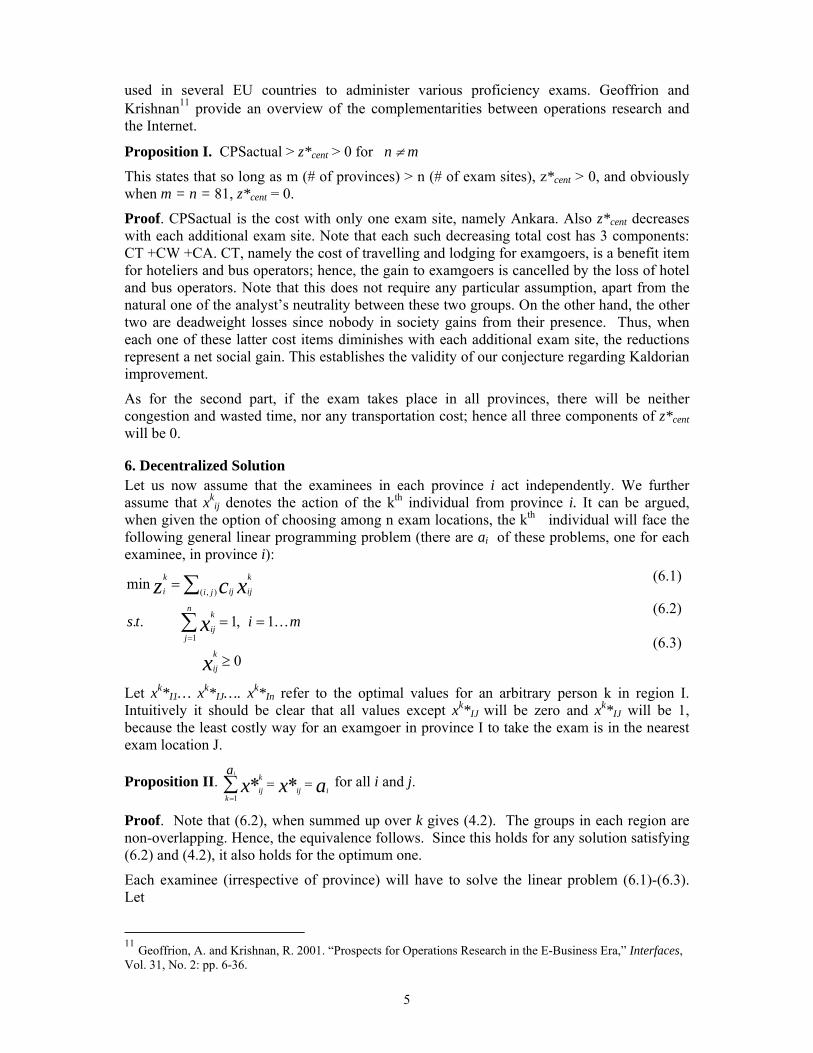
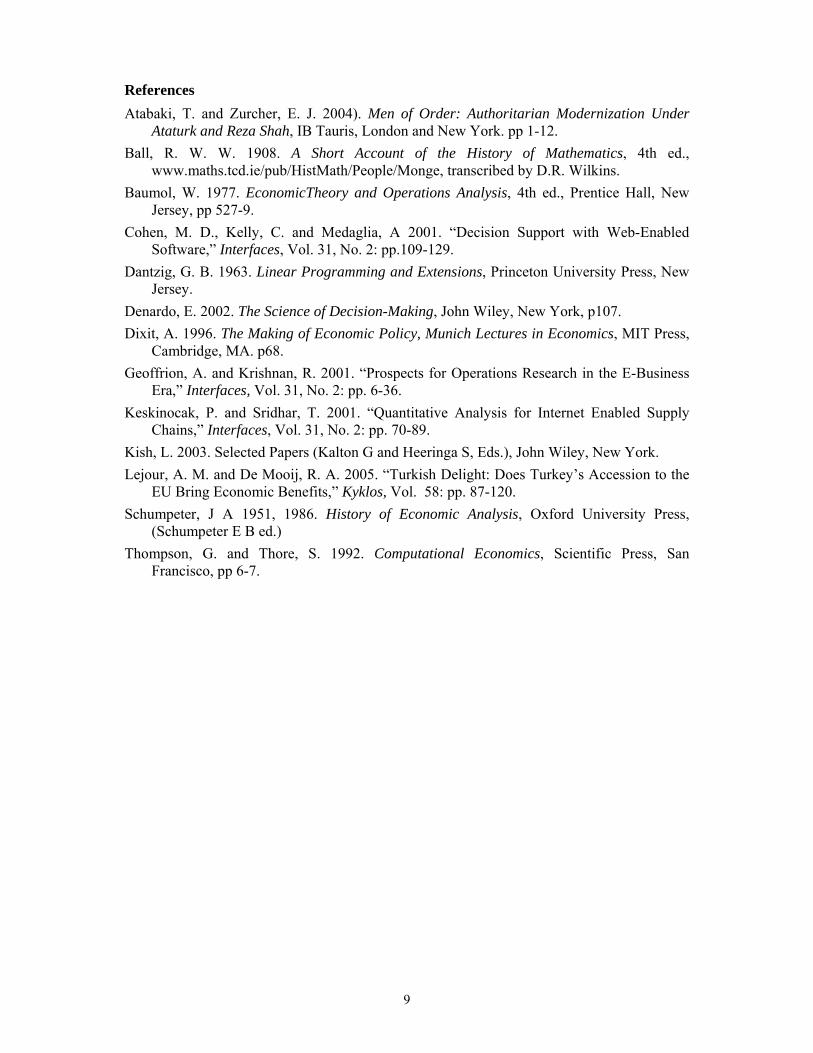
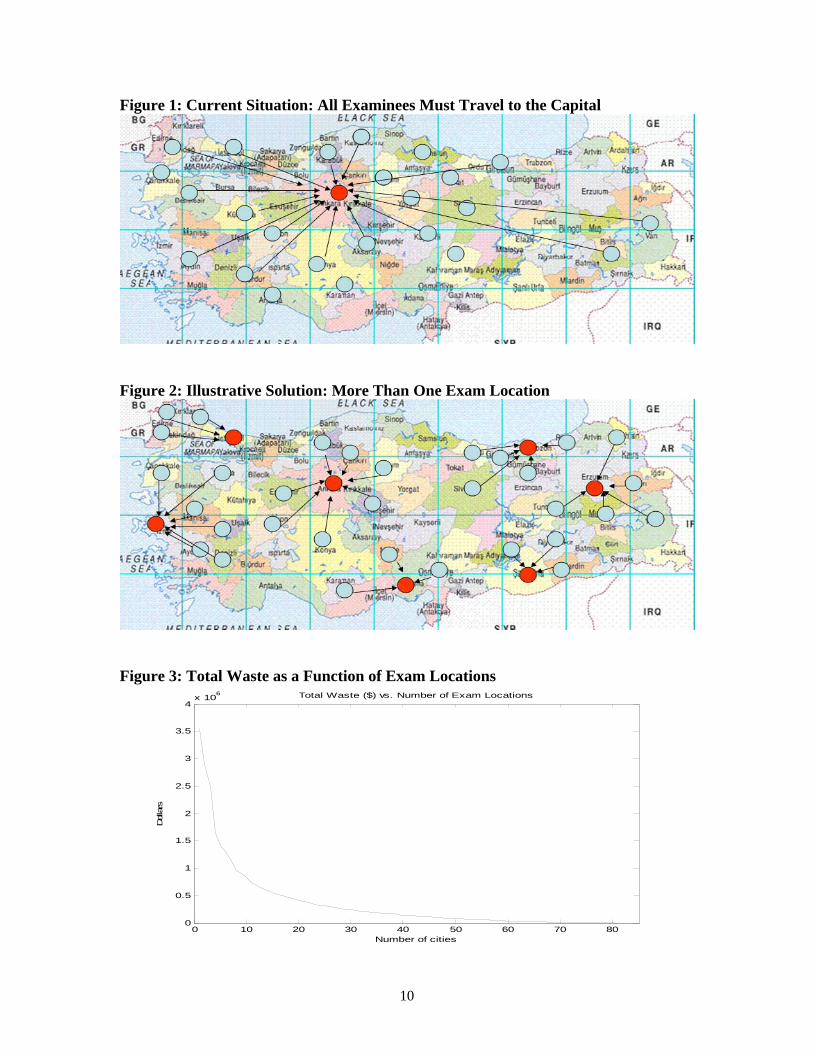
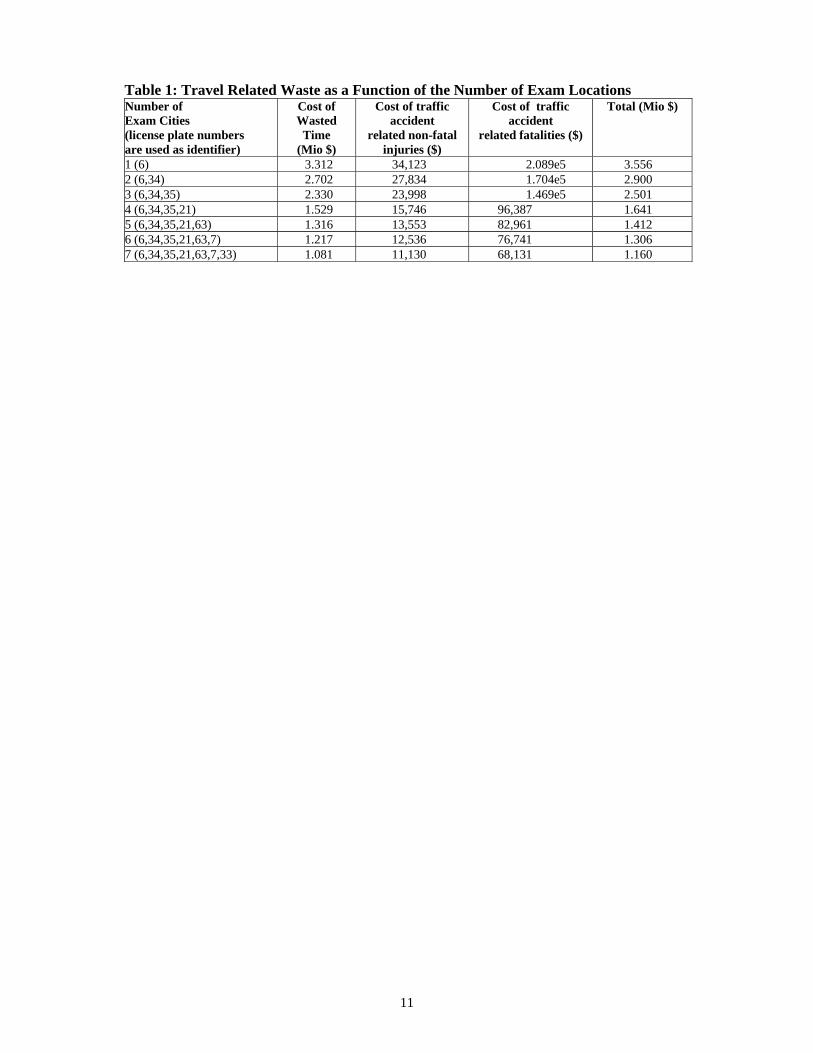
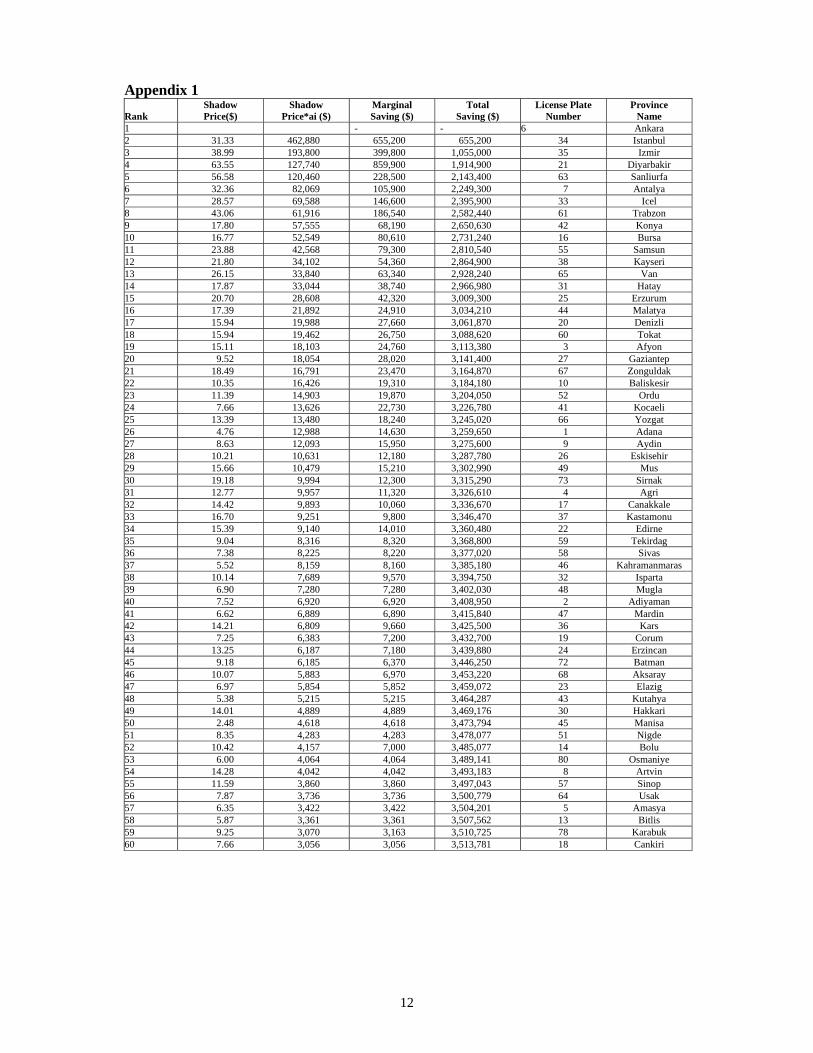
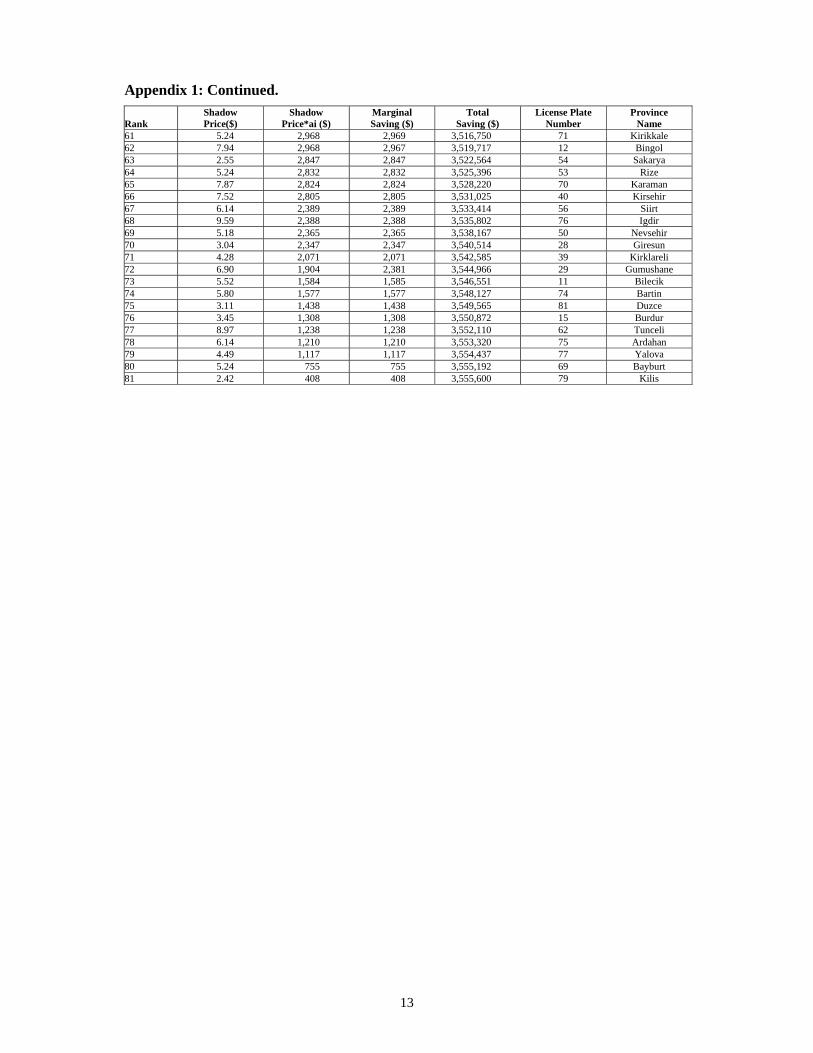
7.2. Choosing Exam Sites As demonstrated by Proposition 1, it is possible to drive the costs, caused by the current “only Ankara” policy, down to zero. This requires holding the exam in every one of the 81 Turkish provinces. Here we outline a dual price based method of choosing the most beneficial exam sites sequentially: starting with the current situation (Ankara is the sole exam location) we solve the dual (5.1-5.3). The dual price for each city is the cost (consisting of cost of wasted time, cost of fatalities and cost of non-fatal injuries) which is directly proportional to its distance to the nearest exam site. (These shadow prices are listed as Col. 2 of Appendix 1). Hence, among the non-exam cities, the one with the highest product of “number of exam takers and shadow price” is the next one to be included in the set of exam sites. (See Col. 3 of Appendix 1). Recalling that the product in question represents the best lower bound we have for the amount of savings to be achieved by including the city among exam locations, it follows this is a reasonable approximation for identifying the next best candidate. Iterating in this manner, we add another city to the set of exam locations at each stage. The resulting total costs are depicted in Figure 3 as a function of the number of exam locations. As shown in that figure, starting from roughly $3.5 million, yearly waste decreases drastically with the first 15 cities. This cuts annual waste by around $3 million or about 86% of the total.
With the exception of Diyarbakir, Sanliurfa and Van, these 15 cities providing the bulk of the gains happen to be situated in the most developed parts of the country, where individualism prevails and thus chances of fraud are negligible. For illustrative purposes, we give the first 7 cities and the resulting costs in Table 1. Appendix 1 contains the marginal (Col. 4) and total savings (Col. 5) involved for each of the 81 provinces as well as an index linking its license plate number –used as numerical identifier in Table 1– to its name.
8
A few remarks regarding the actual as distinct from the computational process of choosing exam sites are in order. As discussed previously, in the tradition bound parts of the country where local allegiances and tribal loyalties abound, fraud is possible.
For instance,during a presentation of this paper at Middle East Technical University, a faculty member who is a scion of a prominent Diyarbakır family openly stated that in his hometown “the exam’s integrity could not be guaranteed”. We hasten to add in 2000 –the year of the presentation– the possibilities of the Internet were not fully understood. Thus our colleague envisioned a theft prone process whereby printed material would be transported by minor functionaries back and forth between Ankara and Diyarbakır.
Therefore, the choice of exam sites has to be the result of balancing the savings to be achieved against that possibility. Thus, it has to be a political decision, but hopefully not a difficult one since the most beneficial potential exam sites are also the ones with the least likelihood of malfeasance. Moreover, if the Internet is chosen as the medium through which the exam is administered, the possibility of fraud and theft will be minimized for the reasons given previously. Thus, we can easily visualize a gradual process of increasing the number of exam sites by stages. One can start with provinces where the current Internet infrastructure is capable of handling the extra traffic. In the developed parts of the country where the bulk of the savings occur, the existing infrastructure is robust and reliable. Over time, the system can be extended to the whole country.
As for actual implementation, we believe the ideas outlined in the special issue of Interfaces (March April 2001), devoted to web applications of operational research, are relevant. In particular, Keskinocak and Sridhar12 discuss the quantitative aspects of using the Internet for logistics management; whereas Cohen et al13 give numerous real life examples of web based information processing and decision making support systems.
8. Conclusions We have demonstrated that by administering the language exam in many locations instead of just one, the current policy, nonnegligible savings will be achieved. We have also indicated how the proposed multicenter policy can actually be implemented. Finally, we presented some numerical estimates for the gains involved.
Finally yet importantly, we feel the necessity to stress the following point. Some policy makers may consider the yearly savings involved (around $ 3.5 million) as too small to warrant interest. We beg to disagree. The promotion and nurturing of a culture of optimization is paramount for accelerating modernization and growth. Waste avoidance by governmental authorities, whatever the monetary magnitude involved, is an integral part of that process. In addition, the overall benefits of such a cultural transformation exceed the purely pecuniary ones; in this particular instance even a belated recognition of the examinees’ value of time will impact their morale positively.
12 Keskinocak, P. and Sridhar, T. 2001. “Quantitative Analysis for Internet Enabled Supply Chains,” Interfaces, Vol. 31, No. 2: pp. 70-89. 13 Cohen, M. D., Kelly, C. and Medaglia, A 2001. “Decision Support with Web-Enabled Software,” Interfaces, Vol. 31, No. 2: pp.109-129.
9
References Atabaki, T. and Zurcher, E. J. 2004). Men of Order: Authoritarian Modernization Under
Ataturk and Reza Shah, IB Tauris, London and New York. pp 1-12. Ball, R. W. W. 1908. A Short Account of the History of Mathematics, 4th ed.,
www.maths.tcd.ie/pub/HistMath/People/Monge, transcribed by D.R. Wilkins. Baumol, W. 1977. EconomicTheory and Operations Analysis, 4th ed., Prentice Hall, New
Jersey, pp 527-9. Cohen, M. D., Kelly, C. and Medaglia, A 2001. “Decision Support with Web-Enabled
Software,” Interfaces, Vol. 31, No. 2: pp.109-129. Dantzig, G. B. 1963. Linear Programming and Extensions, Princeton University Press, New
Jersey. Denardo, E. 2002. The Science of Decision-Making, John Wiley, New York, p107. Dixit, A. 1996. The Making of Economic Policy, Munich Lectures in Economics, MIT Press,
Cambridge, MA. p68. Geoffrion, A. and Krishnan, R. 2001. “Prospects for Operations Research in the E-Business
Era,” Interfaces, Vol. 31, No. 2: pp. 6-36. Keskinocak, P. and Sridhar, T. 2001. “Quantitative Analysis for Internet Enabled Supply
Chains,” Interfaces, Vol. 31, No. 2: pp. 70-89. Kish, L. 2003. Selected Papers (Kalton G and Heeringa S, Eds.), John Wiley, New York. Lejour, A. M. and De Mooij, R. A. 2005. “Turkish Delight: Does Turkey’s Accession to the
EU Bring Economic Benefits,” Kyklos, Vol. 58: pp. 87-120. Schumpeter, J A 1951, 1986. History of Economic Analysis, Oxford University Press,
(Schumpeter E B ed.) Thompson, G. and Thore, S. 1992. Computational Economics, Scientific Press, San
Francisco, pp 6-7.
10
Figure 1: Current Situation: All Examinees Must Travel to the Capital
Figure 2: Illustrative Solution: More Than One Exam Location
Figure 3: Total Waste as a Function of Exam Locations
0 10 20 30 40 50 60 70 800
0.5
1
1.5
2
2.5
3
3.5
4x 10⁶
Number of cities
Dollars
Total Waste ($) vs. Number of Exam Locations
11
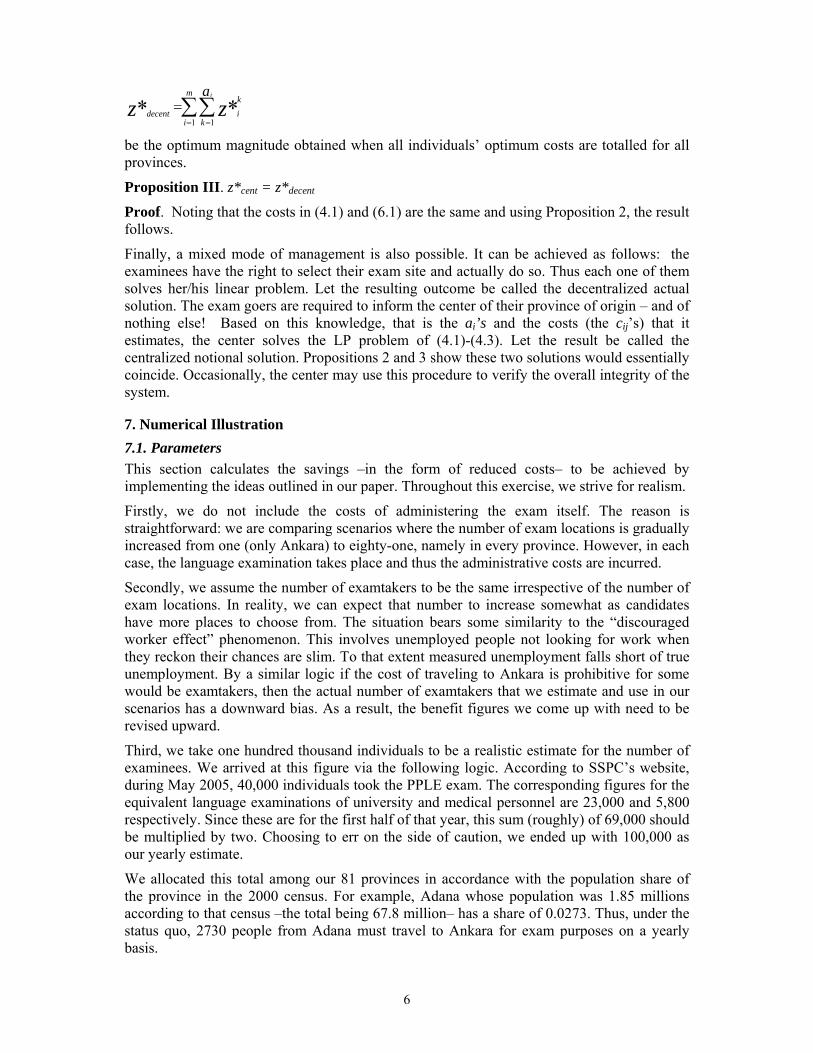
Table 1: Travel Related Waste as a Function of the Number of Exam Locations Number of Exam Cities (license plate numbers are used as identifier)
Cost of Wasted Time
(Mio $)
Cost of traffic accident
related non-fatal injuries ($)
Cost of traffic accident
related fatalities ($)
Total (Mio $)
1 (6) 3.312 34,123 2.089e5 3.556 2 (6,34) 2.702 27,834 1.704e5 2.900 3 (6,34,35) 2.330 23,998 1.469e5 2.501 4 (6,34,35,21) 1.529 15,746 96,387 1.641 5 (6,34,35,21,63) 1.316 13,553 82,961 1.412 6 (6,34,35,21,63,7) 1.217 12,536 76,741 1.306 7 (6,34,35,21,63,7,33) 1.081 11,130 68,131 1.160
12
Appendix 1
Rank Shadow Price($)
Shadow Price*ai ($)
Marginal Saving ($)
Total Saving ($)
License Plate Number
Province Name
1 - - 6 Ankara 2 31.33 462,880 655,200 655,200 34 Istanbul 3 38.99 193,800 399,800 1,055,000 35 Izmir 4 63.55 127,740 859,900 1,914,900 21 Diyarbakir 5 56.58 120,460 228,500 2,143,400 63 Sanliurfa 6 32.36 82,069 105,900 2,249,300 7 Antalya 7 28.57 69,588 146,600 2,395,900 33 Icel 8 43.06 61,916 186,540 2,582,440 61 Trabzon 9 17.80 57,555 68,190 2,650,630 42 Konya 10 16.77 52,549 80,610 2,731,240 16 Bursa 11 23.88 42,568 79,300 2,810,540 55 Samsun 12 21.80 34,102 54,360 2,864,900 38 Kayseri 13 26.15 33,840 63,340 2,928,240 65 Van 14 17.87 33,044 38,740 2,966,980 31 Hatay 15 20.70 28,608 42,320 3,009,300 25 Erzurum 16 17.39 21,892 24,910 3,034,210 44 Malatya 17 15.94 19,988 27,660 3,061,870 20 Denizli 18 15.94 19,462 26,750 3,088,620 60 Tokat 19 15.11 18,103 24,760 3,113,380 3 Afyon 20 9.52 18,054 28,020 3,141,400 27 Gaziantep 21 18.49 16,791 23,470 3,164,870 67 Zonguldak 22 10.35 16,426 19,310 3,184,180 10 Baliskesir 23 11.39 14,903 19,870 3,204,050 52 Ordu 24 7.66 13,626 22,730 3,226,780 41 Kocaeli 25 13.39 13,480 18,240 3,245,020 66 Yozgat 26 4.76 12,988 14,630 3,259,650 1 Adana 27 8.63 12,093 15,950 3,275,600 9 Aydin 28 10.21 10,631 12,180 3,287,780 26 Eskisehir 29 15.66 10,479 15,210 3,302,990 49 Mus 30 19.18 9,994 12,300 3,315,290 73 Sirnak 31 12.77 9,957 11,320 3,326,610 4 Agri 32 14.42 9,893 10,060 3,336,670 17 Canakkale 33 16.70 9,251 9,800 3,346,470 37 Kastamonu 34 15.39 9,140 14,010 3,360,480 22 Edirne 35 9.04 8,316 8,320 3,368,800 59 Tekirdag 36 7.38 8,225 8,220 3,377,020 58 Sivas 37 5.52 8,159 8,160 3,385,180 46 Kahramanmaras 38 10.14 7,689 9,570 3,394,750 32 Isparta 39 6.90 7,280 7,280 3,402,030 48 Mugla 40 7.52 6,920 6,920 3,408,950 2 Adiyaman 41 6.62 6,889 6,890 3,415,840 47 Mardin 42 14.21 6,809 9,660 3,425,500 36 Kars 43 7.25 6,383 7,200 3,432,700 19 Corum 44 13.25 6,187 7,180 3,439,880 24 Erzincan 45 9.18 6,185 6,370 3,446,250 72 Batman 46 10.07 5,883 6,970 3,453,220 68 Aksaray 47 6.97 5,854 5,852 3,459,072 23 Elazig 48 5.38 5,215 5,215 3,464,287 43 Kutahya 49 14.01 4,889 4,889 3,469,176 30 Hakkari 50 2.48 4,618 4,618 3,473,794 45 Manisa 51 8.35 4,283 4,283 3,478,077 51 Nigde 52 10.42 4,157 7,000 3,485,077 14 Bolu 53 6.00 4,064 4,064 3,489,141 80 Osmaniye 54 14.28 4,042 4,042 3,493,183 8 Artvin 55 11.59 3,860 3,860 3,497,043 57 Sinop 56 7.87 3,736 3,736 3,500,779 64 Usak 57 6.35 3,422 3,422 3,504,201 5 Amasya 58 5.87 3,361 3,361 3,507,562 13 Bitlis 59 9.25 3,070 3,163 3,510,725 78 Karabuk 60 7.66 3,056 3,056 3,513,781 18 Cankiri
13
Appendix 1: Continued.
Rank Shadow Price($)
Shadow Price*ai ($)
Marginal Saving ($)
Total Saving ($)
License Plate Number
Province Name
61 5.24 2,968 2,969 3,516,750 71 Kirikkale 62 7.94 2,968 2,967 3,519,717 12 Bingol 63 2.55 2,847 2,847 3,522,564 54 Sakarya 64 5.24 2,832 2,832 3,525,396 53 Rize 65 7.87 2,824 2,824 3,528,220 70 Karaman 66 7.52 2,805 2,805 3,531,025 40 Kirsehir 67 6.14 2,389 2,389 3,533,414 56 Siirt 68 9.59 2,388 2,388 3,535,802 76 Igdir 69 5.18 2,365 2,365 3,538,167 50 Nevsehir 70 3.04 2,347 2,347 3,540,514 28 Giresun 71 4.28 2,071 2,071 3,542,585 39 Kirklareli 72 6.90 1,904 2,381 3,544,966 29 Gumushane 73 5.52 1,584 1,585 3,546,551 11 Bilecik 74 5.80 1,577 1,577 3,548,127 74 Bartin 75 3.11 1,438 1,438 3,549,565 81 Duzce 76 3.45 1,308 1,308 3,550,872 15 Burdur 77 8.97 1,238 1,238 3,552,110 62 Tunceli 78 6.14 1,210 1,210 3,553,320 75 Ardahan 79 4.49 1,117 1,117 3,554,437 77 Yalova 80 5.24 755 755 3,555,192 69 Bayburt 81 2.42 408 408 3,555,600 79 Kilis