Embed Size (px)
Citation preview
Transportation Funding and SB 267August, 2017
Our ChallengeContinued Growth
2
All dollar figures
adjusted for inflation
$$$$$$$$$$$$$$$$$$$$$$$$$$$$$$$$$$$$$$$$$$$$$$$$$$$$$$
$$$$$$$$$
$125.70spent per person
3.3 M
1991
27.7 B vehicles miles traveled
$68.94spent per person
$$$$$$$$$$$$$$$$$$$$$$$$$$$$$$$$$$
2015
5.4 M
50.5 Bvehicle miles traveled
$41.16spent per person
$$$$$$$$$$$$$$$$$$$$
2040
7.8 M
72.3 Bvehicle miles traveled
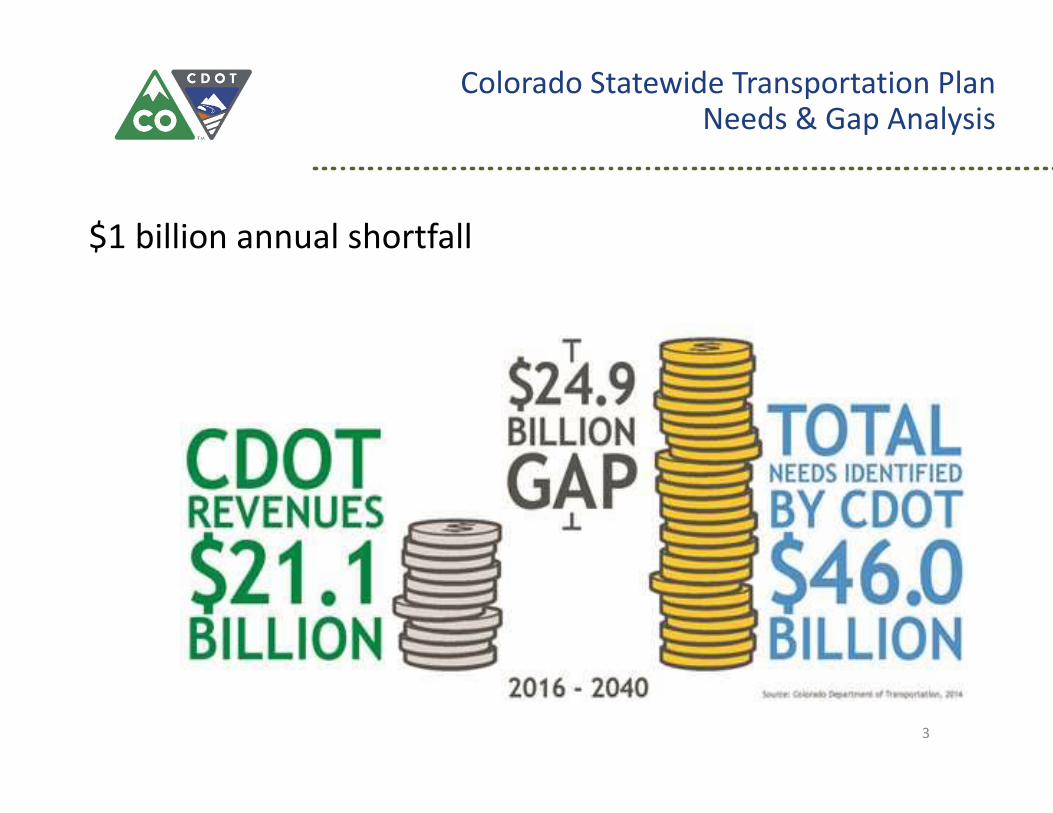
Colorado Statewide Transportation PlanNeeds & Gap Analysis
3
$1 billion annual shortfall
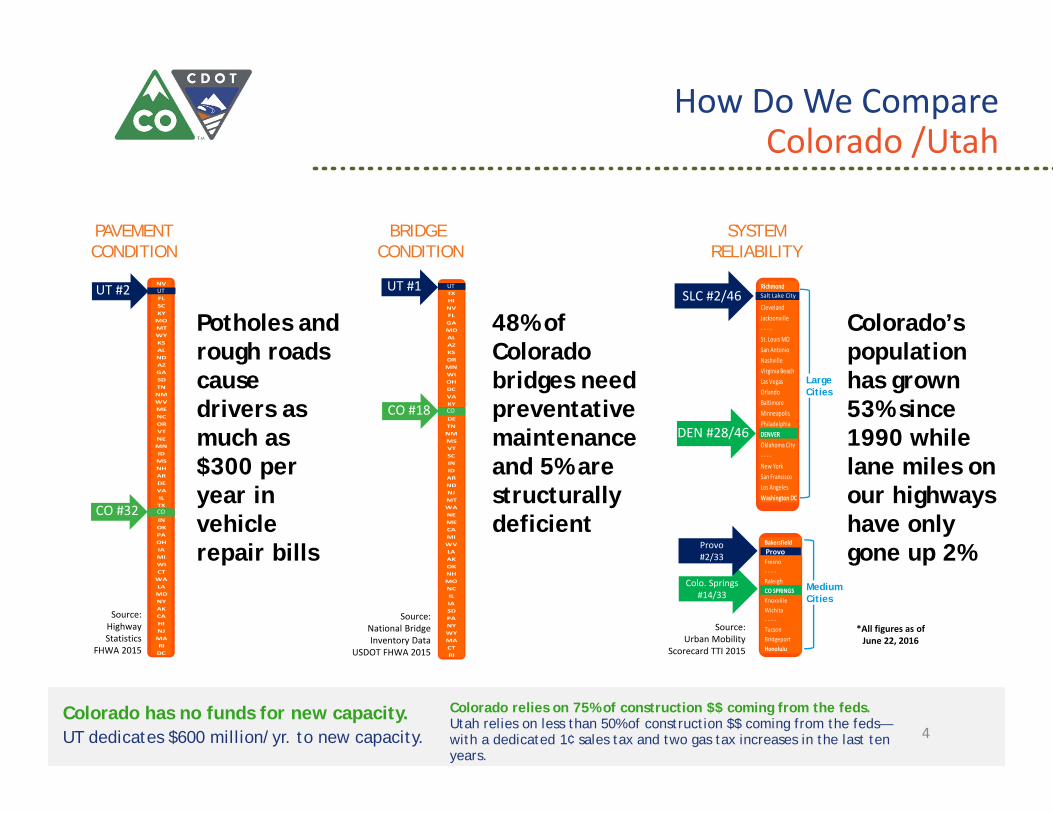
How Do We CompareColorado /Utah
4
Colorado relies on 75% of construction $$ coming from the feds. Utah relies on less than 50% of construction $$ coming from the feds—with a dedicated 1¢ sales tax and two gas tax increases in the last ten years.
Colorado has no funds for new capacity. UT dedicates $600 million/yr. to new capacity.
PAVEMENT CONDITION
Source:Highway Statistics
FHWA 2015
NVUTFLSCKYMOMTWYKSALNDAZGASDTNNMWVMENCORVTNEMNIDMSNHARDEVAILTXCOINOKPAOHIAMIWICTWALAMDNYAKCAHINJMARIDC
UT
CO #32
UT #2
CO
BRIDGE CONDITION
Source:National Bridge Inventory Data
USDOT FHWA 2015
UTTXHINVFLGAMDALAZKSORMNWIOHDCVAKYCODETNNMMSVTSCINIDARNDNJMTWANEMECAMIWVLAAKOKNHMONCILIASDPANYWYMACTRI
UT
UTUT #1
CO #18 CO
*All figures as ofJune 22, 2016
Source:Urban Mobility
Scorecard TTI 2015
SYSTEMRELIABILITY
Colo. Springs#14/33
RichmondSalt Lake CityClevelandJacksonville‐ ‐ ‐ ‐St. Louis MOSan AntonioNashvilleVirginia BeachLas VegasOrlandoBaltimoreMinneapolisPhiladelphiaDENVEROklahoma City‐ ‐ ‐ ‐New YorkSan FranciscoLos AngelesWashington DC
BakersfieldProvoFresno‐ ‐ ‐ ‐RaleighCO SPRINGSKnoxvilleWichita‐ ‐ ‐ ‐TucsonBridgeportHonolulu
Provo#2/33
Salt Lake City
Provo
LargeCities
MediumCities
Denver
SLC #2/46
DEN #28/46
48% of Colorado bridges need preventative maintenance and 5% are structurally deficient
Potholes and rough roads cause drivers as much as $300 per year in vehicle repair bills
Colorado’s population has grown 53% since 1990 while lane miles on our highways have only gone up 2%
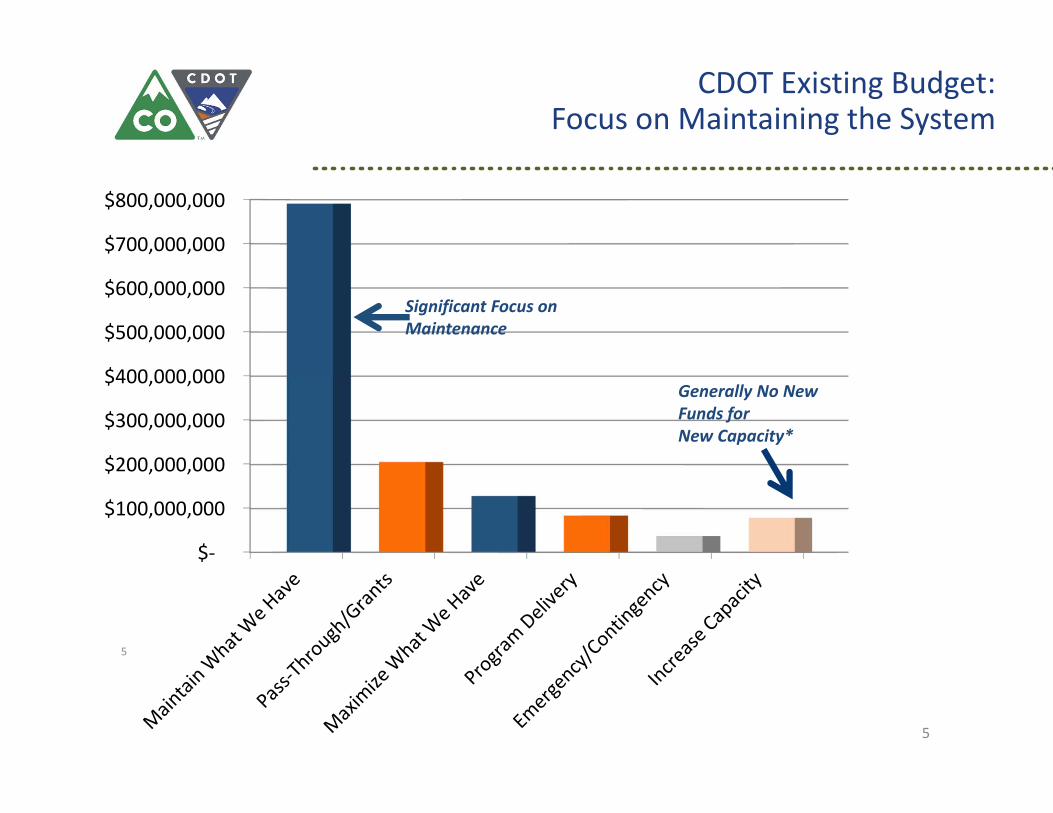
CDOT Existing Budget: Focus on Maintaining the System
5
$‐
$100,000,000
$200,000,000
$300,000,000
$400,000,000
$500,000,000
$600,000,000
$700,000,000
$800,000,000
Significant Focus on Maintenance
Generally No New Funds for New Capacity*
5
Funding New Capacity?
6
Find Agreement. Plant the Seed.
7
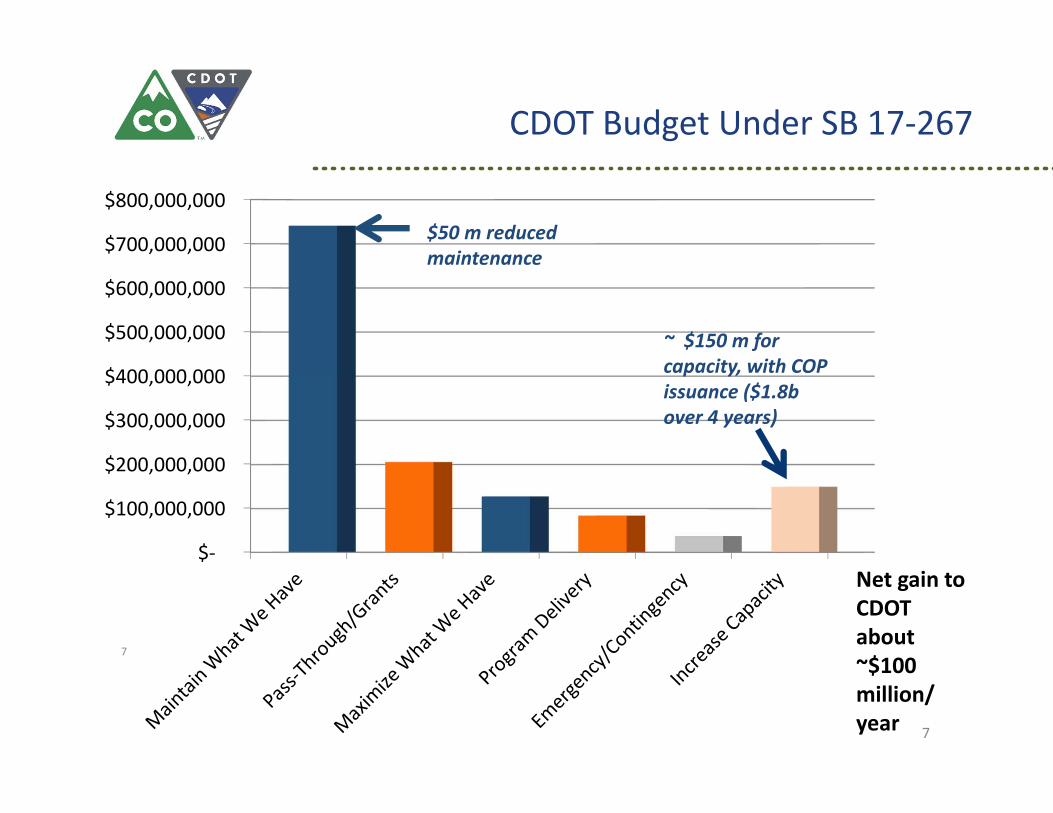
$‐
$100,000,000
$200,000,000
$300,000,000
$400,000,000
$500,000,000
$600,000,000
$700,000,000
$800,000,000
~ $150 m for capacity, with COP issuance ($1.8b over 4 years)
Net gain to CDOT about ~$100 million/ year
7
$50 m reduced maintenance
CDOT Budget Under SB 17‐267
SB 17‐267 Details
• Authorizes lease-purchase of state buildings beginning as soon as July 1, 2018 (or as late as June 30, 2019)
• CDOT “receives” $1.8B of proceeds over 4 years– At least 25% to rural counties– At least 10% to transit
• CDOT responsibility= $50 million annually for 24 years• General Fund (or any other source) responsibility= Up
to ~$100 million annually for 24 years• SB 228 Transfer in FY18 is not affected ($79M) but out
year transfers are eliminated
Managing Expectations
$1.8 billion=• Less than 10% of
CDOT’s 20 year need• $1.2 billion is paid
for by CDOT existing budget
• Loss of FY ‘19 & FY ‘20 SB 228= $320 million
• Effectively provides a low interest loan to CDOT to move forward on a number of important projects
SB 17‐267: Next Steps‐ Timing
Creation of a $1.88 billion list• Timing
– TC and STAC have discussed several times this summer– TC hopes to select first two years of projects before the
end of the year– Continue to work with transportation stakeholders– Funds may be used to match INFRA grant applications
• Staff was working towards refining the Tier 1 Development Plan into a “ballot list” - In June the TC received an updated list that contains refined cost estimates for projects that are in the Tier 1 grouping.
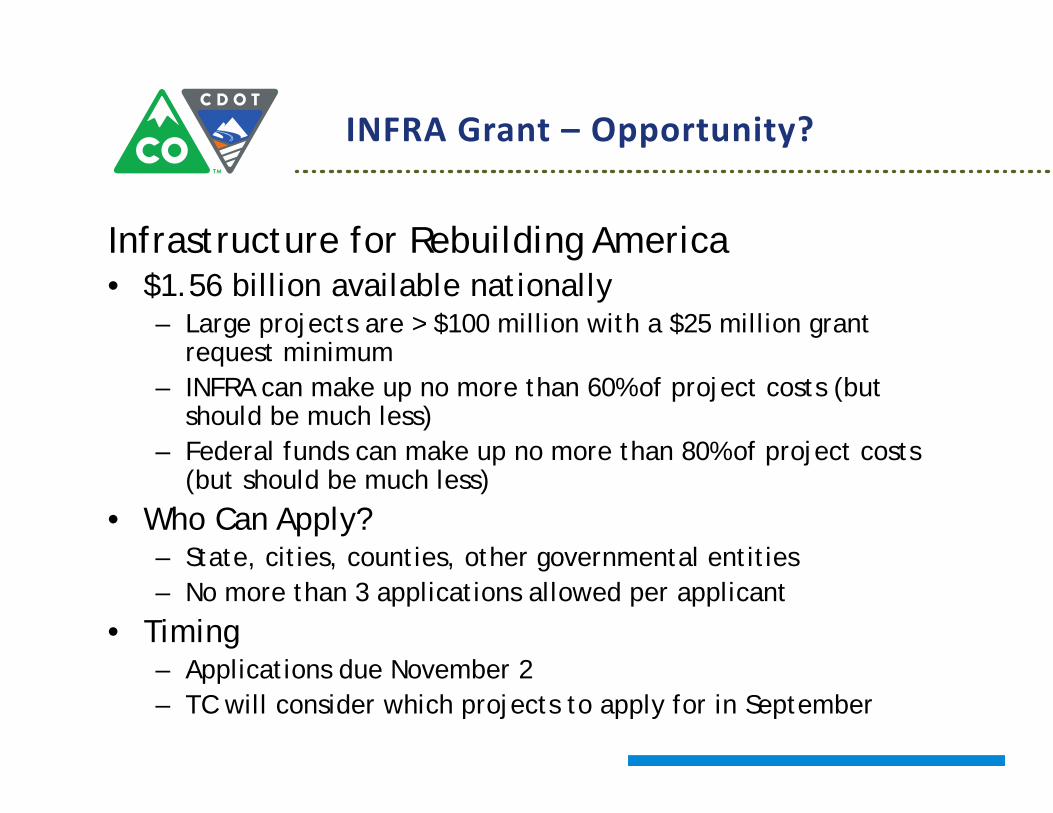
INFRA Grant – Opportunity?
Infrastructure for Rebuilding America• $1.56 billion available nationally
– Large projects are > $100 million with a $25 million grant request minimum
– INFRA can make up no more than 60% of project costs (but should be much less)
– Federal funds can make up no more than 80% of project costs (but should be much less)
• Who Can Apply?– State, cities, counties, other governmental entities– No more than 3 applications allowed per applicant
• Timing– Applications due November 2– TC will consider which projects to apply for in September
Questions ?
12