Embed Size (px)
DESCRIPTION
Transport Modelling – An overview of the four modeling stages. Lecture covers. Travel demand modeling concepts Four stage TDM Explanation Data requirements Forecasting. TRAVEL DEMAND ANALYSIS; MODELLING AND FORECASTING. The Four Stage TDM. The fours step process. - PowerPoint PPT Presentation
Citation preview

Prof. Dr. Mir Shabbar Ali
Transport Modelling– An overview of the
four modeling stages

• Travel demand modeling concepts• Four stage TDM• Explanation• Data requirements• Forecasting
Lecture covers

TRAVEL DEMAND ANALYSIS; MODELLING AND FORECASTING

The Four Stage TDM


The fours step
process


Key Concepts in transportation planning Model
• Long-run decrease in friction of distance
Distance
Inte
ract
ion
t1
t2 t3
Due to innovations in transportation methodsand improvements in media themselves
Result: Lowered average ton-mile costs of transportationand decreased importance of transport costs as afactor cost AND other costs rise in importance

Four basic elements of the urban transportation forecasting process
Data collection (population, land use, etc.)
Economic activity (employment, sales volume, income, etc.), land use (type, intensity), travel characteristics (trip and traveler profile), and transportation facilities (capacity, travel speed, etc.), population and demography, Origin-destination trip data.
Analysis of existing conditions and calibration
Analyze the data collected in the data collection stage. You may build mathematical models describe the existing conditions and then use the relationships you have found in the existing parameters to forecast future values.
Forecast of future travel demand
4-step transportation demand forecasting process
Analysis of the results
Analyze what you get from the 4-stop demand forecasting process

Comprehensive Transportation Planning Dimensions
• Economic• Social• Environmental

Why Use Travel Demand Models
• A relationship between transport system and indicators– Access– Purpose– Frequency– Use T
Land use
Travel behavior
System performance
TRAVEL DEMAND
MODEL
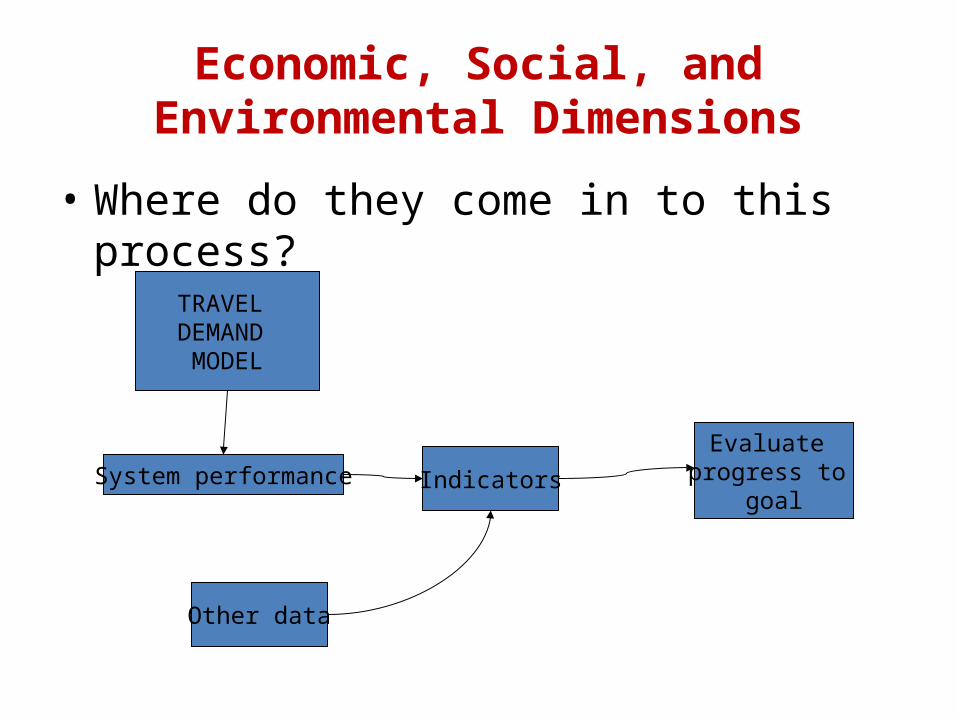
Economic, Social, and Environmental Dimensions
• Where do they come in to this process?
System performance
TRAVEL DEMAND
MODEL
Indicators
Other data
Evaluate progress to
goal

…through performance indicators• For example:
– Commute speed– Land use mix– Transport diversity– Transport equity
Residential Employment
Service
ResidentialEmployment
Service

Example
• Model output = travel times between all points
• Indicator: Commute speed• Indicator: Land use mix• Indicator: Transport diversity• Indicator: Equity
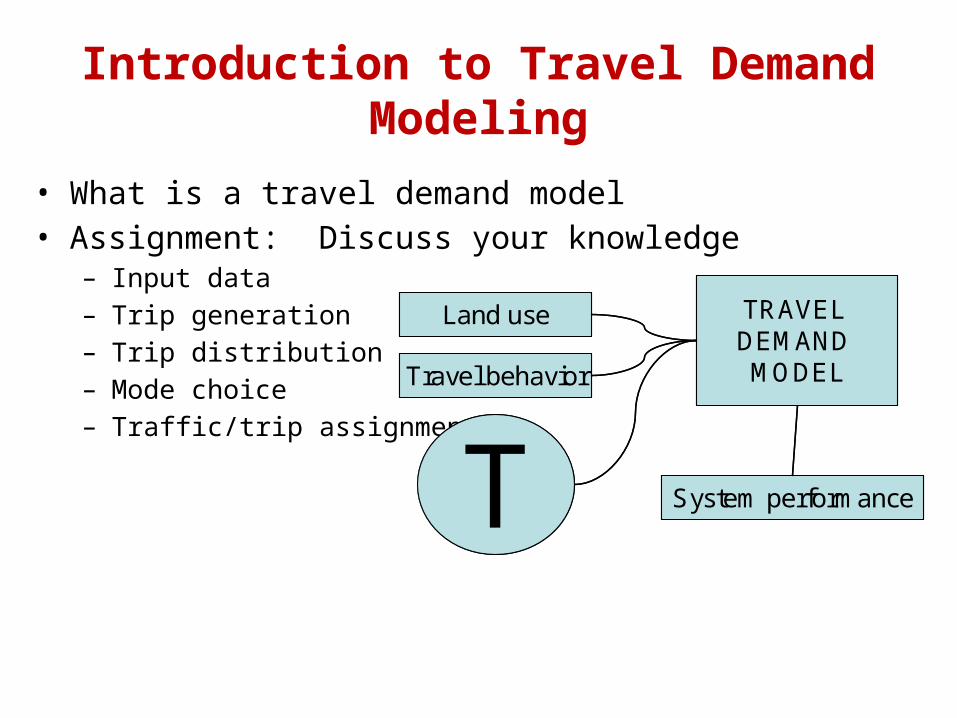
Introduction to Travel Demand Modeling
• What is a travel demand model• Assignment: Discuss your knowledge
– Input data– Trip generation– Trip distribution– Mode choice– Traffic/trip assignment
T
Land use
Travel behavior
System performance
TRAVEL DEMAND MODEL
T
Land use
Travel behavior
System performance
TRAVEL DEMAND MODEL

Four Step Travel Demand Model (FSTDM)
Step 1: Trip Generation
Step 2: Trip Distribution
Step 3: Mode Choice
Step 4: Trip/ Traffic Assignment
Demographic Data
Transportation Network

Trip Generation Questions
• How much do people use the transport system?
• Why do people use the transport system?
• Where can different types of activities be satisfied?

Productions and Attractions

Types of Urban MovementsMovement Type
Pattern Dominant Time Destination
Pendular Structured Morning and afternoon
Localized (employment)
Professional Varied Workdays Localized
Personal Structured Evening Varied with some foci
Touristic Seasonal Day Highly localized
Distribution Structured Nighttime Localized
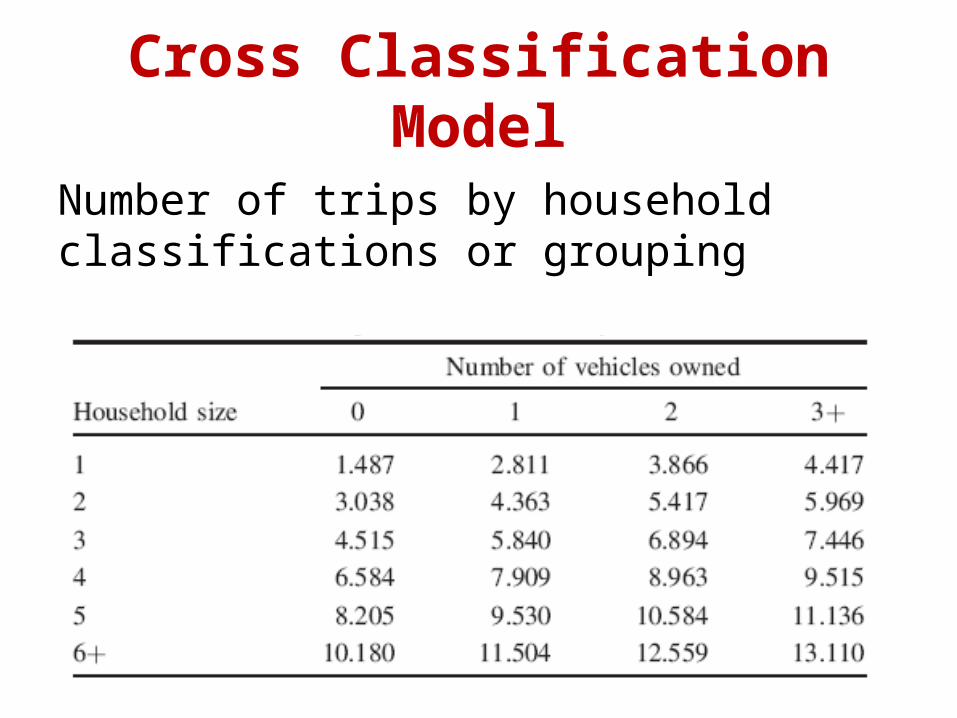
Cross Classification Model
Number of trips by household classifications or grouping

Trip Distribution Questions
• Given a location, where do people go to satisfy demand for an activity type?

Trip Distribution Models
• Gravity Model
– Tij = Ti
• Tij = trips from zone i to zone j• Ti = total trips originating at zone i• Aj = attraction factor at j• Ax = attraction factor at any zone x• Cij = travel friction from i to j expressed as a generalized cost function• Cix = travel friction from i to any zone x expressed as a
generalized cost function• a = friction exponent or restraining influence
Sum (Ax / Cix)a Aj / Cij
a
You can consider this as theprobability spatial distribution
P(Tj)

O - D Matrix Example:
Destinations
123456Sum
Origins 1 2 3 4 5 6 SumT11 T12 T13 T14 T15 T16 O1
T21 T22 T23 T24 T25 T26 O2
T31 T32 T33 T34 T35 T36 O3
T41 T42 T43 T44 T45 T46 O4
T51 T52 T53 T54 T55 T56 O5
T61 T62 T63 T64 T65 T66 O6
D1 D2 D3 D4 D5 D6

What is modal split?
Split trips to different available transportation modes, by analyzing people’s decisions regarding mode of travel they use.
Can be done here
Trip-end modelsvs.
Trip-interchange models

Mode choice Questions
• How do people use the transport system?– What modes do they choose?– How do they react to varying transport service
quality?

What affects people’s mode choice?
Characteristics of the trip maker: Income, # of autos available, family size, residential density, gender
Characteristics of the trip: trip distance, time of day, trip purpose
Characteristics of the transportation system: riding time, waiting time, transfers, out-of-pocket cost

Direct-generation usage models (Trip-end models)
Generate trips for transit and highway users separately meaning transit users use only transit (“captive” users).
Used for small communities or in developing countries where ridership is primarily a function of socioeconomic variables

Direct-generation usage models (Trip-end models) (cont)
Same categories but different trip rates
Or, use separate models, like:P(T) = A + B(POP) – C(INC)P(A) = A + B (POP) – C(AUTO)
Advantage: SimplicityDisadvantage: Cannot reflect “change of mind” of trip makers responding to policy and service changes
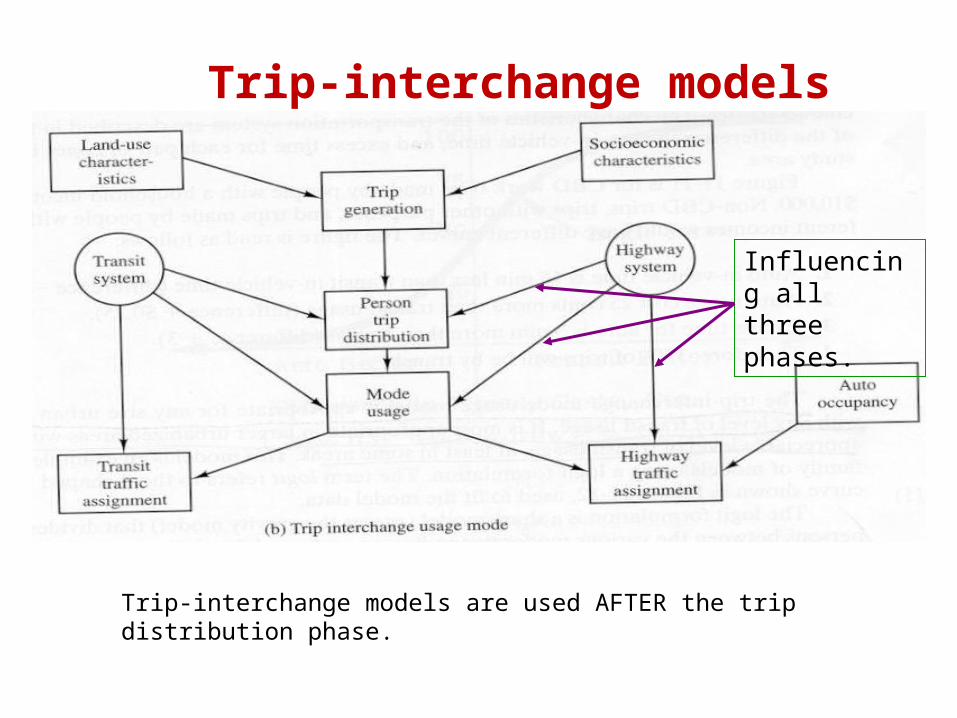
Trip-interchange models
Trip-interchange models are used AFTER the trip distribution phase.
Influencing all three phases.

Trip-interchange models (cont)
Because trip-interchange models are used after trip distribution, they can utilize the service characteristics of the modes available for the given trip, along with any relevant socioeconomic characteristics to determine the modal splits. This is the preferred and overwhelmingly typical approach for urban areas in which significant transit service exists and in which the “competition” between auto, transit, and other modes of travel must be explicitly considered.

Trip-interchange models (cont)Let’s see how service and trip makers characteristics can affect the trip maker’s decision using Fig. 11-11.
1. In-vehicle time (Auto – Transit) = -15 min
2. Out of pocket cost (Auto – Transit) = 25 cents
3. Excess time (Auto – Transit) = 3 min
4. If so, 37% of trips will be made by transit.
Looks like a logit curve…
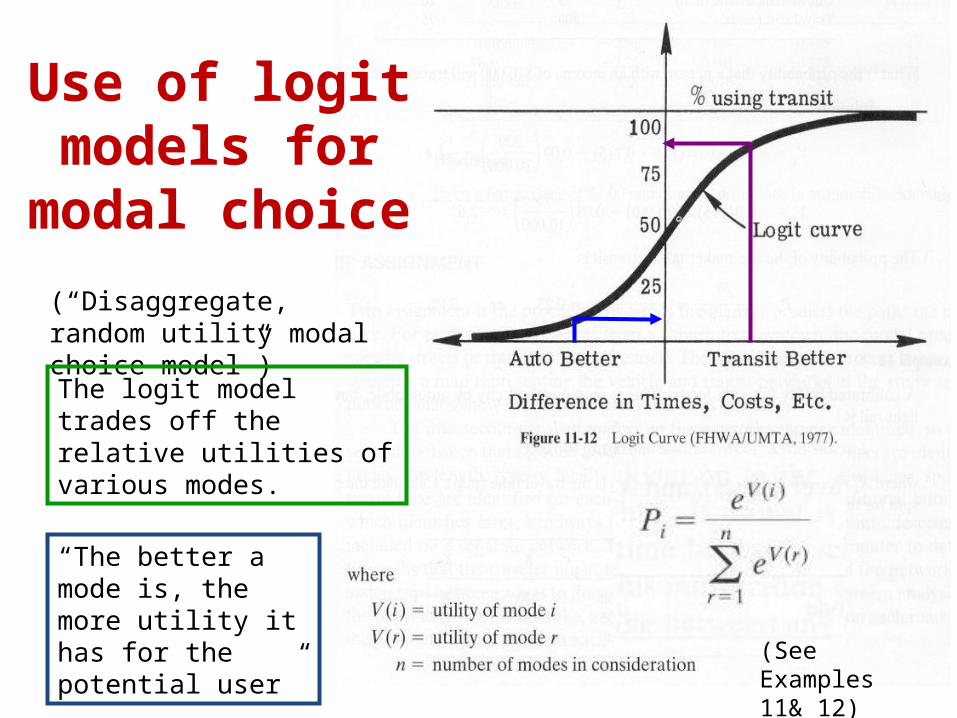
(“Disaggregate, random utility modal choice model”)
The logit model trades off the relative utilities of various modes.
“The better a mode is, the more utility it has for the potential user”
(See Examples 11& 12)
Use of logit models for
modal choice

Trip / Traffic Assignment Questions
• How do people use the transport system?– Given a mode, which route do they choose?– Do they satisfy multiple activities in one tour?– Which parts of the transport system do they use?– How do they react to varying transport service
quality?


Network Level of Service
z Highwayy Travel distance ijy Travel time ijy Travel Cost
z Transity Walk time ijy First wait ijy In-vehicle time ijy Transfer time ijy Fare ijy Number of transfersy Drive access areasy Walk access areas

Road Sections with more than 100,000 Vehicles/Day

Top 20 Road Sections in terms of Traffic Volume

Demographic Data
• Autos per household• Income level• Household size

Network Data• Highway network
• Transit network
• Graph


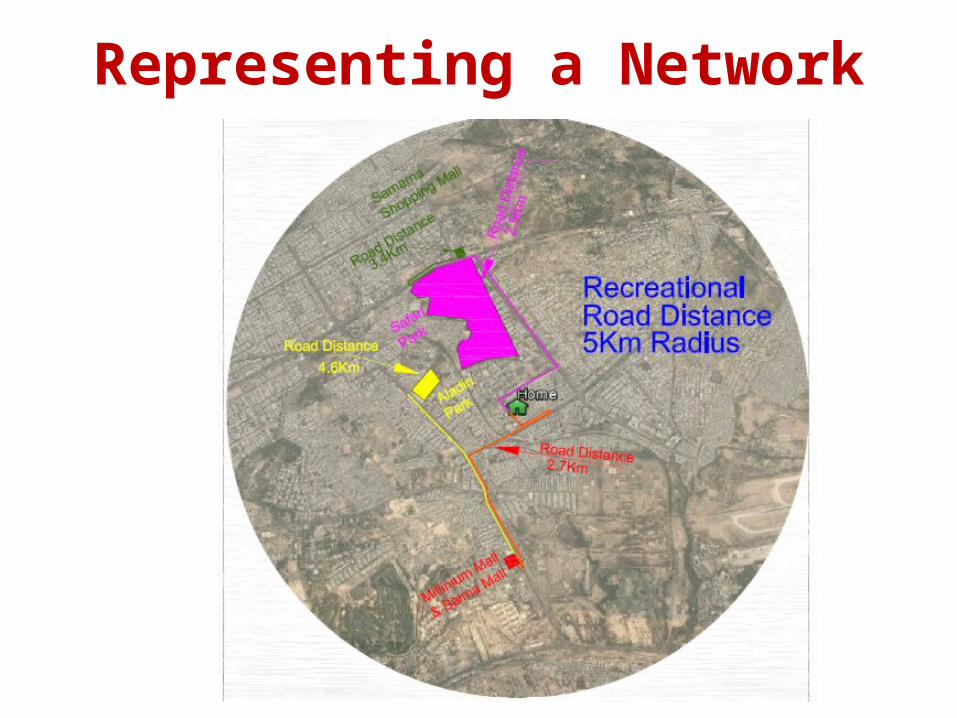
Representing a Network

Explanations and working
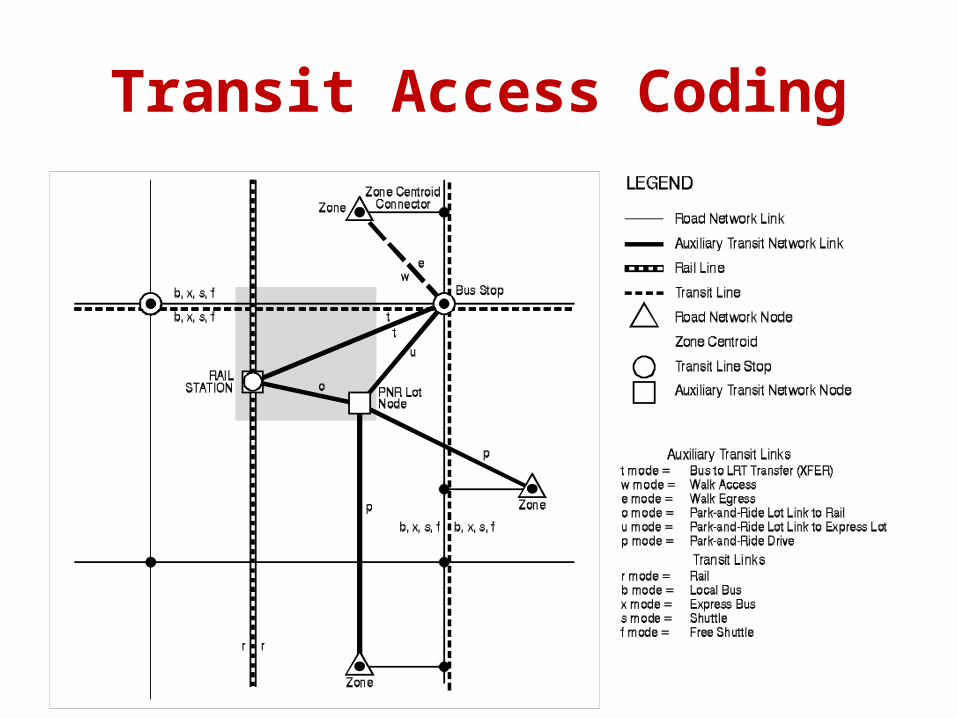
Transit Access Coding

AM Peak Period Bus Travel Time Factor
TRAVEL TIME FACILITY TYPEAREA TYPESERVICEFACTOR
1.44FREEWAYS1 - 5EXPRESS
1.53SURFACE ROADS1 - 3EXPRESS
1.83SURFACE ROADS4 - 5EXPRESS
1.66ALL1 - 3LOCAL
1.90ALL4 - 5LOCAL
3.00ALL1 - 5SHUTTLE


Carbon Monoxide ConcentrationsProjected for December 1995

Thanks