Embed Size (px)
Citation preview
FIRS T QUA R T ER 2010
TR ANSFORMING F INANCE
www.tdwi.org
TDWI BEST PRACTICES REPORT
By Wayne Eckerson
How CFOs Use Business Intelligence to TurnFinance from Record Keepers to Strategic Advisors

Research Sponsors
MicroStrategy
Oracle
Teradata
Visual Mining
www.tdwi.org 1
© 2010 by TDWI (The Data Warehousing InstituteTM), a division of 1105 Media, Inc. All rights reserved. Reproductions in whole or in part are prohibited except by written permission. E-mail requests or feedback to [email protected]. Product and company names mentioned herein may be trademarks and/or registered trademarks of their respective companies.
Table of ContentsResearch Methodology . . . . . . . . . . . . . . . . . . . . . . 3
Executive Summary . . . . . . . . . . . . . . . . . . . . . . . . 4
Imagine a Future… . . . . . . . . . . . . . . . . . . . . . . . . 5
Opportunities . . . . . . . . . . . . . . . . . . . . . . . . . . . 5
The New Role for Finance . . . . . . . . . . . . . . . . . . . . 5
Single Version of Truth . . . . . . . . . . . . . . . . . . . . . . 7
A Growth Path . . . . . . . . . . . . . . . . . . . . . . . . . . . 9
BI Foundation . . . . . . . . . . . . . . . . . . . . . . . . . . 9
Operational Environment. . . . . . . . . . . . . . . . . . . . . 9
Analytic Output . . . . . . . . . . . . . . . . . . . . . . . . . 10
Obstacles. . . . . . . . . . . . . . . . . . . . . . . . . . . . . . 12
Stuck in the Mud . . . . . . . . . . . . . . . . . . . . . . . . . 12
Excel-based Silos . . . . . . . . . . . . . . . . . . . . . . . . . 13
Intractability of Spreadmarts . . . . . . . . . . . . . . . . . . . 14
Execution Challenges . . . . . . . . . . . . . . . . . . . . . . . 17
Best Practices . . . . . . . . . . . . . . . . . . . . . . . . . . . 19
Sponsorship and Partnership . . . . . . . . . . . . . . . . . . . 19
Data Warehouses and General Ledgers . . . . . . . . . . . . . . 21
Managing Excel . . . . . . . . . . . . . . . . . . . . . . . . . . 23
Recommendations . . . . . . . . . . . . . . . . . . . . . . . . . 24
Appendix: Office Depot Ramps Up BI for Finance . . . . . . . . 26
By Wayne Eckerson
TRANSFORMING F INANCEHow CFOs Use Business Intelligence to Turn
Finance from Record Keepers to Strategic Advisors
FIRST QUARTER 2010TDWI BEST PRACTICES REPORT
2 TDWI RESE ARCH
TRANSFORMING F INANCE
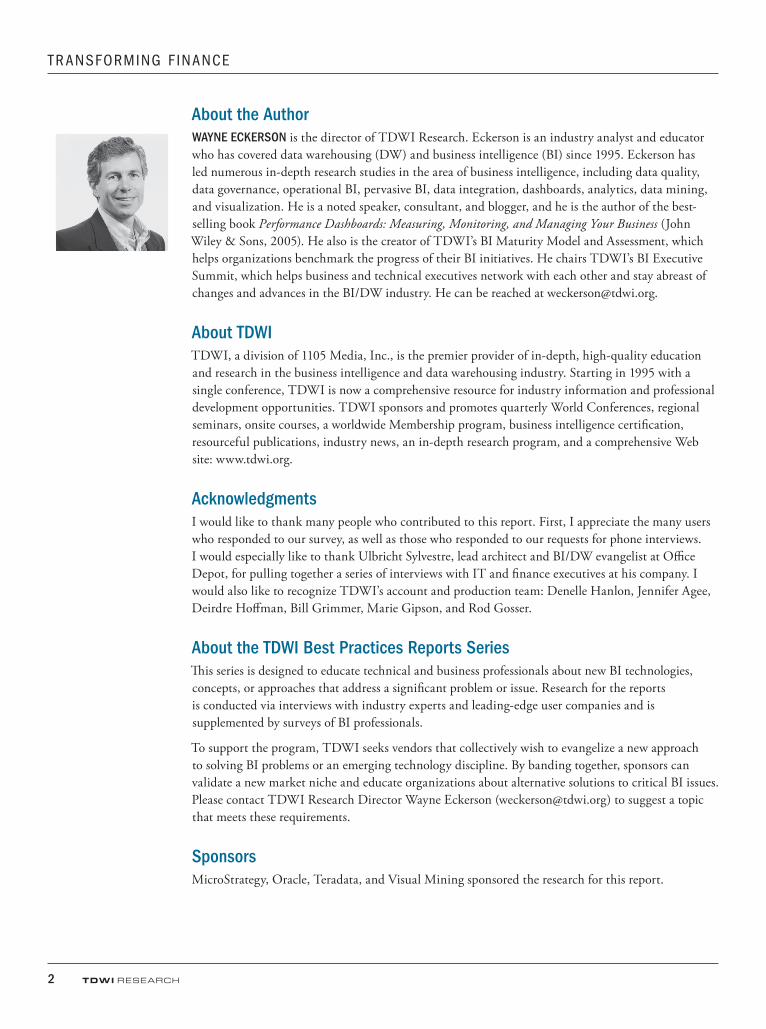
About the AuthorWAYNE ECKERSON is the director of TDWI Research. Eckerson is an industry analyst and educator who has covered data warehousing (DW) and business intelligence (BI) since 1995. Eckerson has led numerous in-depth research studies in the area of business intelligence, including data quality, data governance, operational BI, pervasive BI, data integration, dashboards, analytics, data mining, and visualization. He is a noted speaker, consultant, and blogger, and he is the author of the best-selling book Performance Dashboards: Measuring, Monitoring, and Managing Your Business (John Wiley & Sons, 2005). He also is the creator of TDWI’s BI Maturity Model and Assessment, which helps organizations benchmark the progress of their BI initiatives. He chairs TDWI’s BI Executive Summit, which helps business and technical executives network with each other and stay abreast of changes and advances in the BI/DW industry. He can be reached at [email protected].
About TDWITDWI, a division of 1105 Media, Inc., is the premier provider of in-depth, high-quality education and research in the business intelligence and data warehousing industry. Starting in 1995 with a single conference, TDWI is now a comprehensive resource for industry information and professional development opportunities. TDWI sponsors and promotes quarterly World Conferences, regional seminars, onsite courses, a worldwide Membership program, business intelligence certification, resourceful publications, industry news, an in-depth research program, and a comprehensive Web site: www.tdwi.org.
AcknowledgmentsI would like to thank many people who contributed to this report. First, I appreciate the many users who responded to our survey, as well as those who responded to our requests for phone interviews. I would especially like to thank Ulbricht Sylvestre, lead architect and BI/DW evangelist at Office Depot, for pulling together a series of interviews with IT and finance executives at his company. I would also like to recognize TDWI’s account and production team: Denelle Hanlon, Jennifer Agee, Deirdre Hoffman, Bill Grimmer, Marie Gipson, and Rod Gosser.
About the TDWI Best Practices Reports SeriesThis series is designed to educate technical and business professionals about new BI technologies, concepts, or approaches that address a significant problem or issue. Research for the reports is conducted via interviews with industry experts and leading-edge user companies and is supplemented by surveys of BI professionals.
To support the program, TDWI seeks vendors that collectively wish to evangelize a new approach to solving BI problems or an emerging technology discipline. By banding together, sponsors can validate a new market niche and educate organizations about alternative solutions to critical BI issues. Please contact TDWI Research Director Wayne Eckerson ([email protected]) to suggest a topic that meets these requirements.
SponsorsMicroStrategy, Oracle, Teradata, and Visual Mining sponsored the research for this report.
www.tdwi.org 3
Research Methodology
What is your position?*
Business intelligence or IT professional 46%
Finance executive or business sponsor or user 18%
Consultant or systems integrator 28%
Other 7%
Academic 1%
What are the annual revenues of your organization?
Less than $100 million 28%
$100 to $500 million 17%
$500 million to $1 billion 10%
$1 to $5 billion 18%
$5 to $10 billion 6%
$10 billion+ 11%
Don’t know 10%
Where are you located?
United States 63%
Europe 10%
Canada 7%
Asia 7%
Central or South America 4%
Australia 2%
Other 7%
What industry are you from?
Consulting 12%
Software 12%
Banking 8%
Healthcare 6%
Insurance 6%
Manufacturing (non-computers) 6%
Telecommunications 5%
Financial Services 4%
Retail 4%
Other 37%
*“Position” based on 282 survey respondents; all other demographics and figures based on 278 respondents.
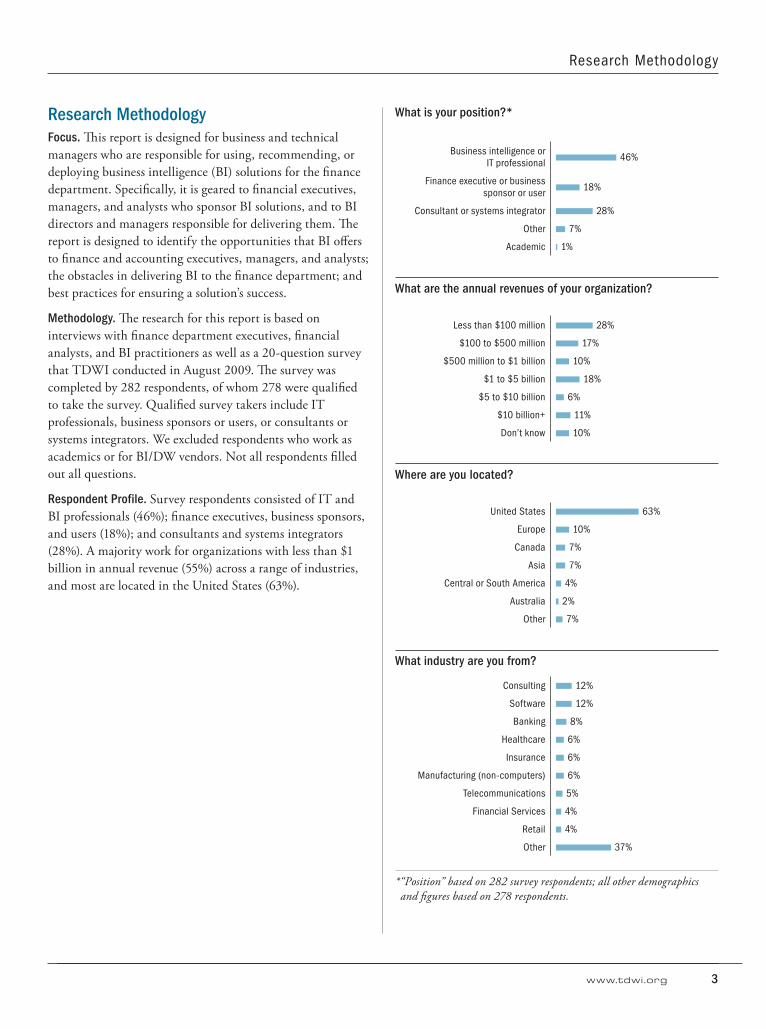
Research MethodologyFocus. This report is designed for business and technical managers who are responsible for using, recommending, or deploying business intelligence (BI) solutions for the finance department. Specifically, it is geared to financial executives, managers, and analysts who sponsor BI solutions, and to BI directors and managers responsible for delivering them. The report is designed to identify the opportunities that BI offers to finance and accounting executives, managers, and analysts; the obstacles in delivering BI to the finance department; and best practices for ensuring a solution’s success.
Methodology. The research for this report is based on interviews with finance department executives, financial analysts, and BI practitioners as well as a 20-question survey that TDWI conducted in August 2009. The survey was completed by 282 respondents, of whom 278 were qualified to take the survey. Qualified survey takers include IT professionals, business sponsors or users, or consultants or systems integrators. We excluded respondents who work as academics or for BI/DW vendors. Not all respondents filled out all questions.
Respondent Profile. Survey respondents consisted of IT and BI professionals (46%); finance executives, business sponsors, and users (18%); and consultants and systems integrators (28%). A majority work for organizations with less than $1 billion in annual revenue (55%) across a range of industries, and most are located in the United States (63%).
4 TDWI RESE ARCH
TRANSFORMING F INANCE
Executive SummaryOpportunity. The finance department sits at the information nexus of the organization. It regularly collects financial and non-financial data from every business unit and consolidates that information into summary and detailed management reports. Finance can therefore be a powerful agent of organizational change. It can leverage the information that it collects to assist executives and line of business managers to optimize processes, achieve goals, avert problems, and make decisions.
Obstacles. However, most finance departments have yet to step up and advise the business in a proactive manner. Most are stuck playing a back office role: they are forced to spend too much time producing internal and statutory financial reports, which leaves little time to analyze data and collaborate with business managers about how to improve the business. In the process of producing all these reports, finance teams create information silos, using spreadsheets and other low-cost tools, that interfere with top executives’ ability to obtain a consistent view of enterprise performance.
Partners with IT. Forward-thinking finance departments have figured out how to transform themselves from back-office bookkeepers to strategic advisors. They have learned to partner with the IT department—more specifically, the business intelligence (BI) team—whose job is to manage information and deliver a single version of corporate truth. In so doing, they have liberated themselves from manual data collection and report production processes so they can engage in more value-added activities.
Business Intelligence. To succeed, the BI team must create a data warehousing environment that contains all the data that the finance department needs, with the appropriate rules and calculations already applied. The data must reconcile to the penny with operational reports generated from the general ledger. The BI team must also provide reporting, analysis, dashboard, and planning tools that access the data warehouse as well as other data sources and empower finance users to explore data on their own without IT assistance.
Growth Path. Once the BI team delivers a solid BI infrastructure, the finance department can spend 80% of its time analyzing data instead of collecting it. They can work proactively with the business to forecast the future instead of report on the past. Armed with analytical insights, the finance department can collaborate with business managers to optimize pricing, reduce inventory, streamline procurement, or improve product profitability. They can help business managers evaluate options, such as whether to add more salespeople, change commission fees, partner with a new supplier, or change merchandising assortments.
www.tdwi.org 5
Oppor tunities
Opportunities
The New Role for FinanceThe scenarios just depicted may seem fanciful to some, but they are the reality at a growing number of companies in which the finance department has transformed itself from a back-office provider of accounting services to a strategic advisor to the business. To facilitate this metamorphosis, forward-thinking finance departments have reengineered how they handle information, treating it as a valuable corporate resource that not only paints a picture of the past but also paves a clear path to the future.
Historical Role. Historically, the finance department has kept the books, managed the budget, and looked after cash, capital, taxes, treasury, and statutory reporting. But there is less tolerance in an increasingly competitive global economy for people and processes that don’t add direct value to an organization. As with other shared services (e.g., information technology and human resources),
IMAGINE A FUTURE…• Imagine a future in which the CEO calls a meeting of finance, sales, and other unit heads and their
analysts and everyone agrees on revenue, profit, and cost numbers. Instead of arguing about whose
numbers are right, the team spends the meeting identifying issues of concern, discussing options,
and agreeing on corrective actions. Decisions are made based on facts, not gut feel, tradition, or
arm twisting.
•Imagine a CFO who checks the company’s overall profit and loss position daily and, with a click of
the mouse, views the contributions of every region, group, and product line, and then drills down to
view individual orders and expenditures at a product, customer, or supplier level. Armed with this
information, the CFO alerts business unit managers to process and performance anomalies and
suggests actions to remedy the issues.
•Imagine a vice president of finance who can assess at a glance the company’s progress toward
strategic goals at all levels of the organization and drill down to view the performance of any group,
region, or area without IT’s assistance. To ensure various departments meet their goals, the VP
requests that managers and staff in the field update plans and forecasts, which are automatically
collected and consolidated within hours. The VP then works closely with department heads to tweak
their investment strategies, hiring practices, and other plans.
•Imagine a controller who can automate the consolidation and standardization of financial
transactions across a global company in a few seconds and generate period-ending statutory
reports in a few hours or days. The controller could reassign analysts who spend most of their time
collecting, adjusting, and reconciling data to more value-added activities and confidently assure
top executives that all financial reports are accurate and comply with pertinent regulations.
•Imagine a financial analyst who can go one place to find all the information she needs to conduct
an ad hoc analysis for an executive or who can generate a standard report without having to
perform countless conversions using custom business rules and macros in unaudited and error-prone
spreadsheets. The analyst could spend an extra two to three days a week helping business managers
evaluate ways to optimize their operations instead of performing low-level data management tasks
and proliferating spreadmarts that undermine information consistency.
6 TDWI RESE ARCH
TRANSFORMING F INANCE
there has been a movement in the past decade to transform these finance functions into more active contributors to the bottom (and top) lines of the organization.
Finance, in particular, can be a powerful agent of organizational change. That’s because it sits at the information nexus of the organization. It collects financial and non-financial data from every business unit on a regular basis and consolidates that information into summary and detailed management reports. But to add real value to the organization, finance needs to move beyond basic data collection and reporting. It must mine the information it collects for trends, patterns, and insights so it can advise the business how best to improve operations, optimize performance, and adapt to changing business conditions.
Partnering with the Business. Forward-thinking finance departments form tight partnerships with the business. They collaborate with business managers on a range of issues that ultimately drive financial performance: how to optimize pricing; reduce inventory; rationalize sales commissions; improve the profitability of merchandise assortments; reduce call center costs without affecting service; streamline provisioning and procurement processes, and make build-versus-buy decisions. Finance might also help the business evaluate whether to extend store hours, source parts from a new supplier, merge with another company, or take on a new partner.
“We need to collaborate with the business if we are going to improve the financials,” says a CFO from a major online retailer who asked not to be named. “Showing them actuals and targets isn’t enough; we need to help them reengineer fundamental processes. In short, we need to change from being a financial record keeper to a proactive partner with the business.”
Room to Improve. Unfortunately, the majority of finance departments have yet to adopt this new role to a significant degree. Our survey shows that although the finance department has made strides toward becoming a trusted partner with the business, it still has a long way to go.
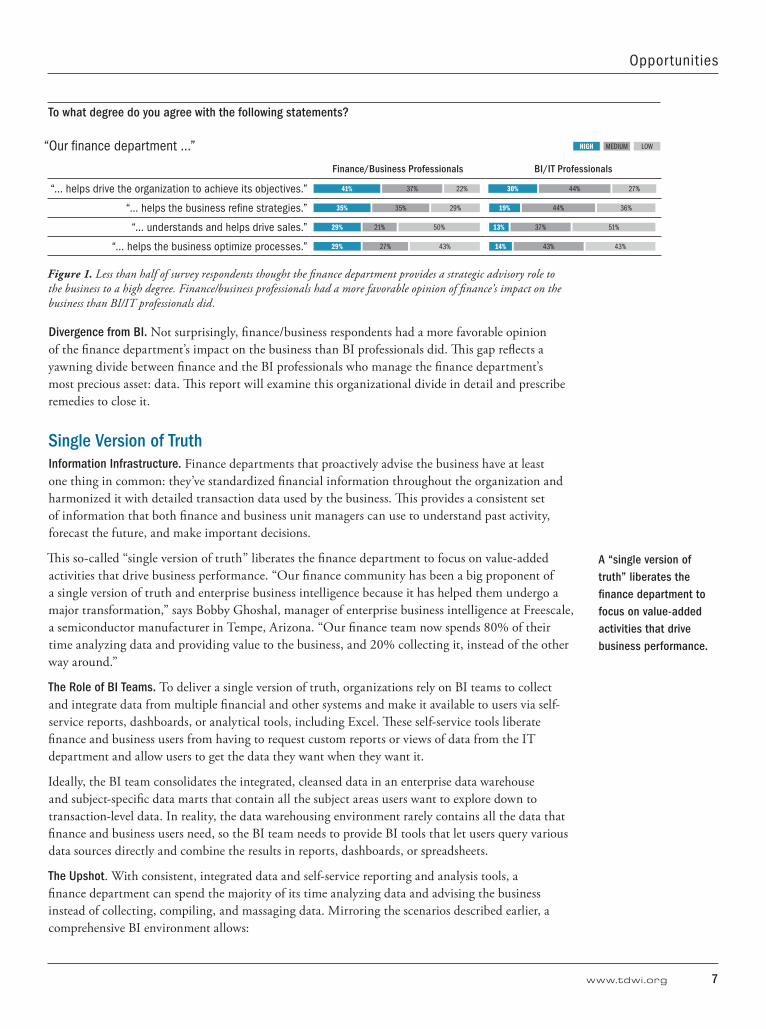
Less than half of financial professionals who responded to the survey believe their finance departments, to a high degree, help the organization “achieve its objectives” (41%), “refine strategies” (35%), “drive sales” (29%), or “optimize processes” (29%). In fact, more than 20% of finance professionals gave their finance teams a low rating in these areas, with a larger percentage saying in effect that the finance department does little or nothing to help the business “optimize processes” (43%) or “understand and help drive sales” (50%). (See Figure 1.)
However, when you examine the high and medium scores in each area, about three-quarters of finance professionals believe the finance department helps the business in these areas to some degree. This shows that finance understands its new role and is making progress toward fulfilling it but is not yet executing at a high level. This is good news, since the rallying cry about the need to transform finance has been around for more than a decade.
Finance can be a powerful agent of
organizational change because it sits at the
information nexus.
www.tdwi.org 7
Oppor tunities
To what degree do you agree with the following statements?
“Our finance department …”
Finance/Business Professionals BI/IT Professionals
“… helps drive the organization to achieve its objectives.” 41% 37% 22% 30% 44% 27%
“… helps the business refine strategies.” 35% 35% 29% 19% 44% 36%
“… understands and helps drive sales.” 29% 21% 50% 13% 37% 51%
“… helps the business optimize processes.” 29% 27% 43% 14% 43% 43%
Figure 1. Less than half of survey respondents thought the finance department provides a strategic advisory role to the business to a high degree. Finance/business professionals had a more favorable opinion of finance’s impact on the business than BI/IT professionals did.
Divergence from BI. Not surprisingly, finance/business respondents had a more favorable opinion of the finance department’s impact on the business than BI professionals did. This gap reflects a yawning divide between finance and the BI professionals who manage the finance department’s most precious asset: data. This report will examine this organizational divide in detail and prescribe remedies to close it.
Single Version of TruthInformation Infrastructure. Finance departments that proactively advise the business have at least one thing in common: they’ve standardized financial information throughout the organization and harmonized it with detailed transaction data used by the business. This provides a consistent set of information that both finance and business unit managers can use to understand past activity, forecast the future, and make important decisions.
This so-called “single version of truth” liberates the finance department to focus on value-added activities that drive business performance. “Our finance community has been a big proponent of a single version of truth and enterprise business intelligence because it has helped them undergo a major transformation,” says Bobby Ghoshal, manager of enterprise business intelligence at Freescale, a semiconductor manufacturer in Tempe, Arizona. “Our finance team now spends 80% of their time analyzing data and providing value to the business, and 20% collecting it, instead of the other way around.”
The Role of BI Teams. To deliver a single version of truth, organizations rely on BI teams to collect and integrate data from multiple financial and other systems and make it available to users via self-service reports, dashboards, or analytical tools, including Excel. These self-service tools liberate finance and business users from having to request custom reports or views of data from the IT department and allow users to get the data they want when they want it.
Ideally, the BI team consolidates the integrated, cleansed data in an enterprise data warehouse and subject-specific data marts that contain all the subject areas users want to explore down to transaction-level data. In reality, the data warehousing environment rarely contains all the data that finance and business users need, so the BI team needs to provide BI tools that let users query various data sources directly and combine the results in reports, dashboards, or spreadsheets.
The Upshot. With consistent, integrated data and self-service reporting and analysis tools, a finance department can spend the majority of its time analyzing data and advising the business instead of collecting, compiling, and massaging data. Mirroring the scenarios described earlier, a comprehensive BI environment allows:
A “single version of truth” liberates the finance department to focus on value-added activities that drive business performance.
HIGH MEDIUM LOW
8 TDWI RESE ARCH
TRANSFORMING F INANCE
• Financial analysts to spend less time producing standard financial reports and more time analyzing the root causes of performance anomalies and working proactively with the business to fix or avert problems.
• Financial managers to spend less time collecting financial and operational data and more time modeling scenarios and forecasting results to assist with major decisions about investments, product development, and staffing.
• Executives to avoid surprises at the end of the quarter because they can track daily performance at every level, enabling them to work proactively with the business to shore up areas of weakness before the end of the next financial period.
• Business executives to understand the profitability of every customer, product, and process on a daily basis and make major strategic decisions with confidence using facts not just intuition.
• Business executives to avoid embarrassing audits or costly penalties for failing to apply adequate controls to financial reports and delivering accurate data to financial stakeholders.
Office Depot. Many financial departments are now beginning to reap some, if not all, of these benefits. For example, Office Depot has constructed an enterprise data warehouse that aligns financial and product data at a detailed level. By merging financial and product hierarchies and data, Office Depot now has a common language that enables finance and merchandisers to communicate about product profitability and figure out ways to improve it.
In the company’s copy and print center, financial analysts using a variety of BI tools noticed that black-and-white copiers weren’t generating as much profit as color copiers, and they worked with the business managers to shift their inventory to color copiers. In another instance, financial managers noticed pricing discounts were edging higher than expected in several locations and notified business managers who took action.
“In the past, finance had its profit/loss statement and merchandising had its sales and gross margin reports by product, but the two weren’t connected,” says James Hoganson, director of sales accounting and reporting at Office Depot. “Now, both groups can see the profitability of individual products on a daily basis, which has enabled the business to change its strategies more quickly.”
AT&T Mobility. The finance department at AT&T Mobility has benefited from having a single version of truth delivered via a Teradata enterprise data warehouse, which now calculates the profitability of all 80 million of its subscribers daily. Consequently, financial analysts can now perform detailed analyses more quickly and accurately than in the past.
“If you lost 1% of your customers yesterday, wouldn’t you like to know today who they are and whether there might a common theme behind the churn? With the data warehouse, we can pinpoint those subscribers and work proactively to win them back,” says a director of financial analysis at the company. “Ten years ago, we made assumptions on samples of data and based decisions on gut feel or someone’s ability to argue an opinion. Now there is more precision.”
Having access to a unified set of data has changed the finance department’s relationship with the business. “We don’t spend a lot of time fact finding and guessing, because we know the facts,” says the manager. “We focus on working with the business to figure out the levers we need to pull to make an item on the income statement go up or down. This means finance needs to understand operations and the drivers that lead to higher revenue and lower cost without impacting the customer experience.”
AT&T Mobility’s data warehouse calculates the profitability of all
80 million subscribers every day.
“Office Depot now has a common language
for finance and merchandisers to
communicate about product profitability.”
www.tdwi.org 9
A Growth Path
A Growth Path
BI FoundationWhen an organization’s data house is in order, it can deliver an integrated view of the business from both a financial and operational perspective. This is a huge accomplishment, but it is only the beginning. Building on this BI foundation, not only do finance departments become more efficient, but they can also deliver data-rich applications that improve decision making, enhance corporate agility, and optimize performance.
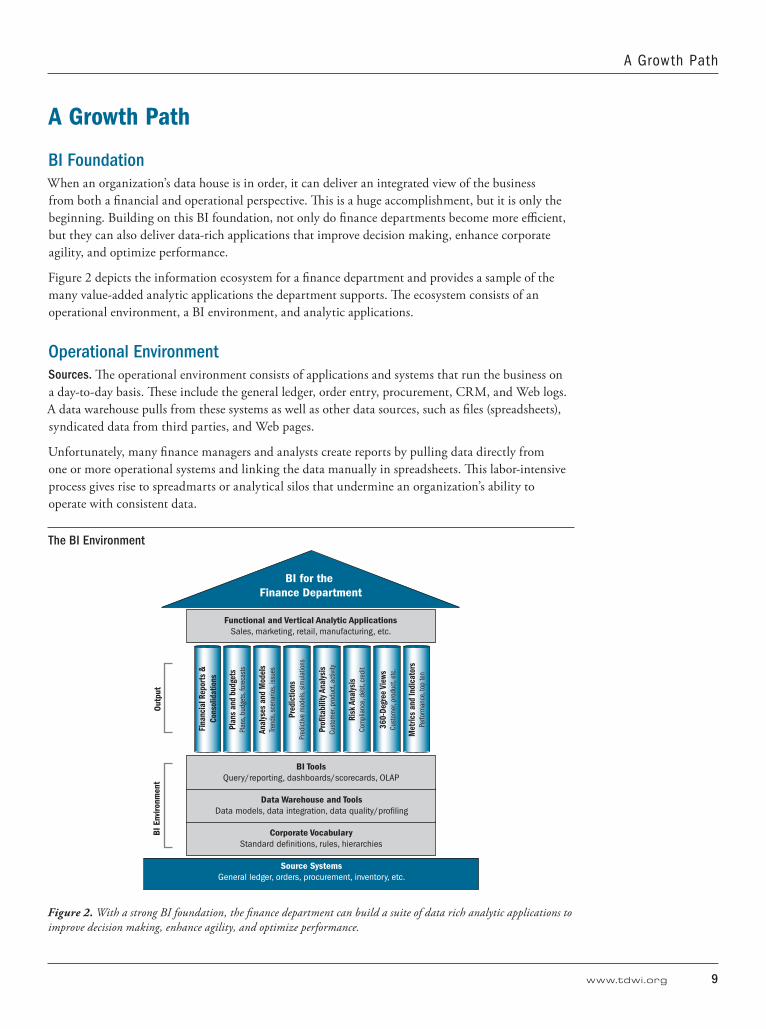
Figure 2 depicts the information ecosystem for a finance department and provides a sample of the many value-added analytic applications the department supports. The ecosystem consists of an operational environment, a BI environment, and analytic applications.
Operational EnvironmentSources. The operational environment consists of applications and systems that run the business on a day-to-day basis. These include the general ledger, order entry, procurement, CRM, and Web logs. A data warehouse pulls from these systems as well as other data sources, such as files (spreadsheets), syndicated data from third parties, and Web pages.
Unfortunately, many finance managers and analysts create reports by pulling data directly from one or more operational systems and linking the data manually in spreadsheets. This labor-intensive process gives rise to spreadmarts or analytical silos that undermine an organization’s ability to operate with consistent data.
The BI Environment
Figure 2. With a strong BI foundation, the finance department can build a suite of data rich analytic applications to improve decision making, enhance agility, and optimize performance.
BI for the Finance Department
Functional and Vertical Analytic ApplicationsSales, marketing, retail, manufacturing, etc.
Outp
ut
Source SystemsGeneral ledger, orders, procurement, inventory, etc.
Corporate VocabularyStandard de�nitions, rules, hierarchies
Data Warehouse and ToolsData models, data integration, data quality/pro�ling
BI ToolsQuery/reporting, dashboards/scorecards, OLAP
Fina
ncia
l Rep
orts
&Co
nsol
idat
ions
Plan
s an
d bu
dget
sPl
ans,
budg
ets,
fore
cast
s
Anal
yses
and
Mod
els
Trend
s, sc
enar
ios,
issue
s
Pred
ictio
nsPr
edict
ive m
odel
s, sim
ulat
ions
Pro�
tabi
lity A
nalys
isCu
stom
er, p
rodu
ct, a
ctivi
ty
Risk
Ana
lysis
Com
plia
nce,
deb
t, cr
edit
360-
Degr
ee V
iews
Cust
omer
, pro
duct
, etc
.
Met
rics
and
Indi
cato
rsPe
rform
ance
, top
ten
BI E
nviro
nmen
t
10 TDWI RESE ARCH
TRANSFORMING F INANCE
Corporate Vocabulary. The centerpiece of a BI environment is an enterprise data warehouse that integrates data from operational systems, the general ledger, and other sources. It provides a common information infrastructure required to deliver a single version of truth. However, a data warehouse can’t work its magic unless the organization has documented and agreed upon a common vocabulary—or set of metadata or master data—that defines what things mean and how they are categorized or calculated. Without this vocabulary, the data warehouse is no better than a Tower of Babel. Or as IT professionals like to say, “Garbage in, garbage out.”
Data Warehouse and Tools. The data warehouse stores the integrated operational data and makes it available to users for query, reporting, and analysis. The data should be stored at a detailed level, linked by common keys so users can traverse subject areas easily, and updated frequently to give users the timeliest data possible. A data warehouse might consist of multiple logical or physical data marts that represent subsets of the data tailored to individual groups. Data integration tools are needed to move and transform data from source systems to the data warehouse or data mart. These include extract, transform and load (ETL), data quality and cleansing, and data quality tools.
BI Tools. There are dozens of BI tools on the market today that come in all shapes and sizes, and most companies have more BI tools than they need. Major categories include reporting tools, analysis (OLAP) tools, dashboards, scorecards, and predictive analytics. Many organizations are trying to standardize on a single BI platform that provides capabilities in each of these areas to avoid BI tool shelfware and reduce overall costs. But many companies still opt for best of breed tools to handle specific tasks or which are preferred by various groups of users.
Analytic OutputFinancial Reports. With a BI environment in place, organizations can begin delivering analytical content to decision makers. The most predominant content is financial reports, including production, management, and statutory reports. These provide a historical view of organizational activity and performance, along with comparisons to budgeted plans and prior reporting periods.
Financial reports require consolidation tools that pull and merge data from multiple general ledgers; handle currency conversions, intercompany eliminations, and minority ownership; and convert data to various accounting standards, such as U.S. Generally Agreed upon Accounting Principles (GAAP) and International Financial Reporting Standards (IFRS). Ideally, management reports provide an integrated view of financial and transactional data so users can drill down from financial summaries into the business activity (i.e., sales, expenditures, charges) that generated them.
Dashboards, such as those provided by Visual Mining and MicroStrategy, are essentially visual reports that focus on the key drivers of business performance. Dashboards track performance against metrics aligned with strategic, tactical, or operational objectives. Many metrics are financial in nature (usually called lagging indicators) but others focus on value drivers that predict financial performance (usually called leading indicators). There are also diagnostic or activity metrics that track items of interest to executives or managers, such as top ten customers by revenue or volume or top ten products by sales.
Plans and Budgets. Armed with planning and budgeting tools, organizations can replace manual, spreadsheet-intensive processes with software that automates the distribution, collection, and consolidation of planning data. These tools make it easy and quick to incorporate input from the field into the latest estimate and forecast. Planning software also centralizes assumptions so that everyone who contributes to the plan works by the same rules. Rules might include the exchange rate used to convert currencies or the fully loaded cost of a staff-level employee.
Without a corporate vocabulary, the data
warehouse is no better than a Tower of Babel.
www.tdwi.org 11
A Growth Path
Planning tools also pull in actuals to make it easier for users to extrapolate numbers into the future and offer templates for various use cases, such as budgeting, demand planning, and workforce headcounts. The tools also export targets and goals to data warehouses, data marts, and dashboards so users can track actuals versus plans and forecasts in various types of reports.
Analyses and Models. Executives have many questions that can’t be addressed by reports or dashboards alone, such as, “Should we open another store?” “If we raise prices, what’s the impact on sales?” “Would it be better to fund this expansion through equity or debt?” “How will this partnership affect sales commissions and tax our network and service capacity?”
For these types of questions, executives rely on financial and business analysts equipped with analytical tools. Usually by default, the financial analyst’s tool of choice is Excel, although any tool that supports ad hoc queries and allows users to manipulate, analyze, and present results is a candidate. These include ad hoc query tools, OLAP cubes that let users slice and dice dimensional data, strategic modeling tools, data mining tools, visual discovery tools, and some dashboards that let users interact with data via charts and graphics at the speed of thought.
In addition, analysts will use Excel and planning tools to create “what if” models and “best case” and “worst case” scenarios. By surfacing assumptions as rules, users can quickly change the models to view different outcomes. These tools help executives make critical decisions about how to invest funds, manage capital, and deploy and pay staff.
Predictions. Predictions involve arming financial analysts with powerful analytical tools to explore large data sets and create models that predict future performance or behavior. The most basic form of prediction for financial managers is the forecast that extrapolates financial performance within a report or dashboard based on historical data. In addition, the finance department can use these tools to predict the obsolescence of factory floor machines. This enables them to devise more accurate capital plans and help plant managers avoid unexpected downtime.
Profitability and Risk Analysis. Profitability management calculates the profitability of every customer, product, and process so executives can make intelligent decisions about how to grow revenues and allocate resources. However, allocating costs to every customer or product is not easy and requires specialized software to design, track, manage, and apply the allocations so the results are meaningful and accurate.
Risk metrics help executives understand the potential pitfalls of decisions and calculate the potential adverse effects of current and future debt, credit, currency fluctuations, and other types of financial exposure. Together, profitability and risk metrics enable executives to steer a safe path through business minefields.
360-Degree Views. The finance department should lead the way in helping the organization create 360-degree views of key entities as well as deep dives into other relevant information. Every company should maintain a 360-degree view of customers, products, suppliers, employees, partners, and capital resources. It would be liberating for an executive or sales person to click on the customer dashboard and see a customer’s top sales reps and partners, as well as their booking, billing, shipment, backlog, and purchase history.
Subject Area Metrics. Besides 360-degree views, finance may want to track metrics for specific subjects, such as top products sold, top sales reps, cross-sell and upsell activities, account performance, period closes, sales cycles, pipelines, and hourly sales bookings. Such information would help executives track progress toward strategic goals and provide a competitive edge.
12 TDWI RESE ARCH
TRANSFORMING F INANCE
Obstacles
Stuck in the Mud Before the finance department can deploy analytic applications and play an advisory role in the organization, it needs to advocate for and help implement a common data infrastructure from which it can gather information and perform analyses that help the business. This means working with the IT department—or more specifically, the BI/DW team—to deliver a single version of financial and operational data.
Diverse Sources and Semantics. But getting control of financial data is challenging. Typically, financial data is spread across dozens of incompatible systems and applications, each with different accounts, codes, and transactions. Reconciling this morass of information—which may have resulted from multiple acquisitions or decentralized operations—places a huge strain on the finance department. To meet regulatory or fiduciary requirements and ad hoc requests from executives, the CFO hires boatloads of high-priced analysts that spend an inordinate amount of time ferreting out data wherever it exists and generating the requisite reports using whatever means necessary. This usually means manually cobbling together reports using Excel.
Unfortunately, these reports are chock full of custom rules, formulas, and macros created years ago that current financial analysts don’t understand. In addition, there are few controls to protect the integrity of the data, which not only jeopardizes the company’s compliance with financial reporting regulations but can also lead to suboptimal decisions. And, finally, it’s nearly impossible to reconcile any other business data with these reports, leading to countless futile arguments between finance and line of business managers about whose numbers are correct. (See Figure 3.)
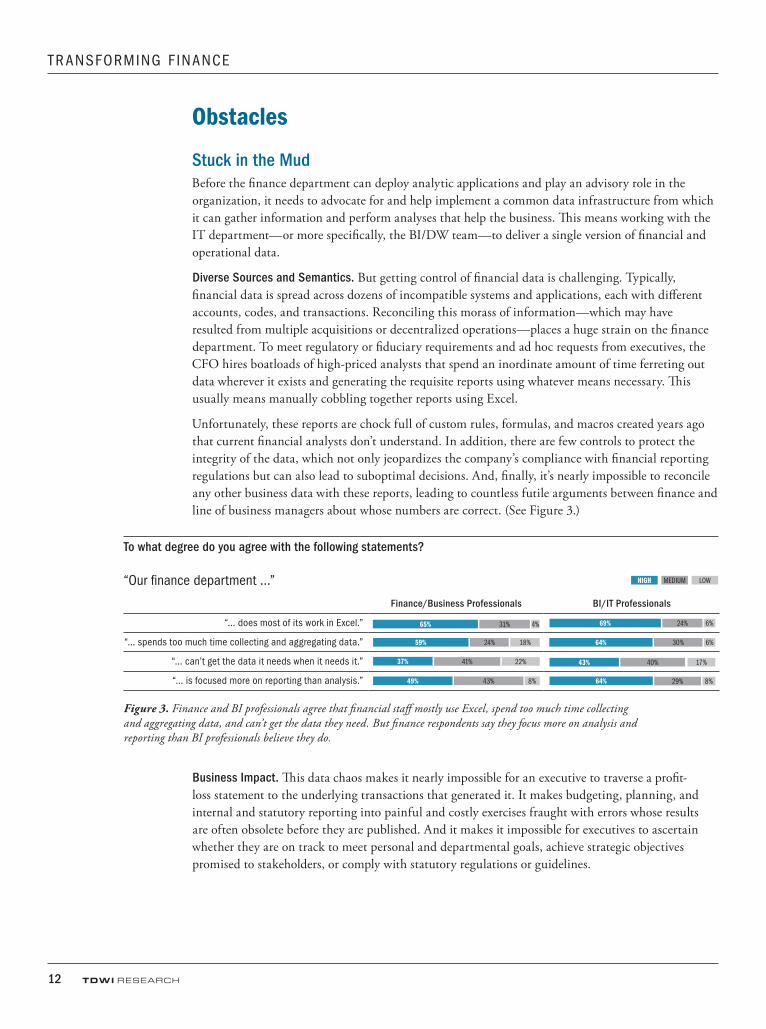
Business Impact. This data chaos makes it nearly impossible for an executive to traverse a profit-loss statement to the underlying transactions that generated it. It makes budgeting, planning, and internal and statutory reporting into painful and costly exercises fraught with errors whose results are often obsolete before they are published. And it makes it impossible for executives to ascertain whether they are on track to meet personal and departmental goals, achieve strategic objectives promised to stakeholders, or comply with statutory regulations or guidelines.
To what degree do you agree with the following statements?
“Our finance department …”
Finance/Business Professionals BI/IT Professionals
“… does most of its work in Excel.”
“… spends too much time collecting and aggregating data.”
“… can’t get the data it needs when it needs it.”
“… is focused more on reporting than analysis.”
Figure 3. Finance and BI professionals agree that financial staff mostly use Excel, spend too much time collecting and aggregating data, and can’t get the data they need. But finance respondents say they focus more on analysis and reporting than BI professionals believe they do.
65% 31% 4%
18%24%59%
37% 41% 22%
49% 43% 8%
69% 24% 6%
64% 30% 6%
43% 40% 17%
64% 29% 8%
HIGH MEDIUM LOW
www.tdwi.org 13
Obstacles
IT Shortcomings. Since the finance department operates under tight deadlines, it doesn’t have the luxury to wait for the IT department to deliver the data it needs. And historically, the IT department has been unable to deliver all the data finance needs in a timely fashion with the appropriate rules and adjustments applied. As a result, the finance department is forced to spend most of its time collecting, compiling, and massaging data in spreadsheets, rather than helping the organization identify and fix issues, optimize processes, analyze options, and refine go-to-market strategies. The result is frustration and tension between the two departments: IT gets frustrated about finance’s continued use of spreadsheets, and finance gets frustrated by IT’s inability to deliver the data it needs on time.
Excel-based SilosSpreadmarts. Without timely access to data, the finance department resorts to using spreadsheets to get the job done. In the process, finance generates information silos that rarely reconcile with data used by the rest of the organization. Another name for these spreadsheet-based silos is spreadmarts.
It’s a well known, if not documented, fact that most businesses run on Excel. Even organizations that spend millions of dollars deploying data warehouses and business intelligence tools use Excel to power large chunks of their operations. This is not all bad, since there are many appropriate uses for Excel within the context of a BI environment. Yet, in most cases, the prevalence of Excel-based reports is directly proportional to the fragmentation and inconsistency of data within an organization. In short, using Excel invariably proliferates spreadmarts.
Excel Versatility. Part of the problem is that Excel is so versatile and powerful, yet easy to use. It is easy to import or query data from any number of file systems or databases. And for the longest time, it had better charting and formatting than most reporting tools. It’s also a wonderful modeling tool with which even novices can create complex plans and multi-worksheet scenarios with little if any training. In addition, it is a powerful analytics tool that supports many complex functions as well as basic dimensional filtering via pivot tables. And the newest versions of Excel embed easy-to-use data mining functions. In short, you can do almost anything in Excel.
Managed Reporting. The fundamental problem is that spreadsheets are personal productivity tools, not an enterprise information delivery system. Individuals armed with spreadsheets generate their own data: they bring it into Excel, link it with other data sets, apply custom calculations, and format it according to their preferences. The resulting spreadsheet reflects their individual or departmental view of the business. It is highly unlikely that their view of the business harmonizes with other views, especially since other departments and corporate headquarters typically define basic entities and key metrics, such as customers, products, sales and profits, in entirely different ways. The use of spreadsheets in such a manner leads to the breakdown of corporate vocabulary and of the single version of the truth.
Human Data Warehouses. Besides causing the total fragmentation of enterprise data, spreadmarts suck up an inordinate amount of time. Highly paid financial and business analysts become the equivalent of low-level systems administrators, spending two or three days a week collecting, compiling, integrating, and formatting data. Many organizations employ dozens of business analysts who are nothing more than human data warehouses, proliferating an endless stream of spreadmarts.
Spreadsheets are a personal productivity tool not an enterprise information delivery system.
Finance doesn’t have the luxury to wait for the IT department to deliver the data it needs.
14 TDWI RESE ARCH
TRANSFORMING F INANCE
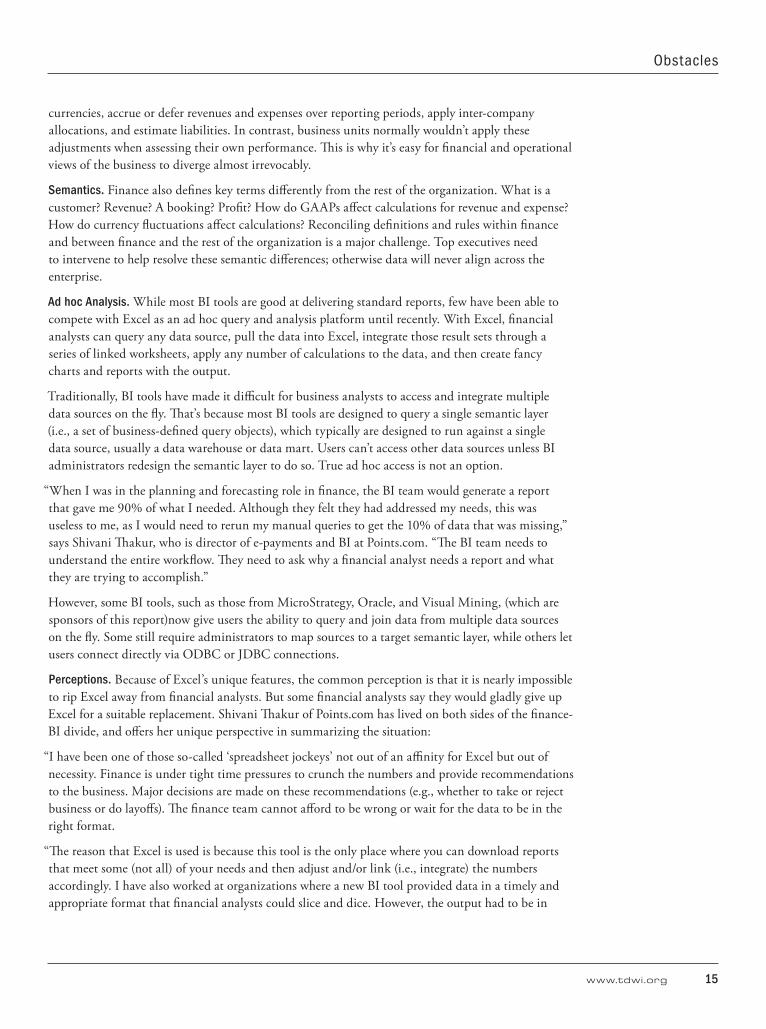
Eventually, these spreadmarts strangle an organization’s ability to do business. Financial and business analysts spend too much time collecting and compiling data instead of analyzing it, and the BI team chews up countless hours reconciling its reports with the finance team. (See Figure 4.)
Moreover, the CEO is frustrated at having to continuously mediate disputes about the numbers. The CFO is upset about the waste and inefficiency that spreadmarts cause and about IT’s inability to deliver timely, accurate information. And both are apoplectic about their lack of visibility into business operations, which hampers their efforts to make informed and timely business decisions. They also worry about the risks of delivering inaccurate data to the investing public or making poor decisions that could adversely affect shareholder value, the company’s market capitalization, and their credibility with the board.
Eventually, top executives decide to reverse course and put the organization on a stronger data footing. Yet, introducing BI into a spreadmart-ravaged landscape is like trying to win at whack-a-mole: as soon as you eliminate one spreadmart, two more pop up to take its place.
Intractability of SpreadmartsResistance to Change. There are psychological and practical reasons for the slow adoption of BI tools in a spreadmart-based organization. First, most business users don’t want to take the time to learn new tools or ways of looking at information. They don’t get paid or judged by their ability to query or analyze information so it’s difficult for them to justify the time and effort needed to learn a basic new skill. And if they’ve been successful using spreadmarts, then they are likely to resist anything that might jeopardize that success.
More fundamentally, it takes a long time for financial users to trust a report generated by a data warehouse. These users only trust reports that they generate, even though they may contain errors that aren’t exposed until reconciled with data warehouse data. (Warning: exposing such errors can be hazardous to a BI manager’s career and the viability of the data warehouse!) As the newcomer, the data warehouse must prove itself by reconciling with source financial data to the penny, a process which can take months, if not years, until everyone is satisfied.
“Our biggest challenge is reconciling data to the penny. When you pull in data in an asynchronous way, it takes a long time to account for everything. But you have to do this to gain trust,” says Freescale’s Ghoshal.
Complex Rules. One reason financial data is difficult to reconcile is that accountants apply complex rules to transactional data for accounting or tax purposes. For example, accountants normalize
“Our biggest challenge is reconciling data to
the penny.”
To what degree do you agree with the following statements?
“Our finance department …”
Finance/Business Professionals BI/IT Professionals
“… can’t align financial and operational data.”
“… has difficulty reconciling reports.”
“… would like to rely less on IT to access and analyze data.”
“… has financial analysts that work outside of IT’s purview.”
Figure 4. Finance and BI teams vary in their perspectives about the finance department’s handling of data, especially in the finance department’s ability to align financial and operational data and to reconcile reports.
25% 47% 27%
29% 45% 25%
58% 26% 16%
57% 22% 22%
45% 41% 15%
49% 39% 12%
55% 29% 16%
58% 29% 13%
HIGH MEDIUM LOW
www.tdwi.org 15
Obstacles
currencies, accrue or defer revenues and expenses over reporting periods, apply inter-company allocations, and estimate liabilities. In contrast, business units normally wouldn’t apply these adjustments when assessing their own performance. This is why it’s easy for financial and operational views of the business to diverge almost irrevocably.
Semantics. Finance also defines key terms differently from the rest of the organization. What is a customer? Revenue? A booking? Profit? How do GAAPs affect calculations for revenue and expense? How do currency fluctuations affect calculations? Reconciling definitions and rules within finance and between finance and the rest of the organization is a major challenge. Top executives need to intervene to help resolve these semantic differences; otherwise data will never align across the enterprise.
Ad hoc Analysis. While most BI tools are good at delivering standard reports, few have been able to compete with Excel as an ad hoc query and analysis platform until recently. With Excel, financial analysts can query any data source, pull the data into Excel, integrate those result sets through a series of linked worksheets, apply any number of calculations to the data, and then create fancy charts and reports with the output.
Traditionally, BI tools have made it difficult for business analysts to access and integrate multiple data sources on the fly. That’s because most BI tools are designed to query a single semantic layer (i.e., a set of business-defined query objects), which typically are designed to run against a single data source, usually a data warehouse or data mart. Users can’t access other data sources unless BI administrators redesign the semantic layer to do so. True ad hoc access is not an option.
“When I was in the planning and forecasting role in finance, the BI team would generate a report that gave me 90% of what I needed. Although they felt they had addressed my needs, this was useless to me, as I would need to rerun my manual queries to get the 10% of data that was missing,” says Shivani Thakur, who is director of e-payments and BI at Points.com. “The BI team needs to understand the entire workflow. They need to ask why a financial analyst needs a report and what they are trying to accomplish.”
However, some BI tools, such as those from MicroStrategy, Oracle, and Visual Mining, (which are sponsors of this report)now give users the ability to query and join data from multiple data sources on the fly. Some still require administrators to map sources to a target semantic layer, while others let users connect directly via ODBC or JDBC connections.
Perceptions. Because of Excel’s unique features, the common perception is that it is nearly impossible to rip Excel away from financial analysts. But some financial analysts say they would gladly give up Excel for a suitable replacement. Shivani Thakur of Points.com has lived on both sides of the finance-BI divide, and offers her unique perspective in summarizing the situation:
“I have been one of those so-called ‘spreadsheet jockeys’ not out of an affinity for Excel but out of necessity. Finance is under tight time pressures to crunch the numbers and provide recommendations to the business. Major decisions are made on these recommendations (e.g., whether to take or reject business or do layoffs). The finance team cannot afford to be wrong or wait for the data to be in the right format.
“The reason that Excel is used is because this tool is the only place where you can download reports that meet some (not all) of your needs and then adjust and/or link (i.e., integrate) the numbers accordingly. I have also worked at organizations where a new BI tool provided data in a timely and appropriate format that financial analysts could slice and dice. However, the output had to be in
16 TDWI RESE ARCH
TRANSFORMING F INANCE
Excel since again the tool did not provide all the data, and it was necessary to manually link to other sources of data.
“Yet, spreadsheet jockeys struggle with version control, linking issues, and other errors when manual intervention is required and we end up with 15 to 20 spreadsheets all linked together. This is not a desired state for anyone in finance. But currently other alternatives are not available,” says Thakur.
As a BI professional, Thakur is now frustrated by her inability to deliver useful reports to financial analysts in a timely manner. She finds that analyzing source data, applying and validating the necessary transforms, and delivering the appropriate report requires significant resources to do properly and quickly.
“For BI to be successful for the finance team, the output should mirror the finance team’s output which would include all the adjustments and integrations that the finance team is manually doing. The BI implementation should also address the other tasks that Finance performs, including forecasting, modeling, profitability management, and performance management. But in order to do this, the adjustments and integrations are numerous.
“One of the things I struggle with most is how long it now takes me to respond to business requests. As a ‘finance geek’ I was able to slice and dice numbers in a number of days by downloading reports in Excel, linking them manually and doing whatever manipulations I needed. The BI team and environment that I have adopted is not as nimble. Integrating data into our systems and then ensuring the maintenance and quality of that data is taking months to complete. It is only after this that a simple report can be built.”
Thakur eloquently testifies to the challenges financial analysts face using BI tools, and the difficulties BI managers encounter trying to support their needs. However, many companies have gotten ahead of the data and finance’s requirements and now deliver exactly what Thakur seeks, both as a financial analyst and BI manager. The next section discusses best practices for delivering the right data to financial users at the right time.
Turf Wars. Politics, mistrust, self reliance, and even the need to protect one’s job also pose obstacles to empowering finance with BI. For example, when a large retailer introduced BI to its finance department, it had to spend significant time evangelizing to users before it got traction. “Many people were reluctant to give up control of their reports and spreadsheets. They would say, ‘I don’t want someone else to produce this report for me,’” says a manager of financial BI at the company.
Although executives evangelized the need for change, mid-level managers and analysts whose jobs revolved around a legacy toolset or application felt threatened, says the manager. “Our executives had been trying to increase the efficiency of analysts through reorganizations and reinvention but it took several years to get traction.”
BI teams that neglect to develop a change management strategy when introducing the technology will founder upon people’s natural resistance to change and fears of losing control or their jobs.
BI teams that neglect to develop a change
management strategy will founder.
“Spreadsheet jockeys struggle with version
control, linking issues, and other errors. This is
not a desired state for anyone in finance.”
www.tdwi.org 17
Obstacles
Execution ChallengesBecause of these and other obstacles, many finance and IT departments are mired in dysfunctional behavior that makes it difficult for finance to reap the full benefits of BI.
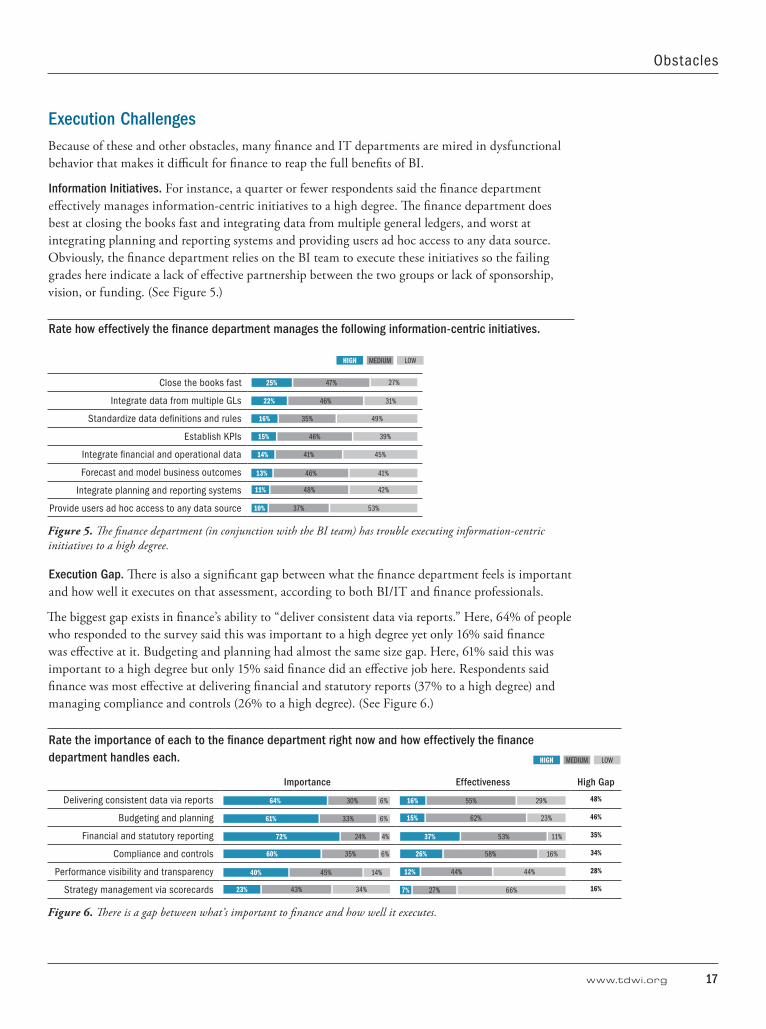
Information Initiatives. For instance, a quarter or fewer respondents said the finance department effectively manages information-centric initiatives to a high degree. The finance department does best at closing the books fast and integrating data from multiple general ledgers, and worst at integrating planning and reporting systems and providing users ad hoc access to any data source. Obviously, the finance department relies on the BI team to execute these initiatives so the failing grades here indicate a lack of effective partnership between the two groups or lack of sponsorship, vision, or funding. (See Figure 5.)
Rate how effectively the finance department manages the following information-centric initiatives.
Close the books fast
Integrate data from multiple GLs
Standardize data definitions and rules
Establish KPIs
Integrate financial and operational data
Forecast and model business outcomes
Integrate planning and reporting systems
Provide users ad hoc access to any data source
Figure 5. The finance department (in conjunction with the BI team) has trouble executing information-centric initiatives to a high degree.
Execution Gap. There is also a significant gap between what the finance department feels is important and how well it executes on that assessment, according to both BI/IT and finance professionals.
The biggest gap exists in finance’s ability to “deliver consistent data via reports.” Here, 64% of people who responded to the survey said this was important to a high degree yet only 16% said finance was effective at it. Budgeting and planning had almost the same size gap. Here, 61% said this was important to a high degree but only 15% said finance did an effective job here. Respondents said finance was most effective at delivering financial and statutory reports (37% to a high degree) and managing compliance and controls (26% to a high degree). (See Figure 6.)
Rate the importance of each to the finance department right now and how effectively the finance department handles each.
Importance Effectiveness High Gap
Delivering consistent data via reports 48%
Budgeting and planning 46%
Financial and statutory reporting 35%
Compliance and controls 34%
Performance visibility and transparency 28%
Strategy management via scorecards 16%
Figure 6. There is a gap between what’s important to finance and how well it executes.
25% 47% 27%
22% 46% 31%
16% 35% 49%
15% 46% 39%
14% 41% 45%
13% 46% 41%
11% 48% 42%
10% 37% 53%
64% 30% 6%
61% 33% 6%
72% 24% 4%
60% 35% 6%
40% 45% 14%
23% 43% 34%
16% 55% 29%
15% 62% 23%
37% 53% 11%
26% 58% 16%
12% 44% 44%
7% 27% 66%
HIGH MEDIUM LOW
HIGH MEDIUM LOW
18 TDWI RESE ARCH
TRANSFORMING F INANCE
Survey respondents said the most important initiative for finance is financial and statutory reporting (72% to a high degree), which also got the highest execution score (37% to a high degree). Given finance’s traditional role, this is not surprising. They also said that finance was least effective with
“performance visibility and transparency” (12% to a high degree) and “strategy management via scorecards” (7% to a high degree). These last two items also had the highest “low” execution scores of the group, 44% and 66%, respectively.
The low scores for performance and strategy management probably indicate that many respondents have yet to implement these initiatives. If we use the analytics applications in this chart as a guide, we can say that the finance department first delivers statutory reports, followed by compliance measures and planning, with performance management last, if at all.
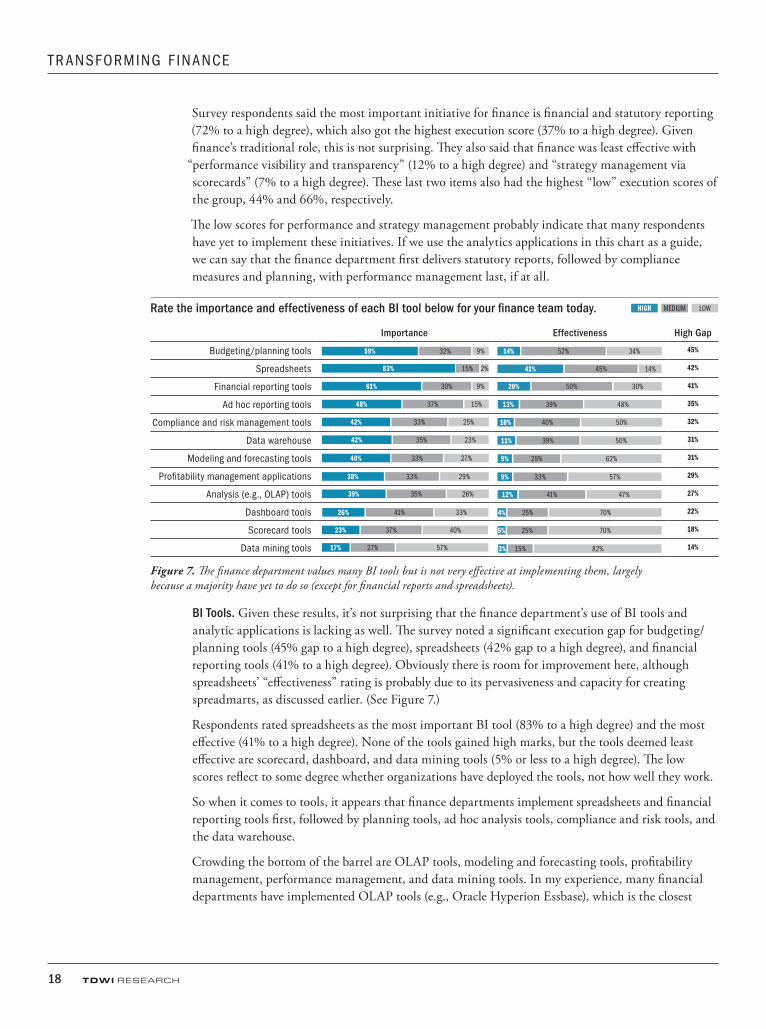
BI Tools. Given these results, it’s not surprising that the finance department’s use of BI tools and analytic applications is lacking as well. The survey noted a significant execution gap for budgeting/planning tools (45% gap to a high degree), spreadsheets (42% gap to a high degree), and financial reporting tools (41% to a high degree). Obviously there is room for improvement here, although spreadsheets’ “effectiveness” rating is probably due to its pervasiveness and capacity for creating spreadmarts, as discussed earlier. (See Figure 7.)
Respondents rated spreadsheets as the most important BI tool (83% to a high degree) and the most effective (41% to a high degree). None of the tools gained high marks, but the tools deemed least effective are scorecard, dashboard, and data mining tools (5% or less to a high degree). The low scores reflect to some degree whether organizations have deployed the tools, not how well they work.
So when it comes to tools, it appears that finance departments implement spreadsheets and financial reporting tools first, followed by planning tools, ad hoc analysis tools, compliance and risk tools, and the data warehouse.
Crowding the bottom of the barrel are OLAP tools, modeling and forecasting tools, profitability management, performance management, and data mining tools. In my experience, many financial departments have implemented OLAP tools (e.g., Oracle Hyperion Essbase), which is the closest
Rate the importance and effectiveness of each BI tool below for your finance team today.
Importance Effectiveness High Gap
Budgeting/planning tools 45%
Spreadsheets 42%
Financial reporting tools 41%
Ad hoc reporting tools 35%
Compliance and risk management tools 32%
Data warehouse 31%
Modeling and forecasting tools 31%
Profitability management applications 29%
Analysis (e.g., OLAP) tools 27%
Dashboard tools 22%
Scorecard tools 18%
Data mining tools 14%
Figure 7. The finance department values many BI tools but is not very effective at implementing them, largely because a majority have yet to do so (except for financial reports and spreadsheets).
59% 32% 9%
83% 15% 2%
61% 30% 9%
48% 37% 15%
42% 33% 25%
42% 35% 23%
40% 33% 27%
38% 33% 29%
39% 35% 26%
26% 41% 33%
23% 37% 40%
17% 27% 57%
14% 52% 34%
41% 45% 14%
20% 50% 30%
13% 39% 48%
10% 40% 50%
11% 39% 50%
9% 29% 62%
9% 33% 57%
12% 41% 47%
4% 25% 70%
5% 25% 70%
3% 15% 82%
HIGH MEDIUM LOW
www.tdwi.org 19
Best Practices
thing to a data warehouse the department has. Many have also implemented dashboards or scorecards so these low scores may seem puzzling.
“This isn’t surprising when you consider that historically finance’s most important initiative has been financial reporting, which they’ve done by manually collecting and compiling data in spreadsheets, which sucks time away from learning and implementing new tools and solutions,” says Tristan Ziegler, president and CEO of Visual Mining. “This is compounded by their apprehension in giving up control of reports and spreadsheets.”
Best Practices
Sponsorship and Partnership For the finance department to serve as a partner and advisor to the business, it needs clean, integrated, consolidated data. But there is a chicken-and-egg dynamic that prevents finance from getting what it needs. Finance can’t wait for the BI team to deliver consolidated data but the BI team can’t deliver consolidated data unless the finance team agrees to help create it and then use it. So how do you break this cycle? How do you get finance out of the data management business and into the data analysis business?
Find the Pain. It starts at the top. The CEO and CFO must be committed to change and be willing to make the tough calls to fund transformation initiatives that replace hand-cobbled reports with automated ones and re-orient financial managers and analysts to higher value activities.
But these leaders usually don’t deliver such commitments until they’ve experienced significant pain from lack of high quality information.
“Our CFO wants to be able to ask questions and get answers immediately via self service. He feels hamstrung by Excel. It takes too long to collect the data and then you have to engage in a never-ending dialogue with people about the numbers. That’s what drove our enterprise data warehouse initiative,” says Jason Beard, director of BI at John Wiley & Sons, a publishing company based in Hoboken, NJ.
Costs. Once on board, the executives need to fund and evangelize the BI initiative and stick with it long enough to bear fruit. It may take months to implement self-service BI tools and several years to fully populate the data warehouse with enterprise data. This requires a significant investment of time and money that many executives are unwilling or unable to commit. “The cost of delivering a BI solution tempts executives to undertake the path of least resistance—for example, to omit testing cycles or exclude hard-to-integrate data in the warehouse—which simply creates another source for spreadmarts instead of a true enterprise data resource,” says Shane Luzadder, a global allocations consultant at HSBC.
CFO Certified Metrics. But most importantly, these executives need to certify and use the reports generated by the data warehouse, and not give in to the temptation of using custom reports generated by analysts.
“One reason for the success of our data warehouse is that our CFO certifies the metrics and data it produces,” says Dave Whittington, data warehousing director at AT&T Mobility, who added that a team of finance and IT staffers audit the data every morning to verify its accuracy. “Once the CFO started certifying the metrics, sales and marketing were forced to use the same numbers. If they
“One reason for the success of our data warehouse is that our CFO certifies the metrics and data it produces.”
20 TDWI RESE ARCH
TRANSFORMING F INANCE
didn’t, they would have to explain why their numbers didn’t match the CFO’s numbers and that is a discussion they don’t want to have.”
Data Lineage. It’s also important that business users can easily track the origins of data elements and values in reports. When examining data, business users and auditors will ask, “Where did this data come from and how did you transform it?” Users can check a report’s metadata by right-clicking on values or columns to trace the lineage of a data element back to its source, including transformations and calculations that were applied. This feature increases confidence in the data.
Finance-BI Partnership. A prevailing theme when discussing success strategies is the importance of establishing a strong partnership between finance and the BI team.
“In my group, we are joined at the hip with the BI team, and we have come to respect the abilities of each other,” says Gregg Thompson, director of financial systems at Office Depot. “In the beginning, there was a lot of uncertainty, but the BI team has learned a lot about finance and what we need, and we’ve learned a lot about systems and to prioritize what we do so we only ask for what we really need at the time.”
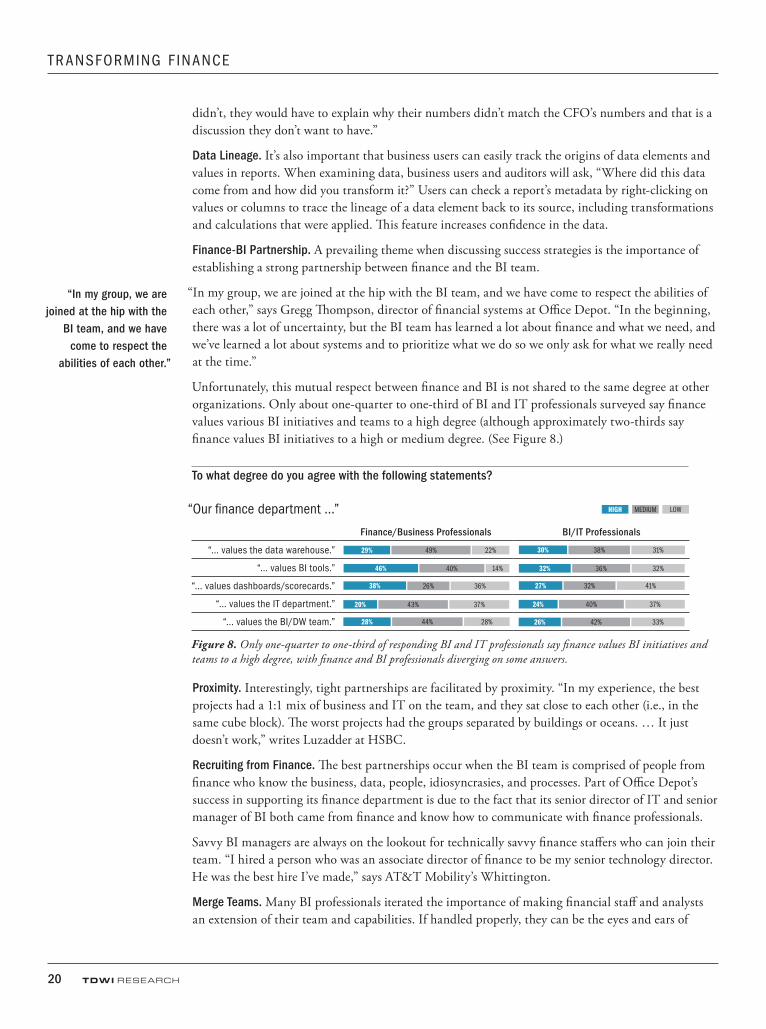
Unfortunately, this mutual respect between finance and BI is not shared to the same degree at other organizations. Only about one-quarter to one-third of BI and IT professionals surveyed say finance values various BI initiatives and teams to a high degree (although approximately two-thirds say finance values BI initiatives to a high or medium degree. (See Figure 8.)
To what degree do you agree with the following statements?
“Our finance department …”
Finance/Business Professionals BI/IT Professionals
“… values the data warehouse.”
“… values BI tools.”
“… values dashboards/scorecards.”
“… values the IT department.”
“… values the BI/DW team.”
Figure 8. Only one-quarter to one-third of responding BI and IT professionals say finance values BI initiatives and teams to a high degree, with finance and BI professionals diverging on some answers.
Proximity. Interestingly, tight partnerships are facilitated by proximity. “In my experience, the best projects had a 1:1 mix of business and IT on the team, and they sat close to each other (i.e., in the same cube block). The worst projects had the groups separated by buildings or oceans. … It just doesn’t work,” writes Luzadder at HSBC.
Recruiting from Finance. The best partnerships occur when the BI team is comprised of people from finance who know the business, data, people, idiosyncrasies, and processes. Part of Office Depot’s success in supporting its finance department is due to the fact that its senior director of IT and senior manager of BI both came from finance and know how to communicate with finance professionals.
Savvy BI managers are always on the lookout for technically savvy finance staffers who can join their team. “I hired a person who was an associate director of finance to be my senior technology director. He was the best hire I’ve made,” says AT&T Mobility’s Whittington.
Merge Teams. Many BI professionals iterated the importance of making financial staff and analysts an extension of their team and capabilities. If handled properly, they can be the eyes and ears of
“In my group, we are joined at the hip with the
BI team, and we have come to respect the
abilities of each other.”
29% 49% 22%
46% 40% 14%
38% 26% 36%
20% 43% 37%
28% 44% 28%
30% 38% 31%
32% 36% 32%
27% 32% 41%
24% 40% 37%
26% 42% 33%
HIGH MEDIUM LOW
www.tdwi.org 21
Best Practices
the BI team within the finance department. They can help interpret source data, review target data models, identify requirements for new reports, prioritize applications to build, and define evaluation criteria for BI tools. The BI team should appoint a financial analyst in each business unit to participate in the BI Competency Center to help define priorities, the corporate vocabulary, standards, and enhancements.
“You need to recognize that financial analysts are in the BI business, to make them part of the team, and support them. Otherwise, they’ll go off and do their own thing,” says J. Piscioneri, a former BI director at Corbis.
Financial analysts can make or break a BI program. To gain their trust, it’s important for BI teams to empower them with the best tools possible (besides Excel) and give them wide access to data. This often involves creating dimensional cubes for them or analytics sandboxes in the data warehouse that enable them to merge enterprise data with their own. To keep them from proliferating spreadmarts, the BI team should limit their ability to publish reports back to the server. The BI team should also establish a review board composed of their peers to examine new requests for standardized reports.
By both liberating and managing financial analysts, BI teams can create allies instead of enemies in the finance department.
Data Warehouses and General LedgersMerging GL and Transactions. To succeed with finance, the BI team must make sure that financial data in the data warehouse conforms to the way finance wants to see it, with all adjustments, accruals, and normalizations applied. This takes a lot of time and effort, and requires financial analysts to team up with the BI team to hunt down and fix errors and inconsistencies in the data warehouse.
“Our data wasn’t very accurate when we started building the data warehouse,” says AT&T Mobility’s Whittington. “We had teams shore up countless business rules and transformations so the metrics wouldn’t leak [i.e., generate errors]. But now we have a tightly wound process.”
Linking Hierarchies. To merge financial and transactional data, the BI team must design the data warehouse so financial hierarchies (i.e., the chart of accounts) link to product hierarchies using common keys. This linkage in the data model enables users to traverse these two worlds, navigating among sales, invoices, and expenses and monthly financial results.
For example, John Wiley & Sons extended its transaction data warehouse to support financial data so that, “we wouldn’t always be at loggerheads with other reports,” says Beard. The company merged its general ledger data (JD Edwards) with transaction data by linking the two data sets along key dimensions. “In the past, you were limited in how far you could drill down. Now you can hop from financial summaries to detailed transaction data.”
Office Depot also merged its general ledger and sales data. “We apply business rules to our sales environment so that our daily sales flash report matches the general ledger number,” says Ivy Solari, senior director of information technology at Office Depot.
Detailed, Timely Data. The data must be captured and stored at the transaction level so analysts can dive into the details. Even if finance requests summary data, BI teams should be ready to deliver the underlying details. “We learned quickly that financial analysts were never satisfied with a summary graph or table. They always had follow-up questions,” says Piscioneri of Corbis.
This atomic-level data is also required to support profitability applications where costs are allocated across various accounts, products, and customers. Sometimes, organizations need to revamp the way
Now users can hop from financial summaries to detailed transaction data.
“You need to recognize that financial analysts are in the BI business, to make them part of the team.”
22 TDWI RESE ARCH
TRANSFORMING F INANCE
they record data at the transaction or invoice level to ensure that costs and profits can be allocated easily and accurately.
Enterprise in Scope and Timely. The data warehouse also needs data from all business units and functional areas to be useful to the finance department. If any data is missing, the finance users must go get it, which cycles them back into using spreadmarts and wastes time and money. In addition, the data must be updated frequently, usually daily for most data elements. Timely data enables financial analysts to spot issues before they escalate into major problems that might affect the company’s bottom line of the company. Timely data enables financial managers to work proactively with the business to solve problems.
Cleaning up the General Ledger. One problem that bedevils finance and BI teams is that most companies have multiple general ledgers running on different platforms using different charts of accounts. This sorry state is often caused by successive mergers and acquisitions or autonomous business units who select their own applications and tools.
One way to fix this mess is to integrate the data after the fact. This can be done with data integration tools that populate a data warehouse, reporting tools that join data dynamically from multiple sources, or manually with spreadsheets. Another popular option is to use financial consolidation and reporting tools, which merge data from multiple general ledgers, handle currency conversions and inter-company eliminations, and convert data to various accounting standards, such as GAAP and IFRS. Many companies push the consolidated financial results back into the data warehouse to align the consolidated financials with the operational details, according to John O’Rourke, vice president of product marketing in Oracle’s enterprise performance management global business unit.
Standardizing Ledgers and Accounts. Perhaps the ideal way to integrate general ledger data is not to have to integrate it at all. To make this happen, companies are increasingly standardizing on a single financial ERP package and chart of accounts. Although this is an expensive, all-consuming transformation, it significantly reduces the amount of integration work that a financial analyst, data warehouse, or BI tool has to perform in the meantime. “We were a roll-your-own shop before we implemented SAP and its packaged financial application. This was an expensive way to get conformed general ledgers but it opened up a whole new world for finance,” says Piscioneri.
Likewise, John Wiley & Sons rolled out JD Edwards accounting software worldwide when it decided to restructure the business into three global business units based on major product lines. To support the restructuring, the company harmonized its chart of accounts globally and extended its data warehouse to house consolidated financial data from JD Edwards. “To provide a global view of the business where executives could drill from high level to details, we needed to revamp our internal management reporting,” says Wiley’s Beard. “Standardizing the general ledger and chart of accounts made this possible.”
Reconciling Semantics. In addition to a harmonized general ledger, organizations need a shared vocabulary so everyone knows what everyone else is saying when they use basic terms, like
“customer,” “revenue,” “expense,” “cost,” and “profit.” It’s impossible to build a data warehouse and deliver a single version of truth without reconciling these types of semantics, which are used in every department of the organization.
Unfortunately, reconciling semantics is hard to do and there are no shortcuts. This is where an executive sponsor earns his money: he must bring the relevant parties together and require them to agree on definitions and rules. Usually, the executive must issue an ultimatum and a deadline to get the job done.
“Implementing SAP was an expensive way to
get conformed general ledgers but it opened up a whole new world
for finance.”
Timely data enables financial managers to work proactively with
the business to solve problems.
www.tdwi.org 23
Best Practices
Standardizing terms doesn’t mean that the company has one definition for sales or profit. Although this would be nice, a more realistic practice is that executives articulate and document the differences in their definitions and agree to label them differently. In some cases, they may also need to figure out ways to map their definition or rule to a corporate term to facilitate data aggregations.
Managing ExcelDon’t Fight Excel. Although Excel is the tool of choice for creating spreadmarts, that doesn’t mean BI teams must eradicate it from the organization. Excel has its place as an analysis and modeling tool. Most financial analysts already know how to use the tool, and it’s inexpensive and pervasive because it comes bundled with Microsoft Office. The key is to use Excel as an analytical client, not an enterprise data management system.
“Don’t fight Excel, embrace it,” says Piscioneri, who recommends allowing analysts to use Excel as a front end to a BI server. “Before we implemented SAP, financial analysts were using our BI tool to dump data into Excel,” he says. Now with SAP, analysts use an Excel-based client [Business Explorer] to access multidimensional cubes sourced from the data warehouse, and “they are comfortable with it,” he says.
Convert. It’s imperative that the new BI tools empower both casual and power users to access the data they need without IT intervention. Casual users need self-service navigation tools, such as parameterized reports, dashboards, or OLAP databases that provide a summarized view of key metrics with the ability to drill to detail along predefined pathways. Ideally, each report or dashboard should be tailored to a specific role or group. Instead of requiring users to create their own reports or spreadsheets, these self-service navigational tools give casual users only the data they need when they need it.
In contrast, power users need ad hoc report creation tools that let them query data in multiple systems, including the data warehouse, and combine it to create new views and analyses. Finance users in particular need multidimensional modeling tools that let them create and preserve new views of data when creating plans or scenarios. Traditionally, power users have done this work in spreadsheets, but new BI tools make it easier to query data from multiple sources, apply complex calculations, and model scenarios.
Co-opt Spreadmarts. Another option is to co-opt spreadmarts and run them on behalf of the business unit. You don’t take away Excel, but you take responsibility for populating the spreadsheets they already have. This is often a tough sell initially since users don’t trust IT and may feel that their jobs are threatened. But if the users are overwhelmed with work and want to spend more time analyzing data, then they will usually accept help. Once this happens, IT can gradually renovate the back-end systems that populate the mart, migrating them to the BI team’s standard infrastructure.1
For example, the BI team of an American national bank assumed control of a monthly ROI report that used to take financial analysts two to three weeks per month to produce. The analysts wanted to keep the report in Excel. “We did all the data gathering, manipulation, and crunching and delivered them the report in Excel,” says the director of BI at the bank. “We got rid of all the manual edits, and now the data is more accurate and timely.”
Coerce. Of course, sometimes there is little option but to force spreadsheet users to abandon their manual processes and convert to a standard BI platform. The national bank mentioned earlier employed dozens of people to calculate operational costs so executives could manage the business by tracking unit costs and comparing their rate of efficiency to competitors. To support this initiative,
Finance users need multi-dimensional modeling tools that let them create and preserve new views of data.
1 See Wayne Eckerson and Rick Sherman, Strategies for Managing Spreadmarts: Migrating to a Managed BI Environment, TDWI Best Practices Report, Q1 2008. www.tdwi.org/research/reportseries
Standardizing terms doesn’t mean the company has one definition for sales or profit.
24 TDWI RESE ARCH
TRANSFORMING F INANCE
the staff manually calculated costs using spreadsheets. But executives came to realize that this process was slow, expensive, and inaccurate. So they commissioned a BI environment that would collect the data and generate the reports automatically.
“For a year we patiently reconciled our reports with theirs and we were always right because we had an automated process while they had humans entering data into spreadsheets. After that, the director of operations at my suggestion issued a mandate saying we would no longer reconcile reports and everyone who had been creating manual cost reports would be redeployed,” says the director of BI. The move affected 58 people, most of whom found other positions, he added.
RecommendationsBusiness intelligence can empower the CFO and finance department in their quest to better serve the business. When implemented properly, BI can provide timely insights, which the finance department can use to help business managers make better strategic and tactical decisions that lead to better financial results.
But implementing BI in the finance department is not easy. Finance is hunkered down producing reports and plans via Excel. It takes a commitment in time and money to transition to a more efficient and effective information delivery environment using BI. The data warehouse must prove it can deliver accurate, timely data in an acceptable format with all accounting rules applied. And the BI tools must be flexible and fast enough to meet financial analysts’ reporting and analytical requirements without requiring IT involvement.
To empower the CFO with BI, we recommend the following:
1. Get a sponsor, find and understand the pain. Implementing BI is an exercise in change management. To succeed, you need an executive sponsor and a chief lieutenant to drive requisite changes and sustain the initiative for several years until it reaps dividends. The best candidates are sponsors who suffer from a lack of visibility into strategic and operational performance and who are willing to certify and use the reports the new environment will generate.
2. Partner with the BI team. The BI team is responsible for delivering clean, consistent financial data, applying appropriate rules and adjustments, and integrating that data with operational data from non-financial systems. But the BI team cannot perform this work alone. It needs to work closely with subject matter experts in the finance department who understand financial rules and processes and can interpret the data for the BI team. This requires a tight partnership between the finance and BI teams in which each respects what the other does and understands the problems each encounters along the way. To achieve this partnership, executives often assign finance experts to serve on the BI project team and BI managers often recruit tech-savvy financial analysts to work full time in their departments.
3. Homogenize the general ledger and chart of accounts. To meet the needs of the finance department, it helps to consolidate all general ledgers onto a single platform and harmonize the chart of accounts throughout the organization. This is a major undertaking, but it greatly reduces the tedious integration work that can slow down data warehouse deployments (or that requires boatload of accountants if done manually). When organizational structures make such
Sometimes there is little option but to
force spreadsheet users to abandon their manual
processes and convert to a standard
BI platform.
www.tdwi.org 25
Recommendations
standardization impossible, companies should use financial consolidation tools to harmonize the financial data. In addition, the data warehouse can serve as the single point of integration while a company is migrating to a new global general ledger system.
4. Build an enterprise data warehouse. To deliver the single version of truth desired by the CFO and other executives, the BI team should design the data warehouse to be enterprise in scope, linking operational data with financial data. This enables users to shift from a financial view of the business to a transactional view to see what’s driving the numbers, and vice versa. It’s important to remember than an enterprise data warehouse is built in small steps, one logical data mart at a time, each providing business value. This process requires visionary sponsors willing to sustain their commitment and funding over years.
5. Deliver self-service BI tools. Executives, managers, and other financial staff must be able to access data directly without IT involvement. This requires the BI team to implement self-service BI tools that make it easy for users to drill from summary level views to detailed data without getting lost, and to preserve views by scheduling them as regular reports. These reports should be able to pull data from multiple locations so users can view critical information in one place with one tool instead of hunting around for data using multiple software products.
6. Deliver timely, detailed data. Reports that only contain summarized views of financial and operational data are virtually useless to financial managers and analysts. To get to the root of a problem or issue, financial managers and analysts need to view details and to filter data by different dimensions. They also need to see the freshest data possible so they can identify issues, analyze options, and work with the business to take action before the problem shows up on the bottom line. BI teams need to architect the data warehouse to provide timely data and/or offer robust BI tools that can federate data from multiple locations in real time.
7. Coexist with Excel. Although financial managers and analysts are comfortable using Excel, most do not understand its limitations as a data management system. To enjoy the benefits of Excel without experiencing the drawbacks, use Excel as a client to BI servers that manage the data in a consistent way via the data warehouse. It’s also important to prohibit the use of Excel-based reports that conflict with CFO-certified reports generated from the data warehouse, to prevent users from publishing their own reports to a shared server or portal without permission.
8. Create an ad hoc environment for financial analysts. To perform ad hoc analyses, financial analysts must combine data from multiple systems, including the data warehouse. The analytical environment must be flexible enough to allow them to apply sophisticated transformations and calculations. Excel is the default ad hoc analytical tool of choice for financial analysts. But BI teams should consider exposing the analysts to other tools that extend the scope and scale of their analyses. This would include predictive analytic tools that model patterns in large volumes of data; visual discovery tools that let users interact with data visually at the speed of thought; and analytic sandboxes that reserve a partition of the data warehouse for users to combine and merge data warehouse data with their own.
9. Leverage the data warehouse to support other financial applications. A data warehouse is more than a reporting vehicle. It is a corporate resource of integrated data that can support a multitude of analytic applications either directly or through a series of logical data marts. These include planning and budgeting applications, performance management applications such as dashboards and scorecards, and profitability and risk management applications.
26 TDWI RESE ARCH
TRANSFORMING F INANCE
Appendix
Office Depot Ramps Up BI for Finance In 2005, Office Depot, a global supplier of office products and services, implemented a global business intelligence (BI) initiative to standardize information used for decision making. Today, the company boasts a 20 TB global data warehouse, integrates data from all major functional areas, and supports over 4,000 corporate, retail, and field sales users in North America and Europe.
The new system has been a godsend for Office Depot’s finance department. Rather than trying to piece together data from multiple systems, finance now has all the information it needs in one place. In addition, the data warehouse aligns financial and product hierarchies with a shared set of facts, providing a common language that enables finance and merchandising to communicate about product profitability and figure out ways to improve it.
“Because we now report immediately the cost of production and product margins, we have been able to help the business change its strategies more quickly,” says Greg Thompson, director of financial systems at Office Depot.
For example, in the company’s Copy and Print business division, financial analysts noticed that black-and-white copiers weren’t generating as much profit as were color copiers, and the analysts worked with the business managers to shift their inventory to color copiers. In another instance, financial managers noticed pricing discounts were edging higher than expected in several locations and notified business managers who took action.
Single Version of TruthPrior to 2005, Office Depot had disparate BI systems and teams scattered throughout various departments, making it difficult to synchronize data across the company. Although part of the motivation to implement an enterprise data warehouse was to consolidate costs, tools, and data, a more important reason was to deliver consistent data.
“The result of the effort is that terms like net sales, to use one simple case, are now consistent across departments and divisions,” says Mike Kirschner, vice president of information technology.
In particular, the finance department wanted to rely less heavily on the IT department to create custom reports. The combination of the Teradata warehouse and self-service reporting and analysis tools enabled Office Depot’s financial managers and analysts to create their own reports. “Finance no longer needs multiple tools and a magic decoder ring to access information,” says James Hoganson, director of sales accounting and reporting.
Even as they settle into their new reporting and analytical tools, the finance team is already plotting to move beyond basic reporting to take advantage of dashboarding and scorecarding, as well as more sophisticated types of analysis, such as financial modeling and data mining. Financial executives also seem eager to move beyond daily updates to near-real-time information feeds that will enable the company to streamline inventory and supply chain processes and keep up with competition in the retail industry.
www.tdwi.org 27
Appendix
OrganizationTo create the data warehouse and reporting/analysis environments, Office Depot created an enterprise intelligence department, which brought together BI and DW professionals who previously worked in other departments. The current staff consists of a data warehousing team that focuses on data acquisition, cleansing, and integration; a BI team that focuses on data delivery via reporting and analysis tools; and a decision support team that manages legacy reporting and intranet applications that have yet to be retired.
To ensure they have a single version of truth, the department manages the data warehouse and defines the semantic model, which contains definitions of key metrics and terms and shields users from the complexity of back-end database models. Staffers work closely with subject matter experts in each department who author custom reports on behalf of their colleagues. These volunteers use report authoring and analysis (i.e., OLAP) tools to create most of the straightforward management and operational reports required by users in their departments. The enterprise intelligence team gets involved to build the most complex reports.
The subject matter experts also participate in the team’s BI competency center, which evaluates requests for new standard reports, discusses data governance issues, prioritizes projects, and evaluates the impact of enhancements on existing data and semantic models, according to Ulbricht Sylvestre, lead architect for the enterprise intelligence team.
Financial Infrastructure Office Depot made a big push to address the requirements of the finance department. The data warehouse now contains most of the data that finance needs, including general ledger, accounts payable, accounts receivable, project accounting, and asset management. “They can now view an entry in the general ledger and trace it to the underlying order, customer, and location and view the true margins of each product,” added Sylvestre.
The impetus to consolidate financial data in the data warehouse was sparked by the creation of a standard chart of accounts and the global deployment of Oracle Financials. Both initiatives helped standardize financial processes, methods, and data—which was a huge relief for the finance department—and also reduced the complexity of sourcing financial data for the data warehouse.
“BI is providing the company with the tools to increase operational effectiveness by monitoring daily key metrics and deploying self-service applications. This combination provides business unit insight into actionable items for operational and financial business decisions that improve customer experience,” says Brian Wood, senior manager of BI.

28 TDWI RESE ARCH
TRANSFORMING F INANCE
Decision Experts To facilitate moving the new financial data into the data warehouse, Office Depot used Teradata’s Decision Experts, which provides prebuilt extract, transform, and load mappings and target models for Oracle Financials. The product accelerated Office Depot’s ability to consolidate financial data in the warehouse and is used to support both traditional batch processing and mini-batch cycles, according to Sylvestre.
Both finance and IT staff are quick to point out that they could not have succeeded in building the financial subject area of the data warehouse without a close working relationship. Forming this partnership required give-and-take from both sides. BI professionals have had to learn the business, while the business side has had to learn some technology and become more disciplined about prioritizing its requests. “Nothing could have been accomplished without a tight partnership between finance and IT,” says Greg Popkin, director of state and local taxes.
Research Sponsors
MicroStrategywww.microstrategy.comMicroStrategy, a global leader in business intelligence and performance management technology, provides reporting, analysis, and monitoring software that enables leading organizations to make better business decisions every day. Designed to support the most demanding business intelligence applications, MicroStrategy is ideal for enterprise-wide BI standardization. Companies choose MicroStrategy for its advanced technical capabilities, sophisticated analytics, and superior data and user scalability. MicroStrategy is built from a single architectural foundation, making it the most integrated and efficient BI architecture available. With an intuitive Web interface, MicroStrategy enables business users to seamlessly access enterprise data for enhanced decision making.
Oraclewww.oracle.comOracle’s business is information—how to manage it, use it, share it, protect it. For nearly three decades, Oracle, the world’s largest enterprise software company, has provided the software and services that let organizations get the most up-to-date and accurate information from their business systems. Today, Oracle is the world’s largest business software company, with more than 320,000 customers.
Visual Mining www.visualmining.comVisual Mining provides dashboard and data visualization solutions that instantly transform data into actionable business information. Visual Mining’s award-winning NetCharts products deliver comprehensive solutions for both developers and end users that are intuitive and effective. NetCharts Products for Business Users—led by NetCharts Performance Dashboards, provide dynamic, interactive dashboards to analyze data, gain insight, and make better informed business decisions. NetCharts Products for Developers enable the rapid design and deployment of advanced data visualizations that easily integrate with applications and data sources. Visual Mining’s support and professional services teams complement its products by providing the expertise to ensure success.
To experience NetCharts Performance Dashboards and explore the results of this TDWI Best Practices Report, please visit: http://www.visualmining.com/resource_library/tdwi_bestpractices_transformingfinance.php.
Teradata Corporation www.teradata.comTeradata is the acknowledged global leader in data warehouse innovation and analytical solution development. Every day we raise our customers’ intelligence to higher levels, making them more focused and competitive by gathering enterprise information and extracting actionable insight.
Teradata elevates enterprise intelligence by giving every decision maker the insight required for smarter, faster decisions. We add value and reveal opportunity across more dimensions than any competing solution.
In every industry and geography, our technologies and expertise make the difference. Simply put, Teradata solutions make companies smarter and give them the competitive advantage to win.
1201 Monster Road SW
Suite 250
Renton, WA 98057
T 425.277.9126
F 425.687.2842
www.tdwi.org
TDWI Research provides research and advice for BI professionals worldwide. TDWI Research focuses exclusively on BI/DW issues and teams up with industry practitioners to deliver both broad and deep understanding of the business and technical issues surrounding the deployment of business intelligence and data warehousing solutions. TDWI Research offers reports, commentary, and inquiry services via a worldwide Membership program and provides custom research, benchmarking, and strategic planning services to user and vendor organizations.
TDWI RESE A RCH