Embed Size (px)
Citation preview
Volume 76 • Number 7
1044
Periodontal treatment is designed torebuild the lost bone caused by bac-terial infiltration into the periodon-
tal pocket and recreate attachment ofthe periodontal ligament (PDL) to thepreviously diseased root surface.1 Undernormal conditions, fibroblasts are re-sponsible for the production and main-tenance of the connective tissue matrixof both the PDL and gingiva.2 They arethe predominant cells of the periodontalligament and have important roles in thedevelopment, function, and regenerationof the tooth-support apparatus.3 Properregeneration of the periodontal attach-ment therefore requires the coordinatedreestablishment of the periodontal liga-ment, alveolar bone, cementum, andsupporting gingival tissue.
The periodontal ligament is a uniqueligament in the body, connecting boneto cementum. This ligament is underconstant repair and remodeling due tothe forces of mastication.4 The perio-dontal ligament expresses high levels ofcollagens, particularly Types I and III(also prevalent in bone and cementum).The PDL also expresses the extracellu-lar matrix (ECM) proteins fibronectin,5
osteopontin,3 fibromodulin,6 lumican,7
and a rheumatoid arthritis antigen.8 Dur-ing repair, PDL fibroblasts upregulatecollagen Type V.9 In addition, hydroxy-apatite has the ability to induce PDLfibroblasts to increase alkaline phos-phatase activity, creating bone-like tis-sue.10 Thus, PDL fibroblasts express acomplex set of genes that are dynami-cally regulated during different stages ofthe PDL’s normal function (Table 1).
Osteogenesis is the process of formingnew bone, usually through the action of
Transcript Profiling of PeriodontalFibroblasts and OsteoblastsThomas E. Lallier,* Amber Spencer,* and Melanie M. Fowler*
Background: Fibroblasts are critical to the establishment andmaintenance of the periodontal attachment apparatus (cementum,periodontal ligament [PDL], and bone). In order to characterizethe cellular changes that accompany periodontal regeneration,better tools are necessary to distinguish periodontal ligamentfibroblasts (PDLF), gingival fibroblasts, and osteoblasts. Our goalis to identify gene markers to better characterize and identifythese cell types.
Methods: We chose to examine and compare the expressionof numerous gene transcripts by semiquantitative reverse trans-criptase-polymerase chain reaction using primers specific for44 different gene transcripts in order to better characterize theidentity of these cells.
Results: Several transcripts were cell-type specific. Specifi-cally, fibromodulin was expressed only in PDL fibroblasts, whileosteopontin was expressed only in dermal fibroblasts. In addition,lumican was expressed by all three types of fibroblasts (PDL, gin-gival, and dermal), while alkaline phosphatase was expressed byosteoblasts as well as PDL and gingival fibroblasts.
Conclusions: Our results indicate that PDL fibroblasts are dis-tinct from either gingival or dermal fibroblasts or osteoblasts. Ingeneral, PDL and gingival fibroblasts displayed greater similarityto each other than either displayed toward dermal fibroblasts.Furthermore, both gingival and PDL fibroblasts displayed greatersimilarity to osteoblasts than to dermal fibroblasts, possibly reflect-ing their common origin (the neural crest). J Periodontol 2005;76:1044-1055.
KEY WORDSFibroblasts, dermal; fibroblasts, gingival; fibroblasts,periodontal; genetic markers; osteoblasts; periodontalregeneration.
* Center of Excellence in Oral and Craniofacial Biology, Department of Cell Biology andAnatomy, School of Dentistry, Louisiana State University Health Sciences Center, NewOrleans, LA.
40064.qxd 7/7/05 8:05 AM Page 1044
1045
J Periodontol • July 2005 Lallier, Spencer, Fowler
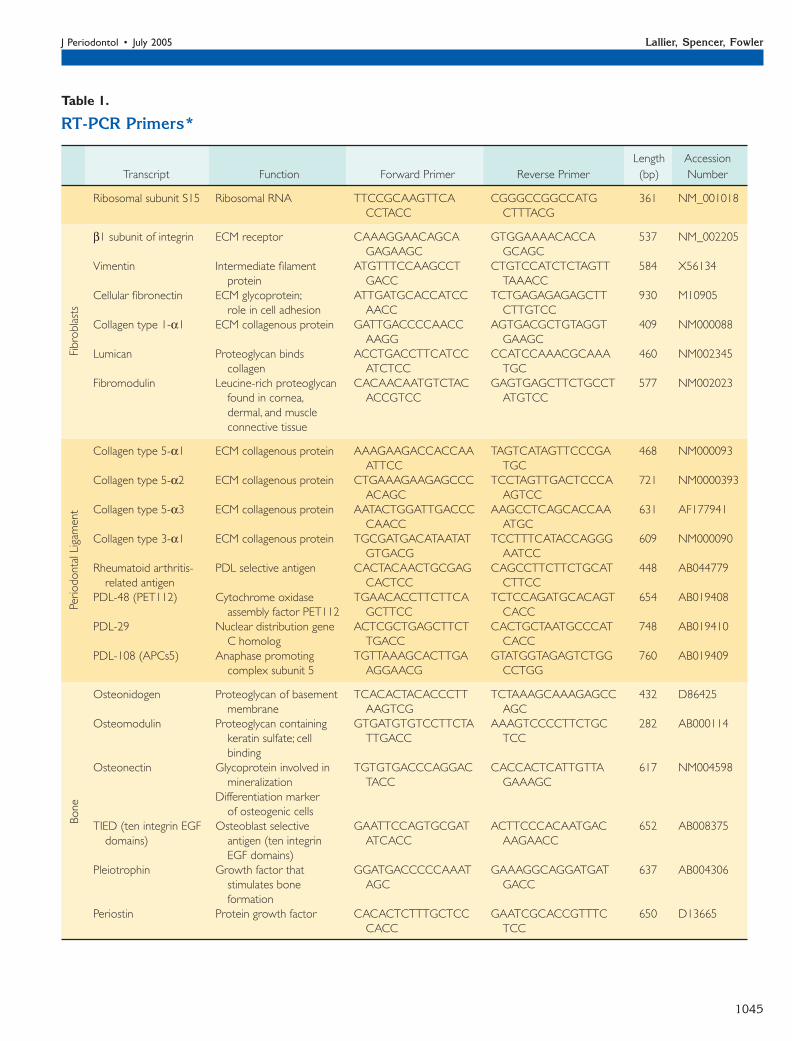
Table 1.
RT-PCR Primers*
Length AccessionTranscript Function Forward Primer Reverse Primer (bp) Number
Ribosomal subunit S15 Ribosomal RNA TTCCGCAAGTTCA CGGGCCGGCCATG 361 NM_001018CCTACC CTTTACG
β1 subunit of integrin ECM receptor CAAAGGAACAGCA GTGGAAAACACCA 537 NM_002205GAGAAGC GCAGC
Vimentin Intermediate filament ATGTTTCCAAGCCT CTGTCCATCTCTAGTT 584 X56134protein GACC TAAACC
Cellular fibronectin ECM glycoprotein; ATTGATGCACCATCC TCTGAGAGAGAGCTT 930 M10905role in cell adhesion AACC CTTGTCC
Collagen type 1-α1 ECM collagenous protein GATTGACCCCAACC AGTGACGCTGTAGGT 409 NM000088AAGG GAAGC
Lumican Proteoglycan binds ACCTGACCTTCATCC CCATCCAAACGCAAA 460 NM002345collagen ATCTCC TGC
Fibromodulin Leucine-rich proteoglycan CACAACAATGTCTAC GAGTGAGCTTCTGCCT 577 NM002023found in cornea, ACCGTCC ATGTCCdermal, and muscleconnective tissue
Collagen type 5-α1 ECM collagenous protein AAAGAAGACCACCAA TAGTCATAGTTCCCGA 468 NM000093ATTCC TGC
Collagen type 5-α2 ECM collagenous protein CTGAAAGAAGAGCCC TCCTAGTTGACTCCCA 721 NM0000393ACAGC AGTCC
Collagen type 5-α3 ECM collagenous protein AATACTGGATTGACCC AAGCCTCAGCACCAA 631 AF177941CAACC ATGC
Collagen type 3-α1 ECM collagenous protein TGCGATGACATAATAT TCCTTTCATACCAGGG 609 NM000090GTGACG AATCC
Rheumatoid arthritis- PDL selective antigen CACTACAACTGCGAG CAGCCTTCTTCTGCAT 448 AB044779related antigen CACTCC CTTCC
PDL-48 (PET112) Cytochrome oxidase TGAACACCTTCTTCA TCTCCAGATGCACAGT 654 AB019408assembly factor PET112 GCTTCC CACC
PDL-29 Nuclear distribution gene ACTCGCTGAGCTTCT CACTGCTAATGCCCAT 748 AB019410C homolog TGACC CACC
PDL-108 (APCs5) Anaphase promoting TGTTAAAGCACTTGA GTATGGTAGAGTCTGG 760 AB019409complex subunit 5 AGGAACG CCTGG
Osteonidogen Proteoglycan of basement TCACACTACACCCTT TCTAAAGCAAAGAGCC 432 D86425membrane AAGTCG AGC
Osteomodulin Proteoglycan containing GTGATGTGTCCTTCTA AAAGTCCCCTTCTGC 282 AB000114keratin sulfate; cell TTGACC TCCbinding
Osteonectin Glycoprotein involved in TGTGTGACCCAGGAC CACCACTCATTGTTA 617 NM004598mineralization TACC GAAAGC
Differentiation markerof osteogenic cells
TIED (ten integrin EGF Osteoblast selective GAATTCCAGTGCGAT ACTTCCCACAATGAC 652 AB008375domains) antigen (ten integrin ATCACC AAGAACC
EGF domains)Pleiotrophin Growth factor that GGATGACCCCCAAAT GAAAGGCAGGATGAT 637 AB004306
stimulates bone AGC GACCformation
Periostin Protein growth factor CACACTCTTTGCTCC GAATCGCACCGTTTC 650 D13665CACC TCC
Fibr
obla
sts
Perio
dont
al L
igam
ent
Bone
40064.qxd 7/7/05 8:05 AM Page 1045
1046
Periodontal Ligament Fibroblast Gene Expression Volume 76 • Number 7
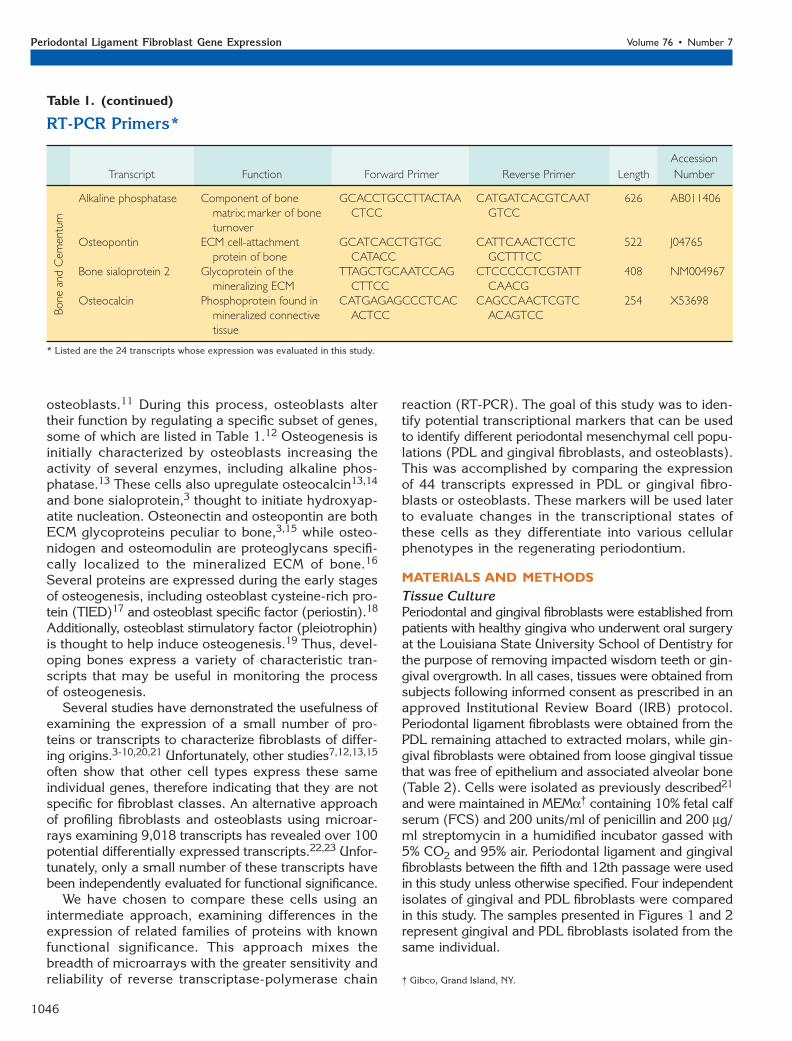
Table 1. (continued)
RT-PCR Primers*
AccessionTranscript Function Forward Primer Reverse Primer Length Number
Alkaline phosphatase Component of bone GCACCTGCCTTACTAA CATGATCACGTCAAT 626 AB011406matrix; marker of bone CTCC GTCCturnover
Osteopontin ECM cell-attachment GCATCACCTGTGC CATTCAACTCCTC 522 J04765protein of bone CATACC GCTTTCC
Bone sialoprotein 2 Glycoprotein of the TTAGCTGCAATCCAG CTCCCCCTCGTATT 408 NM004967mineralizing ECM CTTCC CAACG
Osteocalcin Phosphoprotein found in CATGAGAGCCCTCAC CAGCCAACTCGTC 254 X53698mineralized connective ACTCC ACAGTCCtissue
* Listed are the 24 transcripts whose expression was evaluated in this study.
Bone
and
Cem
entu
m
osteoblasts.11 During this process, osteoblasts altertheir function by regulating a specific subset of genes,some of which are listed in Table 1.12 Osteogenesis isinitially characterized by osteoblasts increasing theactivity of several enzymes, including alkaline phos-phatase.13 These cells also upregulate osteocalcin13,14
and bone sialoprotein,3 thought to initiate hydroxyap-atite nucleation. Osteonectin and osteopontin are bothECM glycoproteins peculiar to bone,3,15 while osteo-nidogen and osteomodulin are proteoglycans specifi-cally localized to the mineralized ECM of bone.16
Several proteins are expressed during the early stagesof osteogenesis, including osteoblast cysteine-rich pro-tein (TIED)17 and osteoblast specific factor (periostin).18
Additionally, osteoblast stimulatory factor (pleiotrophin)is thought to help induce osteogenesis.19 Thus, devel-oping bones express a variety of characteristic tran-scripts that may be useful in monitoring the processof osteogenesis.
Several studies have demonstrated the usefulness ofexamining the expression of a small number of pro-teins or transcripts to characterize fibroblasts of differ-ing origins.3-10,20,21 Unfortunately, other studies7,12,13,15
often show that other cell types express these sameindividual genes, therefore indicating that they are notspecific for fibroblast classes. An alternative approachof profiling fibroblasts and osteoblasts using microar-rays examining 9,018 transcripts has revealed over 100potential differentially expressed transcripts.22,23 Unfor-tunately, only a small number of these transcripts havebeen independently evaluated for functional significance.
We have chosen to compare these cells using anintermediate approach, examining differences in theexpression of related families of proteins with knownfunctional significance. This approach mixes thebreadth of microarrays with the greater sensitivity andreliability of reverse transcriptase-polymerase chain
reaction (RT-PCR). The goal of this study was to iden-tify potential transcriptional markers that can be usedto identify different periodontal mesenchymal cell popu-lations (PDL and gingival fibroblasts, and osteoblasts).This was accomplished by comparing the expressionof 44 transcripts expressed in PDL or gingival fibro-blasts or osteoblasts. These markers will be used laterto evaluate changes in the transcriptional states ofthese cells as they differentiate into various cellularphenotypes in the regenerating periodontium.
MATERIALS AND METHODSTissue CulturePeriodontal and gingival fibroblasts were established frompatients with healthy gingiva who underwent oral surgeryat the Louisiana State University School of Dentistry forthe purpose of removing impacted wisdom teeth or gin-gival overgrowth. In all cases, tissues were obtained fromsubjects following informed consent as prescribed in anapproved Institutional Review Board (IRB) protocol.Periodontal ligament fibroblasts were obtained from thePDL remaining attached to extracted molars, while gin-gival fibroblasts were obtained from loose gingival tissuethat was free of epithelium and associated alveolar bone(Table 2). Cells were isolated as previously described21
and were maintained in MEMα† containing 10% fetal calfserum (FCS) and 200 units/ml of penicillin and 200 µg/ml streptomycin in a humidified incubator gassed with5% CO2 and 95% air. Periodontal ligament and gingivalfibroblasts between the fifth and 12th passage were usedin this study unless otherwise specified. Four independentisolates of gingival and PDL fibroblasts were comparedin this study. The samples presented in Figures 1 and 2represent gingival and PDL fibroblasts isolated from thesame individual.
† Gibco, Grand Island, NY.
40064.qxd 7/7/05 8:05 AM Page 1046
1047
J Periodontol • July 2005 Lallier, Spencer, Fowler
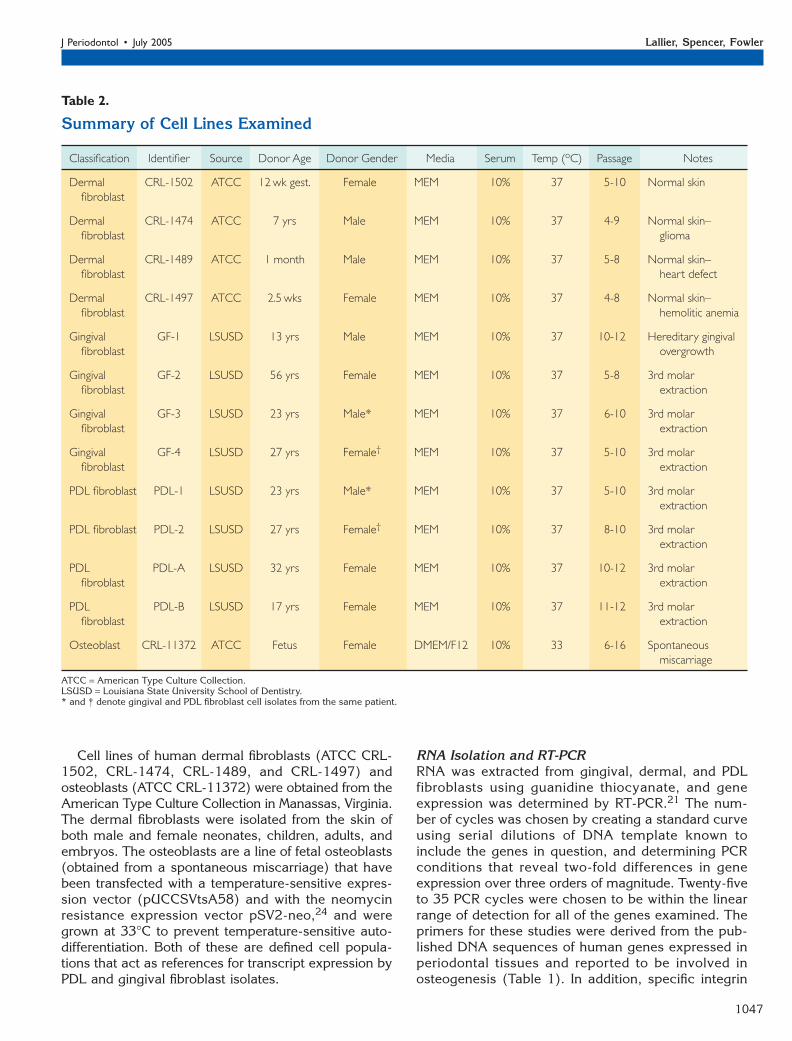
Table 2.
Summary of Cell Lines Examined
Classification Identifier Source Donor Age Donor Gender Media Serum Temp (oC) Passage Notes
Dermal CRL-1502 ATCC 12 wk gest. Female MEM 10% 37 5-10 Normal skinfibroblast
Dermal CRL-1474 ATCC 7 yrs Male MEM 10% 37 4-9 Normal skin–fibroblast glioma
Dermal CRL-1489 ATCC 1 month Male MEM 10% 37 5-8 Normal skin–fibroblast heart defect
Dermal CRL-1497 ATCC 2.5 wks Female MEM 10% 37 4-8 Normal skin–fibroblast hemolitic anemia
Gingival GF-1 LSUSD 13 yrs Male MEM 10% 37 10-12 Hereditary gingivalfibroblast overgrowth
Gingival GF-2 LSUSD 56 yrs Female MEM 10% 37 5-8 3rd molar fibroblast extraction
Gingival GF-3 LSUSD 23 yrs Male* MEM 10% 37 6-10 3rd molar fibroblast extraction
Gingival GF-4 LSUSD 27 yrs Female† MEM 10% 37 5-10 3rd molar fibroblast extraction
PDL fibroblast PDL-1 LSUSD 23 yrs Male* MEM 10% 37 5-10 3rd molar extraction
PDL fibroblast PDL-2 LSUSD 27 yrs Female† MEM 10% 37 8-10 3rd molar extraction
PDL PDL-A LSUSD 32 yrs Female MEM 10% 37 10-12 3rd molar fibroblast extraction
PDL PDL-B LSUSD 17 yrs Female MEM 10% 37 11-12 3rd molar fibroblast extraction
Osteoblast CRL-11372 ATCC Fetus Female DMEM/F12 10% 33 6-16 Spontaneous miscarriage
ATCC = American Type Culture Collection.LSUSD = Louisiana State University School of Dentistry.* and † denote gingival and PDL fibroblast cell isolates from the same patient.
Cell lines of human dermal fibroblasts (ATCC CRL-1502, CRL-1474, CRL-1489, and CRL-1497) andosteoblasts (ATCC CRL-11372) were obtained from theAmerican Type Culture Collection in Manassas, Virginia.The dermal fibroblasts were isolated from the skin ofboth male and female neonates, children, adults, andembryos. The osteoblasts are a line of fetal osteoblasts(obtained from a spontaneous miscarriage) that havebeen transfected with a temperature-sensitive expres-sion vector (pUCCSVtsA58) and with the neomycinresistance expression vector pSV2-neo,24 and weregrown at 33°C to prevent temperature-sensitive auto-differentiation. Both of these are defined cell popula-tions that act as references for transcript expression byPDL and gingival fibroblast isolates.
RNA Isolation and RT-PCRRNA was extracted from gingival, dermal, and PDLfibroblasts using guanidine thiocyanate, and geneexpression was determined by RT-PCR.21 The num-ber of cycles was chosen by creating a standard curveusing serial dilutions of DNA template known toinclude the genes in question, and determining PCRconditions that reveal two-fold differences in geneexpression over three orders of magnitude. Twenty-fiveto 35 PCR cycles were chosen to be within the linearrange of detection for all of the genes examined. Theprimers for these studies were derived from the pub-lished DNA sequences of human genes expressed inperiodontal tissues and reported to be involved inosteogenesis (Table 1). In addition, specific integrin
40064.qxd 7/7/05 8:05 AM Page 1047
1048
Periodontal Ligament Fibroblast Gene Expression Volume 76 • Number 7
subunit primers were also utilizedas previously reported.21
Gingival, dermal, and PDLfibroblast values represent fourindependent isolates. The relativelevels of expression for a specifictranscript are expressed as a ratioof the expression by two differentcell populations, where a value of1 indicates identical levels of ex-pression. In this study, we deter-mined statistically that expressionlevels were significantly differentif there was a ≥ five-fold differencein expression, based upon theaverage variance between sam-ples within a group (40%), thenumber of independent samplesevaluated (four), and a confidencelevel >99%.
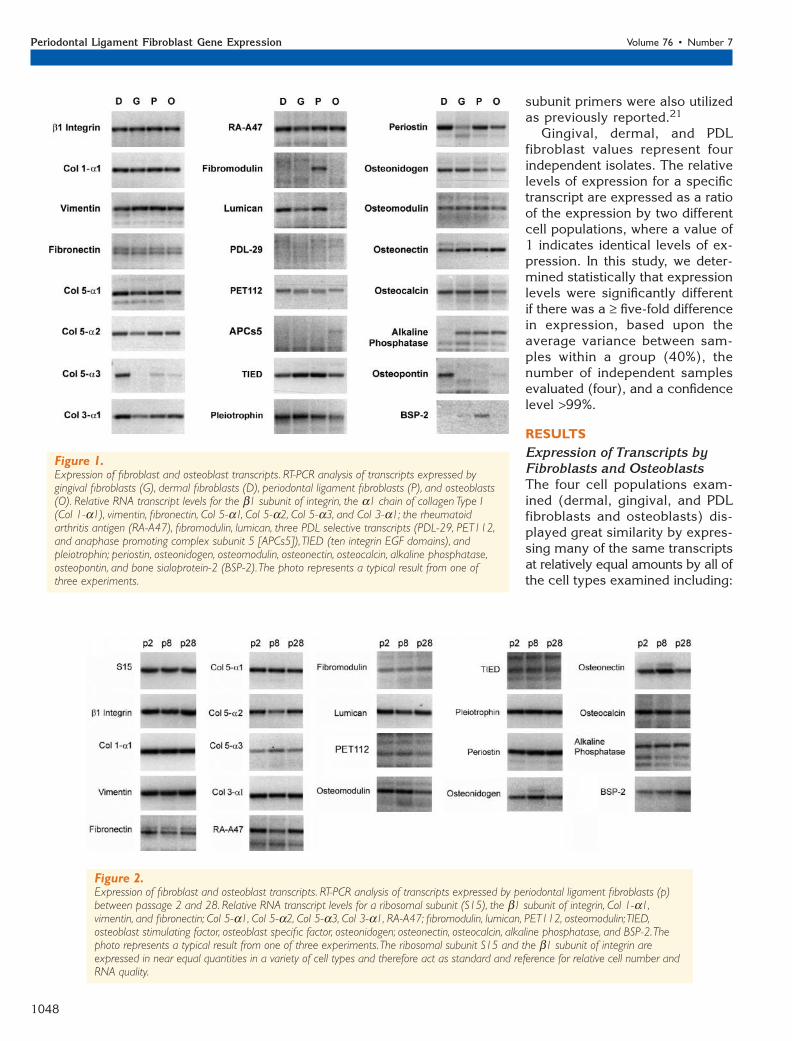
RESULTSExpression of Transcripts byFibroblasts and OsteoblastsThe four cell populations exam-ined (dermal, gingival, and PDLfibroblasts and osteoblasts) dis-played great similarity by expres-sing many of the same transcriptsat relatively equal amounts by all ofthe cell types examined including:
Figure 1.Expression of fibroblast and osteoblast transcripts. RT-PCR analysis of transcripts expressed bygingival fibroblasts (G), dermal fibroblasts (D), periodontal ligament fibroblasts (P), and osteoblasts(O). Relative RNA transcript levels for the β1 subunit of integrin, the α1 chain of collagen Type I(Col 1-α1), vimentin, fibronectin, Col 5-α1, Col 5-α2, Col 5-α3, and Col 3-α1; the rheumatoidarthritis antigen (RA-A47), fibromodulin, lumican, three PDL selective transcripts (PDL-29, PET112,and anaphase promoting complex subunit 5 [APCs5]),TIED (ten integrin EGF domains), andpleiotrophin; periostin, osteonidogen, osteomodulin, osteonectin, osteocalcin, alkaline phosphatase,osteopontin, and bone sialoprotein-2 (BSP-2).The photo represents a typical result from one ofthree experiments.
Figure 2.Expression of fibroblast and osteoblast transcripts. RT-PCR analysis of transcripts expressed by periodontal ligament fibroblasts (p)between passage 2 and 28. Relative RNA transcript levels for a ribosomal subunit (S15), the β1 subunit of integrin, Col 1-α1,vimentin, and fibronectin; Col 5-α1, Col 5-α2, Col 5-α3, Col 3-α1, RA-A47; fibromodulin, lumican, PET112, osteomodulin;TIED,osteoblast stimulating factor, osteoblast specific factor, osteonidogen; osteonectin, osteocalcin, alkaline phosphatase, and BSP-2.Thephoto represents a typical result from one of three experiments.The ribosomal subunit S15 and the β1 subunit of integrin areexpressed in near equal quantities in a variety of cell types and therefore act as standard and reference for relative cell number andRNA quality.
40064.qxd 7/7/05 8:05 AM Page 1048
1049
J Periodontol • July 2005 Lallier, Spencer, Fowler
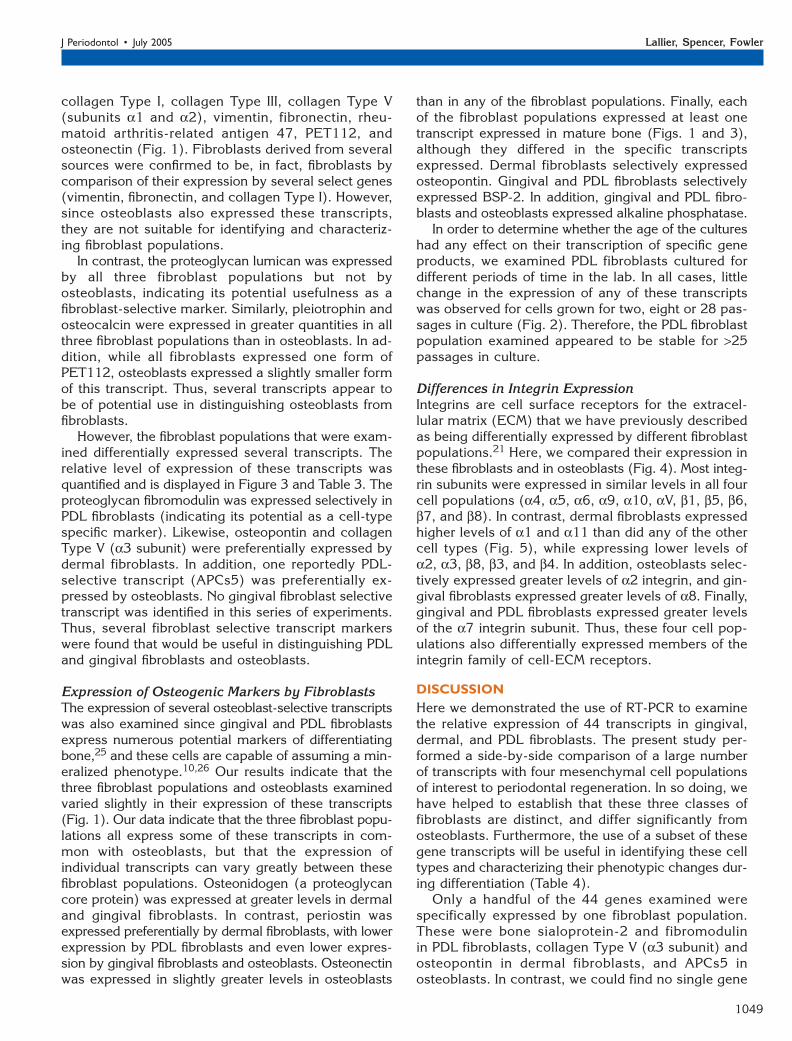
collagen Type I, collagen Type III, collagen Type V(subunits α1 and α2), vimentin, fibronectin, rheu-matoid arthritis-related antigen 47, PET112, andosteonectin (Fig. 1). Fibroblasts derived from severalsources were confirmed to be, in fact, fibroblasts bycomparison of their expression by several select genes(vimentin, fibronectin, and collagen Type I). However,since osteoblasts also expressed these transcripts,they are not suitable for identifying and characteriz-ing fibroblast populations.
In contrast, the proteoglycan lumican was expressedby all three fibroblast populations but not byosteoblasts, indicating its potential usefulness as afibroblast-selective marker. Similarly, pleiotrophin andosteocalcin were expressed in greater quantities in allthree fibroblast populations than in osteoblasts. In ad-dition, while all fibroblasts expressed one form ofPET112, osteoblasts expressed a slightly smaller formof this transcript. Thus, several transcripts appear tobe of potential use in distinguishing osteoblasts fromfibroblasts.
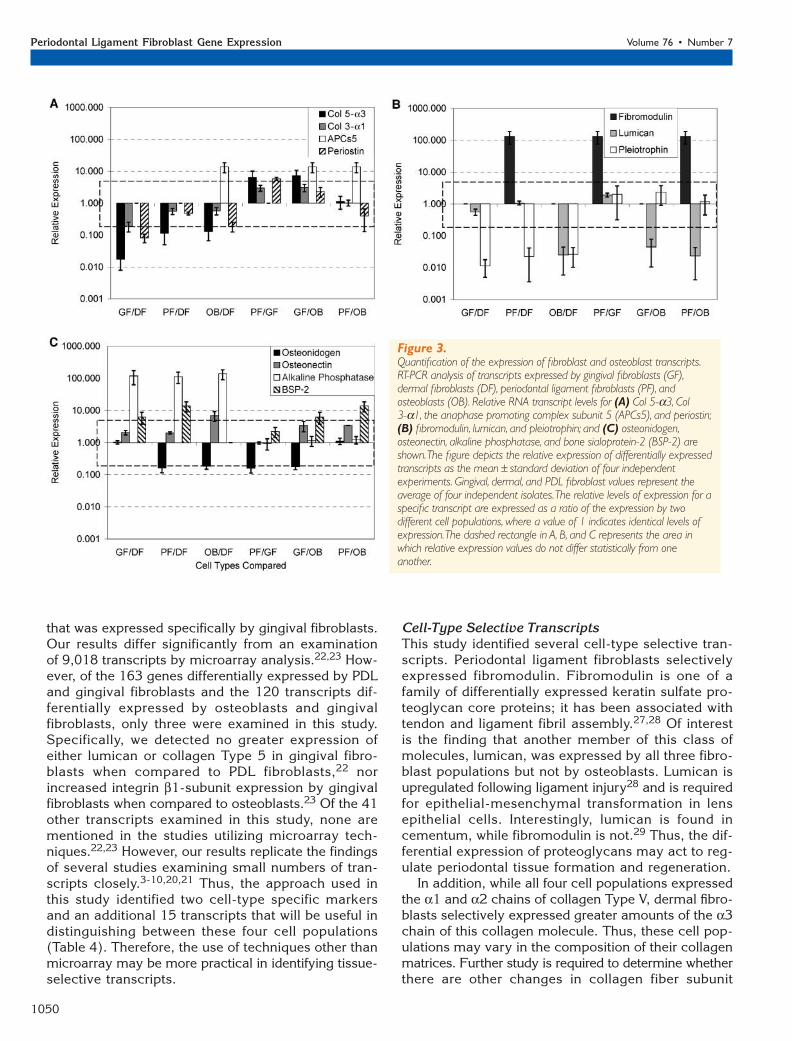
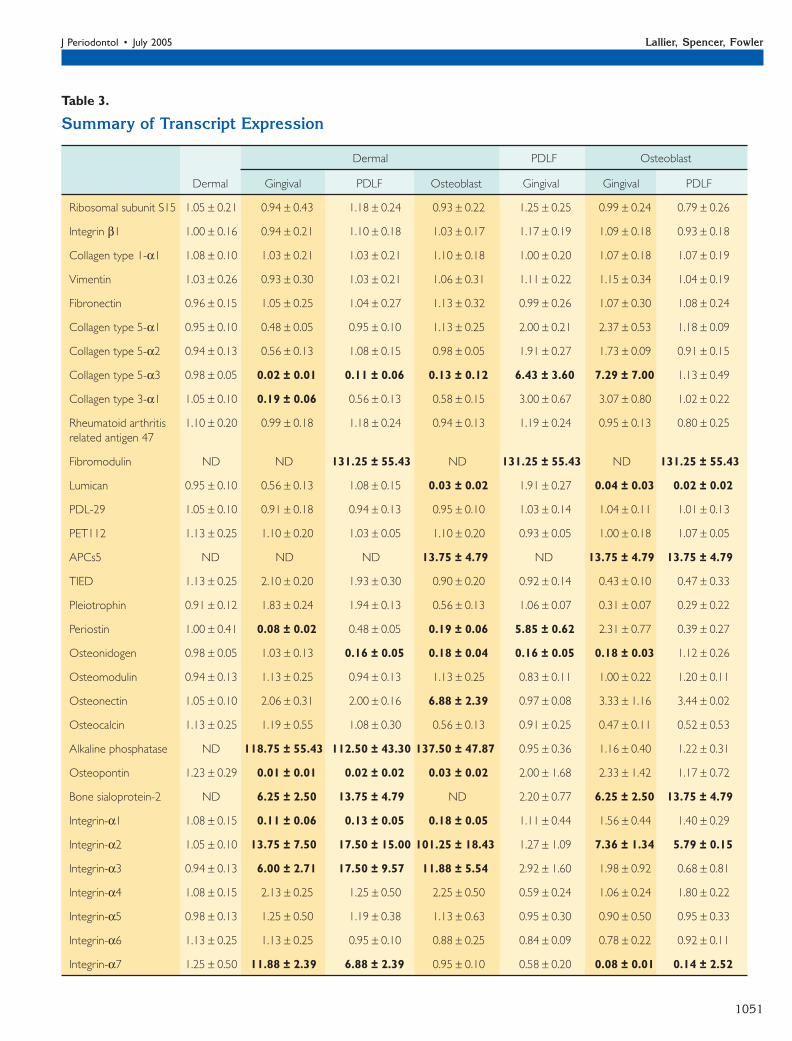
However, the fibroblast populations that were exam-ined differentially expressed several transcripts. Therelative level of expression of these transcripts wasquantified and is displayed in Figure 3 and Table 3. Theproteoglycan fibromodulin was expressed selectively inPDL fibroblasts (indicating its potential as a cell-typespecific marker). Likewise, osteopontin and collagenType V (α3 subunit) were preferentially expressed bydermal fibroblasts. In addition, one reportedly PDL-selective transcript (APCs5) was preferentially ex-pressed by osteoblasts. No gingival fibroblast selectivetranscript was identified in this series of experiments.Thus, several fibroblast selective transcript markerswere found that would be useful in distinguishing PDLand gingival fibroblasts and osteoblasts.
Expression of Osteogenic Markers by FibroblastsThe expression of several osteoblast-selective transcriptswas also examined since gingival and PDL fibroblastsexpress numerous potential markers of differentiatingbone,25 and these cells are capable of assuming a min-eralized phenotype.10,26 Our results indicate that thethree fibroblast populations and osteoblasts examinedvaried slightly in their expression of these transcripts(Fig. 1). Our data indicate that the three fibroblast popu-lations all express some of these transcripts in com-mon with osteoblasts, but that the expression ofindividual transcripts can vary greatly between thesefibroblast populations. Osteonidogen (a proteoglycancore protein) was expressed at greater levels in dermaland gingival fibroblasts. In contrast, periostin wasexpressed preferentially by dermal fibroblasts, with lowerexpression by PDL fibroblasts and even lower expres-sion by gingival fibroblasts and osteoblasts. Osteonectinwas expressed in slightly greater levels in osteoblasts
than in any of the fibroblast populations. Finally, eachof the fibroblast populations expressed at least onetranscript expressed in mature bone (Figs. 1 and 3),although they differed in the specific transcriptsexpressed. Dermal fibroblasts selectively expressedosteopontin. Gingival and PDL fibroblasts selectivelyexpressed BSP-2. In addition, gingival and PDL fibro-blasts and osteoblasts expressed alkaline phosphatase.
In order to determine whether the age of the cultureshad any effect on their transcription of specific geneproducts, we examined PDL fibroblasts cultured fordifferent periods of time in the lab. In all cases, littlechange in the expression of any of these transcriptswas observed for cells grown for two, eight or 28 pas-sages in culture (Fig. 2). Therefore, the PDL fibroblastpopulation examined appeared to be stable for >25passages in culture.
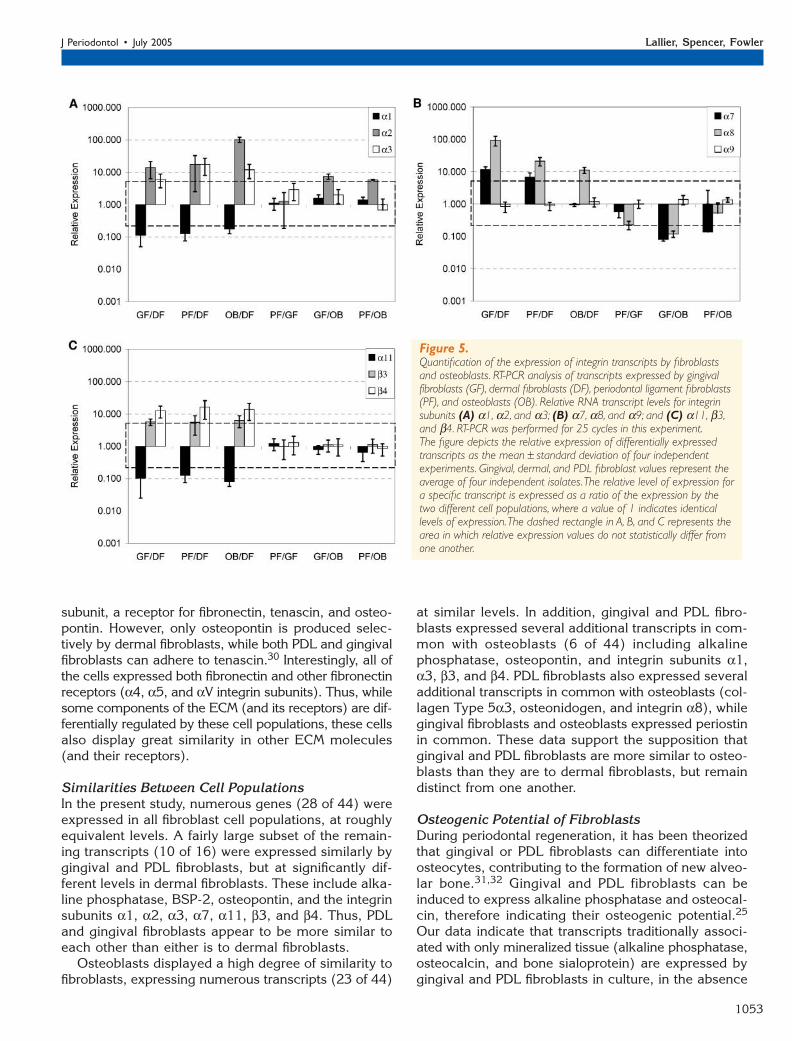
Differences in Integrin ExpressionIntegrins are cell surface receptors for the extracel-lular matrix (ECM) that we have previously describedas being differentially expressed by different fibroblastpopulations.21 Here, we compared their expression inthese fibroblasts and in osteoblasts (Fig. 4). Most integ-rin subunits were expressed in similar levels in all fourcell populations (α4, α5, α6, α9, α10, αV, β1, β5, β6,β7, and β8). In contrast, dermal fibroblasts expressedhigher levels of α1 and α11 than did any of the othercell types (Fig. 5), while expressing lower levels ofα2, α3, β8, β3, and β4. In addition, osteoblasts selec-tively expressed greater levels of α2 integrin, and gin-gival fibroblasts expressed greater levels of α8. Finally,gingival and PDL fibroblasts expressed greater levelsof the α7 integrin subunit. Thus, these four cell pop-ulations also differentially expressed members of theintegrin family of cell-ECM receptors.
DISCUSSIONHere we demonstrated the use of RT-PCR to examinethe relative expression of 44 transcripts in gingival,dermal, and PDL fibroblasts. The present study per-formed a side-by-side comparison of a large numberof transcripts with four mesenchymal cell populationsof interest to periodontal regeneration. In so doing, wehave helped to establish that these three classes offibroblasts are distinct, and differ significantly fromosteoblasts. Furthermore, the use of a subset of thesegene transcripts will be useful in identifying these celltypes and characterizing their phenotypic changes dur-ing differentiation (Table 4).
Only a handful of the 44 genes examined werespecifically expressed by one fibroblast population.These were bone sialoprotein-2 and fibromodulinin PDL fibroblasts, collagen Type V (α3 subunit) andosteopontin in dermal fibroblasts, and APCs5 inosteoblasts. In contrast, we could find no single gene
40064.qxd 7/7/05 8:05 AM Page 1049
1050
Periodontal Ligament Fibroblast Gene Expression Volume 76 • Number 7
that was expressed specifically by gingival fibroblasts.Our results differ significantly from an examinationof 9,018 transcripts by microarray analysis.22,23 How-ever, of the 163 genes differentially expressed by PDLand gingival fibroblasts and the 120 transcripts dif-ferentially expressed by osteoblasts and gingivalfibroblasts, only three were examined in this study.Specifically, we detected no greater expression ofeither lumican or collagen Type 5 in gingival fibro-blasts when compared to PDL fibroblasts,22 norincreased integrin β1-subunit expression by gingivalfibroblasts when compared to osteoblasts.23 Of the 41other transcripts examined in this study, none arementioned in the studies utilizing microarray tech-niques.22,23 However, our results replicate the findingsof several studies examining small numbers of tran-scripts closely.3-10,20,21 Thus, the approach used inthis study identified two cell-type specific markersand an additional 15 transcripts that will be useful indistinguishing between these four cell populations(Table 4). Therefore, the use of techniques other thanmicroarray may be more practical in identifying tissue-selective transcripts.
Cell-Type Selective TranscriptsThis study identified several cell-type selective tran-scripts. Periodontal ligament fibroblasts selectivelyexpressed fibromodulin. Fibromodulin is one of afamily of differentially expressed keratin sulfate pro-teoglycan core proteins; it has been associated withtendon and ligament fibril assembly.27,28 Of interestis the finding that another member of this class ofmolecules, lumican, was expressed by all three fibro-blast populations but not by osteoblasts. Lumican isupregulated following ligament injury28 and is requiredfor epithelial-mesenchymal transformation in lensepithelial cells. Interestingly, lumican is found incementum, while fibromodulin is not.29 Thus, the dif-ferential expression of proteoglycans may act to reg-ulate periodontal tissue formation and regeneration.
In addition, while all four cell populations expressedthe α1 and α2 chains of collagen Type V, dermal fibro-blasts selectively expressed greater amounts of the α3chain of this collagen molecule. Thus, these cell pop-ulations may vary in the composition of their collagenmatrices. Further study is required to determine whetherthere are other changes in collagen fiber subunit
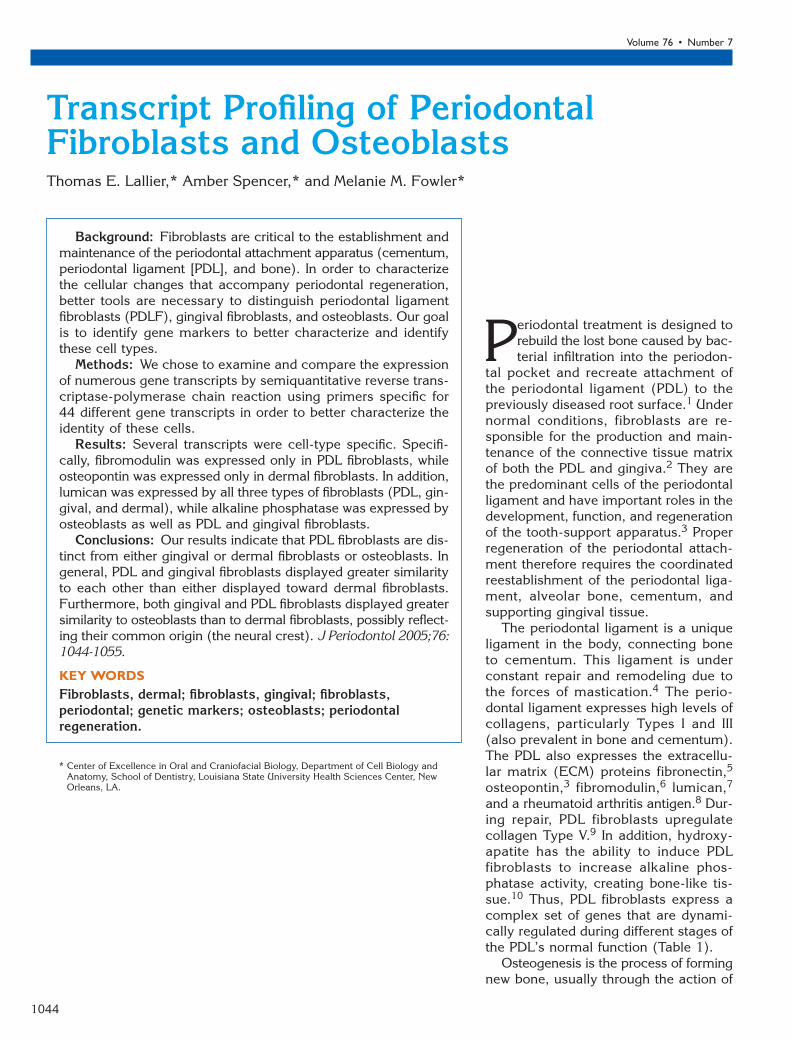
Figure 3.Quantification of the expression of fibroblast and osteoblast transcripts.RT-PCR analysis of transcripts expressed by gingival fibroblasts (GF),dermal fibroblasts (DF), periodontal ligament fibroblasts (PF), andosteoblasts (OB). Relative RNA transcript levels for (A) Col 5-α3, Col3-α1, the anaphase promoting complex subunit 5 (APCs5), and periostin;(B) fibromodulin, lumican, and pleiotrophin; and (C) osteonidogen,osteonectin, alkaline phosphatase, and bone sialoprotein-2 (BSP-2) areshown.The figure depicts the relative expression of differentially expressedtranscripts as the mean±standard deviation of four independentexperiments. Gingival, dermal, and PDL fibroblast values represent theaverage of four independent isolates.The relative levels of expression for aspecific transcript are expressed as a ratio of the expression by twodifferent cell populations, where a value of 1 indicates identical levels ofexpression.The dashed rectangle in A, B, and C represents the area inwhich relative expression values do not differ statistically from oneanother.
40064.qxd 7/7/05 8:05 AM Page 1050
1051
J Periodontol • July 2005 Lallier, Spencer, Fowler
Table 3.
Summary of Transcript Expression
Dermal PDLF Osteoblast
Dermal Gingival PDLF Osteoblast Gingival Gingival PDLF
Ribosomal subunit S15 1.05 ± 0.21 0.94 ± 0.43 1.18 ± 0.24 0.93 ± 0.22 1.25 ± 0.25 0.99 ± 0.24 0.79 ± 0.26
Integrin β1 1.00 ± 0.16 0.94 ± 0.21 1.10 ± 0.18 1.03 ± 0.17 1.17 ± 0.19 1.09 ± 0.18 0.93 ± 0.18
Collagen type 1-α1 1.08 ± 0.10 1.03 ± 0.21 1.03 ± 0.21 1.10 ± 0.18 1.00 ± 0.20 1.07 ± 0.18 1.07 ± 0.19
Vimentin 1.03 ± 0.26 0.93 ± 0.30 1.03 ± 0.21 1.06 ± 0.31 1.11 ± 0.22 1.15 ± 0.34 1.04 ± 0.19
Fibronectin 0.96 ± 0.15 1.05 ± 0.25 1.04 ± 0.27 1.13 ± 0.32 0.99 ± 0.26 1.07 ± 0.30 1.08 ± 0.24
Collagen type 5-α1 0.95 ± 0.10 0.48 ± 0.05 0.95 ± 0.10 1.13 ± 0.25 2.00 ± 0.21 2.37 ± 0.53 1.18 ± 0.09
Collagen type 5-α2 0.94 ± 0.13 0.56 ± 0.13 1.08 ± 0.15 0.98 ± 0.05 1.91 ± 0.27 1.73 ± 0.09 0.91 ± 0.15
Collagen type 5-α3 0.98 ± 0.05 0.02 ± 0.01 0.11 ± 0.06 0.13 ± 0.12 6.43 ± 3.60 7.29 ± 7.00 1.13 ± 0.49
Collagen type 3-α1 1.05 ± 0.10 0.19 ± 0.06 0.56 ± 0.13 0.58 ± 0.15 3.00 ± 0.67 3.07 ± 0.80 1.02 ± 0.22
Rheumatoid arthritis 1.10 ± 0.20 0.99 ± 0.18 1.18 ± 0.24 0.94 ± 0.13 1.19 ± 0.24 0.95 ± 0.13 0.80 ± 0.25related antigen 47
Fibromodulin ND ND 131.25 ± 55.43 ND 131.25 ± 55.43 ND 131.25 ± 55.43
Lumican 0.95 ± 0.10 0.56 ± 0.13 1.08 ± 0.15 0.03 ± 0.02 1.91 ± 0.27 0.04 ± 0.03 0.02 ± 0.02
PDL-29 1.05 ± 0.10 0.91 ± 0.18 0.94 ± 0.13 0.95 ± 0.10 1.03 ± 0.14 1.04 ± 0.11 1.01 ± 0.13
PET112 1.13 ± 0.25 1.10 ± 0.20 1.03 ± 0.05 1.10 ± 0.20 0.93 ± 0.05 1.00 ± 0.18 1.07 ± 0.05
APCs5 ND ND ND 13.75 ± 4.79 ND 13.75 ± 4.79 13.75 ± 4.79
TIED 1.13 ± 0.25 2.10 ± 0.20 1.93 ± 0.30 0.90 ± 0.20 0.92 ± 0.14 0.43 ± 0.10 0.47 ± 0.33
Pleiotrophin 0.91 ± 0.12 1.83 ± 0.24 1.94 ± 0.13 0.56 ± 0.13 1.06 ± 0.07 0.31 ± 0.07 0.29 ± 0.22
Periostin 1.00 ± 0.41 0.08 ± 0.02 0.48 ± 0.05 0.19 ± 0.06 5.85 ± 0.62 2.31 ± 0.77 0.39 ± 0.27
Osteonidogen 0.98 ± 0.05 1.03 ± 0.13 0.16 ± 0.05 0.18 ± 0.04 0.16 ± 0.05 0.18 ± 0.03 1.12 ± 0.26
Osteomodulin 0.94 ± 0.13 1.13 ± 0.25 0.94 ± 0.13 1.13 ± 0.25 0.83 ± 0.11 1.00 ± 0.22 1.20 ± 0.11
Osteonectin 1.05 ± 0.10 2.06 ± 0.31 2.00 ± 0.16 6.88 ± 2.39 0.97 ± 0.08 3.33 ± 1.16 3.44 ± 0.02
Osteocalcin 1.13 ± 0.25 1.19 ± 0.55 1.08 ± 0.30 0.56 ± 0.13 0.91 ± 0.25 0.47 ± 0.11 0.52 ± 0.53
Alkaline phosphatase ND 118.75 ± 55.43 112.50 ± 43.30 137.50 ± 47.87 0.95 ± 0.36 1.16 ± 0.40 1.22 ± 0.31
Osteopontin 1.23 ± 0.29 0.01 ± 0.01 0.02 ± 0.02 0.03 ± 0.02 2.00 ± 1.68 2.33 ± 1.42 1.17 ± 0.72
Bone sialoprotein-2 ND 6.25 ± 2.50 13.75 ± 4.79 ND 2.20 ± 0.77 6.25 ± 2.50 13.75 ± 4.79
Integrin-α1 1.08 ± 0.15 0.11 ± 0.06 0.13 ± 0.05 0.18 ± 0.05 1.11 ± 0.44 1.56 ± 0.44 1.40 ± 0.29
Integrin-α2 1.05 ± 0.10 13.75 ± 7.50 17.50 ± 15.00 101.25 ± 18.43 1.27 ± 1.09 7.36 ± 1.34 5.79 ± 0.15
Integrin-α3 0.94 ± 0.13 6.00 ± 2.71 17.50 ± 9.57 11.88 ± 5.54 2.92 ± 1.60 1.98 ± 0.92 0.68 ± 0.81
Integrin-α4 1.08 ± 0.15 2.13 ± 0.25 1.25 ± 0.50 2.25 ± 0.50 0.59 ± 0.24 1.06 ± 0.24 1.80 ± 0.22
Integrin-α5 0.98 ± 0.13 1.25 ± 0.50 1.19 ± 0.38 1.13 ± 0.63 0.95 ± 0.30 0.90 ± 0.50 0.95 ± 0.33
Integrin-α6 1.13 ± 0.25 1.13 ± 0.25 0.95 ± 0.10 0.88 ± 0.25 0.84 ± 0.09 0.78 ± 0.22 0.92 ± 0.11
Integrin-α7 1.25 ± 0.50 11.88 ± 2.39 6.88 ± 2.39 0.95 ± 0.10 0.58 ± 0.20 0.08 ± 0.01 0.14 ± 2.52
40064.qxd 7/7/05 8:05 AM Page 1051
1052
Periodontal Ligament Fibroblast Gene Expression Volume 76 • Number 7
Table 3. (continued)
Summary of Transcript Expression
Dermal PDLF Osteoblast
Dermal Gingival PDLF Osteoblast Gingival Gingival PDLF
Integrin-α8 ND 93.75 ± 31.46 21.25 ± 6.29 11.25 ± 2.50 0.23 ± 0.07 0.12 ± 0.03 0.53 ± 0.56
Integrin-α9 1.25 ± 0.50 0.85 ± 0.30 0.88 ± 0.25 1.19 ± 0.38 1.03 ± 0.29 1.40 ± 0.44 1.36 ± 0.21
Integrin-α10 0.94 ± 0.13 0.96 ± 0.15 1.19 ± 0.38 1.13 ± 0.25 1.23 ± 0.39 1.17 ± 0.26 0.95 ± 0.33
Integrin-α11 1.19 ± 0.38 0.10 ± 0.08 0.13 ± 0.05 0.08 ± 0.02 1.22 ± 0.49 0.79 ± 0.23 0.65 ± 0.62
Integrin-αV 1.50 ± 1.00 0.90 ± 0.20 1.38 ± 1.11 0.94 ± 0.13 1.53 ± 1.23 1.04 ± 0.14 0.68 ± 1.18
Integrin-β1 1.25 ± 0.50 1.30 ± 0.60 1.19 ± 0.55 1.31 ± 0.38 0.91 ± 0.43 1.01 ± 0.29 1.11 ± 0.42
Integrin-β3 0.94 ± 0.13 5.63 ± 1.25 5.50 ± 3.32 6.25 ± 2.50 0.98 ± 0.59 1.11 ± 0.44 1.14 ± 0.53
Integrin-β4 ND 12.50 ± 5.00 16.25 ± 9.46 13.75 ± 7.50 1.30 ± 0.76 1.10 ± 0.60 0.85 ± 0.69
Integrin-β5 1.35 ± 0.70 1.13 ± 0.47 1.05 ± 0.17 1.13 ± 0.25 0.93 ± 0.15 1.00 ± 0.22 1.07 ± 0.15
Integrin-β6 1.13 ± 0.25 1.94 ± 0.13 2.15 ± 0.30 2.75 ± 0.50 1.11 ± 0.15 1.42 ± 0.26 1.28 ± 0.11
Integrin-β7 1.19 ± 0.38 2.10 ± 0.20 1.95 ± 0.10 2.05 ± 0.10 0.93 ± 0.05 0.98 ± 0.05 1.05 ± 0.05
Integrin-β8 1.44 ± 1.05 3.50 ± 1.00 2.13 ± 0.25 1.15 ± 0.30 0.61 ± 0.07 0.33 ± 0.09 0.54 ± 0.22
The relative levels of transcript expression for the 44 genes evaluated in this study are presented as the ratio of expression between dermal fibroblasts and PDLand gingival fibroblasts as well as osteoblasts. The relative levels of transcript expression are presented as the means and standard deviations for fourindependent cell isolates for the PDL and gingival fibroblasts and four separate samples of the dermal fibroblasts and osteoblasts. In addition, an evaluation ofpair-wise comparisons between these cells types is presented. These include comparisons of dermal fibroblasts to gingival fibroblasts, dermal fibroblasts toPDL fibroblasts, dermal fibroblasts to osteoblasts, gingival fibroblasts to PDL fibroblasts, gingival fibroblasts to osteoblasts, and PDL fibroblasts to osteoblasts.Each value represents the mean ±± standard deviation of four independent experiments. Gingival and PDL fibroblast values represent four independent isolates.Cells highlighted in boldface type indicate transcripts that differed in a statistically significant manner in their expression from one cell population to another.ND == not detectable in either cell type being examined.
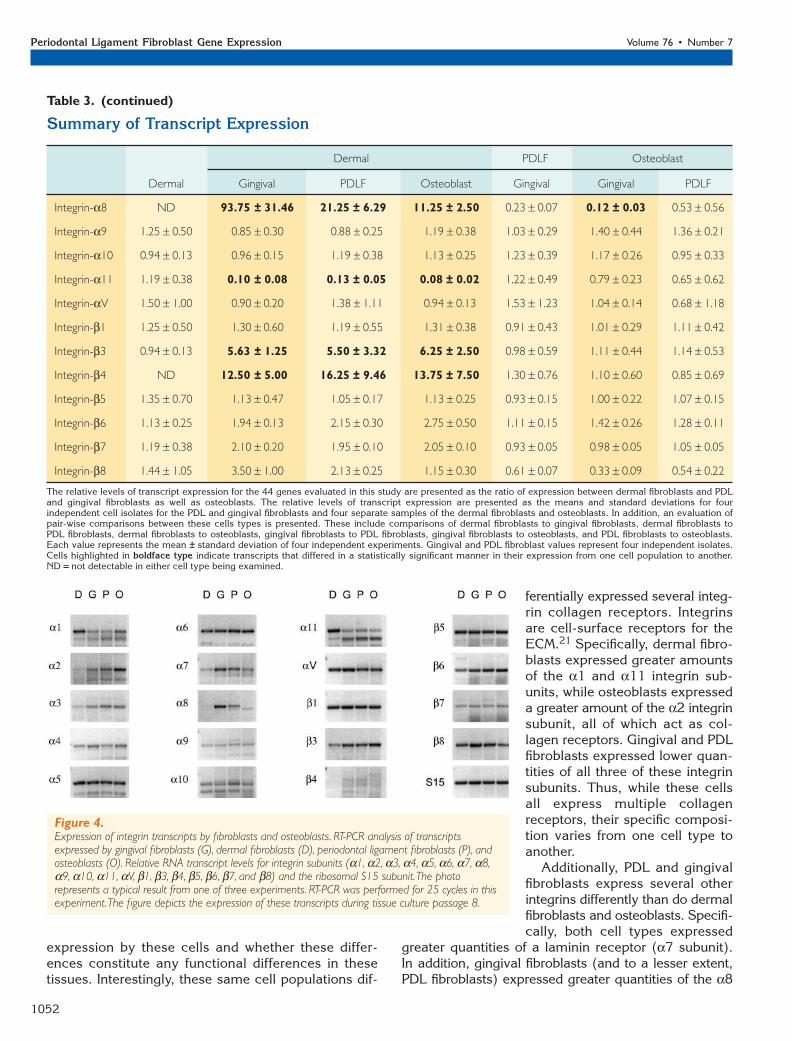
ferentially expressed several integ-rin collagen receptors. Integrinsare cell-surface receptors for theECM.21 Specifically, dermal fibro-blasts expressed greater amountsof the α1 and α11 integrin sub-units, while osteoblasts expresseda greater amount of the α2 integrinsubunit, all of which act as col-lagen receptors. Gingival and PDLfibroblasts expressed lower quan-tities of all three of these integrinsubunits. Thus, while these cellsall express multiple collagenreceptors, their specific composi-tion varies from one cell type toanother.
Additionally, PDL and gingivalfibroblasts express several otherintegrins differently than do dermalfibroblasts and osteoblasts. Specifi-cally, both cell types expressed
greater quantities of a laminin receptor (α7 subunit).In addition, gingival fibroblasts (and to a lesser extent,PDL fibroblasts) expressed greater quantities of the α8
Figure 4.Expression of integrin transcripts by fibroblasts and osteoblasts. RT-PCR analysis of transcriptsexpressed by gingival fibroblasts (G), dermal fibroblasts (D), periodontal ligament fibroblasts (P), andosteoblasts (O). Relative RNA transcript levels for integrin subunits (α1, α2, α3, α4, α5, α6, α7, α8,α9, α10, α11, αV, β1, β3, β4, β5, β6, β7, and β8) and the ribosomal S15 subunit.The photorepresents a typical result from one of three experiments. RT-PCR was performed for 25 cycles in thisexperiment.The figure depicts the expression of these transcripts during tissue culture passage 8.
expression by these cells and whether these differ-ences constitute any functional differences in thesetissues. Interestingly, these same cell populations dif-
40064.qxd 7/7/05 8:05 AM Page 1052
1053
J Periodontol • July 2005 Lallier, Spencer, Fowler
subunit, a receptor for fibronectin, tenascin, and osteo-pontin. However, only osteopontin is produced selec-tively by dermal fibroblasts, while both PDL and gingivalfibroblasts can adhere to tenascin.30 Interestingly, all ofthe cells expressed both fibronectin and other fibronectinreceptors (α4, α5, and αV integrin subunits). Thus, whilesome components of the ECM (and its receptors) are dif-ferentially regulated by these cell populations, these cellsalso display great similarity in other ECM molecules(and their receptors).
Similarities Between Cell PopulationsIn the present study, numerous genes (28 of 44) wereexpressed in all fibroblast cell populations, at roughlyequivalent levels. A fairly large subset of the remain-ing transcripts (10 of 16) were expressed similarly bygingival and PDL fibroblasts, but at significantly dif-ferent levels in dermal fibroblasts. These include alka-line phosphatase, BSP-2, osteopontin, and the integrinsubunits α1, α2, α3, α7, α11, β3, and β4. Thus, PDLand gingival fibroblasts appear to be more similar toeach other than either is to dermal fibroblasts.
Osteoblasts displayed a high degree of similarity tofibroblasts, expressing numerous transcripts (23 of 44)
at similar levels. In addition, gingival and PDL fibro-blasts expressed several additional transcripts in com-mon with osteoblasts (6 of 44) including alkalinephosphatase, osteopontin, and integrin subunits α1,α3, β3, and β4. PDL fibroblasts also expressed severaladditional transcripts in common with osteoblasts (col-lagen Type 5α3, osteonidogen, and integrin α8), whilegingival fibroblasts and osteoblasts expressed periostinin common. These data support the supposition thatgingival and PDL fibroblasts are more similar to osteo-blasts than they are to dermal fibroblasts, but remaindistinct from one another.
Osteogenic Potential of FibroblastsDuring periodontal regeneration, it has been theorizedthat gingival or PDL fibroblasts can differentiate intoosteocytes, contributing to the formation of new alveo-lar bone.31,32 Gingival and PDL fibroblasts can beinduced to express alkaline phosphatase and osteocal-cin, therefore indicating their osteogenic potential.25
Our data indicate that transcripts traditionally associ-ated with only mineralized tissue (alkaline phosphatase,osteocalcin, and bone sialoprotein) are expressed bygingival and PDL fibroblasts in culture, in the absence
Figure 5.Quantification of the expression of integrin transcripts by fibroblastsand osteoblasts. RT-PCR analysis of transcripts expressed by gingivalfibroblasts (GF), dermal fibroblasts (DF), periodontal ligament fibroblasts(PF), and osteoblasts (OB). Relative RNA transcript levels for integrinsubunits (A) α1, α2, and α3; (B) α7, α8, and α9; and (C) α11, β3,and β4. RT-PCR was performed for 25 cycles in this experiment.The figure depicts the relative expression of differentially expressedtranscripts as the mean ± standard deviation of four independentexperiments. Gingival, dermal, and PDL fibroblast values represent theaverage of four independent isolates.The relative level of expression fora specific transcript is expressed as a ratio of the expression by thetwo different cell populations, where a value of 1 indicates identicallevels of expression.The dashed rectangle in A, B, and C represents thearea in which relative expression values do not statistically differ fromone another.
40064.qxd 7/7/05 8:05 AM Page 1053
1054
Periodontal Ligament Fibroblast Gene Expression Volume 76 • Number 7
Table 4.
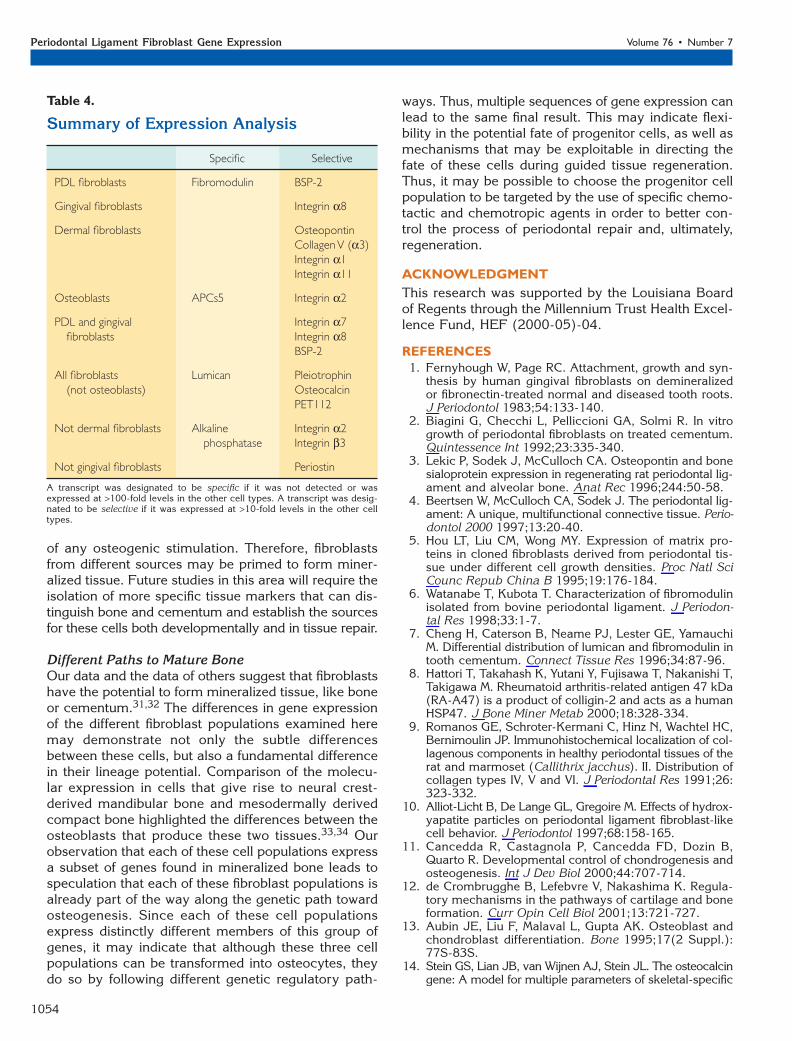
Summary of Expression Analysis
Specific Selective
PDL fibroblasts Fibromodulin BSP-2
Gingival fibroblasts Integrin α8
Dermal fibroblasts OsteopontinCollagen V (α3)Integrin α1Integrin α11
Osteoblasts APCs5 Integrin α2
PDL and gingival Integrin α7fibroblasts Integrin α8
BSP-2
All fibroblasts Lumican Pleiotrophin(not osteoblasts) Osteocalcin
PET112
Not dermal fibroblasts Alkaline Integrin α2phosphatase Integrin β3
Not gingival fibroblasts Periostin
A transcript was designated to be specific if it was not detected or wasexpressed at >100-fold levels in the other cell types. A transcript was desig-nated to be selective if it was expressed at >10-fold levels in the other celltypes.
of any osteogenic stimulation. Therefore, fibroblastsfrom different sources may be primed to form miner-alized tissue. Future studies in this area will require theisolation of more specific tissue markers that can dis-tinguish bone and cementum and establish the sourcesfor these cells both developmentally and in tissue repair.
Different Paths to Mature BoneOur data and the data of others suggest that fibroblastshave the potential to form mineralized tissue, like boneor cementum.31,32 The differences in gene expressionof the different fibroblast populations examined heremay demonstrate not only the subtle differencesbetween these cells, but also a fundamental differencein their lineage potential. Comparison of the molecu-lar expression in cells that give rise to neural crest-derived mandibular bone and mesodermally derivedcompact bone highlighted the differences between theosteoblasts that produce these two tissues.33,34 Ourobservation that each of these cell populations expressa subset of genes found in mineralized bone leads tospeculation that each of these fibroblast populations isalready part of the way along the genetic path towardosteogenesis. Since each of these cell populationsexpress distinctly different members of this group ofgenes, it may indicate that although these three cellpopulations can be transformed into osteocytes, theydo so by following different genetic regulatory path-
ways. Thus, multiple sequences of gene expression canlead to the same final result. This may indicate flexi-bility in the potential fate of progenitor cells, as well asmechanisms that may be exploitable in directing thefate of these cells during guided tissue regeneration.Thus, it may be possible to choose the progenitor cellpopulation to be targeted by the use of specific chemo-tactic and chemotropic agents in order to better con-trol the process of periodontal repair and, ultimately,regeneration.
ACKNOWLEDGMENTThis research was supported by the Louisiana Boardof Regents through the Millennium Trust Health Excel-lence Fund, HEF (2000-05)-04.
REFERENCES1. Fernyhough W, Page RC. Attachment, growth and syn-
thesis by human gingival fibroblasts on demineralizedor fibronectin-treated normal and diseased tooth roots.J Periodontol 1983;54:133-140.
2. Biagini G, Checchi L, Pelliccioni GA, Solmi R. In vitrogrowth of periodontal fibroblasts on treated cementum.Quintessence Int 1992;23:335-340.
3. Lekic P, Sodek J, McCulloch CA. Osteopontin and bonesialoprotein expression in regenerating rat periodontal lig-ament and alveolar bone. Anat Rec 1996;244:50-58.
4. Beertsen W, McCulloch CA, Sodek J. The periodontal lig-ament: A unique, multifunctional connective tissue. Perio-dontol 2000 1997;13:20-40.
5. Hou LT, Liu CM, Wong MY. Expression of matrix pro-teins in cloned fibroblasts derived from periodontal tis-sue under different cell growth densities. Proc Natl SciCounc Repub China B 1995;19:176-184.
6. Watanabe T, Kubota T. Characterization of fibromodulinisolated from bovine periodontal ligament. J Periodon-tal Res 1998;33:1-7.
7. Cheng H, Caterson B, Neame PJ, Lester GE, YamauchiM. Differential distribution of lumican and fibromodulin intooth cementum. Connect Tissue Res 1996;34:87-96.
8. Hattori T, Takahash K, Yutani Y, Fujisawa T, Nakanishi T,Takigawa M. Rheumatoid arthritis-related antigen 47 kDa(RA-A47) is a product of colligin-2 and acts as a humanHSP47. J Bone Miner Metab 2000;18:328-334.
9. Romanos GE, Schroter-Kermani C, Hinz N, Wachtel HC,Bernimoulin JP. Immunohistochemical localization of col-lagenous components in healthy periodontal tissues of therat and marmoset (Callithrix jacchus). II. Distribution ofcollagen types IV, V and VI. J Periodontal Res 1991;26:323-332.
10. Alliot-Licht B, De Lange GL, Gregoire M. Effects of hydrox-yapatite particles on periodontal ligament fibroblast-likecell behavior. J Periodontol 1997;68:158-165.
11. Cancedda R, Castagnola P, Cancedda FD, Dozin B,Quarto R. Developmental control of chondrogenesis andosteogenesis. Int J Dev Biol 2000;44:707-714.
12. de Crombrugghe B, Lefebvre V, Nakashima K. Regula-tory mechanisms in the pathways of cartilage and boneformation. Curr Opin Cell Biol 2001;13:721-727.
13. Aubin JE, Liu F, Malaval L, Gupta AK. Osteoblast andchondroblast differentiation. Bone 1995;17(2 Suppl.):77S-83S.
14. Stein GS, Lian JB, van Wijnen AJ, Stein JL. The osteocalcingene: A model for multiple parameters of skeletal-specific
40064.qxd 7/7/05 8:05 AM Page 1054

1055
J Periodontol • July 2005 Lallier, Spencer, Fowler
transcriptional control. Mol Biol Rep 1997;24:185-196.15. Jundt G, Berghauser KH, Termine JD, Schulz A. Osteo-
nectin – a differentiation marker of bone cells. Cell Tis-sue Res 1987;248:409-415.
16. Wendel M, Sommarin Y, Heinegard D. Bone matrix pro-teins: Isolation and characterization of a novel cell-bindingkeratan sulfate proteoglycan (osteoadherin) from bovinebone. J Cell Biol 1998;141:839-847.
17. Berg RW, Leung E, Gough S, et al. Cloning and char-acterization of a novel beta integrin-related cDNA cod-ing for the protein TIED (“ten beta integrin EGF-likerepeat domains”) that maps to chromosome band13q33: A divergent stand-alone integrin stalk structure.Genomics 1999;56:169-178.
18. Gieffers C, Engelhardt W, Brenzel G, Matsuishi T, FreyJ. Receptor binding of osteoblast-specific factor 1 (OSF-1/HB-GAM) to human osteosarcoma cells promotes cellattachment. Eur J Cell Biol 1993;62:352-361.
19. Masuda H, Tsujimura A, Yoshioka M, et al. Bone massloss due to estrogen deficiency is compensated in trans-genic mice overexpressing human osteoblast stimulat-ing factor-1. Biochem Biophys Res Commun 1997;238:528-533.
20. Giannopoulou C, Cimasoni G. Functional characteristicsof gingival and periodontal ligament fibroblasts. J DentRes 1996;75:895-902.
21. Palaiologou AA, Yukna RA, Moses R, Lallier TE. Gingival,dermal, and periodontal ligament fibroblasts express dif-ferent extracellular matrix receptors. J Periodontol 2001;72:798-807.
22. Han X, Amar S. Identification of genes differentiallyexpressed in cultured human periodontal ligament fibro-blasts versus human gingival fibroblasts by DNA micro-array analysis. J Dent Res 2002;81:399-405.
23. Han X, Bolcato AL, Amar S. Identification of genesdifferentially expressed in cultured human osteoblastsversus human fibroblasts by DNA microarray analysis.Connect Tissue Res 2002;43:63-75.
24. Harris SA, Enger RJ, Riggs BL, Spelsberg TC. Develop-ment and characterization of a conditionally immortal-ized human fetal osteoblastic cell line. J Bone Miner Res1995;10:178-186.
25. Carnes DL, Maeder CL, Graves DT. Cells with osteoblas-tic phenotypes can be explanted from human gingiva andperiodontal ligament. J Periodontol 1997;68:701-707.
26. Kuru L, Griffiths GS, Petrie A, Olsen I. Alkaline phos-phatase activity is upregulated in regenerating humanperiodontal cells. J Periodontal Res 1999;34:123-127.
27. Nurminskaya MV, Birk DE. Differential expression ofgenes associated with collagen fibril growth in thechicken tendon: Identification of structural and regula-tory genes by subtractive hybridization. Arch BiochemBiophys 1998;350:1-9.
28. Boykiw R, Sciore P, Reno C, Marchuk L, Frank CB, HartDA. Altered levels of extracellular matrix moleculemRNA in healing rabbit ligaments. Matrix Biol 1998;17:371-378.
29. Ababneh KT, Hall RC, Embery G. The proteoglycans ofhuman cementum: Immunohistochemical localization inhealthy, periodontally involved and ageing teeth. J Perio-dontal Res 1999;34:87-96.
30. Kuru L, Parkar MH, Griffiths GS, Newman HN, Olsen I.Flow cytometry analysis of gingival and periodontal lig-ament cells. J Dent Res 1998;77:555-564.
31. American Academy of Periodontology. The potential roleof growth and differentiation factors in periodontal regen-eration (position paper). J Periodontol 1996;67:545-553.
32. Murakami S, Takayama S, Ikezawa K, et al. Regenera-tion of periodontal tissues by basic fibroblast growth fac-tor. J Periodontal Res 1999;34:425-430.
33. Ferguson C, Alpern E, Miclau T, Helms JA. Does adultfracture repair recapitulate embryonic skeletal forma-tion? Mech Dev 1999;87:57-66.
34. Schneider RA, Hu D, Helms JA. From head to toe: Con-servation of molecular signals regulating limb and crani-ofacial morphogenesis. Cell Tissue Res 1999;296:103-109.
Correspondence: Dr. Thomas E. Lallier, Louisiana State Uni-versity Health Science Center, Department of Cell Biologyand Anatomy, Center of Excellence in Oral and CraniofacialBiology, School of Dentistry, 1100 Florida Ave., New Orleans,LA 70119. Fax: 504/619-8741; e-mail: [email protected].
Accepted for publication May 5, 2004.
40064.qxd 7/7/05 8:05 AM Page 1055