Embed Size (px)
Citation preview
TRANS‐ORIENT PETROLEUM LTD.
RESOURCE ESTIMATION AND ECONOMIC EVALUATION
EAST COAST BASIN, NEW ZEALAND
September 2008
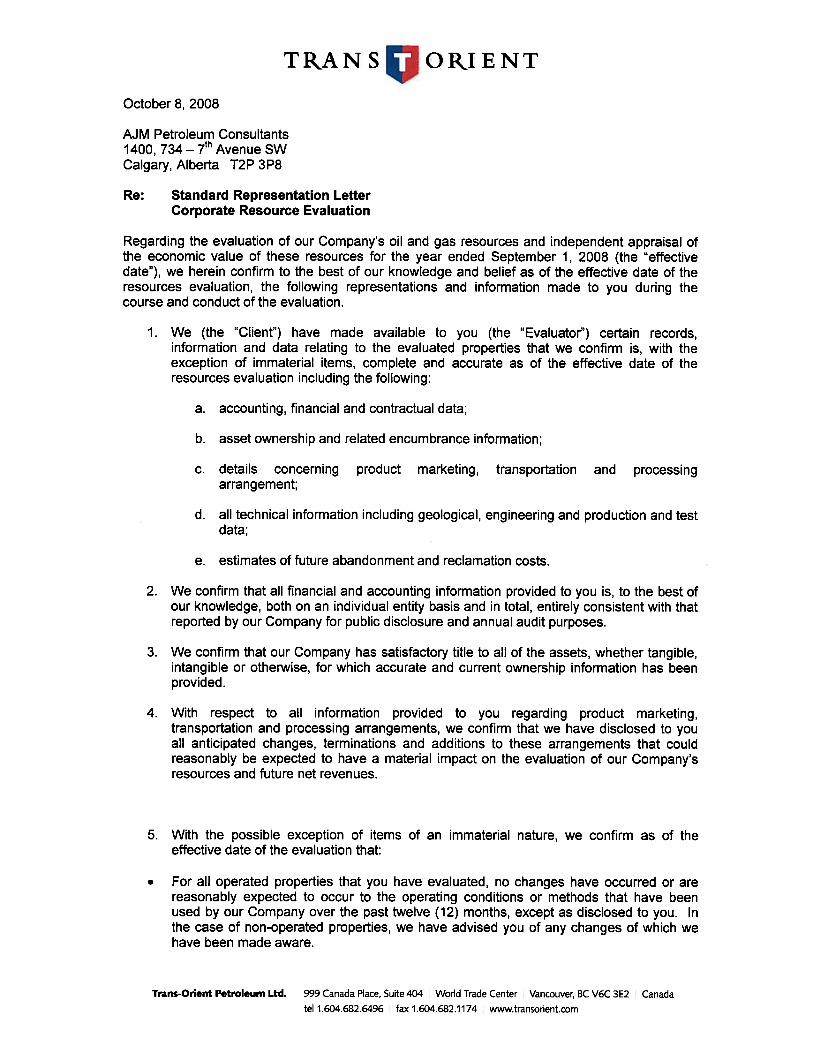
October 10, 2008 Trans‐Orient Petroleum Ltd. Corporate Head Office 999 Canada Place, Suite 404 World Trade Center Vancouver, British Columbia V6C 3E2 Attention: Mr. Drew Cadenhead RE: Trans‐Orient Petroleum Ltd.
Resource Estimation and Economic Evaluation At your request and authorization, AJM Petroleum Consultants (“AJM”) has prepared an independent evaluation of the resource potential of the East Coast Basin property in New Zealand, for Trans‐Orient Petroleum Ltd. (“Trans‐Orient”). The effective date of the evaluation is September 1, 2008. The evaluation includes an estimate of the total resource potential and Trans‐Orient’s share of the original volume‐in‐place in the area. The resource potential was determined in accordance with the business practices, evaluation procedures, and resource definitions contained within National Instrument 51‐101 “Standards of Disclosure for Oil and Gas Activities” (NI 51‐101) Section 5.9 and outlined more specifically in the “Canadian Oil and Gas Evaluation Handbook” (COGEH). This report has been prepared for the exclusive use of Trans‐Orient Petroleum Ltd. No part of this report shall be reproduced, distributed, or made available to any other person, company, regulatory body, or organization pursuant to Part 5 Section 5.7 of NI 51‐101. AJM Petroleum Consultants hereby gives its consent to the use of its name and to the said estimates pursuant to Part 5 Section 5.7 Item (2) of NI51‐101. The extent and character of ownership and all factual data supplied by Trans‐Orient Petroleum Ltd. were accepted as presented. A field inspection and environmental / safety assessment of the property was not made by AJM and the consultant makes no representation and accepts no responsibilities in this regard. AJM reserves the right to review all calculations referred to or included in this report and to review the estimates in light of erroneous data supplied or information existing but not made available which becomes known subsequent to the preparation of this report.
‐ 2‐ Trans‐Orient Petroleum Ltd. Resource Estimation and Economic Evaluation
A Boe conversion ratio of 6 Mcf: 1 barrel has been used within this report. This conversion ratio is based on an energy equivalency conversion method primarily applicable at the burner tip and does not represent a value equivalency at the wellhead. It has been a pleasure to perform this evaluation for you, and we trust it is sufficient to meet your current requirements. Should you have any questions please do not hesitate to contact the undersigned at (403) 648‐3223. Yours truly, AJM Petroleum Consultants Original signed by; “Robin G. Bertram” Vice President /ct
Independent Petroleum Consultants Consent
The undersigned firm of Independent Qualified Reserves Evaluators and Auditors of Calgary, Alberta, Canada has prepared an independent evaluation of the resource potential derived therefrom, of the Petroleum and Natural Gas assets of the interests of Trans‐Orient Petroleum Ltd. according to the Canadian Oil and Gas Evaluation Handbook. These resources and net present value were estimated using forecast prices and costs (before and after income taxes) according to the requirements of National Instrument 51‐101 (NI 51‐101). The effective date of this evaluation is August 31, 2008. In the course of the evaluation, Trans‐Orient Petroleum Ltd. provided AJM Petroleum Consultants personnel with basic information which included land, well and accounting (product prices and operating costs) information; reservoir and geological studies, estimates of on‐stream dates for certain properties, contract information, budget forecasts and financial data. Other engineering, geological or economic data required to conduct the evaluation and upon which this report is based, were obtained from public records, other operators and from AJM Petroleum Consultants non confidential files. The extent and character of ownership and accuracy of all factual data supplied for the independent evaluation, from all sources, has been accepted. A “Representation Letter” dated October 8, 2008 and signed by both the President & Chief Executive Officer and the Chief Operating Officer was received from Trans‐Orient Petroleum Ltd. prior to the finalization of this report. This letter specifically addressed the accuracy, completeness and materiality of all the data and information that was supplied to us during the course of our evaluation of Trans‐Orient Petroleum Ltd.’s resources and net present values. This letter is included within. A field inspection and environmental/safety assessment of the properties was beyond the scope of the engagement of AJM Petroleum Consultants and none was carried out. The “Representation Letter” received from Trans‐Orient Petroleum Ltd. provided assurance that no additional information necessary for the completion of our assignment would have been obtained by a field inspection. The accuracy of any resource and production estimates is a function of the quality and quantity of available data and of engineering interpretation and judgment. While resource and production estimates presented herein are considered reasonable, and adhere to the COGE Handbook and NI 51‐101 (as applicable), the estimates should be accepted with the understanding that reservoir performance subsequent to the date of the estimate may justify revision, either upward or downward. Revenue projections presented in this report are based in part on forecasts of market prices, current exchange rates, inflation, market demand and government policy which are subject to uncertainties and may in future differ materially from the forecasts herein. Present values of future net revenues documented in this report do not necessarily represent the fair market value of the resources evaluated herein. Body copy. Second page format only – use for separate documents that need to be merged with others. You can insert Page / Section breaks where needed.
PERMIT TO PRACTICE
AJM Petroleum Consultants Permit Number: P‐7149
The Association of Professional Engineers, Geologists and Geophysicists of Alberta

CERTIFICATE OF QUALIFICATION
I, R. G. Bertram, a Professional Engineer, of the 6th Floor, 425 – 1st Street S.W., Calgary, Alberta, Canada hereby certify that: 1. I am an associate of AJM Petroleum Consultants, which company did prepare a detailed
analysis of certain New Zealand oil and gas assets of the interests of Trans‐Orient Petroleum Ltd. The effective date of this evaluation is September 1, 2008.
2. I do not have, nor do I expect to receive any direct or indirect interest in the properties
evaluated in this report or in the securities of Trans‐Orient Petroleum Ltd.
3. I attended the University of Alberta and graduated with a Bachelor of Science Degree in
Petroleum Engineering in 1985; that I am a Registered Professional Engineer in the Province of Alberta; and I have in excess of twenty three years of experience in petroleum engineering.
4. A personal field inspection of the properties was not made; however, such an inspection was
not considered necessary in view of information available from the files of the interest owners of the properties and the appropriate provincial regulatory authorities.
Original signed by: “R. G. Bertram” R. G. Bertram, P. Eng. October 9, 2008 Date
CERTIFICATE OF QUALIFICATION
I, L. D. Boyd, a Registered Professional Geologist, of the 6th Floor, 425 – 1st Street S.W., Calgary, Alberta, Canada hereby certify that: 1. I am an associate of AJM Petroleum Consultants, which company did prepare a detailed
analysis of certain New Zealand oil and gas assets of the interests of Trans‐Orient Petroleum Ltd. The effective date of this evaluation is September 1, 2008.
2. I do not have, nor do I expect to receive any direct or indirect interest in the properties
evaluated in this report or in the securities of Trans‐Orient Petroleum Ltd. 3. I attended the University of Calgary and graduated with a Bachelor of Science Degree in
Geology in 1976; that I am a Registered Professional Geologist in the Province of Alberta; and I have in excess of thirty two years experience in geological evaluations.
4. A personal field inspection of the properties was not made; however, such an inspection was
not considered necessary in view of information available from the files of the interest owners of the properties and the appropriate provincial regulatory authorities.
Original signed by: “L. D. Boyd” L. D. Boyd, P. Geol. October 9, 2008 Date


EVALUATION PROCEDURE
Effective as of September 2008
Table of Contents
Introduction – Reserves Methodology
Geology
Land Schedules and Maps
Reserves Estimation and Production Forecasts
Reserve Definitions
Royalties and Taxes
Operating and Capital Considerations
Price and Market Demand Forecasts
Glossary of Terms
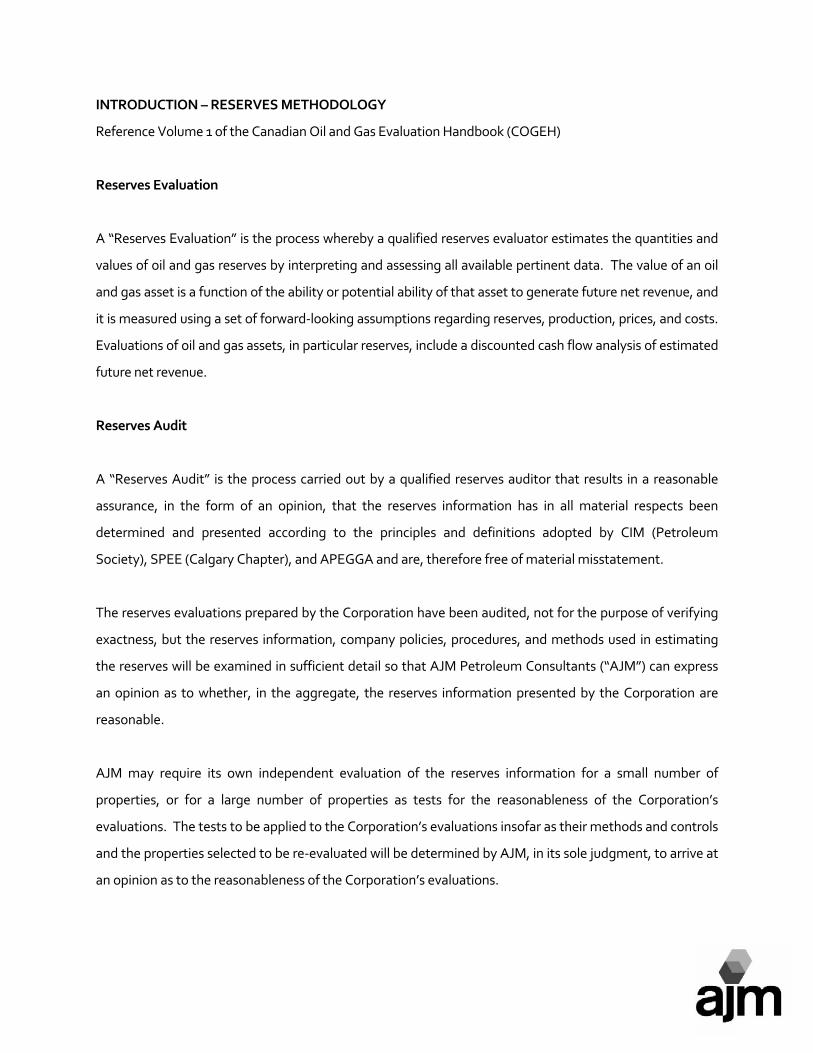
INTRODUCTION – RESERVES METHODOLOGY
Reference Volume 1 of the Canadian Oil and Gas Evaluation Handbook (COGEH)
Reserves Evaluation
A “Reserves Evaluation” is the process whereby a qualified reserves evaluator estimates the quantities and
values of oil and gas reserves by interpreting and assessing all available pertinent data. The value of an oil
and gas asset is a function of the ability or potential ability of that asset to generate future net revenue, and
it is measured using a set of forward‐looking assumptions regarding reserves, production, prices, and costs.
Evaluations of oil and gas assets, in particular reserves, include a discounted cash flow analysis of estimated
future net revenue.
Reserves Audit
A “Reserves Audit” is the process carried out by a qualified reserves auditor that results in a reasonable
assurance, in the form of an opinion, that the reserves information has in all material respects been
determined and presented according to the principles and definitions adopted by CIM (Petroleum
Society), SPEE (Calgary Chapter), and APEGGA and are, therefore free of material misstatement.
The reserves evaluations prepared by the Corporation have been audited, not for the purpose of verifying
exactness, but the reserves information, company policies, procedures, and methods used in estimating
the reserves will be examined in sufficient detail so that AJM Petroleum Consultants (“AJM”) can express
an opinion as to whether, in the aggregate, the reserves information presented by the Corporation are
reasonable.
AJM may require its own independent evaluation of the reserves information for a small number of
properties, or for a large number of properties as tests for the reasonableness of the Corporation’s
evaluations. The tests to be applied to the Corporation’s evaluations insofar as their methods and controls
and the properties selected to be re‐evaluated will be determined by AJM, in its sole judgment, to arrive at
an opinion as to the reasonableness of the Corporation’s evaluations.
Reserves Review
A “Reserves Review” is the process whereby a reserves auditor conducts a high‐level assessment of reserves
information to determine if it is plausible. The steps consist primarily of enquiry, analytical procedure,
analysis, review of historical reserves performance, and discussion with the Corporation’s reserves
management staff.
“Plausible” means the reserves data appear to be worthy of belief based on the information obtained by the
independent qualified reserves auditor in carrying out the aforementioned steps. Negative assurance can
be given by the independent reserves auditor, but an opinion cannot. For example, “Nothing came to my
attention that would indicate the reserves information has not been prepared and presented in accordance
with principles and definitions adopted by the Canadian Institute of Mining, Metallurgy & Petroleum (CIM)
(Petroleum Society), the Society of Petroleum Evaluation Engineers (SPEE) (Calgary Chapter), and
APEGGA (Practice Standard for the Evaluation of Oil and Gas Reserves for Public Disclosure).
Reviews do not require examination of the detailed document that supports the reserves information,
unless this information does not appear to be plausible.
GEOLOGY
An initial review of each property was undertaken to establish the produced maturity of the reservoir being
evaluated. Where there existed extensive production history a geologic analysis was not conducted since
the remaining hydrocarbons could be determined by productivity analysis.
For properties that were not of a mature productivity nature a geologic review was conducted. This work
consisted of analysis of logs in the area of interest and review of well tests. Net formation thickness (pay),
porosity, and initial water saturation were then utilized to establish volumetric hydrocarbons in place.
LAND SCHEDULE AND MAPS
The evaluated Corporation provided schedules of land ownership which included lessor and lessee royalty
burdens. The land data was accepted as factual and no investigation of title by AJM was made to verify the
records.
Evaluated well maps included within this report represent all of the Corporation’s interests that were
evaluated in the specified area.
RESERVE ESTIMATION AND PRODUCTION FORECASTS
Reserves were estimated either by i) volumetric, ii) decline curve analysis, iii) material balance techniques, or
iv) performance predictions.
Volumetric reserves were estimated using the wellbore net pay and an assigned drainage area or, where
sufficient data was available, the reservoir volumes calculated from isopach maps. Reservoir rock and fluid
data were obtained from available core analysis, well logs, PVT data, gas analysis, government sources, and
other published information either on the evaluated pool or from a similar reservoir in the immediate area.
In mature (producing) reservoirs decline curve analysis and/or material balance was utilized in all applicable
evaluations.
Whenever there is the need within an evaluation to assign reserves based on analogy or when
volumetric reserves are being assigned, petroCUBE™ is used by AJM evaluators.
petroCUBE is a web‐based (www.petroCUBE.com) product co‐developed by AJM Petroleum
Consultants and geoLOGIC Systems Inc. petroCUBE provides geostatistical, technical and financial
information for conventional hydrocarbon plays throughout the Western Canadian Sedimentary Basin
(“WCSB”).
The information provided by petroCUBE is an unbiased independent perspective into the historical
performance of the conventional hydrocarbon activity in the WCSB. The statistical information is
presented by commodity type (gas, oil) with each commodity further analyzed by geographic area and
play type.
Gas is divided into 16 geographic areas and approximately 14 stratigraphic groupings comprising over
120 gas plays; Oil is divided into 13 geographic areas and approximately 14 stratigraphic groupings
comprising over 75 oil plays. Analysis of each play is formulated on a per‐well zone basis, based on the
statistics and full cycle economics of wells drilled in the recent past (last five years).
Analysis output includes cumulative frequency resource distribution curves, chance of success tables,
production performance profiles for each play type and area, unrisked and risked resources, and initial
production rates on a per well zone basis, and full cycle economic and play parameters.
Cumulative frequency curves show how the reserves for a play are distributed. These calculations
include the average reserves for a play (Pmean), reserves for the best 10 percent of the wells (P10), the
minimum reserves developed by 90 percent of the wells (P90).
Reserves assigned are compared to those reserves noted in the cumulative frequency curves for the
corresponding area and play type. Typically an expected or proved plus probable reserve is a Pmean
reserve.
Production forecasts were based on historical trends or by comparison with other wells in the immediate
area producing from similar reservoirs. Non‐producing gas reserves were forecast to come on‐stream
February 1, 2010 under direct sales pricing and deliverability assumptions, if a tie‐in point to an existing
gathering system was in close proximity (approximately two miles). If the tie‐in point was of a greater
distance (and dependent on the reserve volume and risk) the reserves were forecast to come on‐stream
February 1, 2011. If the reserves were located in a remote location and/or the reserve volume was of higher
risk, the reserves were forecast to come on‐stream no earlier than February 1, 2014. These on‐stream dates
were used when the company could not provide specific on‐stream date information.
RESOURCE AND RESERVE DEFINITIONS
Resource Classification: Resources are classified by AJM Petroleum Consultants in accordance with the
definitions published by the Petroleum Society of CIM in The Canadian Oil and Gas Evaluation Handbook
(COGEH), Volume 1 2nd Edition. The reader is referred to the Handbook for a complete description of
Resources and only the particular definitions are quoted as follows.
The term “resources” encompasses all petroleum quantities that originally existed on or within the earth’s
crust in naturally occurring accumulations, including Discovered and Undiscovered (recoverable and
unrecoverable) plus quantities already produced. Accordingly, total resources is equivalent to Total
Petroleum Initially‐In‐Place (PIIP).
Total Petroleum Initially‐In‐Place (PIIP) is that quantity of petroleum that is estimated to exist originally in
naturally occurring accumulations. It includes that quantity of petroleum that is estimated, as of a given
date, to be contained in known accumulations, prior to production, plus those estimated quantities in
accumulations yet to be discovered (equivalent to “total resources”).
Discovered Petroleum Initially‐In‐Place (equivalent to discovered resources) is that quantity of petroleum
that is estimated, as of a given date, to be contained in known accumulations prior to production. The
recoverable portion of Discovered Petroleum Initially‐In‐Place includes Production, Reserves, and
Contingent Resources; the remainder is unrecoverable.
Production is the cumulative quantity of petroleum that has been recovered at a given date.
Reserves are estimated remaining quantities of oil and natural gas and related substances anticipated to be
recoverable from known accumulations, as of a given date, based on: the analysis of drilling, geological,
geophysical, and engineering data; the use of established technology; and specified economic conditions,
which are generally accepted as being reasonable. Reserves are further classified in accordance with the
level of certainty associated with the estimates and may be sub‐classified based on development and
production status. Refer to the full definitions on Reserves in Section 5.4 of COGEH.
Contingent Resources are those quantities of petroleum estimated, as of a given date, to be potentially
recoverable from known accumulations using established technology or technology under development,
but which are not currently considered to be commercially recoverable due to one or more contingencies.
Contingencies may include factors such as economic, legal, environmental, political and regulatory matters,
or a lack of markets. It is also appropriate to classify as contingent resources the estimated discovered
recoverable quantities associated with a project in the early evaluation stage. Contingent Resources are
further classified in accordance with the level of certainty associated with the estimates and may be sub‐
classified based on project maturity and/or characterized by their economic status. Refer to COGEH and
Figure 5‐1.
Unrecoverable is that portion of Discovered and Undiscovered PIIP quantities which is estimated, as of a
given date, not to be recoverable by future development projects. A portion of these quantities may
become recoverable in the future as commercial circumstances change or technological developments
occur; the remaining portion may never be recovered due to the physical/chemical constraints represented
by subsurface interaction of fluids and reservoir rocks.
Undiscovered Petroleum Initially‐In‐Place (equivalent to undiscovered resources) is that quantity of
petroleum that is estimated, on a given date, to be contained in accumulations yet to be discovered. The
recoverable portion of Undiscovered Petroleum Initially‐In‐Place is referred to as Prospective Resources; the
remainder as Unrecoverable.
Prospective Resources are those quantities of petroleum estimated, as of a given date, to be potentially
recoverable from undiscovered accumulations by application of future development projects. Prospective
Resources have both an associated chance of discovery and a chance of development. Prospective
Resources are further subdivided in accordance with the level of certainty associated with recoverable
estimates assuming their discovery and development and may be sub‐classified based on project maturity.
Refer to COGEH and Figure 5‐1.
Reserves, Contingent Resources, and Prospective Resources should not be combined without recognition of
the significant differences in criteria associated with their classification. For example, the sum of Reserves,
Contingent Resources, and Prospective Resources may be referred to as Remaining Recoverable Resources.
When resources categories are combined, it is important that each component of the summation also be
provided, and it should be made clear whether and how the components in the summation were adjusted
for risk.
Reserve Classification: Reserves are classified by AJM in accordance with the following definitions published
by COGEH and which meet the standards established by National Instrument 51‐101, Standards of
Disclosure for Oil and Gas Activities and found in Appendix 1 to Companion Policy 51‐101 CP, Part 2
Definition of Reserves.
Reserve Categories
Reserves are estimated remaining quantities of oil and natural gas and related substances anticipated to be
recoverable from known accumulations, as of a given date, based on
• analysis of drilling, geological, geophysical, and engineering data;
• the use of established technology; and
• specified economic conditions, which are generally accepted as being reasonable and shall
be disclosed.
Reserves are classified according to the degree of certainty associated with the estimates:
Proved Reserves are those reserves that can be estimated with a high degree of certainty to be
recoverable. It is likely that the actual remaining quantities recovered will exceed the estimated
proved reserves.
Probable Reserves are those additional reserves that are less certain to be recovered than proved
reserves. It is equally likely that the actual remaining quantities recovered will be greater or less
than the sum of the estimated proved plus probable reserves.
Possible Reserves are those additional reserves that are less certain to be recovered than probable
reserves. It is unlikely that the actual remaining quantities recovered will exceed the sum of the
estimated proved plus probable plus possible reserves.
Development and Production Status
Each of the reserves categories (proved, probable and possible) may be divided into developed and
undeveloped categories:
Developed Reserves are those reserves that are expected to be recovered from existing wells and
installed facilities or, if facilities have not been installed, that would involve a low expenditure (for
example, when compared to the cost of drilling a well) to put the reserves on production. The
developed category may be subdivided into producing and non‐producing.
Developed Producing Reserves are those reserves that are expected to be recovered from
completion intervals open at the time of the estimate. These reserves may be currently producing,
or if shut‐in, they must have previously been on production, and the date of resumption of
production must be known with reasonable certainty.
Developed Non‐Producing Reserves are those reserves that either have not been on production, or
have previously been on production, but are shut‐in, and the date of resumption of production is
unknown.
Undeveloped Reserves are those reserves expected to be recovered from known accumulations
where a significant expenditure (for example, when compared to the cost of drilling a well) is
required to render them capable of production. They must fully meet the requirements of the
reserves category (proved, probable, possible) to which they are assigned.
In multi‐well pools it may be appropriate to allocate total pool reserves between the developed and
undeveloped categories or to subdivide the developed reserves for the pool between developed
producing and developed non‐producing. This allocation should be based on the estimator’s
assessment as to the reserves that will be recovered from specific wells, facilities, and completion
intervals in the pool and their respective development and production status.
Levels of Certainty for Reported Reserves
The qualitative certainty levels referred to in the definitions above are applicable to individual reserves
entities (which refers to the lowest level at which reserves calculations are performed) and to reported
reserves (which refers to the highest – level sum of individual entity estimates for which reserves estimates
are presented). Reported reserves should target the following levels of certainty under a specific set of
economic conditions:
• at least a 90 percent probability that the quantities actually recovered will equal or exceed
the estimated proved reserves;
• at least a 50 percent probability that the quantities actually recovered will equal or exceed
the sum of the estimated proved plus probable reserves; and
• at least a 10 percent probability that the quantities actually recovered will equal or exceed
the sum of the estimated proved plus probable plus possible reserves.
A quantitative measure of the certainty levels pertaining to estimates prepared for the various reserves
categories is desirable to provide a clearer understanding of the associated risks and uncertainties.
However, the majority of reserves estimates are prepared using deterministic methods that do not provide
a mathematically derived quantitative measure of probability. In principle, there should be no difference
between estimates prepared using probabilistic or deterministic methods.
ROYALTIES AND TAXES
General
All royalties and taxes, including the lessor and overriding royalties, are based on current government
regulations, leases or farmout agreements.
Lessor interests and burdens applicable to each entity are detailed in the Well Interests Table.
AJM Petroleum Consultants utilize reserves and valuation program Mosaic (Version 2.5), a software product
of Entero Corporation.
OPERATING AND CAPITAL CONSIDERATIONS
Operating and capital costs were based on current costs escalated to the date the cost was incurred. Costs
listed on the Capital Sheet and Economic Parameter Sheet are in current year dollars. The economic runs
provide the escalated dollar costs as found in the Pricing Table 1 in the Price and Market Demand section.
Reserves estimated to meet the standards of NI51‐101 of constant prices and costs, are based on
unescalated operating and capital costs.
Capital costs were either provided by the Corporation (and reviewed by AJM for reasonableness); or
determined by AJM taking into account well capability, facility requirement, and distance to markets.
Facility expenditures for shut‐in gas are forecast to occur in the month prior to the wells first production.
Operating costs were determined from historical data on the property as provided by the evaluated
Corporation. If this data was not available or incomplete, the costs were based on AJM experience and
historical database. Operating costs are defined into three types.
The first type, variable ($/Unit), covers the costs directly associated with the product production. Costs for
processing, gathering and compression are based on raw gas volumes. Over the life of the project the costs
are inflated in escalated runs to reflect the increase in costs over time. In a constant dollar review the costs
remain flat over the project life.
The second type, fixed plant or battery ($/year), is again a fixed component over the project life and reflects
any gas plant or battery operating costs allocated back to the evaluated group. The plant or battery can
also be run as a separate group and subsequently consolidated at the property level. It must be noted that
discussion with the client is required to determine operational feasibility of the facility over time. Parts of
the plant may be shut‐in as capacity is reduced over time. At some future point in time capital may be
required to optimize the facility or take the product to a different facility paying a trucking cost for oil and
gathering and processing fee for gas. Potential availability and location of plants with excess capacity has to
be considered. As per previous operating costs, this cost is also inflated over time in escalated cases and
held constant in constant dollar runs.
The third type takes the remaining costs that are not associated with the first two and assigns them to the
well based on a fixed and variable component. A split of 65 percent fixed and 35 percent variable assumes
efficiencies of operation over time, i.e.: the well operator can reduce the number of monthly visits as the
well matures, workovers may be delayed, well maintenance can also be reduced. The basic assumption is
that the field operator will continue to find efficiencies to reduce the costs over time to maintain the overall
$/Boe cost. Thus as the production drops over time the 35 percent variable cost will account for these
efficiencies. If production is flat all the costs will also remain flat. Both the fixed and variable costs in this
type are inflated in the escalated case and held constant in the constant dollar review. These costs also
include property taxes, lease rentals, government fees, and administrative overhead.
In evaluations conducted for purposes of NI51‐101, well abandonment costs have been included and these
costs were either provided by the Corporation (and reviewed by AJM for reasonableness) or estimated by
AJM based on its experience. For undeveloped reserve estimates for undrilled locations, site reclamation
costs are also included for the purpose of determining whether reserves should be attributed to that
property in the first year in which the reserves are considered for attribution to the property.
GLOSSARY OF TERMS
This glossary is provided only for convenience. AJM subscribes to the Glossary of Terms as defined by the Canadian Oil and Gas Evaluation Handbook. The COGE Handbook can be obtained from the Petroleum Society of CIM at www.petsoc.org.
Gross Reserves These are the total reserves to be recovered from a property.
Company Gross Reserves These are the working interest owner’s share of gross reserves before the deduction of royalties. Royalty interest share of reserves is not included in this category.
Company Net Reserves These are the working interest owner’s share of gross reserves after the deduction of royalties. Royalty interest share of reserves is included in this category.
Net Profits Interests Occasionally, interests in oil and gas properties are encumbered by net profits interests, in addition to lessor and overriding royalty interests. A net profits interest is an interest in production income only and not in production. The net profits interest owner may have value, but has not interest in reserves; therefore, no reserves are assigned to this owner.
Net Operating Income Company interest income after the sale of oil, gas, by‐products plus other income, less burdens and operating expenses.
Before Tax Cash Flow Net operating income less any capital investment to the property
Discounting
Discounting utilized by AJM Petroleum Consultants being the projections of values discounted to the middle of a given period utilizing the following formula:
Discount Factor: 1 (1 + i)n‐½
where i = interest rate as a decimal per period and n = number of periods.
Crude Oil A mixture, consisting mainly of pentanes and heavier
hydrocarbons, that exists in the liquid phase in reservoirs and remains liquid at atmospheric pressure and temperature. Crude oil may contain small amounts of sulphur and non‐hydrocarbon compounds, but does not include liquids obtained from the processing of natural gas.
Synthetic Crude Oil A mixture of hydrocarbons derived by upgrading crude bitumen from oil sands, and kerogen from oil shales or other substances such as coal. May contain sulphur or other non‐hydrocarbon compounds and has many similarities to crude oil.
Raw Natural Gas Natural gas as it is produced from the reservoir prior to processing. It is gaseous at the conditions under which its volume is measured or estimated.
Marketable Natural Gas (Sales Gas)
Natural gas that meets specifications for its end use, whether it occurs naturally or results from the processing of raw natural gas. Field and plant fuel and losses are excluded, excepting those related to downstream reprocessing plants.
Natural Gas Liquids Those hydrocarbon components that can be recovered from natural gas as liquids including, but not limited to, ethane, propane, butanes, pentanes plus, condensate, and small quantities of non‐hydrocarbons.
Expenses Fixed Expenses that do not vary with fluctuations in the producing rate.
Expenses Variable Expenses that vary with fluctuations in the producing rate.
NORTH ISLAND
SOUTH
ISLA
ND
CHATHAMISLAND
Tasman Sea
South Pacific Ocean
Tkapuna
NapierHastings
Palmerston North
Rotorua
Lower HuttWellington
TaurangaHamilton
AucklandManurewa
Dunedin
Invercargill
Christchurch
386km0
PROJECT: tra loc
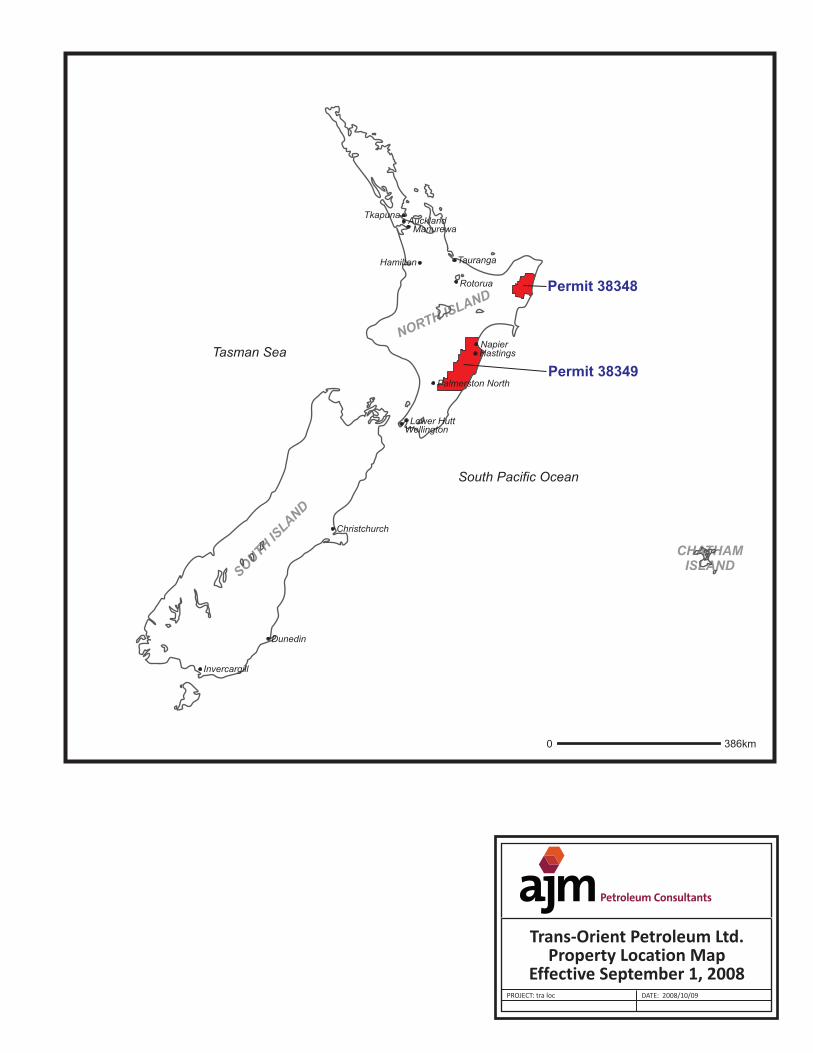
Trans-Orient Petroleum Ltd.Property Location Map
Effective September 1, 2008DATE: 2008/10/09
Permit 38348
Permit 38349
PROPERTY INDEX
1. East Coast Basin, New Zealand
TRANS‐ORIENT PETROLEUM LTD.
EAST COAST BASIN, NEW ZEALAND
Effective Date: September 1, 2008
Prepared by:
R. G. Bertram, P. Eng.
L. D. Boyd, P. Geol.
EAST COAST BASIN, NEW ZEALAND
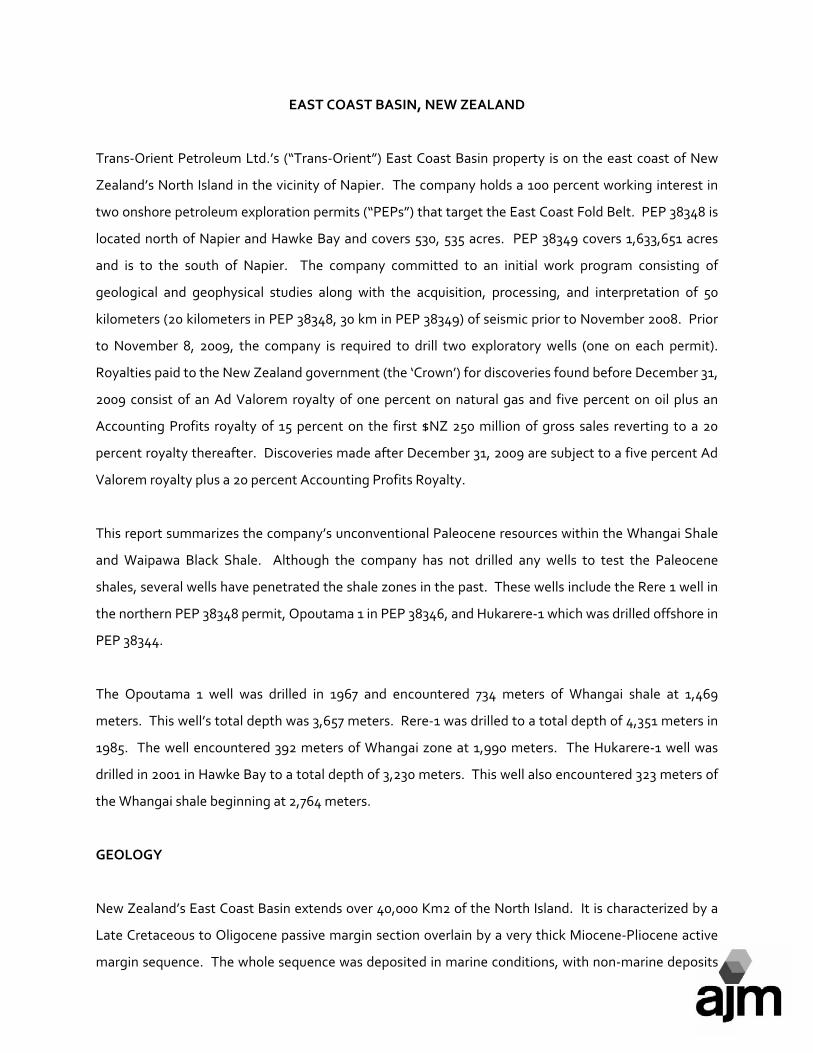
Trans‐Orient Petroleum Ltd.’s (“Trans‐Orient”) East Coast Basin property is on the east coast of New
Zealand’s North Island in the vicinity of Napier. The company holds a 100 percent working interest in
two onshore petroleum exploration permits (“PEPs”) that target the East Coast Fold Belt. PEP 38348 is
located north of Napier and Hawke Bay and covers 530, 535 acres. PEP 38349 covers 1,633,651 acres
and is to the south of Napier. The company committed to an initial work program consisting of
geological and geophysical studies along with the acquisition, processing, and interpretation of 50
kilometers (20 kilometers in PEP 38348, 30 km in PEP 38349) of seismic prior to November 2008. Prior
to November 8, 2009, the company is required to drill two exploratory wells (one on each permit).
Royalties paid to the New Zealand government (the ‘Crown’) for discoveries found before December 31,
2009 consist of an Ad Valorem royalty of one percent on natural gas and five percent on oil plus an
Accounting Profits royalty of 15 percent on the first $NZ 250 million of gross sales reverting to a 20
percent royalty thereafter. Discoveries made after December 31, 2009 are subject to a five percent Ad
Valorem royalty plus a 20 percent Accounting Profits Royalty.
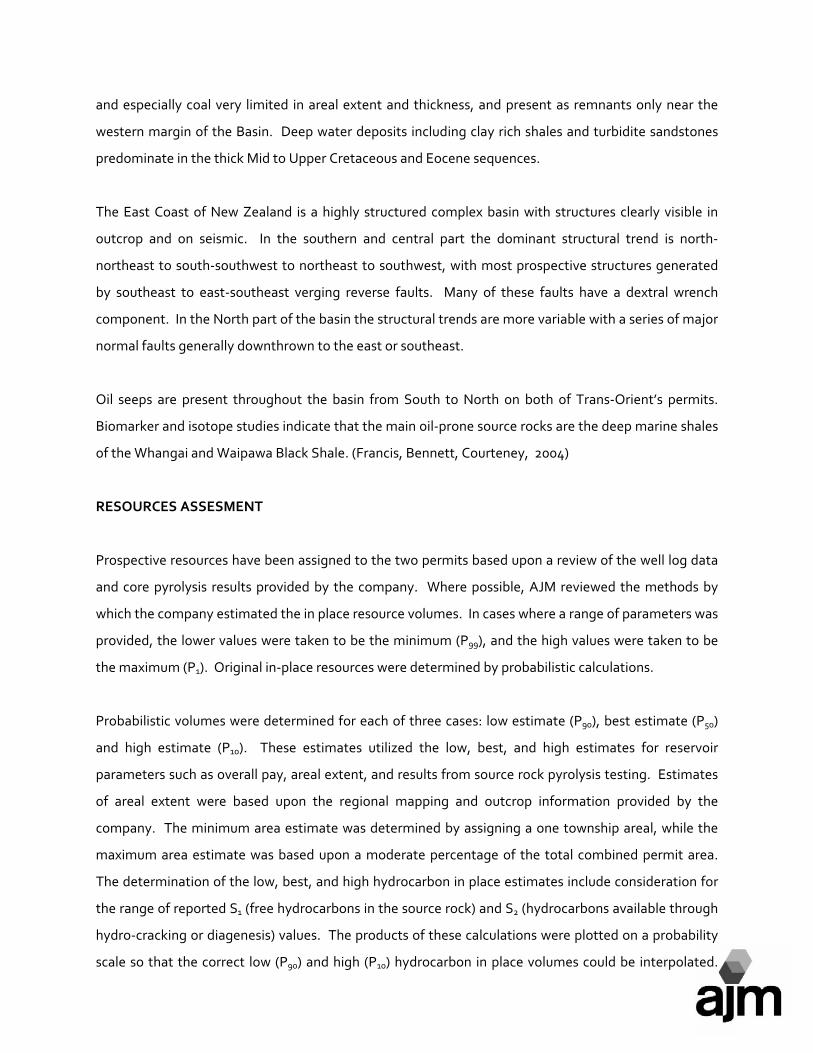
This report summarizes the company’s unconventional Paleocene resources within the Whangai Shale
and Waipawa Black Shale. Although the company has not drilled any wells to test the Paleocene
shales, several wells have penetrated the shale zones in the past. These wells include the Rere 1 well in
the northern PEP 38348 permit, Opoutama 1 in PEP 38346, and Hukarere‐1 which was drilled offshore in
PEP 38344.
The Opoutama 1 well was drilled in 1967 and encountered 734 meters of Whangai shale at 1,469
meters. This well’s total depth was 3,657 meters. Rere‐1 was drilled to a total depth of 4,351 meters in
1985. The well encountered 392 meters of Whangai zone at 1,990 meters. The Hukarere‐1 well was
drilled in 2001 in Hawke Bay to a total depth of 3,230 meters. This well also encountered 323 meters of
the Whangai shale beginning at 2,764 meters.
GEOLOGY
New Zealand’s East Coast Basin extends over 40,000 Km2 of the North Island. It is characterized by a
Late Cretaceous to Oligocene passive margin section overlain by a very thick Miocene‐Pliocene active
margin sequence. The whole sequence was deposited in marine conditions, with non‐marine deposits
and especially coal very limited in areal extent and thickness, and present as remnants only near the
western margin of the Basin. Deep water deposits including clay rich shales and turbidite sandstones
predominate in the thick Mid to Upper Cretaceous and Eocene sequences.
The East Coast of New Zealand is a highly structured complex basin with structures clearly visible in
outcrop and on seismic. In the southern and central part the dominant structural trend is north‐
northeast to south‐southwest to northeast to southwest, with most prospective structures generated
by southeast to east‐southeast verging reverse faults. Many of these faults have a dextral wrench
component. In the North part of the basin the structural trends are more variable with a series of major
normal faults generally downthrown to the east or southeast.
Oil seeps are present throughout the basin from South to North on both of Trans‐Orient’s permits.
Biomarker and isotope studies indicate that the main oil‐prone source rocks are the deep marine shales
of the Whangai and Waipawa Black Shale. (Francis, Bennett, Courteney, 2004)
RESOURCES ASSESMENT
Prospective resources have been assigned to the two permits based upon a review of the well log data
and core pyrolysis results provided by the company. Where possible, AJM reviewed the methods by
which the company estimated the in place resource volumes. In cases where a range of parameters was
provided, the lower values were taken to be the minimum (P99), and the high values were taken to be
the maximum (P1). Original in‐place resources were determined by probabilistic calculations.
Probabilistic volumes were determined for each of three cases: low estimate (P90), best estimate (P50)
and high estimate (P10). These estimates utilized the low, best, and high estimates for reservoir
parameters such as overall pay, areal extent, and results from source rock pyrolysis testing. Estimates
of areal extent were based upon the regional mapping and outcrop information provided by the
company. The minimum area estimate was determined by assigning a one township areal, while the
maximum area estimate was based upon a moderate percentage of the total combined permit area.
The determination of the low, best, and high hydrocarbon in place estimates include consideration for
the range of reported S1 (free hydrocarbons in the source rock) and S2 (hydrocarbons available through
hydro‐cracking or diagenesis) values. The products of these calculations were plotted on a probability
scale so that the correct low (P90) and high (P10) hydrocarbon in place volumes could be interpolated.
The best estimate (P50) hydrocarbon in place volume of 12.6 billion barrels is the total available volume
(S1 plus S2) for both the Waipawa and Whangai shales. A summary of the prospective resources for
both permits is included in Appendix A.
DEVELOPMENT FACTORS
The Waipawa and Whangai shales represent an unconventional development similar to that of the
Bakken Formation within the Willesden Basin in southern Saskatchewan and North Dakota. The area
has several oil and natural gas seeps that clearly indicate the area is prospective for hydrocarbons. Prior
to any defined development, additional drilling, sampling and testing will be required to further
quantify the hydrocarbon potential in the area.
The company has plans to drill an exploratory well on each of the permits. The cost of the each well is
estimated to be $CDN 1,500,000. This capital will allow for the drilling of a 1,500 m vertical test that will
recover significant core. In addition, each well will have a modern well log suite run to allow for the
optimal review and characterization of the shale zones. As per the exploration permit requirements,
these wells should be drilled and tested by the end of the third quarter of 2009.
AJM’s long term forecast for light oil is $US 100.00/bb WTI. New Zealand has an active market for
petroleum products, and the exploration permits are close to a major ocean port in Napier. As a result,
it is expected that any future development in the area will have access to markets and transportation
infrastructure.
RISK FACTORS
The major risk factors for this development are strictly geological. New Zealand has a strong and stable
democratic government and has a positive business environment, and as noted above, the
development will have ready access to both markets and transportation infrastructure. The geological
risks include the possibility that the free hydrocarbons available within the matrix of the shale will not
readily flow in commercial quantities. In addition, the overall areal extent and thickness of the shale
zones will need to be verified as only a small number of wells have penetrated the zones of interest.
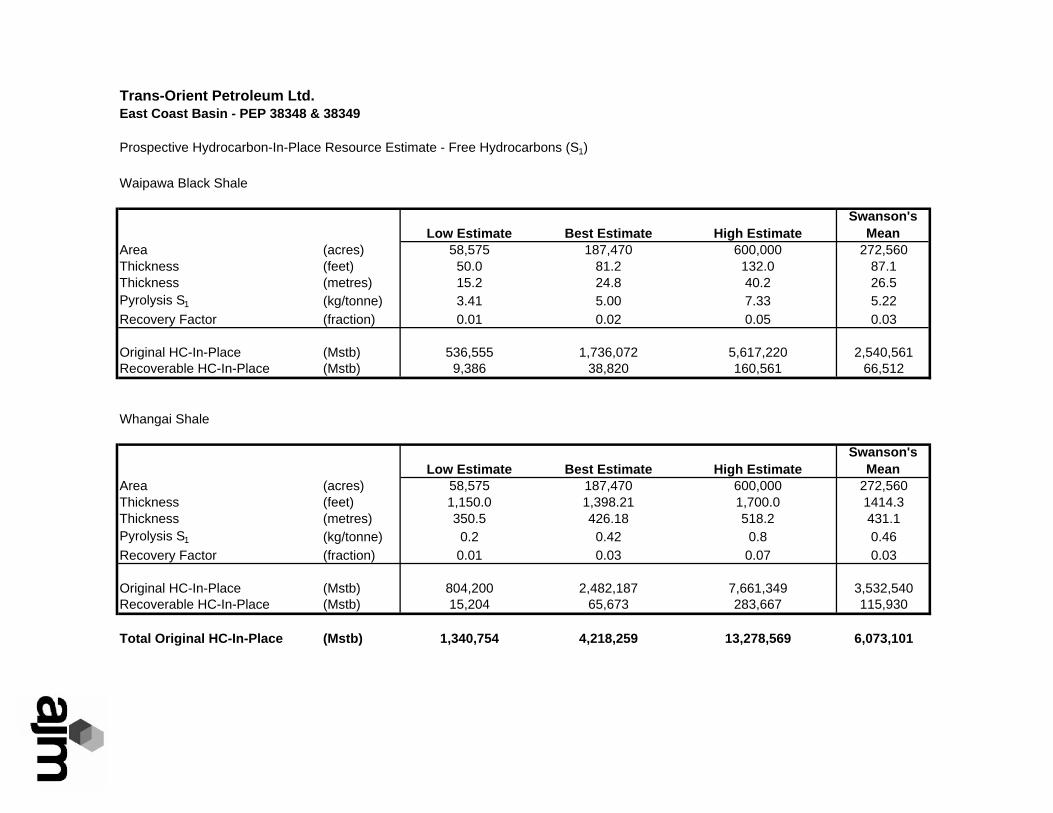
Trans-Orient Petroleum Ltd.East Coast Basin - PEP 38348 & 38349
Prospective Hydrocarbon-In-Place Resource Estimate - Free Hydrocarbons (S1)
Waipawa Black Shale
Low Estimate Best Estimate High EstimateSwanson's
MeanArea (acres) 58,575 187,470 600,000 272,560Thickness (feet) 50.0 81.2 132.0 87.1Thickness (metres) 15.2 24.8 40.2 26.5Pyrolysis S1 (kg/tonne) 3.41 5.00 7.33 5.22Recovery Factor (fraction) 0.01 0.02 0.05 0.03
Original HC-In-Place (Mstb) 536,555 1,736,072 5,617,220 2,540,561Recoverable HC-In-Place (Mstb) 9,386 38,820 160,561 66,512
Whangai Shale
Low Estimate Best Estimate High EstimateSwanson's
MeanArea (acres) 58,575 187,470 600,000 272,560Thickness (feet) 1,150.0 1,398.21 1,700.0 1414.3Thickness (metres) 350.5 426.18 518.2 431.1Pyrolysis S1 (kg/tonne) 0.2 0.42 0.8 0.46Recovery Factor (fraction) 0.01 0.03 0.07 0.03
Original HC-In-Place (Mstb) 804,200 2,482,187 7,661,349 3,532,540Recoverable HC-In-Place (Mstb) 15,204 65,673 283,667 115,930
Total Original HC-In-Place (Mstb) 1,340,754 4,218,259 13,278,569 6,073,101
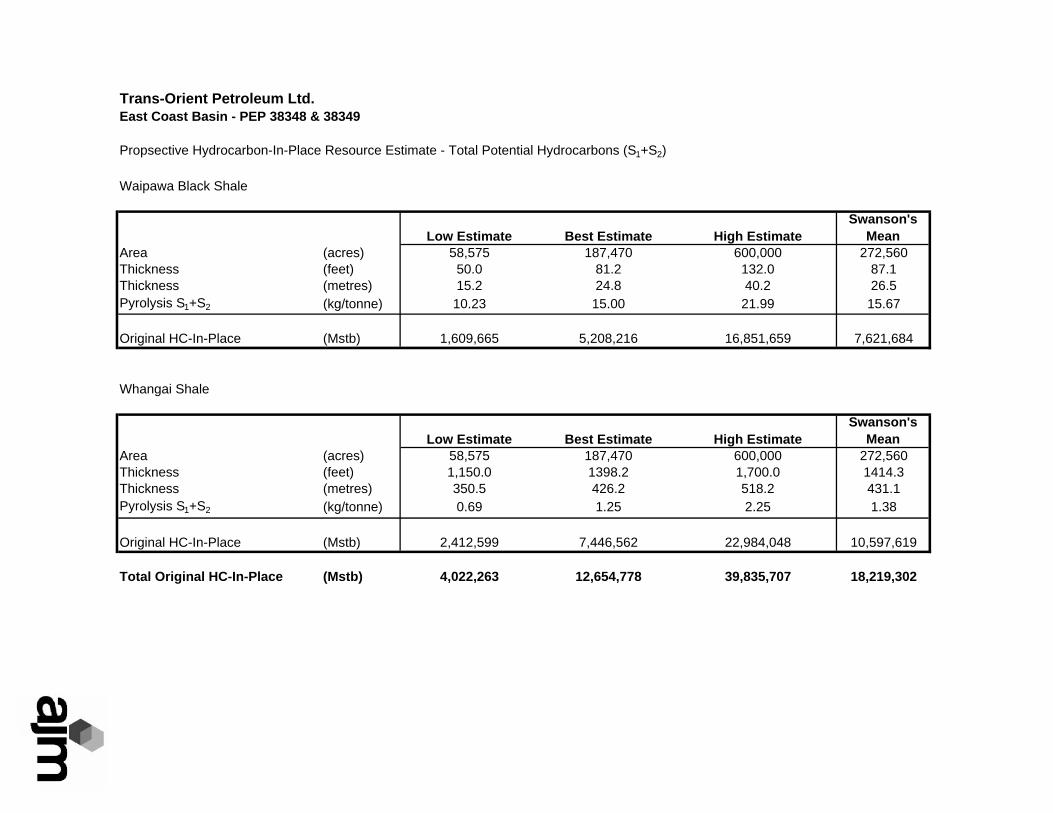
Trans-Orient Petroleum Ltd.East Coast Basin - PEP 38348 & 38349
Propsective Hydrocarbon-In-Place Resource Estimate - Total Potential Hydrocarbons (S1+S2)
Waipawa Black Shale
Low Estimate Best Estimate High EstimateSwanson's
MeanArea (acres) 58,575 187,470 600,000 272,560Thickness (feet) 50.0 81.2 132.0 87.1Thickness (metres) 15.2 24.8 40.2 26.5Pyrolysis S1+S2 (kg/tonne) 10.23 15.00 21.99 15.67
Original HC-In-Place (Mstb) 1,609,665 5,208,216 16,851,659 7,621,684
Whangai Shale
Low Estimate Best Estimate High EstimateSwanson's
MeanArea (acres) 58,575 187,470 600,000 272,560Thickness (feet) 1,150.0 1398.2 1,700.0 1414.3Thickness (metres) 350.5 426.2 518.2 431.1Pyrolysis S1+S2 (kg/tonne) 0.69 1.25 2.25 1.38
Original HC-In-Place (Mstb) 2,412,599 7,446,562 22,984,048 10,597,619
Total Original HC-In-Place (Mstb) 4,022,263 12,654,778 39,835,707 18,219,302
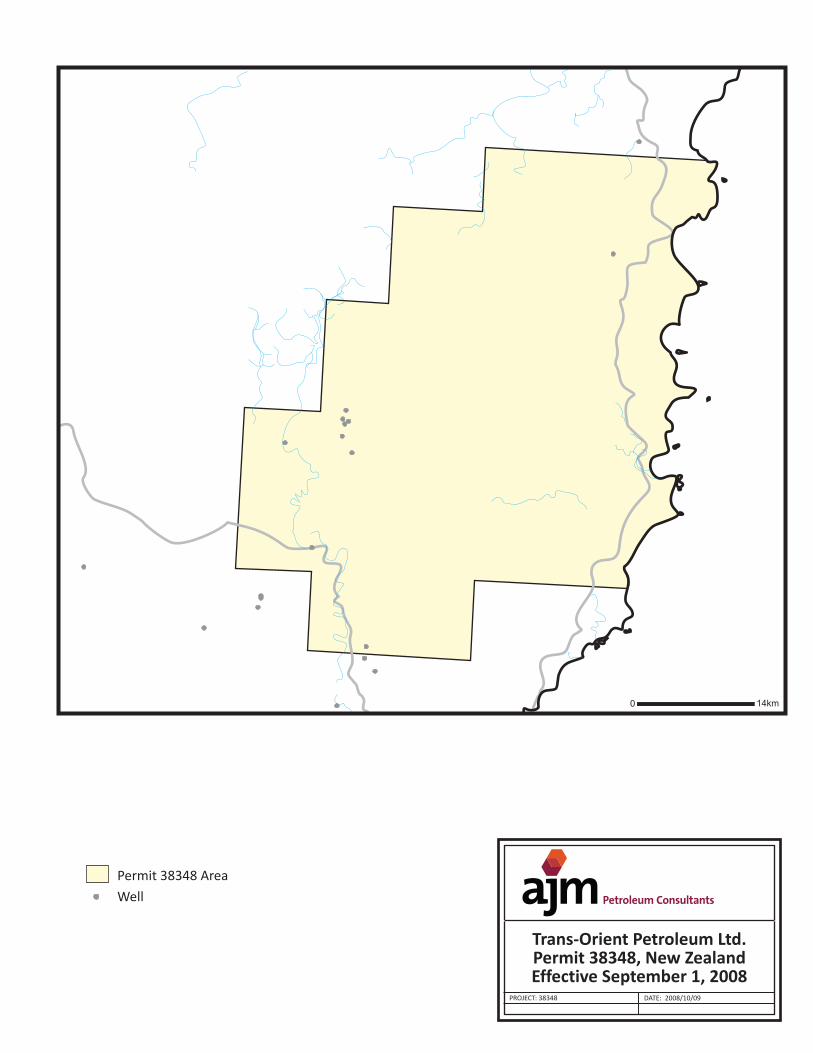
0 14km
PROJECT: 38348 DATE: 2008/10/09
Trans-Orient Petroleum Ltd.Permit 38348, New ZealandEffective September 1, 2008
Permit 38348 Area
Well
NAPIER
HASTINGS
PALMERSTON NORTH
TAIHAPE
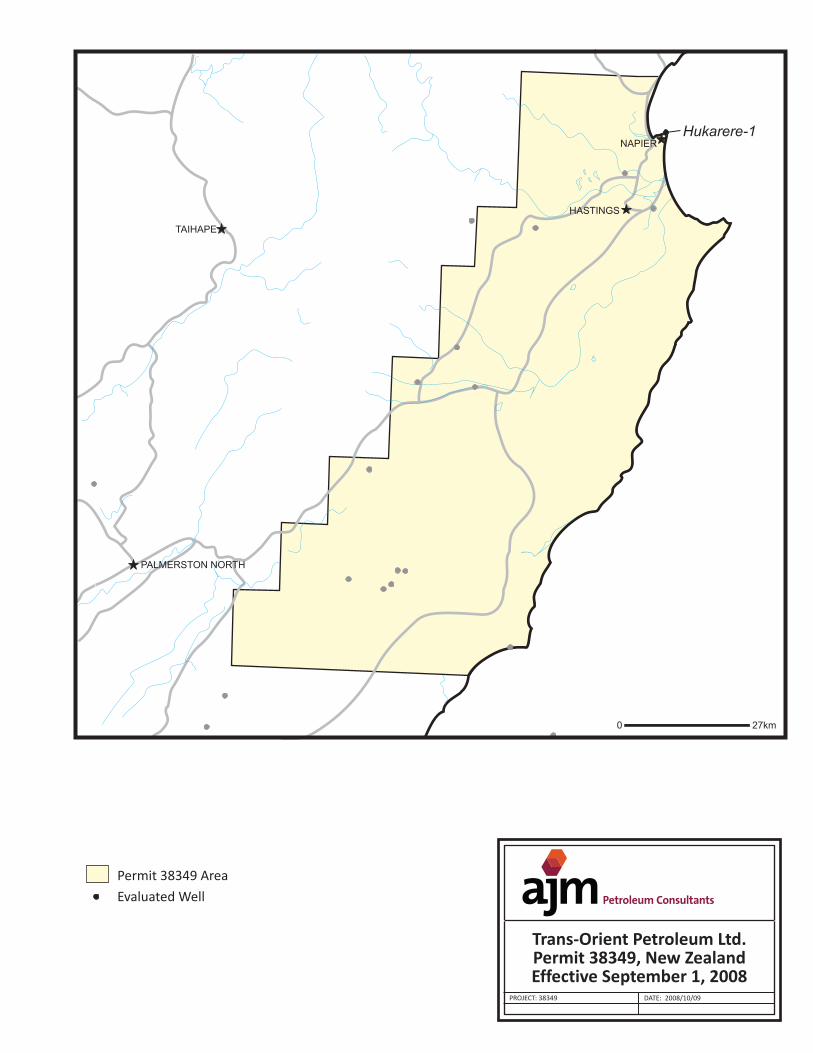
Hukarere-1
0 27km
PROJECT: 38349 DATE: 2008/10/09
Trans-Orient Petroleum Ltd.Permit 38349, New ZealandEffective September 1, 2008
Permit 38349 Area
Evaluated Well