Embed Size (px)
Citation preview

PARLIAMENTARY BUDGET OFFICE NSW Parliament • Parliament House, Macquarie Street Sydney NSW 2000
Budget Impact Statement 2015
Coalition
Part One of Two
23 March 2015

Budget Impact Statement 2015 Coalition – Part One of Two ii
Preface
Section 23 of the Parliamentary Budget Officer Act 2010 requires that the Parliamentary Budget
Officer prepare a budget impact statement for the Premier and the Leader of the Opposition.
The budget impact statement lists the relevant costed policies, summarises the financial impact of
each costed policy and shows the total net financial impact of all the costed policies on the 2014-15
State budget and forward estimates from 2015-16 to 2017-18.
The budget impact statement shows the impact of all the costed policies on the following financial
indicators:
General Government Sector Net Operating Result
General Government Sector Capital Expenditure
General Government Sector Net Lending/(Borrowing)
General Government Sector Net Financial Liabilities
Total State Sector Net Financial Liabilities.
The Parliamentary Budget Officer must publicly release the budget impact statements on the fifth
last day before the State general election. Release of a revised final budget impact statement can
occur following further costings of policies after the date of this statement.
Stephen Bartos
Parliamentary Budget Officer
23 March 2015

Budget Impact Statement 2015 Coalition – Part One of Two iii
Contents
List of tables ..................................................................................................................................... iv
List of figures .................................................................................................................................... iv
About this Budget Impact Statement ................................................................................................. 5
Summary impact on key fiscal aggregates .......................................................................................... 6
Appendix A – Detailed Tables and Graphs .......................................................................................... 9
Appendix B – Explanatory notes to the Budget Impact Statement ................................................... 17
Basis of preparation ..................................................................................................................... 17
Application of accounting standards in the budget and forward estimates ............................... 17
Pre-election estimate............................................................................................................... 18
Consequential financing impact from election policies ............................................................. 18
Second round effects from election policies ............................................................................. 18
Scope of the budget sector .......................................................................................................... 18
Total State Sector versus General Government Sector ............................................................. 19
Impact of agencies outside the General Government Sector on the State’s budget .................. 19
Limitations inherent within the Budget Impact Statement ........................................................... 20
Uncertainty in estimating future budget impacts ..................................................................... 20
The need for reliable measurement before recognising budget impacts .................................. 21
Commitments beyond the forward estimate period................................................................. 22
Commitments involving future commercial negotiations ......................................................... 22
Reservations ................................................................................................................................ 23
Restart NSW Fund.................................................................................................................... 23
Types of election commitments ................................................................................................... 24
Glossary .......................................................................................................................................... 28

Budget Impact Statement 2015 Coalition – Part One of Two iv
List of tables
Table 1: Net Operating Result - General Government Sector ............................................................. 6
Table 2: Capital Expenditure - General Government Sector................................................................ 6
Table 3: Net Lending/(Borrowing) - General Government Sector ....................................................... 7
Table 4: Net Financial Liabilities - General Government Sector .......................................................... 7
Table 5: Net Financial Liabilities-Total State Sector ............................................................................ 8
Table 6: All policies that impact on the Net Operating Result ............................................................. 9
Table 7: All policies that impact on expenses ................................................................................... 11
Table 8: All policies that impact on revenues ................................................................................... 13
Table 9: All policies that impact on Capital Expenditure ................................................................... 14
Table 10: All policies that impact on Net Lending/(Borrowing) ......................................................... 15
Table 11: Interest saving/(expense) from all policies ........................................................................ 18
Table 12: Uncommitted Funds ......................................................................................................... 25
List of figures
Figure 1: Impact on Net Operating Result ........................................................................................ 10
Figure 2: Impact on expenses .......................................................................................................... 12
Figure 3: Impact on revenues .......................................................................................................... 13
Figure 4: Impact on Capital Expenditure .......................................................................................... 14
Figure 5: Impact on Net Lending/(Borrowing) .................................................................................. 16

Budget Impact Statement 2015 Coalition 5
About this Budget Impact Statement
The aim of the Budget Impact Statement is to provide thorough, independent, transparent and
reliable information on the costs of election policies proposed by the Government and Opposition in
advance of the New South Wales general election.
The Budget Impact Statement is intended to capture the impact on the budget of all policies that a
parliamentary leader proposes to implement, if elected. Parliamentary leaders have an obligation
under section 18 (1A) (b) of the Parliamentary Budget Officer Act 2010 to advise they have
submitted all relevant policies for inclusion in this Budget Impact Statement.
Part One of this Budget Impact Statement includes a summary of the impact on the budget of all of
the costed policies for a parliamentary leader. It provides an overview of the total effect on the
budget for the current financial year and the next three years (the forward estimates) that the
proposed election policies of that leader will have.
Part Two of this Budget Impact Statement includes a list of the final election policies the
parliamentary leader intended for inclusion in this Budget Impact Statement. Part Two also includes
detailed costings for individual election policies included in this Budget Impact Statement.
Election policy costings set out the impact of a proposed election policy on the current year’s budget
and on the next three years (the forward estimates).

Budget Impact Statement 2015 Coalition – Part One of Two 6
Summary impact on key fiscal aggregates
The following tables provide the impact of all costed policies of the Coalition on the key fiscal
aggregates outlined in the Parliamentary Budget Officer Act 2010. Detailed listings of the costed
policies making up this aggregate impact are contained within Appendix A.
In order to provide an accurate picture of the start point for an incoming government in formulating
the 2015-16 Budget, the Statement includes the impact of decisions taken by government since the
2014-15 Half-Yearly Budget Review and prior to the 2015 caretaker period.
Table 1: Net Operating Result - General Government Sector
2014-15 $m
2015-16 $m
2016-17 $m
2017-18 $m
2014-15 Half-Yearly Budget Review 272 402 1,096 1,038 Changes since Half-Yearly Review (71) (97) (85) (75) Pre-election estimate 202 305 1,011 964 Impact of policies - 179 167 108 Estimate after impact 202 484 1,178 1,072
The Net Operating Result above is calculated as the difference between expenses and revenues from
transactions for the General Government Sector. It is equivalent to the ‘Budget Result’ published in
the 2014-15 Half-Yearly Budget Review and to the Net Operating Balance published in the 2013-14
Report on State Finances.
The Net Operating Result reflects the difference between the year’s cost of service delivery and
revenue earned to fund those activities. A positive number reflects a surplus and a negative number
a deficit.
Table 2: Capital Expenditure - General Government Sector
2014-15 $m
2015-16 $m
2016-17 $m
2017-18 $m
2014-15 Half-Yearly Budget Review 10,203 9,556 9,782 9,501 Changes since Half-Yearly Review 75 199 283 54 Pre-election estimate 10,278 9,755 10,065 9,555 Impact of policies 1 55 91 74 Estimate after impact 10,279 9,810 10,156 9,629
Capital expenditure is for the acquisition or enhancement of property, plant and equipment or
intangible assets of the General Government Sector. The Net Operating Result in Table 1 does not
include capital expenditure but does include depreciation charges. Positive numbers reflect
increased expenditure and negative numbers reflect a reduction in expenditure.

Budget Impact Statement 2015 Coalition – Part One of Two 7
Table 3: Net Lending/(Borrowing) - General Government Sector
2014-15 $m
2015-16 $m
2016-17 $m
2017-18 $m
2014-15 Half-Yearly Budget Review (3,243) (2,011) (1,666) (950) Changes since Half-Yearly Review (145) (296) (368) (128) Pre-election estimate (3,388) (2,307) (2,034) (1,078) Impact of policies (1) 123 75 35 Estimate after impact (3,389) (2,184) (1,959) (1,043)
Net Lending/(Borrowing) reflects the financing requirement of the General Government Sector, the
extent to which government’s spending is financed from revenues and borrowings. Net
Lending/(Borrowing) is calculated as the Net Operating Result less the net acquisition of
non-financial assets. A positive result indicates net lending and a negative result indicates net
borrowing.
Table 4: Net Financial Liabilities - General Government Sector
2014-15 $m
2015-16 $m
2016-17 $m
2017-18 $m
Impact of policies 240 118 42 8
Net Financial Liabilities - General Government Sector is a measure of the General Government
Sector’s total liabilities, less its financial assets. Total liabilities include borrowings, accrued
employee liabilities such as superannuation and long service leave entitlements, as well as
provisions. The General Government Sector’s investment in other sectors is excluded from the
calculation. A positive number reflects an increase in the Sector’s net liabilities and a negative
number reflects a decrease.
The most recently published General Government Sector financial information is the January 2015
Monthly Statement available on NSW Treasury’s website. The Sector’s Net Financial Liabilities as at
the end of January 2015 were $64,834 million. The aggregate impact of the Coalition’s policies over
the forward estimates increases Net Financial Liabilities by 0.01 per cent of the January 2015 figure.

Budget Impact Statement 2015 Coalition – Part One of Two 8
Table 5: Net Financial Liabilities-Total State Sector
2014-15 $m
2015-16 $m
2016-17 $m
2017-18 $m
Impact of policies 240 118 42 8
Net Financial Liabilities-Total State Sector is a measure of the Total State Sector’s total liabilities, less
its financial assets available to meet these. Total liabilities include borrowings, accrued employee
liabilities such as superannuation and long service leave entitlements, as well as provisions. A
positive number reflects an increase in the State’s net liabilities and a negative number reflects a
decrease.
The most recently published Total State Sector financial information is the 2013-14 Report on State
Finances available on NSW Treasury’s website. The Sector’s Net Financial Liabilities as at the end of
June 2014 were $117,644 million. The impact of the policies above increases Net Financial Liabilities
by less than 0.01 per cent of the June 2014 figure.
Note 1: The summary impacts on key fiscal aggregates should be read in conjunction with the
explanatory notes in Appendix B.
Note 2: In the event a parliamentary leader advises the Parliamentary Budget Officer that further
costed policies have been publicly announced, a revision to the Budget Impact Statement may be
issued prior to the election, as provided for in section 23 of the Parliamentary Budget Officer
Act 2010.
Note 3: This Statement is based on policies advised to the Parliamentary Budget Officer. Under
section 18 of the Parliamentary Budget Officer Act 2010, it is the responsibility of the parliamentary
leader to have costed all policies “that are proposed to be implemented if the party is elected to
Government at the next State general election and that are likely to impact on the current and
relevant forward estimates”.

Budget Impact Statement 2015 Coalition – Part One of Two 9
Appendix A – Detailed Tables and Graphs
The following tables and graphs provide further detail about the budget impact of costed policies.
The Parliamentary Budget Officer Act 2010 requires reporting the impact on the Net Operating
Result, being the difference between expenses and revenues from transactions for the General
Government Sector.
Table 6: All policies that impact on the Net Operating Result
Proposal Title 2014-15 2015-16 2016-17 2017-18 4 yr total $’000 $’000 $’000 $’000 $’000
Education and Communities
Aboriginal Centre for Excellence - (10,000) (10,000) - (20,000)
Specialist Subjects Successful Students - (4,150) (2,158) (2,212) (8,519)
$20 Million Before And After School Care Fund - (20,000) - - (20,000)
Family and Community Services
Social Housing Community Improvement Fund - (6,000) (6,150) (8,405) (20,555)
Institute Of Open Adoption - (1,000) (950) (900) (2,850)
Deliver More Services Valued By Seniors - (1,517) (1,555) (1,594) (4,666)
Delivering The National Disability Insurance Scheme Early
- - (7,252) - (7,252)
Health
Health Capital - Transform Patient Health Care - - - 3,733 3,733
Justice
Tough Sentencing For Criminals - (925) (2,030) (2,275) (5,229)
Combating Child Sexual Assault - (5,484) (5,621) (5,762) (16,867)
Strengthen The NSW Police Force - (17,030) (14,014) (22,326) (53,370)
Support Our Rural Firefighters In Better Protecting Our Communities
- 897 (312) (676) (91)
Victims Compensation Scheme (4,764) (7,567) (7,552) (8,815) (28,698)
Planning and Environment
Overhauling The Companion Animal Registration System For Cats And Dogs
- (984) (1,048) (1,113) (3,144)
Save Our Species - - (20,000) (20,000) (40,000)
Trade and Investment, Regional Infrastructure and Services
Telecommunication Services In Regional NSW - (8,340) (8,549) (8,741) (25,630)
Enhance And Expand Our National Parks - (540) (534) (544) (1,618)
National Parks - Increase Access - 88 - - 88
Growing The Arts And Cultural Sector In Western Sydney
- (1,000) (1,500) (2,000) (4,500)
Reforming Energy Rebates - (21,567) (25,233) (29,422) (76,222)
Harnessing New Technology To Prevent Shark Attacks
- (100) - - (100)
Supporting The RSPCA - (500) (500) (500) (1,500)
Growing NSW Visitor Economy - (35,650) (32,698) (32,990) (101,337)
Transport for NSW
Parramatta River - More Ferries And Services - - - (7,554) (7,554)
Treasury & Finance
Trial Car Sharing Services In Government - 2,115 2,129 2,143 6,387
Eliminating Unnecessary Duplication Across Government
- 15,000 25,000 40,000 80,000
Implementation Of 10 Whole Of Government Procurement Savings Initiatives
- 62,540 108,620 115,640 286,800
Cash Management Practices - 62,500 62,500 62,500 187,500

Budget Impact Statement 2015 Coalition – Part One of Two 10
Proposal Title 2014-15 2015-16 2016-17 2017-18 4 yr total $’000 $’000 $’000 $’000 $’000
Reduction To DPC Contingency Fund - 9,700 10,000 10,000 29,700
1.5% Efficiency Dividend - 193,330 198,306 202,117 593,752
Treasurer's Advance To Fund Changes In Victims' Compensation Scheme Expenses
4,764 - - - 4,764
Making Property Sales Data And Land Valuation Data Freely Available
- (1,100) (1,128) (1,156) (3,383)
Other
Support Our Veterans - (576) (422) (422) (1,420)
Fixed Commitments For Local Projects - (14,510) (1,195) (4,125) (19,830)
Jobs For NSW - (6,500) (85,700) (160,700) (252,900)
Boost Funding For Landcare - (1,500) (2,500) (5,000) (9,000)
Boosting Police Citizen Youth Clubs (PCYCs) - (1,000) (500) (500) (2,000)
Total impact on Net Operating Result* - 178,629 167,456 108,402 454,487
*A positive number means the policies’ impact would increase a surplus or decrease a deficit.
Figure 1: Impact on Net Operating Result
0
50
100
150
200
2014-15 2015-16 2016-17 2017-18
$
M

Budget Impact Statement 2015 Coalition – Part One of Two 11
Table 7: All policies that impact on expenses
Proposal Title 2014-15 2015-16 2016-17 2017-18 4 yr total $’000 $’000 $’000 $’000 $’000
Education and Communities
Aboriginal Centre for Excellence - 10,000 10,000 - 20,000
Specialist Subjects Successful Students - 4,150 2,158 2,212 8,519
$20 Million Before And After School Care Fund - 20,000 - - 20,000
Family and Community Services
Social Housing Community Improvement Fund - 6,000 6,150 8,405 20,555
Institute Of Open Adoption - 1,000 950 900 2,850
Deliver More Services Valued By Seniors - 1,517 1,555 1,594 4,666
Delivering The National Disability Insurance Scheme Early - - 7,252 - 7,252
Health
Health Capital - Transform Patient Health Care - - - (3,733) (3,733)
Justice
Tough Sentencing For Criminals - 925 2,030 2,275 5,229
Combating Child Sexual Assault - 5,484 5,621 5,762 16,867
Strengthen The NSW Police Force - 27,030 29,014 37,326 93,370
Support Our Rural Firefighters In Better Protecting Our Communities
- 13,029 12,578 2,817 28,424
Victims Compensation Scheme 4,764 7,567 7,552 8,815 28,698
Planning and Environment
Save Our Species - - 20,000 20,000 40,000
Trade and Investment, Regional Infrastructure and Services
Telecommunication Services In Regional NSW - 8,340 8,549 8,741 25,630
Enhance And Expand Our National Parks - 550 560 570 1,680
Growing The Arts And Cultural Sector In Western Sydney - 1,000 1,500 2,000 4,500
Reforming Energy Rebates - 21,567 25,233 29,422 76,222
Harnessing New Technology To Prevent Shark Attacks - 100 - - 100
Supporting The RSPCA - 500 500 500 1,500
Growing NSW Visitor Economy - 35,650 32,698 32,990 101,337
Transport for NSW
Parramatta River - More Ferries And Services - - - 7,554 7,554
Treasury
Trial Car Sharing Services In Government - (2,115) (2,129) (2,143) (6,387)
Eliminating Unnecessary Duplication Across Government - (15,000) (25,000) (40,000) (80,000)
Implementation Of 10 Whole Of Government Procurement Savings Initiatives
- (62,540) (108,620) (115,640) (286,800)
Cash Management Practices - (18,000) (18,000) (18,000) (54,000)
Reduction To DPC Contingency Fund - (9,700) (10,000) (10,000) (29,700)
1.5% Efficiency Dividend - (193,330) (198,306) (202,117) (593,752)
Treasurer's Advance To Fund Changes In Victims' Compensation Scheme Expenses
(4,764) - - - (4,764)
Other
Support Our Veterans - 576 422 422 1,420
Fixed Commitments For Local Projects - 14,510 1,195 4,125 19,830
Jobs For NSW - 6,500 85,700 160,700 252,900
Boost Funding For Landcare - 1,500 2,500 5,000 9,000
Boosting Police Citizen Youth Clubs (PCYCs) - 1,000 500 500 2,000
Total impact on expenses* - (112,189) (97,839) (49,003) (259,031)
*Expenses comprise recurrent expenditure including depreciation. A positive number means the policies’ impact would
increase expenses.

Budget Impact Statement 2015 Coalition – Part One of Two 12
Figure 2: Impact on expenses
-150
-100
-50
0
2014-15 2015-16 2016-17 2017-18
$
M

Budget Impact Statement 2015 Coalition – Part One of Two 13
Table 8: All policies that impact on revenues
Proposal Title 2014-15 2015-16 2016-17 2017-18 4 yr total $’000 $’000 $’000 $’000 $’000
Justice
Strengthen The NSW Police Force - 10,000 15,000 15,000 40,000
Support Our Rural Firefighters In Better Protecting Our Communities
- 13,926 12,266 2,141 28,333
Planning and Environment Overhauling The Companion Animal Registration System For Cats And Dogs
- (984) (1,048) (1,113) (3,144)
Trade and Investment, Regional Infrastructure and Services
Enhance And Expand Our National Parks - 10 26 26 62
National Parks - Increase Access - 88 - - 88
Treasury & Finance
Cash Management Practices - 44,500 44,500 44,500 133,500 Making Property Sales Data And Land Valuation Data Freely Available
- (1,100) (1,128) (1,156) (3,383)
Total impact on revenues* - 66,440 69,617 59,399 195,456
* A positive number means the policies’ impact would increase revenue.
Figure 3: Impact on revenues
0
50
100
2014-15 2015-16 2016-17 2017-18
$
M

Budget Impact Statement 2015 Coalition – Part One of Two 14
Table 9: All policies that impact on Capital Expenditure
Proposal Title 2014-15 2015-16 2016-17 2017-18 4 yr total $’000 $’000 $’000 $’000 $’000
Health
Health Capital - Transform Patient Health Care - 42,987 62,171 47,997 153,155
Justice
Strengthen The NSW Police Force - 10,000 15,000 15,000 40,000
Support Our Rural Firefighters In Better Protecting Our Communities
- 3,475 2,095 - 5,570
Trade and Investment, Regional Infrastructure and Services
Enhance And Expand Our National Parks - 3,000 - - 3,000
Transport for NSW
Parramatta River - More Ferries And Services 1,000 2,000 11,000 11,000 25,000
Treasury
Trial Car Sharing Services In Government - (7,454) - - (7,454)
Other
Support Our Veterans - 50 - - 50
Fixed Commitments For Local Projects - 600 600 - 1,200
Total impact on Capital Expenditure* 1,000 54,658 90,866 73,997 220,521
* A positive number means the policies’ impact would increase Capital Expenditure.
Figure 4: Impact on Capital Expenditure
0
50
100
2014-15 2015-16 2016-17 2017-18
$
M

Budget Impact Statement 2015 Coalition – Part One of Two 15
Table 10: All policies that impact on Net Lending/(Borrowing)
Proposal Title 2014-15 2015-16 2016-17 2017-18 4 yr total $’000 $’000 $’000 $’000 $’000
Education and Communities
Aboriginal Centre Of Excellence - (10,000) (10,000) - (20,000)
Specialist Subjects Successful Students
- (4,150) (2,158) (2,212) (8,519)
$20 Million Before And After School Care Fund
- (20,000) - - (20,000)
Family and Community Services
Social Housing Community Improvement Fund
- (6,000) (6,150) (8,405) (20,555)
Institute Of Open Adoption - (1,000) (950) (900) (2,850)
Deliver More Services Valued By Seniors
- (1,517) (1,555) (1,594) (4,666)
Delivering The National Disability Insurance Scheme Early
- - (7,252) - (7,252)
Health
Health Capital - Transform Patient Health Care
- (42,987) (62,171) (44,264) (149,422)
Justice
Tough Sentencing For Criminals - (925) (2,030) (2,275) (5,229)
Combating Child Sexual Assault - (5,484) (5,621) (5,762) (16,867)
Strengthen The NSW Police Force - (27,030) (29,014) (37,326) (93,370)
Support Our Rural Firefighters In Better Protecting Our Communities
- (2,381) (2,097) (366) (4,843)
Victims Compensation Scheme (4,764) (7,567) (7,552) (8,815) (28,698)
Planning and Environment
Overhauling The Companion Animal Registration System For Cats And Dogs
- (984) (1,048) (1,113) (3,144)
Save Our Species - - (20,000) (20,000) (40,000)
Trade and Investment, Regional Infrastructure and Services
Telecommunication Services In Regional NSW
- (8,340) (8,549) (8,741) (25,630)
Enhance And Expand Our National Parks
- (3,390) (384) (394) (4,168)
National Parks - Increase Access - 88 - - 88
Growing The Arts And Cultural Sector In Western Sydney
- (1,000) (1,500) (2,000) (4,500)
Reforming Energy Rebates - (21,567) (25,233) (29,422) (76,222) Harnessing New Technology To Prevent Shark Attacks
- (100) - - (100)
Supporting The RSPCA - (500) (500) (500) (1,500)
Growing NSW Visitor Economy - (35,650) (32,698) (32,990) (101,337)
Transport for NSW
Parramatta River - More Ferries And Services
(1,000) (2,000) (11,000) (17,304) (31,304)
Treasury & Finance
Trial Car Sharing Services In Government
- 8,005 565 579 9,149
Eliminating Unnecessary Duplication Across Government
- 15,000 25,000 40,000 80,000
Implementation Of 10 Whole Of Government Procurement Savings Initiatives
- 62,540 108,620 115,640 286,800
Cash Management Practices - 62,500 62,500 62,500 187,500
Reduction To DPC Contingency - 9,700 10,000 10,000 29,700

Budget Impact Statement 2015 Coalition – Part One of Two 16
Proposal Title 2014-15 2015-16 2016-17 2017-18 4 yr total $’000 $’000 $’000 $’000 $’000
Fund
1.5 % Efficiency Dividend - 193,330 198,306 202,117 593,756 Treasurer's Advance To Fund Changes In Victims' Compensation Scheme Expenses
4,764 - - - 4,764
Making Property Sales Data And Land Valuation Data Freely Available
- (1,100) (1,128) (1,156) (3,383)
Other
Support Our Veterans - (614) (410) (410) (1,433)
Fixed Commitments For Local Projects
- (15,110) (1,795) (4,125) (21,030)
Jobs For NSW - (6,500) (85,700) (160,700) (252,900) Boost Funding For Landcare - (1,500) (2,500) (5,000) (9,000)
Boosting Police Citizen Youth Clubs (PCYCs)
- (1,000) (500) (500) (2,000)
Total impact on Net Lending/(Borrowing)*
(1,000) 122,767 75,498 34,564 231,829
* A positive number means the policies’ impact would increase Net Lending or decrease Net Borrowing.
Figure 5: Impact on Net Lending/(Borrowing)
-50
0
50
100
150
2014-15 2015-16 2016-17 2017-18
$
M

Budget Impact Statement 2015 Coalition – Part One of Two 17
Appendix B – Explanatory notes to the Budget Impact Statement
Basis of preparation
The Budget Impact Statement covers the budget year ending 30 June 2015 and the three forward
years ending 30 June 2016, 2017 and 2018. All monetary amounts are presented in Australian
dollars. Nil impact is presented as ‘-‘. Negative numbers in tables are indicated by brackets.
Summary tables in Part One are rounded to the nearest million dollars ($m). All monetary amounts
in tables of individual election policy costings in Appendix A to Part One are rounded to the nearest
thousand dollars ($000). These tables may not add in all instances due to rounding.
All monetary amounts in individual election policy costings in Part Two are rounded to the nearest
thousand dollars ($000). Tables in these costings may not add in all instances due to rounding to the
nearest thousand dollars.
Key technical terms are defined in the Glossary at the end of this publication.
In preparing the Budget Impact Statement (and election costings), the Parliamentary Budget Officer
aims to apply the same accounting standards and reporting conventions used in the preparation of
the New South Wales budget and forward estimates, and as reported in the New South Wales
Budget Papers. This is to ensure accuracy, consistency, and comparability of reported results.
The Parliamentary Budget Officer also applies the same parameters for economic growth, inflation
and other key economic indicators as those used in the 2014-15 Half-Yearly Budget Review.
Application of accounting standards in the budget and forward estimates
The New South Wales budget and forward estimates are prepared using the accrual basis of
accounting, which recognises the effect of transactions and events when they are forecast to occur.
The recognition and measurement principles within Australian Accounting Standards are applied to
the maximum extent possible.
The budget and forward estimates are prepared to reflect existing operations and the impact of new
policy decisions taken by the New South Wales Government (where their financial effect can be
reliably measured). In keeping with these principles, where the impact of a policy decision or
planned event cannot be reliably estimated, the impact is not reflected within the budget and
forward estimates (e.g. due to uncertainties regarding the timing and amount of future cash flows).
The budget and forward estimates also do not include the impact of business asset transactions until
they are finalised. The financial impact of future planned discontinuing operations or restructuring
transactions is not recognised due to the commercial-in-confidence nature of the transactions.
Any estimates or assumptions made in measuring revenues, expenses, assets or liabilities are based
on the latest information available at the time, professional judgments derived from experience and
other factors considered to be reasonable under the circumstances.
The same basis used for the budget and forward estimates is applied to the 2014-15 Half-Yearly
Budget Review.

Budget Impact Statement 2015 Coalition – Part One of Two 18
More information about the basis of preparation for the New South Wales budget and forward
estimates can be found in the New South Wales Government 2014-15 Budget Papers: Budget Paper
No. 2, Appendix A: Statement of Significant Accounting Policies and Forecast Assumptions.
Pre-election estimate
Tables 1-3 within Part One present a pre-election estimate for specific key fiscal aggregates. The
pre-election estimates are calculated by adjusting the relevant aggregate within the
2014-15 Half-Yearly Budget Review for the estimated effect of policy changes made by the
Government up to the caretaker period. The estimated effect has been provided by NSW Treasury. It
is part of the normal business of government, and has been under previous governments, that
decisions affecting the forward estimates can be made prior to the caretaker period.
Figures within the Budget Impact Statement are not a forecast of 2014-15 (or subsequent) budget
outcomes. The Budget Impact Statement reflects the impact of proposed policy changes not the
impact of other external factors that can affect revenues, expenses and other budget outcomes.
Consequential financing impact from election policies
Individual election policy costings within Part Two do not include any consequential impacts related
to financing costs or benefits. Instead, an aggregate impact is noted below.
Table 11: Interest saving/(expense) from all policies
2014-15 $’000
2015-16 $’000
2016-17 $’000
2017-18 $’000
4 yr total $’000
Total interest saving/(expense)* from all policies over the forward estimates
(19) 2,566 7,698 11,240 21,484
* A negative number means the policies’ impact would decrease Net Lending or increase Net Borrowing.
The aggregate interest expense or saving has been calculated by applying government bond rates to
the annual net impact of policies on Net Lending/(Borrowing). The rates applied are consistent with
those used in preparation of the 2014-15 Half-Yearly Budget Review.
Second round effects from election policies
Election policies frequently have a direct and indirect impact. Costings by the Parliamentary Budget
Officer only estimate the direct impact of a policy, not any further effects on the New South Wales
economy or government revenues that may arise as a result of the flow through to the community
of the policy. These ‘second round’ effects cannot be estimated precisely; they are likely to arise
from any policy, and are often unpredictable.
Scope of the budget sector
The State’s budget and forward estimates reflect the forecast finances of the General Government
Sector. This Sector represents that part of the total New South Wales public sector undertaking the
following sorts of activities:
provision and/or distribution of goods and services on a non-market basis to individuals and
the community

Budget Impact Statement 2015 Coalition – Part One of Two 19
regulatory functions
redistribution of income and wealth.
Total State Sector versus General Government Sector
The New South Wales public sector comprises a large number of individual entities, usually referred
to as agencies, which undertake various functions. All of the entities and activities under the control
of the New South Wales Government are collectively referred to as the New South Wales Total State
Sector.
The Total State Sector’s activities and agencies can be divided into the General Government Sector
and the non-General Government Sector. General Government Sector agencies provide public
services, (such as health, education and police), carry out policy or perform regulatory functions.
General Government Sector agencies and activities are funded in the main by taxation (directly or
indirectly).
Non-General Government Sector agencies include those that have a market or financing orientation,
such as trading enterprises supplying public infrastructure services including electricity, water and
public transport. Most agencies in this category are largely self-funded through commercial
operations. However, some in the housing and transport sectors require ongoing financial support to
meet their costs of operation.
The Total State Sector structure is presented below:
Source: Volume Four of the New South Wales Auditor-General’s 2014 Report to Parliament
Impact of agencies outside the General Government Sector on the State’s budget
Whilst the budget and forward estimates reflect the forecast finances of the General Government
Sector, agencies outside this Sector affect these forecasts. Impacts include:
commercially run agencies contribute to General Government Sector revenues by way of
dividends, income tax equivalent payments and fees for access to the State’s credit rating

Budget Impact Statement 2015 Coalition – Part One of Two 20
contributions to General Government Sector revenues by way of payroll and other taxes
transport and housing agencies require significant funding for operations and investment in
infrastructure, which is included in grants and subsidies expense, adding to overall
expenditure.
Higher revenues from agencies outside the General Government Sector contribute to improvements
in the Net Operating Result, Net Lending/(Borrowing) and Net Financial Liabilities of the General
Government Sector. Conversely, higher expenditures to fund agencies outside the General
Government Sector contribute to deteriorations in these fiscal aggregates.
In addition, the General Government Sector’s budgeted balance sheet includes, as an asset, an
interest in the net assets of agencies in the non-General Government Sector.
A list of which agencies comprise the General Government Sector can be found in Appendix B to
Budget Paper No. 2 of the 2014-15 Budget Papers.
Limitations inherent within the Budget Impact Statement
Prospective financial information relates to events and actions that have not yet occurred and may
not occur. The prospective nature of the financial information within the Budget Impact Statement
means it is necessary to apply professional judgement in its preparation. That judgement includes an
informed assessment of the most likely economic and financial outcomes including spending and
revenue profiles.
Election costings and their budget impacts rely on assumptions and information provided by
parliamentary leaders. The cost of a policy will often be dependent on assumed responses to the
policy (for example, levels of take up of a spending program, compliance with revenue measures).
The Parliamentary Budget Officer examines assumptions for reasonableness. Evidence available to
support the assumptions and underlying data upon which prospective financial information is based
is generally future oriented and therefore less certain in nature than evidence available to support
historical financial information.
Uncertainty in estimating future budget impacts
The prospective nature of estimating the budget impact creates a level of uncertainty in the
estimates. Differences between underlying assumptions and eventual outcomes can reflect the
reality of an uncertain operating environment and the impact of many variables over which any
government has little or no control. Actual impacts may differ from estimates.
Assumptions can range from being reasonably certain to very uncertain. The degree of certainty
relating to a particular assumption depends on many things, including the following:
the time period the assumption relates to, because the degree of uncertainty normally
increases over time
the complexity of the election policy and the degree to which it is affected by external
conditions. For example, assumptions relating to tax and fees revenues are complex and
actual outcomes are impacted by exogenous economic factors

Budget Impact Statement 2015 Coalition – Part One of Two 21
the stability of the policy and the ability to predict future events. For example, a policy to
introduce a new activity or function is likely to be more uncertain than a policy to extend
existing operations
the degree of control the State has over its future operating environment
the number of variables associated with the assumption and the interdependencies between
these variables
the availability of data or other information to support assumptions. Whilst the best available
information has been used, in some instances, little data may be available. For example, the
predicted cost of a capital project, once scoping studies and final business cases have
occurred, can vary from earlier estimates.
The level of uncertainty inherent within individual costed policies varies. Where there are specific
matters leading to relatively high levels of uncertainty in the estimated financial impact of the policy,
this is discussed in the narrative accompanying the detailed election policy costing within Part Two.
The need for reliable measurement before recognising budget impacts
The New South Wales budget and forward estimates reflect the impact of new policy decisions taken
by the New South Wales Government where their financial effect can be reliably measured. Where
the impact of a policy decision or planned event cannot be reliably estimated, for example due to
uncertainties about the timing and amount of future cash flows, the impact is not reflected within
the budget and/or forward estimates.
This practice of only including the impacts when they can be reliably measured is consistent with the
principles within Australian Accounting Standards, which have been applied to the budget and
forward estimates to the maximum extent possible.
The Parliamentary Budget Officer aims to apply the same accounting standards and reporting
conventions when costing election policies and preparing this Budget Impact Statement. This means
that where an election policy costing cannot be reliably measured, a costing is not quantified and is
not included in the summary impacts in Part One. However, for relevant individual election policy
costings, the accompanying narrative in Part Two will discuss why it is not possible to measure the
impact reliably and may include a range of potential outcomes.
This principle of only including reliably measurable impacts has some application to potential asset
or business transactions. The extent of uncertainty around the timing and amounts of transactions
means reliable measurement is not possible. Accordingly, the budget and forward estimates do not
reflect the financial impact of asset sales or leases or other business transactions until they are
finalised. Consistent with this principle, election policies containing proposals for the sale or lease of
State assets, or other business asset transactions have not been costed. In addition to this
unreliability, commercial sensitivities associated with these large transactions also create limitations,
which are discussed later.

Budget Impact Statement 2015 Coalition – Part One of Two 22
Commitments beyond the forward estimate period
The Budget Impact Statement covers the budget year ending 30 June 2015 and the three forward
years ending 30 June 2016, 2017 and 2018. However, election policies can include commitments
that affect periods later than the published forward estimate period. The financial impact of any
policy that falls outside the forward estimate period ended 30 June 2018 is not included in the
Budget Impact Statement.
Examples of policies that can have an impact outside the forward estimates include commitments
to:
a long-term infrastructure project that will take many years to complete. Planning costs and
other early expenditures can impact the current year budget and/or the forward estimates,
with the balance of project expenditure occurring after 30 June 2018. This balance is not
quantified within the Budget Impact Statement. Where the amount expected to be incurred
beyond the forward estimates is reliably measurable, an amount may be noted in the
narrative accompanying the detailed election policy costing included in Part Two.
spend an amount over a set period that ends after 30 June 2018. For example, a commitment
to spend $30 million in equal instalments over three years commencing from 1 July 2016 will
only have a total impact of $20 million on the budget and forward estimates. The Budget
Impact Statement quantifies the impact as $20 million. The balance of the commitment may
be noted in the narrative accompanying the detailed election policy costing included in Part
Two.
gradually implement a policy over a number of years such that the total annual cost of the
policy does not emerge until after 30 June 2018. For example, a policy to increase front line
staff incrementally over five years will have a lesser budget impact during the forward
estimates, than in its fifth year. Where the full year cost can be reliably estimated it may be
noted in the narrative accompanying the detailed election policy costing included in Part Two.
establish a new facility that takes some years to become operational. For example, if a new
facility will take three years to build and is expected to commence operations from
1 July 2018, the impact on the budget and forward estimates will frequently be limited to the
capital expenditure required for establishment. Subsequent depreciation and operational
costs will fall outside the forward estimates and are excluded from the Budget Impact
Statement. Where the amount expected to be incurred beyond the forward estimates is
reliably measurable, an amount can be noted in the narrative accompanying the detailed
election policy costing included in Part Two.
Commitments involving future commercial negotiations
Election policies can relate to planned arrangements with private sector providers, which can raise
commercial sensitivities. These arrangements can be for the provision of services and are often for
provision of capital works. Where these arrangements have not yet been entered into, release of
financial information could compromise competitive bidding processes or disadvantage the State in
negotiations. Typically, in such situations, the State’s budget papers do not include detailed
information so as to preserve the State’s ability to obtain the best financial outcome. For example,

Budget Impact Statement 2015 Coalition – Part One of Two 23
Budget Paper No. 4, the Infrastructure Statement, notes that project-level information is treated as
commercial-in-confidence for some parts of the sector and is not reported in detail.
To assist with costing election policies, the Parliamentary Budget Officer can request information
from the head of any government agency. However, in keeping with the convention discussed
above, an agency head may refuse to provide information in response to such a request if there is an
overriding public interest against the disclosure. In some instances, agency heads have exercised this
provision of the law and have not provided the information required to cost election policies. In such
instances, insufficient information exists to prepare a costing.
This limitation applies only to future arrangements. Existing arrangements, for which terms have
already been agreed, are not affected. For example, there are generally no limitations in publishing
information relating to existing arrangements with non-government organisations for the delivery of
services to the community.
This limitation also applies to potential asset or business transactions. The commercial-in-confidence
nature of potential asset sales or leases, or other business transactions, means the budget and
forward estimates do not reflect their financial impacts until they are finalised. Accordingly, election
policies containing proposals for the sale or lease of State assets, or other business asset
transactions have not been costed.
Reservations
The 2014-15 New South Wales Budget Papers identify a number of possible future expenditure as
“reservations”. Commitments are firm intentions and are reflected in the New South Wales State
budget and/or forward estimates. Commitments can be distinguished from reservations, which are
items still subject to decision pending further work, such as business cases. Until such decisions
occur, the financial impacts pertaining to these items are not reflected in the budget and/or forward
estimates. The impact cannot be predicted at this point. Once decisions are taken and capital
expenditure is committed the capital projects would significantly impact the relevant year’s budget
and forward estimates.
The Parliamentary Budget Officer notes that reservations by definition are subject to change
depending on the outcome of government consideration of the business cases and other supporting
information for the projects concerned. They are not costed election policies.
Details about the Coalition’s proposals in respect of Restart reservations appear within election
policy costing C053 in Part Two.
Restart NSW Fund
The Restart NSW Fund (Restart NSW) is a statutory fund created in 2011 to fund infrastructure
projects. At 30 June 2014, the Restart Fund balance was $6.227 billion. Restart NSW has obtained its
funding from the following sources:
proceeds from major asset transactions in the port, water and electricity industries
windfall taxation revenues
investment earnings
issuance of Waratah Bonds.
Budget Impact Statement 2015 Coalition – Part One of Two 24
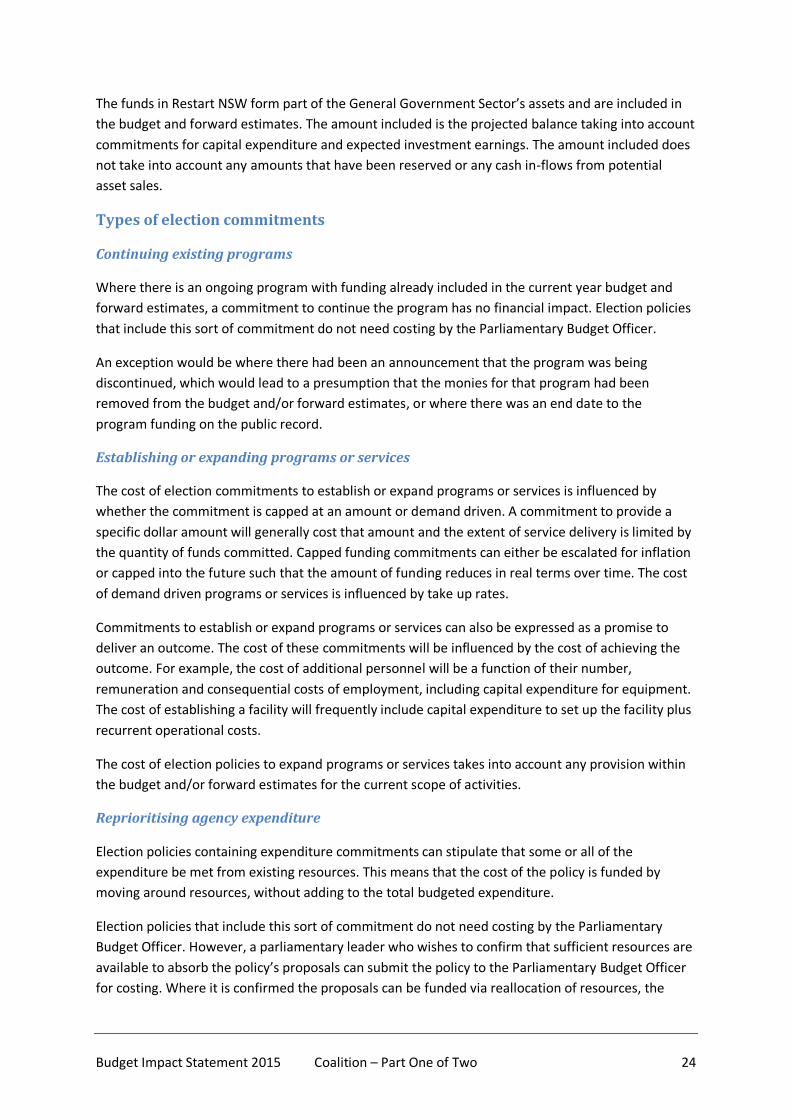
The funds in Restart NSW form part of the General Government Sector’s assets and are included in
the budget and forward estimates. The amount included is the projected balance taking into account
commitments for capital expenditure and expected investment earnings. The amount included does
not take into account any amounts that have been reserved or any cash in-flows from potential
asset sales.
Types of election commitments
Continuing existing programs
Where there is an ongoing program with funding already included in the current year budget and
forward estimates, a commitment to continue the program has no financial impact. Election policies
that include this sort of commitment do not need costing by the Parliamentary Budget Officer.
An exception would be where there had been an announcement that the program was being
discontinued, which would lead to a presumption that the monies for that program had been
removed from the budget and/or forward estimates, or where there was an end date to the
program funding on the public record.
Establishing or expanding programs or services
The cost of election commitments to establish or expand programs or services is influenced by
whether the commitment is capped at an amount or demand driven. A commitment to provide a
specific dollar amount will generally cost that amount and the extent of service delivery is limited by
the quantity of funds committed. Capped funding commitments can either be escalated for inflation
or capped into the future such that the amount of funding reduces in real terms over time. The cost
of demand driven programs or services is influenced by take up rates.
Commitments to establish or expand programs or services can also be expressed as a promise to
deliver an outcome. The cost of these commitments will be influenced by the cost of achieving the
outcome. For example, the cost of additional personnel will be a function of their number,
remuneration and consequential costs of employment, including capital expenditure for equipment.
The cost of establishing a facility will frequently include capital expenditure to set up the facility plus
recurrent operational costs.
The cost of election policies to expand programs or services takes into account any provision within
the budget and/or forward estimates for the current scope of activities.
Reprioritising agency expenditure
Election policies containing expenditure commitments can stipulate that some or all of the
expenditure be met from existing resources. This means that the cost of the policy is funded by
moving around resources, without adding to the total budgeted expenditure.
Election policies that include this sort of commitment do not need costing by the Parliamentary
Budget Officer. However, a parliamentary leader who wishes to confirm that sufficient resources are
available to absorb the policy’s proposals can submit the policy to the Parliamentary Budget Officer
for costing. Where it is confirmed the proposals can be funded via reallocation of resources, the

Budget Impact Statement 2015 Coalition – Part One of Two 25
policy costing will have a nil net impact on the current year budget and forward estimates. That the
policy will require reprioritisation of an agency’s activities is noted.
Uncommitted funds
The budget and forward estimates include relatively small amounts of funds that are available for
new initiatives without having an impact on the budget and/or forward estimates, which are
referred to as uncommitted funds. Election policies can stipulate that the funds to meet the policy
are sourced from uncommitted funds.
Whilst strictly uncommitted, in some cases, these funds are notionally allocated to necessary
programs or projects or may be needed to address known risks in relation to existing levels of
service provision. In such cases, using the uncommitted funds for new policy initiatives could result
in unforeseen reductions in service delivery for existing programs or a larger than expected impact
on the budget and/or forward estimates from the new policy.
The Parliamentary Budget Officer Act 2010 requires the public release of a statement of
uncommitted funds. This statement of uncommitted funds is available on NSW Treasury’s website. It
includes the following total amounts:
Table 12: Uncommitted Funds
2014-15 $m
2015-16 $m
2016-17 $m
2017-18 $m
Recurrent 53.4 161.2 177.3 264.4 Capital - 415.7 905.1 1,088.6 Source: 2014 Statement of Uncommitted Funds
When proposals within election policies are funded from uncommitted funds, this is noted in the
narrative accompanying the detailed policy costing in Part Two.
Regulatory or legislative reform
Commitments to reform an area of regulation or legislation frequently have no financial impact for
the State. Exceptions would include where there was a significant cost of implementation, for
example, new systems or processes might be required. Alternatively, reforms that lead to reduced
oversight functions could reduce costs.
Where government agencies are themselves subject to the relevant regulation, the State incurs
financial impacts in the same way as those in the community are affected. Where changes to
legislation or regulation have a quantifiable impact on the budget and/or forward estimates, a
costing has been completed.
Efficiency dividends across the public sector
Efficiency dividends represent the financial impact of broad efficiency strategies. The dividend is not
a return on investment in the private sector context. It is an annual reduction in funding for the
overall running costs of agencies. Efficiency dividend measures expect the same output from less
funding as a result of improvements in productivity, usually in areas like technology, resource
management etc.

Budget Impact Statement 2015 Coalition – Part One of Two 26
Efficiency dividend measures do not identify specific programs or activities and so do not reflect
changes in government priorities. The dividend percentage is applied to total expenditure, arriving at
the reduction. Accordingly, the financial impact of an election policy incorporating increased
efficiency dividends is to reduce overall levels of total expenditure. However, certain expenses are
less likely to yield efficiencies in the short term, such as depreciation, meaning the reduction is not
necessarily applied to all types of expenses in the same proportion.
Savings measures
Savings measures are commitments to spend less. Such commitments can be achieved through
efficiencies, in which service delivery is not affected, or by reducing the extent of service delivery, or
a combination of both.
Administrative changes and restructures
Commitments to changes in the government’s or public sector’s administrative arrangements can
have a financial impact. These sorts of changes include:
increasing or decreasing the number of Ministers
creating and/or abolishing agencies
creating new decision making or consultation processes and/or abolishing existing ones.
Changes to the number of Ministers have an impact on recurrent expenditure and capital
expenditure. Ministers are paid higher levels of remuneration than other members of parliament
and have additional staff and office facilities.
The impact of creating or abolishing new agencies can vary depending upon the mechanism by
which the changes occur. Functions and activities can be transferred between departments, and
departments can be abolished or created, by ‘machinery of government changes’. These are
regarded as changes to administrative arrangements and it is assumed there is no cost to effect the
changes.
When an entity is created pursuant to legislation and there are new governance and management
structures, there can be a cost of implementation and operation. The cost will vary with the scope of
the new structures. In addition, where new functions or activities are proposed, without an
offsetting reduction in existing activities, it is assumed expenditure is required. The extent of
expenditure and its classification as recurrent or capital depends upon the scope of the new
functions or activities.
Consultation and decision making processes, if similar in extent and scope, will frequently have the
same cost to operate. In that instance, such changes do not impact the budget and/or forward
estimates.
Revenue measures
Commitments that affect General Government Sector revenues generally relate to State taxes and
fees. For example, a parliamentary leader can commit to:
establishing new taxes or fees
abolishing existing taxes or fees

Budget Impact Statement 2015 Coalition – Part One of Two 27
changes in the rates of existing taxes or fees, or thresholds above which they apply.
Commitments can also be made as to the timing of implementing changes.
New or increased taxes and fees are assumed to increase revenues, thereby improving the Net
Operating Result and Net Financial Liabilities. The converse can be assumed for removals and
reductions. The extent to which a change impacts amounts collected is frequently influenced by
demand, which is a function of price in many instances.
Parliamentary leaders cannot generally commit to obtaining additional Commonwealth funding. The
Commonwealth needs to make that commitment and any conditions precedent satisfied before
additional Commonwealth grant revenues are reflected in the budget and/or forward estimates.
Once sufficient agreement to indicate required levels of probability has occurred, new grants are
reflected in the budget and/or forward estimates.
Capital Expenditure
Capital Expenditure relates to the acquisition of non-financial assets, such as infrastructure. Capital
Expenditure is not included in expenses and so does not impact the Net Operating Result. However,
the need to fund expenditure for capital purposes means it impacts on Net Lending/(Borrowing).
Depreciation is recorded over the period during which assets are used in service delivery.
Depreciation is an expense that is included in the calculation of Net Operating Result, but does not
impact Net Lending/(Borrowing).

Budget Impact Statement 2015 Coalition – Part One of Two 28
Glossary
Capital Expenditure: this is expenditure relating to the acquisition or enhancement of property,
plant and equipment (including land and buildings, plant and equipment and infrastructure systems)
and intangibles (including computer software and easements).
commitment: an amount that is reflected in the budget and/or forward estimates.
financial asset is any asset that is:
cash
an equity instrument of another entity
a contractual right:
(i) to receive cash or another financial asset from another entity, or
(ii) to exchange financial assets or financial liabilities with another entity under conditions
that are potentially favourable to the entity, or
a contract that will or may be settled in the entity’s own equity instruments and is:
(i) a non-derivative for which the entity is or may be obliged to receive a variable number
of the entity’s own equity instruments, or
(ii) a derivative that will or may be settled other than by the exchange of a fixed amount of
cash or another financial asset for a fixed number of the entity’s own equity
instruments. For this purpose the entity’s own equity instruments do not include
instruments that are themselves contracts for the future receipt or delivery of the
entity’s own equity instruments.
General Government Sector: this is an Australian Bureau of Statistics classification of agencies that
provide public services (such as health, education and police), carry out policy or perform regulatory
functions. General Government Sector agencies are funded in the main by taxation (directly or
indirectly). A list of those agencies within this sector can be found in Appendix B to Budget
Paper No. 2 of the 2014-15 Budget Papers.
interest expense: costs incurred in connection with the borrowing of funds. It includes interest on
advances, loans, overdrafts, bonds and bills, deposits, interest components of finance lease
repayments, and amortisation of discounts or premiums in relation to borrowings. Where
discounting is used, the carrying amount of a liability increases in each period to reflect the passage
of time. This increase is also recognised as an interest expense.
key fiscal aggregates: balances useful for macro-economic analysis purposes, including assessing the
impact of a government and its sectors on the economy.
Net acquisition of non-financial assets: this is purchases (or acquisitions) of non-financial assets less
sales (or disposals) of non-financial assets less depreciation plus changes in inventories and other
movements in non-financial assets. Purchases and sales (or net acquisitions) of non-financial assets
generally include accrued expenses and payables for capital items. Other movement in non-financial
assets include non-cash capital grant revenue/expenses such as developer contribution assets.

Budget Impact Statement 2015 Coalition – Part One of Two 29
net debt: equals the sum of financial liabilities (deposits held, borrowings and derivatives and
advances received) less the sum of the following financial assets (cash and deposits, advances paid
and investments, loans and placements).
net financial liabilities: calculated as total liabilities, less financial assets, other than equity in Public
Non-Financial Corporations and Public Financial Corporations. This measure is broader than net debt
as it includes significant liabilities, other than borrowings (for example, accrued employee liabilities
such as superannuation and long service leave entitlements).
Net Lending/(Borrowing): the financing requirement of government, calculated as the Net
Operating Result less the net acquisition of non-financial assets. It also equals transactions in
financial assets less transactions in liabilities. A positive result reflects a net lending position and a
negative result reflects a net borrowing position.
Net Operating Result: represents the difference between expenses and revenues from transactions
for the General Government Sector. It excludes other economic flows, which represent changes in
the volume or value of assets or liabilities that do not arise from transactions with other entities and
which are often outside the control of government. This measure is equivalent to the net Budget
Result adopted in the 2014-15 Half-Yearly Budget Review and the Net Operating Balance adopted in
in the 2013-14 Report on State Finances, which is prepared in accordance with accounting standard
AASB 1049 Whole-of-Government and General Government Sector Financial Reporting.
other economic flows: changes in the volume or value of an asset or liability that do not result from
transactions (that is, revaluations and other changes in the volume of assets).
Public Financial Corporations sector: an Australian Bureau of Statistics classification of government
controlled agencies that have one or more of the following functions:
that of a central bank
the acceptance of demand, time or savings deposits, or
the authority to incur liabilities (such as insurance) and acquire financial assets in the market
on their own account.
The sector is also commonly referred to as the Public Financial Enterprise sector. A list of those
agencies within this sector can be found in Appendix B to Budget Paper No. 2 of the 2014-15 Budget
Papers.
Public Non-Financial Corporations sector: an Australian Bureau of Statistics classification of agencies
where user charges represent a significant proportion of revenue and the agencies operate within a
broadly commercial orientation. The sector is also commonly referred to as the Public Trading
Enterprise sector. A list of those agencies within this sector can be found in Appendix B to Budget
Paper No. 2 of the 2014-15 Budget Papers.
reservation: an amount still subject to decision pending further work, such as business cases. These
amounts are not reflected in the budget and/or forward estimates.
services: These are the ‘end products’ or direct services that are delivered to clients or recipients,
the broader community or another government agency. They are expected to contribute to
Government priorities.

Budget Impact Statement 2015 Coalition – Part One of Two 30
Total expenses from transactions: the total amount of expenses incurred in the provision of goods
and services, regardless of whether a cash payment is made to meet the expense in the same year. It
does not include expenditure on the purchase of assets. It also excludes losses, which do not affect
the Net Operating Result.
Total revenues from transactions: this is the total amount of revenue due by way of taxation,
Commonwealth Government grants and from other sources (excluding asset sales) regardless of
whether a cash payment is received. It excludes gains, which do not affect the Net Operating Result.
Total State Sector: represents all agencies and corporations owned and controlled by the New South
Wales Government. It comprises the general government, public trading (also referred to as the
public non-financial corporations) and public financial enterprises (also referred to as public financial
corporations).
transactions: interactions between two institutional units by mutual agreement or actions within a
unit that it is analytically useful to treat as transactions, such as depreciation expense. Unlike
revaluations, transactions generally reflect economic events that impact the economy.
uncommitted funds: are defined as those funds available for new initiatives within the General
Government Sector that:
will not have an impact on the Net Operating Result or Net Financial Liabilities if they are
expensed
do not affect existing services or previously announced projects if expensed
do not require additional unbudgeted savings as at 12 December 2014.