Embed Size (px)
Citation preview
Policy Research Working Paper 9132
Trade Integration, Export Patterns, and Growth in Sub-Saharan Africa
César CalderónCatalina Cantú
Albert G. Zeufack
Africa RegionOffice of the Chief EconomistJanuary 2020
Pub
lic D
iscl
osur
e A
utho
rized
Pub
lic D
iscl
osur
e A
utho
rized
Pub
lic D
iscl
osur
e A
utho
rized
Pub
lic D
iscl
osur
e A
utho
rized
Produced by the Research Support Team
Abstract
The Policy Research Working Paper Series disseminates the findings of work in progress to encourage the exchange of ideas about development issues. An objective of the series is to get the findings out quickly, even if the presentations are less than fully polished. The papers carry the names of the authors and should be cited accordingly. The findings, interpretations, and conclusions expressed in this paper are entirely those of the authors. They do not necessarily represent the views of the International Bank for Reconstruction and Development/World Bank and its affiliated organizations, or those of the Executive Directors of the World Bank or the governments they represent.
Policy Research Working Paper 9132
This paper examines systematically the growth effects of trade integration in Sub-Saharan Africa. It complements and improves upon the empirical literature in two aspects: first, it jointly estimates the impact of different dimensions of trade integration, namely, trade volumes, export/trade patterns by product (primary and manufacturing goods), and by destination (inter- and intra-regional). Second, it estimates the impact of trade integration on economic growth and its sources, that is, capital accumulation and total factor productivity growth. The analysis finds causal evidence that trade integration fosters growth. Additionally, manufacturing trade boosts growth and trade in primary goods hampers growth. Doubling the manufacturing trade
share in Sub-Saharan Africa’s gross domestic product would increase growth by 1.9 percentage points per year, while increases in primary trade reduce growth by 1 percentage point. This impact is mainly transmitted through lower capital accumulation. Finally, inter- and intra-regional trade have a positive impact on growth in Sub-Saharan Africa. Doubling inter-regional trade will increase growth by 1.9 percentage points, and the same increase for intra-regional trade enhances growth by 0.6 percentage points. The effects of inter-regional trade are transmitted primarily through capital accumulation, while those of intra-regional trade are channeled through enhanced total factor productivity growth.
This paper is a product of the Office of the Chief Economist, Africa Region. It is part of a larger effort by the World Bank to provide open access to its research and make a contribution to development policy discussions around the world. Policy Research Working Papers are also posted on the Web at http://www.worldbank.org/prwp. The authors may be contacted at [email protected].
Trade Integration, Export Patterns, and Growth in Sub-Saharan Africa
César Calderón, Catalina Cantú, Albert G. Zeufack1
The World Bank, 1818 H Street NW, Washington DC 20433, USA
Keywords: Trade integration, Herfindahl-Hirschman index, intraregional trade, sources of growth
JEL Codes: F36, F41, F43
1 E-mail: Calderón: [email protected]; Cantú: [email protected]; Zeufack: [email protected]. The views expressed in this paper are those of the authors, and do not necessarily reflect those of the World Bank or its Boards of Directors.
2
1 Introduction International trade has long been hailed as an engine of long-term growth (Lewis 1980). Theoretically,
trade can have an impact on growth in developing countries through a series of channels. Greater trade
integration fosters the efficient allocation of resources through comparative advantage and enables
countries to realize economies of scale and scope. It also facilitates the diffusion of technology and
managerial know-how, becomes a tool to share risks that emerge from international macroeconomic
shocks, reduces anti-competitive practices among domestic firms and encourages competition in both
domestic and international markets.
Country experiences of sustained growth have been triggered and have come along with greater trade
openness (Hausmann et al. 2005; Jong-A-Pin and De Haan 2011). For instance, increases in trade openness
are associated with a 55 percent increase in the likelihood of a growth takeoff (Aizenman and Spiegel
2010). There is evidence that rapid growth in the long run and high levels of growth tend to comove:
doubling the ratio of exports and imports to GDP would raise the growth of income per capita by 2.5
percent per year (Dollar and Kraay 2003). Economic growth in countries that liberalized their trade
regimes were 1.4 percentage point higher than pre-liberalization while the trade share in GDP increased
by nearly 6 percentage points (Wacziarg and Welch 2008).2 More recent studies show that reduced tariffs
on capital and intermediate goods led to a one percentage point growth acceleration for countries that
liberalized their trade regimes (Estevadeordal and Taylor 2013).
Policies that foster international trade integration create growth opportunities, but also entail risks. If
inappropriately managed, opening the economy could expose the country to lower growth, and increase
instability and inequality. Trade integration, under certain conditions, can lead to underutilized physical
and human capital and, hence, affect growth negatively. Market and institutional imperfections,
concentration in extractive activities and specializing away from technologically advanced sectors can
curtail the gains from trade (Chang et al. 2009). For instance, commodity exporters and countries with
uninsured production risk are more unstable in the event of adverse terms of trade shocks (Malik and
Temple 2009).
2 Episodes of rapid export growth are more likely to take place in open or liberalizing countries —about 58 percent of these episodes occurred in open countries or countries that liberalized within five years before the episode. Rapid export growth episodes, in addition, were typically driven by new export products (Freund and Pierola 2012).
3
International trade integration has deepened over the past decades, not only in the world but also in
Sub-Saharan Africa. Global trade grew almost twice as fast as global output (6 and 3.2 percent per year,
respectively) during the period 1983-2008. The trade share in GDP of Sub-Saharan Africa increased from
about 40 percent in 1983 to 69 percent in 2008 (an increase in real terms of 6 and 3.3 percent per year in
trade and economic activity, respectively). This trend is partly attributed to countries’ efforts to liberalize
trade unilaterally and engage in free trade and regional integration agreements. This process of
globalization widened the set of shocks faced by economic agents and increased the connectivity across
countries in the world.
After the 2008-09 global financial crisis, trade grew at a slower pace than economic activity —
especially, in Sub-Saharan Africa. For instance, real economic activity in the region grew at an average
annual rate of 3.7 percent while the amount of trade only grew at 0.3 percent per year. This implies that
trade openness in Sub-Saharan Africa declined from 69 percent of GDP in 2008 to 51 percent of GDP in
2017. The sharp deceleration of trade was attributed to the sluggish recovery of high-income countries
(which account for two-thirds of global imports), shifts in the structure of value chains with lower cross-
border trade in intermediate goods, and a slowdown in global investment (World Bank 2015, Aslam et al.
2017).
The main goal of this paper is two-fold: first, it jointly examines the growth effects of different
dimensions of integrational trade integration; that is, the extent of trade openness (i.e. how much the
country trades with the rest of the world), the diversification of the country’s export basket (i.e. what we
export to the rest of the world), and the diversification of the country’s export destinations (i.e. to whom
we export). Our analysis also includes the impact of the composition of trade volumes by product (i.e.
estimating the growth effects of commodities vis-à-vis manufacturing goods’ trade) and that of the
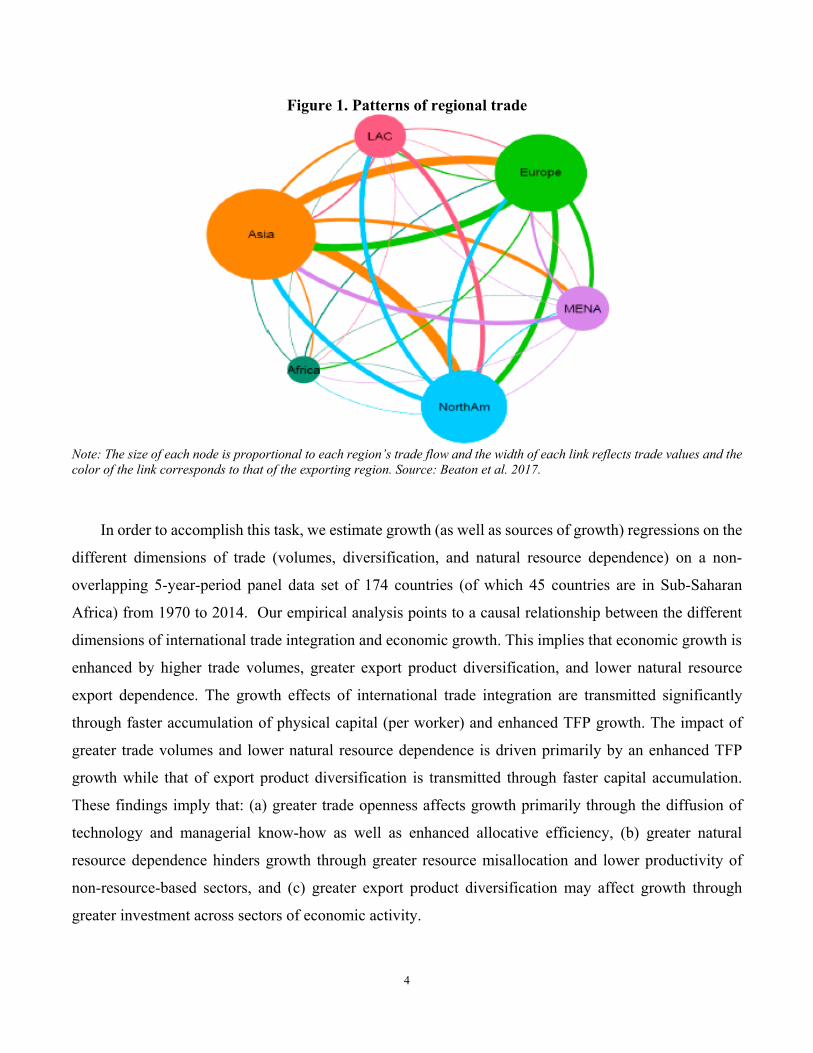
composition of trade volumes by destination (inter- vis-à-vis intra-regional trade). Figure 1 illustrates: (a)
the small size of intra-regional trade in Africa compared with other regions, and (b) the lower trade
linkages of Africa with the rest of the world —when compared with other regions. Second, it
systematically examines the impact of the different dimensions of international trade integration on
economic growth as well as on the sources of growth. That is, it evaluates the impact of trade openness,
diversification across products and diversification across markets on the growth rate of physical capital
per worker and total factor productivity (TFP) growth. Our empirical analysis hopes to provide a more
comprehensive picture of the relationship between trade integration and growth compared to existing
empirical studies.
4
Figure 1. Patterns of regional trade
Note: The size of each node is proportional to each region’s trade flow and the width of each link reflects trade values and the color of the link corresponds to that of the exporting region. Source: Beaton et al. 2017.
In order to accomplish this task, we estimate growth (as well as sources of growth) regressions on the
different dimensions of trade (volumes, diversification, and natural resource dependence) on a non-
overlapping 5-year-period panel data set of 174 countries (of which 45 countries are in Sub-Saharan
Africa) from 1970 to 2014. Our empirical analysis points to a causal relationship between the different
dimensions of international trade integration and economic growth. This implies that economic growth is
enhanced by higher trade volumes, greater export product diversification, and lower natural resource
export dependence. The growth effects of international trade integration are transmitted significantly
through faster accumulation of physical capital (per worker) and enhanced TFP growth. The impact of
greater trade volumes and lower natural resource dependence is driven primarily by an enhanced TFP
growth while that of export product diversification is transmitted through faster capital accumulation.
These findings imply that: (a) greater trade openness affects growth primarily through the diffusion of
technology and managerial know-how as well as enhanced allocative efficiency, (b) greater natural
resource dependence hinders growth through greater resource misallocation and lower productivity of
non-resource-based sectors, and (c) greater export product diversification may affect growth through
greater investment across sectors of economic activity.
5
Zooming in on the volume of trade, this paper also examines the composition of trade volumes by
product and by destination. More specifically, we estimate the growth effects of trade volume by product
(primary goods vs. manufacturing goods) and that of trade volume by destination (inter-regional vs. intra-
regional trade). In the case of the product composition of trade volume, we find that manufacturing trade
promotes economic growth while trade in primary goods hampers it. Our econometric estimates suggest
that doubling the manufacturing trade share in GDP would increase economic growth by 1.9 percentage
points pear year while an analogous increase in the primary goods trade share in GDP would lower
economic growth by 1 percentage point per year. The negative impact of trade in primary goods is
transmitted through both slower capital accumulation and sluggish TFP growth, although the impact
appears to be larger in the former channel. This effect implies that mostly trading in primary goods would
hinder investment in non-resource-based sectors of economic activity. On the other hand, the analysis of
trade volumes by destination reveals that both inter- and intra-regional trade have a positive, significant
and causal impact on growth. The regression estimates suggest that doubling the inter-regional trade share
in GDP would increase economic growth by 1.9 percentage points per year while a similar increase in the
intra-regional share in GDP enhances growth by 0.6 percentage point per year. The growth effects of inter-
regional trade are transmitted significantly through faster accumulation of capital and enhanced TFP
growth although the largest impact materializes through the former channel. In the case of intra-regional
trade, the growth effects are primarily transmitted through enhanced TFP growth. These findings suggest
that the growth impact of intra-regional trade is mainly transmitted through the diffusion of technology,
managerial know-how, and competitive practices as well as the operation of economies of scale and scope.
This paper has 6 sections. Section 2 describes the evolution of the different dimensions of trade
integration (trade volumes, trade diversification, and natural resource dependence) in Sub-Saharan Africa
for the region as a whole and for country groups within the region classified by their extent of natural
resource abundance. Section 3 presents the econometric analysis of the impact of international integration
on growth, and on the sources of growth (capital accumulation and TFP growth). Section 4 estimates the
potential growth benefits of narrowing the gap of certain dimensions of trade integration in Sub-Saharan
Africa (that is, manufacturing trade, export product concentration, and intra-regional trade) vis-à-vis other
benchmark regions. Section 5 builds on the econometric results to discuss actions that might increase the
scope for greater regional integration. Finally, Section 6 elaborates some concluding remarks.
6
2 International Trade Integration: Stylized Facts
This section describes the several dimensions of international trade integration considered in this
paper and looks at their evolution from the perspective of Sub-Saharan Africa (SSA). Specifically, it
examines the changes over time (in the median) of: (a) trade volume (as proxy of openness), (b) patterns
of trade concentration across products and markets, (c) natural resource dependence of exports, (d)
patterns of sectoral trade (primary goods and manufacturing goods), and (e) patterns of regional trade. The
description of these indicators and their sources as well as the discussion of their evolution over time is
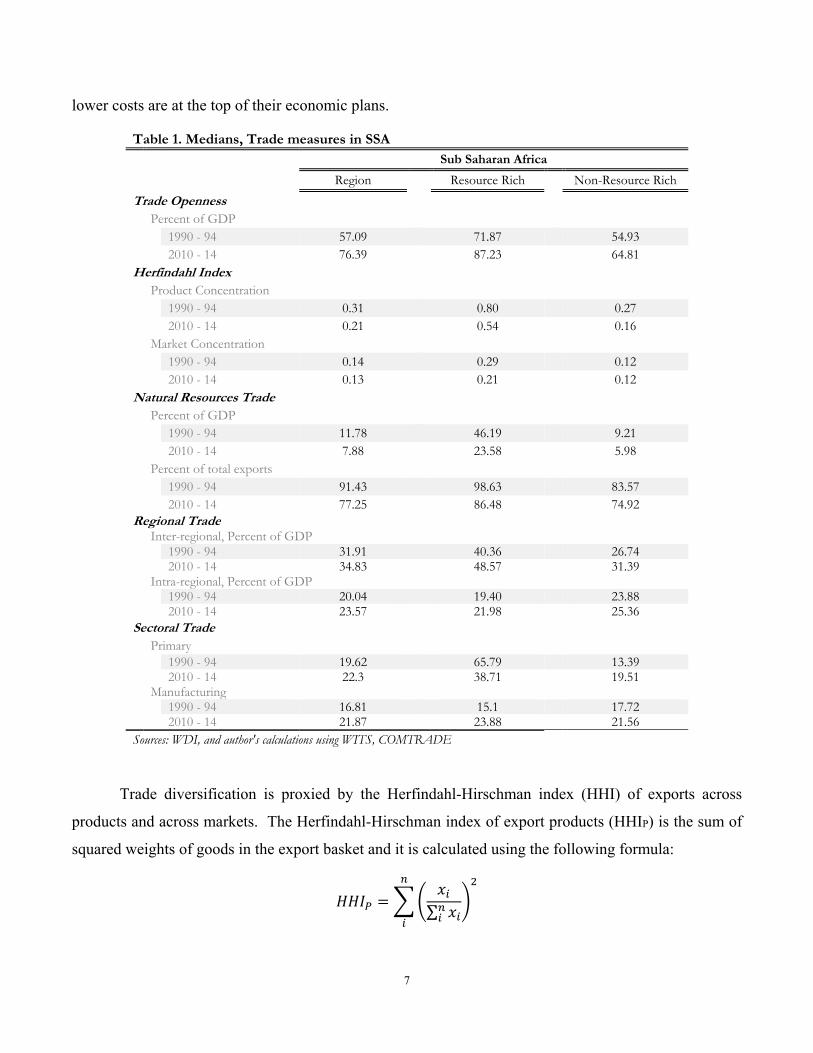
presented below. Table 1 shows the medians of all the trade integration indicators for Sub-Saharan Africa
as well as for resource and non-resource rich countries in the region.
Trade Openness: Volumes, Diversification, and Resource Dependence
Trade volume. Trade openness is typically measured by the volume of trade, defined as the sum
of real exports and imports, and normalized by the level of economic activity or gross domestic product
(GDP). Overall, the volume of trade has sharply increased across SSA countries over the past two decades:
(median) trade openness surged from 57.1 percent of GDP in 1990-94 to 76.4 percent 2010-14; that is, an
increase of almost 20 percentage points of GDP (see Table 1). Trade openness increased across both
resource and non-resource abundant countries in the region over the past two decades; it grew by about
16 and 10 percentage points of GDP, respectively. Additionally, the volume of exports and imports as
percentage of GDP is significantly higher among resource abundant countries (87 percent of GDP in 2010-
14) than among non-resource abundant countries (65 percent of GDP in 2010-14).
Trade diversification. The volume of trade is necessary but not sufficient to understand the
linkages between international trade integration and growth. It matters not only how much the country
trades with the rest of the world but also its patterns of trade across products and across markets. In other
words, are the country’s exports concentrated in a few products or a few markets? Or is their export basket
diversified across a wide array of products or markets? Earlier evidence shows that higher levels of export
product diversification may result in higher growth per capita (Lederman and Maloney 2007) and lower
output volatility (Haddad, Lim, Pancaro and Saborowski 2013). Export diversification is an important
element of the agenda on growth resilience, especially among low- and middle-income countries that tend
to be specialized in few export products in highly volatile sectors (Cadot et al. 2013). Therefore, policies
that foster export diversification and/or boost the productivity of their existing product space through
7
lower costs are at the top of their economic plans.
Table 1. Medians, Trade measures in SSA
Sub Saharan Africa
Region Resource Rich Non-Resource Rich
Trade Openness Percent of GDP 1990 - 94 57.09 71.87 54.93
2010 - 14 76.39 87.23 64.81 Herfindahl Index Product Concentration 1990 - 94 0.31 0.80 0.27
2010 - 14 0.21 0.54 0.16
Market Concentration 1990 - 94 0.14 0.29 0.12
2010 - 14 0.13 0.21 0.12 Natural Resources Trade Percent of GDP 1990 - 94 11.78 46.19 9.21
2010 - 14 7.88 23.58 5.98
Percent of total exports 1990 - 94 91.43 98.63 83.57 2010 - 14 77.25 86.48 74.92 Regional Trade Inter-regional, Percent of GDP 1990 - 94 31.91 40.36 26.74 2010 - 14 34.83 48.57 31.39 Intra-regional, Percent of GDP 1990 - 94 20.04 19.40 23.88 2010 - 14 23.57 21.98 25.36 Sectoral Trade Primary 1990 - 94 19.62 65.79 13.39 2010 - 14 22.3 38.71 19.51 Manufacturing 1990 - 94 16.81 15.1 17.72 2010 - 14 21.87 23.88 21.56 Sources: WDI, and author's calculations using WITS, COMTRADE
Trade diversification is proxied by the Herfindahl-Hirschman index (HHI) of exports across
products and across markets. The Herfindahl-Hirschman index of export products (HHIP) is the sum of
squared weights of goods in the export basket and it is calculated using the following formula:
𝐻𝐻𝐼𝑥
∑ 𝑥
8
where x represents the amount of exports of good i and n is the number of products. When a country
exports a single good, the value of HHIP is equal to one while HHIP is equal to 0 when the country exports
a large variety of products (Haddad et al. 2013; Cadot et al. 2011 2013). Lower values of HHIP indicate a
greater extent of product diversification. COMTRADE data on exports by product at a 4-digit level from
the SITC Revision 1.0 are used to compute HHIP. On the other hand, the Herfindahl-Hirschman index of
export markets (HHIM) is the sum of squared weights of export by destination in total trade. The formula
is similar than the one above: in the case of HHIM, x represents the amount of exports to country i and n
is the number of destinations. Again, lower values of HHIM indicate a greater extent of market
diversification. Bilateral trade data from COMTRADE are used to compute HHIM.
Table 1 shows the medians for HHIP and HHIM across groups in Sub-Saharan Africa for the periods
1990-94 and 2010-14. In terms of export product concentration, the (median) value of HHIP for Sub-
Saharan Africa declined from 0.31 in 1990-94 to 0.21 in 2010-14 (that is, a reduction of 0.10). The
reduction of HHIP was sharper among resource rich countries in the region —with the median declining
from 0.8 in 1990-94 to 0.54 in 2010-14. Non-resource rich countries —with greater levels of export
product diversification than resource rich countries— also experienced a decline in HHIP from 0.27 to
0.16.
In the case of export market concentration, the (median) value of HHIM remained almost invariant
in Sub-Saharan Africa over the past two decades. Export market concentration slightly fell from 0.14 in
1990-94 to 0.13 in 2010-14. The HHIM also remained invariant over time for the group of non-resource
rich countries (0.12 in both 1990-94 and 2010-14). However, export market concentration fell from 0.29
in 1990-94 to 0.21 in 2010-14 across resource rich countries. In sum, export market diversification
increased among resource rich countries; however, non-resource rich countries still export their goods to
a relatively greater number of destinations.
Natural resource dependence. There is no consensus in the empirical literature about the effects
of natural resources on growth. A recent meta-analysis of the impact of natural resources on long-term
economic growth is not conclusive: about 80% of the papers reviewed find a negative effect or no effect
(Havranek et al. 2016). However, the long-term effects of natural resources might depend upon: (a)
distinguishing between the different types of natural resources, and (b) differentiating between resource
dependence and resource abundance.
9
Natural resources play an important role in export baskets and economic activity for a large number
of African countries. The importance of natural resources in export activity will be measured by the value
of natural resource exports (in US$ at current prices) normalized by either the GDP or total merchandise
exports. The data are collected from the World Integrated Trade Solution (WITS) database on the SITC,
Revision 1.0. The definition of natural resource exports includes commodities exported in the SITC
sections 0 – Food and live animals, 1 – Beverages and tobacco, 2- Crude materials, inedible except fuels
(excluding 22 – oil seeds, oil nuts and oil kernels), 3 – mineral fuels, lubricants and related materials, 4 –
Animal and vegetable oils and fats, and 68 - No ferrous metals (Lederman and Maloney 2007).
Natural resources exports as a percentage of GDP. Natural resource exports in Sub-Saharan
Africa declined, on average, from 11.8 percent of GDP in 1990-94 to 7.9 percent of GDP in 2010-14. The
decline in this ratio also took place among resource and non-resource rich countries. In the case of resource
rich countries, the (median) ratio of natural resources exports to GDP among resource rich countries
dropped by almost half from 46.2% of GDP in 1990-94 to 23.6% of GDP in 2010-14. The (median) ratio
also fell among non-resource rich countries (from 9.2% of GDP in 1990-94 to 6% in 2010-14). Finally,
the share of natural resource exports in total economic activity in resource rich countries was nearly four
times as large as that in non-resource rich countries.
Natural resource exports as a percentage of total merchandise exports. Table 1 shows that the
share of natural resource exports in total merchandise exports decreased over time in all country groups
at different speeds. For the region as a whole, this share declined from 91.4 percent in 1990-94 to 77.3
percent in 2010-14; that is a reduction of nearly 15 percentage points of total merchandise exports in the
past two decades. For resource rich countries, the share of natural resource exports in total merchandise
exports dropped from 98.6 percent in 1990-94 to 86.5 percent in 2010-14. Finally, natural resource export
dependence among non-resource rich countries decreased from 83.6 percent in 1990-94 to 74.9 percent in
2010-14. Note that although the share of natural resource exports in total merchandise exports among non-
resource rich countries is high, this ratio does not include services exports and their importance relative to
the size of economic activity is small.
Sectoral trade: Trade in primary goods vs. Trade in Manufacturing Goods
Assessing the linkages of the country with world goods’ markets also implies examining what you
export —that is the type of products that the country sells abroad. Table 1 presents the amount of trade (in
exports and imports) of primary goods vis-à-vis manufacturing goods of Sub-Saharan Africa over the past
10
20 years. Trade in primary goods includes exports and imports of agricultural raw materials, food, fuel,
mineral ores and metals. Trade in manufacturing goods comprises exports and imports in SITC sections
5 (chemicals), 6 (basic manufactures), 7 (machinery and transport equipment), and 8 (miscellaneous
manufactured goods), excluding division 68 (non-ferrous metals). Trade in primary and manufacturing
goods is expressed as a percentage of GDP and the data are collected from the World Bank’s World
Development Indicators.
The (median) value of trade in primary goods increased in Sub-Saharan Africa from 19.6 percent
of GDP in 1990-94 to 22.3 in 2010-14 while trade in manufacturing goods grew from 16.8 percent of GDP
in 1990-94 to 21.9 percent of GDP in 2010-14. This implies that the intensity of trade in manufacturing
goods increased at a faster pace in Sub-Saharan Africa (by about 5 percentage points of GDP). In the case
of resource rich countries, there is a sharp decline in the trade of primary goods (from 65.8 percent of
GDP in 1990-94 to 38.7 percent of GDP in 2010-14) while trade in manufacturing goods increased (from
15.1 percent of GDP in 1990-94 to 23.9 percent of GDP in 2010-14). Finally, trade in both primary and
manufacturing goods (as percentage of GDP) increased among non-resource rich countries over the past
20 years. As expected, trade in primary goods is smaller in non-resource rich countries (relative to resource
rich countries) and trade in manufacturing goods for this group is higher than that of primary goods.
Regional trade: Patterns of inter-regional and intra-regional trade
To close the characterization of the integration with global markets of goods, it matters how much,
what and to whom you have trade linkages with. Table 1 shows the (median) amount of trade conducted
by Sub-Saharan Africa with other world regions (inter-regional trade) and the amount of trade undertaken
within the region (intra-regional trade). The data are gathered from the World Bank’s World Development
Indicators and COMTRADE.
The (median) value of inter-regional across Sub-Saharan African countries increased over the past
two decades from 31.9 percent of GDP in 1990-94 to 34.8 percent in 2010-14, while intra-regional trade
grew from 20.04 percent of GDP in 1990-94 to 23.75 percent of GDP in 2010-14. Inter-regional trade
grew at a faster pace among resource rich countries from 1990-94 to 2010-14. Inter-regional trade
increased by about 8 percentage points of GDP (from 40.4 percent of GDP in 1990-94 to 48.6 percent of
GDP in 2010-14) while intra-regional trade grew by nearly 3 percentage points of GDP (from 19.4 percent
of GDP in 1990-94 to 21.98 percent of GDP in 2010-14). Finally, inter-regional trade for non-resource
rich countries in the region grew by approximately 5 percentage points of GDP (from 26.7 percent of GDP
11
in 1990-94 to 31.4 percent of GDP in 2010-14) while intra-regional trade remained almost unchanged at
about 30% of GDP over the past two decades.
3 Trade and Growth: A Detailed Econometric Analysis. This section estimates the long-term growth effects of the different dimensions of international
trade integration. The regression analysis is conducted on (unbalanced) panel data of non-overlapping 5-
year period averages for 174 countries (of which 45 countries are located in Sub-Saharan Africa) from
1970 to 2014. This section not only evaluates the impact of international trade integration on economic
growth, but it also examines the effects of international trade on the sources of growth; namely, growth of
capital per worker and total factor productivity (TFP) growth.
3.1 International trade integration and economic growth
Table 2 reports the GMM-IV system estimation of growth per worker on the different dimensions
of trade integration; namely, trade volume, export product concentration, export market concentration,
and the dependence on natural resource exports. Column [1] reports the effects of trade, and market and
product concentration while controlling for the initial level of GDP per worker. This specification will be
referred to as the baseline specification for the remainder of this section. Column [2] adds the ratio of
natural resources exports to GDP to the baseline specification. Column [3] adds growth determinants like
education (as measured by the secondary enrollment rate) and institutional quality (proxied by the ICRG
Political Risk Index). Finally, column [4] adds financial development (credit to the private sector as % of
GDP), government consumption (as % of GDP) and growth volatility to the specification in column [3].
The initial level of real output per worker, expressed in logs and included in all the specifications estimated
in Table 2, has a negative and significant coefficient. This is evidence of conditional convergence in labor
productivity.
Trade openness, as measured by real exports and imports as a percentage of GDP, has a positive
and significant effect on growth per worker. The coefficient estimates of trade openness in Table 2 range
from 0.016 to 0.034. After accounting for the other dimensions of trade integration in the growth
regression equation (say, export product diversification, export market diversification, and natural
resource dependence), the coefficient estimated of trade openness is still positive and significant; however,
the coefficient becomes smaller. Economically speaking, if trade volume in Sub-Saharan Africa doubles,
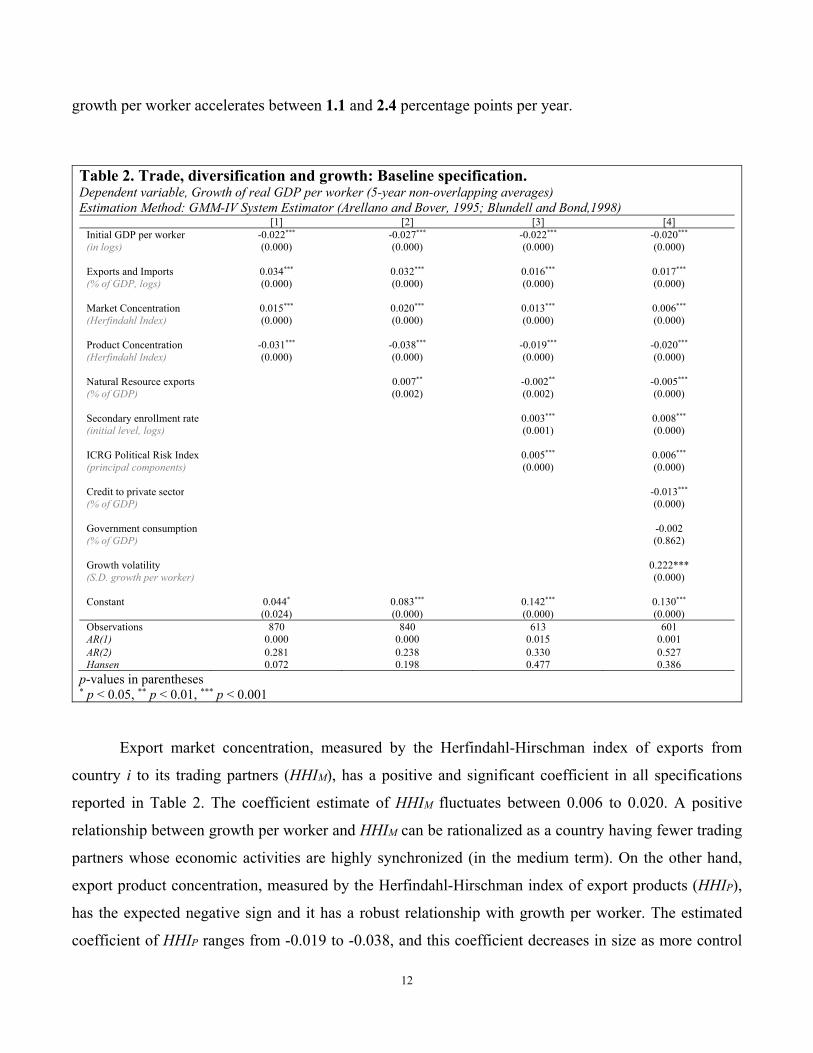
12
growth per worker accelerates between 1.1 and 2.4 percentage points per year.
Table 2. Trade, diversification and growth: Baseline specification. Dependent variable, Growth of real GDP per worker (5-year non-overlapping averages) Estimation Method: GMM-IV System Estimator (Arellano and Bover, 1995; Blundell and Bond,1998)
[1] [2] [3] [4] Initial GDP per worker -0.022*** -0.027*** -0.022*** -0.020*** (in logs) (0.000) (0.000) (0.000) (0.000) Exports and Imports 0.034*** 0.032*** 0.016*** 0.017*** (% of GDP, logs) (0.000) (0.000) (0.000) (0.000) Market Concentration 0.015*** 0.020*** 0.013*** 0.006*** (Herfindahl Index) (0.000) (0.000) (0.000) (0.000) Product Concentration -0.031*** -0.038*** -0.019*** -0.020*** (Herfindahl Index) (0.000) (0.000) (0.000) (0.000) Natural Resource exports 0.007** -0.002** -0.005*** (% of GDP) (0.002) (0.002) (0.000) Secondary enrollment rate 0.003*** 0.008*** (initial level, logs) (0.001) (0.000) ICRG Political Risk Index 0.005*** 0.006*** (principal components) (0.000) (0.000) Credit to private sector -0.013*** (% of GDP) (0.000) Government consumption -0.002 (% of GDP) (0.862) Growth volatility 0.222*** (S.D. growth per worker) (0.000) Constant 0.044* 0.083*** 0.142*** 0.130*** (0.024) (0.000) (0.000) (0.000) Observations 870 840 613 601 AR(1) 0.000 0.000 0.015 0.001 AR(2) 0.281 0.238 0.330 0.527 Hansen 0.072 0.198 0.477 0.386
p-values in parentheses * p < 0.05, ** p < 0.01, *** p < 0.001
Export market concentration, measured by the Herfindahl-Hirschman index of exports from
country i to its trading partners (HHIM), has a positive and significant coefficient in all specifications
reported in Table 2. The coefficient estimate of HHIM fluctuates between 0.006 to 0.020. A positive
relationship between growth per worker and HHIM can be rationalized as a country having fewer trading
partners whose economic activities are highly synchronized (in the medium term). On the other hand,
export product concentration, measured by the Herfindahl-Hirschman index of export products (HHIP),
has the expected negative sign and it has a robust relationship with growth per worker. The estimated
coefficient of HHIP ranges from -0.019 to -0.038, and this coefficient decreases in size as more control
13
variables are included in the growth regression. This finding suggests that diversification of export
products fosters economic growth. Economically, if the Herfindahl index of export products were to be
reduced in half, growth per worker would accelerate between 1.3 and 2.6 percentage points per year.
Natural resource exports as a percentage of GDP does not present a robust relationship with growth
per worker. In column [2] of Table 2, the relationship is positive and significant. However, as more control
variables are added in the regression (see columns [3] and [4] of Table 2), the coefficient becomes negative
and significant. These findings may indicate that, after controlling for other growth determinants, the
greater abundance of natural resource exports relative to the size of the economy may hinder growth.
Why? The concentration of natural resource exports in the country’s export basket renders it vulnerable
to volatile fluctuations in international commodity prices, and that greater volatility harms growth. On the
other hand, natural resource abundance may lower growth per worker if the export proceeds from these
goods are not invested in reproducible capital or if not used to support institutional and/or structural
reforms. In the context of our regression analysis (columns [3] and [4] of Table 2), reducing natural
resource export dependence in half would render faster growth per worker between 0.1 and 0.3 percentage
point per year.
3.2 International trade integration and the sources of growth
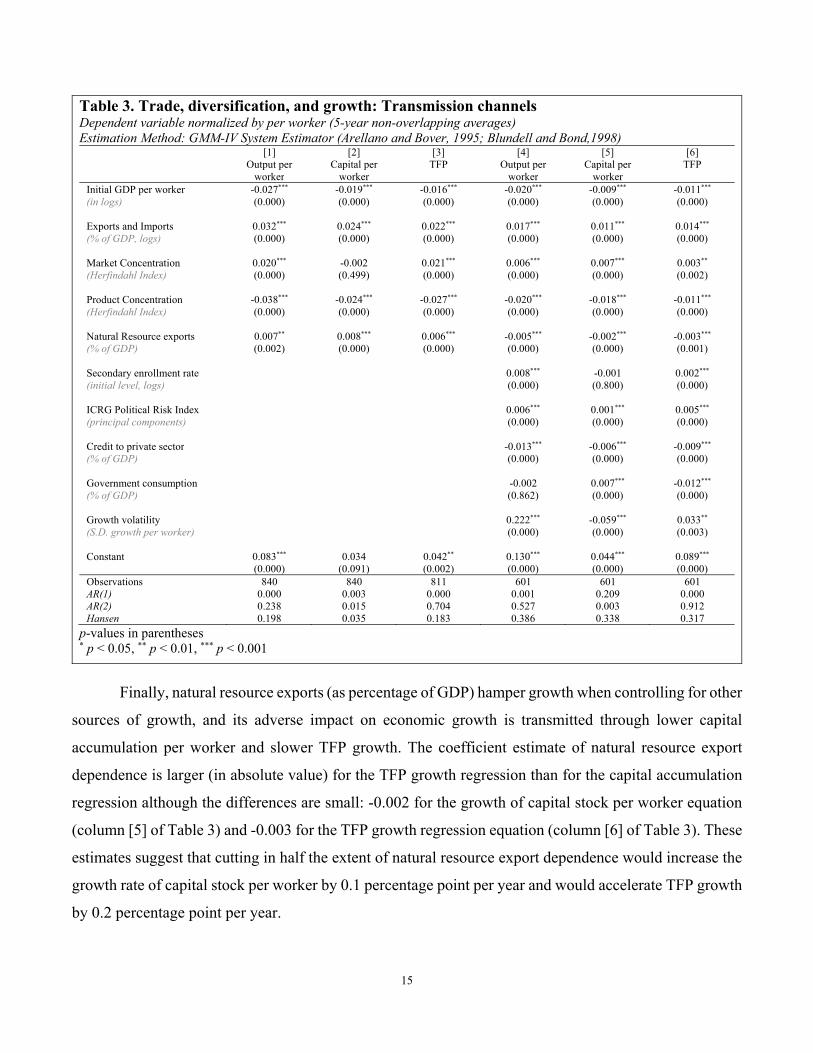
Table 3 examines the channels through which the impact of international trade integration on
growth is transmitted; that is, it assesses the impact of the different dimensions of trade integration on the
sources of growth —namely, growth of physical capital per worker and total factor productivity (TFP)
growth. Note that the specification of the regressions in Table 3 follow that of columns [2] and [4] from
Table 2. The first three columns of Table 3 reproduce the growth per worker regression from column [2]
of Table 2 and estimates the same specification for growth in capital per worker and TFP growth. Columns
[4] – [6] repeat the same exercise for the specification of Column [4] of Table 2. The underlying difference
between the estimation of the first three columns and next three columns of Table 3 is the inclusion of
additional growth drivers: secondary enrollment rate, ICRG Political Risk Index, credit to private sector,
government consumption, and growth volatility.
The first takeaways from Table 3 are that, first, countries with lower starting level of labor
productivity tend to exhibit higher growth per worker as well as higher growth of physical capital per
worker and faster TFP growth. Second, education and institutional quality have a positive and significant
14
effect on growth per worker through the TFP growth channel. Third, growth-enhancing effects of lower
government burden are also transmitted through the TFP growth channel. Finally, the impact of growth
volatility on growth per worker is more likely to be transmitted through lower domestic investment.
Trade openness has a positive and significant impact on growth per worker (see Table 2) and that
impact is transmitted not only through a faster accumulation of physical capital per worker but also
through an acceleration in TFP growth (see Table 3). The impact of trade openness through both channels
of transmission tends to be larger in the more parsimonious specifications —that is, 0.024 in the growth
of physical capital accumulation equation and 0.022 in the TFP growth equation (see columns [2] and [3]
of Table 3, respectively). Accounting for other drivers of growth, the impact of trade openness on the
sources of growth is still significant but smaller: 0.011 for the capital accumulation equation and 0.014
for the TFP growth equation —see columns [5] and [6] of Table 3, respectively. Using the regression
results that controls for other drivers of growth, our estimates suggest that doubling the volume of trade
would increase the growth of physical capital per worker by 0.8 percentage point per year while TFP
growth would accelerate by 1 percentage point per year.
Export product concentration (HHIP) has a negative and significant relationship with growth per
worker, and its effects are transmitted through a faster accumulation of physical capital per worker and
higher TFP growth. The impact of export product concentration on the sources of growth tends to be larger
(in size) in the baseline specification —that is, -0.024 in the growth of physical capital accumulation
equation and -0.027 in the TFP growth equation (see columns [2] and [3] of Table 3, respectively).
Accounting for other drivers of growth, the impact of HHIP on the sources of growth is still significant
but smaller: -0.018 for the capital accumulation equation and -0.011 for the TFP growth equation —see
columns [5] and [6] of Table 3, respectively. According to the latter estimated equations, reducing the
Herfindahl index of export product concentration in half would increase the growth of the physical stock
of capital by 1.2 percentage points per year, and TFP growth would accelerate by 0.8 percentage point per
year.
Export market concentration (HHIM) has a positive impact on growth per worker (see columns [1]
and [4] in Table 3); however, the sign and significance of its impact on the sources of growth is not robust
to changes in the specification. In the baseline specification, HHIM has no significant impact on physical
capital accumulation and a positive and significant impact on TFP growth (see columns [2] and [3] of
Table 3, respectively). In contrast, growth effects are positively transmitted through capital accumulation
and TFP growth in the augmented specification (see columns [5] and [6] of Table 3, respectively).
15
Table 3. Trade, diversification, and growth: Transmission channels Dependent variable normalized by per worker (5-year non-overlapping averages) Estimation Method: GMM-IV System Estimator (Arellano and Bover, 1995; Blundell and Bond,1998)
[1] [2] [3] [4] [5] [6] Output per
worker Capital per
worker TFP Output per
worker Capital per
worker TFP
Initial GDP per worker -0.027*** -0.019*** -0.016*** -0.020*** -0.009*** -0.011*** (in logs) (0.000) (0.000) (0.000) (0.000) (0.000) (0.000) Exports and Imports 0.032*** 0.024*** 0.022*** 0.017*** 0.011*** 0.014*** (% of GDP, logs) (0.000) (0.000) (0.000) (0.000) (0.000) (0.000) Market Concentration 0.020*** -0.002 0.021*** 0.006*** 0.007*** 0.003** (Herfindahl Index) (0.000) (0.499) (0.000) (0.000) (0.000) (0.002) Product Concentration -0.038*** -0.024*** -0.027*** -0.020*** -0.018*** -0.011*** (Herfindahl Index) (0.000) (0.000) (0.000) (0.000) (0.000) (0.000) Natural Resource exports 0.007** 0.008*** 0.006*** -0.005*** -0.002*** -0.003*** (% of GDP) (0.002) (0.000) (0.000) (0.000) (0.000) (0.001) Secondary enrollment rate 0.008*** -0.001 0.002*** (initial level, logs) (0.000) (0.800) (0.000) ICRG Political Risk Index 0.006*** 0.001*** 0.005*** (principal components) (0.000) (0.000) (0.000) Credit to private sector -0.013*** -0.006*** -0.009*** (% of GDP) (0.000) (0.000) (0.000) Government consumption -0.002 0.007*** -0.012*** (% of GDP) (0.862) (0.000) (0.000) Growth volatility 0.222*** -0.059*** 0.033** (S.D. growth per worker) (0.000) (0.000) (0.003) Constant 0.083*** 0.034 0.042** 0.130*** 0.044*** 0.089*** (0.000) (0.091) (0.002) (0.000) (0.000) (0.000) Observations 840 840 811 601 601 601 AR(1) 0.000 0.003 0.000 0.001 0.209 0.000 AR(2) 0.238 0.015 0.704 0.527 0.003 0.912 Hansen 0.198 0.035 0.183 0.386 0.338 0.317
p-values in parentheses * p < 0.05, ** p < 0.01, *** p < 0.001
Finally, natural resource exports (as percentage of GDP) hamper growth when controlling for other
sources of growth, and its adverse impact on economic growth is transmitted through lower capital
accumulation per worker and slower TFP growth. The coefficient estimate of natural resource export
dependence is larger (in absolute value) for the TFP growth regression than for the capital accumulation
regression although the differences are small: -0.002 for the growth of capital stock per worker equation
(column [5] of Table 3) and -0.003 for the TFP growth regression equation (column [6] of Table 3). These
estimates suggest that cutting in half the extent of natural resource export dependence would increase the
growth rate of capital stock per worker by 0.1 percentage point per year and would accelerate TFP growth
by 0.2 percentage point per year.
16
3.3 International trade integration and economic growth: Primary vs. Manufacturing
Exports
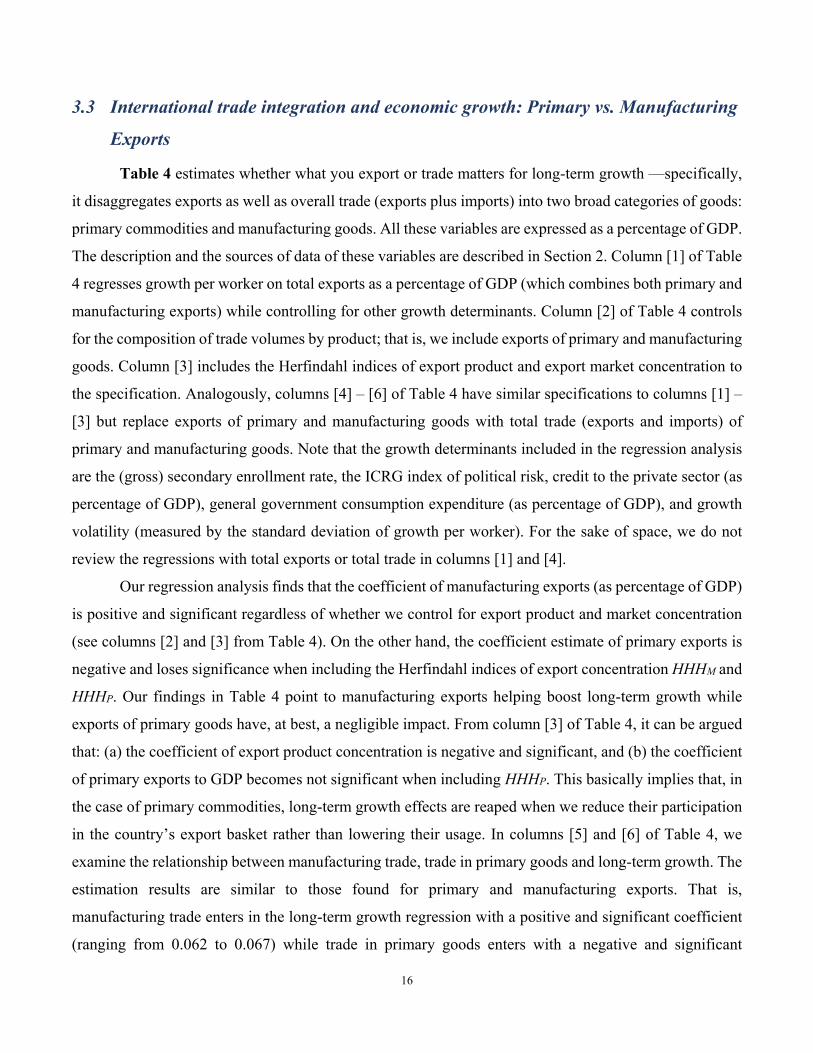
Table 4 estimates whether what you export or trade matters for long-term growth —specifically,
it disaggregates exports as well as overall trade (exports plus imports) into two broad categories of goods:
primary commodities and manufacturing goods. All these variables are expressed as a percentage of GDP.
The description and the sources of data of these variables are described in Section 2. Column [1] of Table
4 regresses growth per worker on total exports as a percentage of GDP (which combines both primary and
manufacturing exports) while controlling for other growth determinants. Column [2] of Table 4 controls
for the composition of trade volumes by product; that is, we include exports of primary and manufacturing
goods. Column [3] includes the Herfindahl indices of export product and export market concentration to
the specification. Analogously, columns [4] – [6] of Table 4 have similar specifications to columns [1] –
[3] but replace exports of primary and manufacturing goods with total trade (exports and imports) of
primary and manufacturing goods. Note that the growth determinants included in the regression analysis
are the (gross) secondary enrollment rate, the ICRG index of political risk, credit to the private sector (as
percentage of GDP), general government consumption expenditure (as percentage of GDP), and growth
volatility (measured by the standard deviation of growth per worker). For the sake of space, we do not
review the regressions with total exports or total trade in columns [1] and [4].
Our regression analysis finds that the coefficient of manufacturing exports (as percentage of GDP)
is positive and significant regardless of whether we control for export product and market concentration
(see columns [2] and [3] from Table 4). On the other hand, the coefficient estimate of primary exports is
negative and loses significance when including the Herfindahl indices of export concentration HHHM and
HHHP. Our findings in Table 4 point to manufacturing exports helping boost long-term growth while
exports of primary goods have, at best, a negligible impact. From column [3] of Table 4, it can be argued
that: (a) the coefficient of export product concentration is negative and significant, and (b) the coefficient
of primary exports to GDP becomes not significant when including HHHP. This basically implies that, in
the case of primary commodities, long-term growth effects are reaped when we reduce their participation
in the country’s export basket rather than lowering their usage. In columns [5] and [6] of Table 4, we
examine the relationship between manufacturing trade, trade in primary goods and long-term growth. The
estimation results are similar to those found for primary and manufacturing exports. That is,
manufacturing trade enters in the long-term growth regression with a positive and significant coefficient
(ranging from 0.062 to 0.067) while trade in primary goods enters with a negative and significant
17
coefficient that fluctuates over a wider range (from -0.108 to -0.042). These results hold even when we
include the indicators of export product and export market concentration.
Table 4. Trade, diversification and growth: Primary vs. Manufacturing Exports. Dependent variable, Growth of real GDP per worker (5-year non-overlapping averages) Estimation Method: GMM-IV System Estimator (Arellano and Bover, 1995; Blundell and Bond,1998)
[1] [2] [3] [4] [5] [6] Initial GDP per worker -0.0247*** -0.020*** -0.022*** -0.0213*** -0.018*** -0.018*** (in logs) (0.000) (0.000) (0.000) (0.000) (0.000) (0.000) Total Exports (X) 0.0612*** (Manufacturing + primary) (0.000) Exports, manufacturing 0.089*** 0.098*** (% of GDP) (0.000) (0.000) Exports, primary -0.104*** -0.002 (% of GDP) (0.000) (0.827) 0.0368*** Total Trade (X+M) (0.000) (Manufacturing + primary) Trade (X+M), manufacturing 0.062*** 0.067*** (% of GDP) (0.000) (0.000) Trade (X+M), primary -0.108*** -0.042*** (% of GDP) (0.000) (0.000) Market Concentration 0.00881*** 0.005** 0.0119*** 0.006** (Herfindahl Index) (0.000) (0.004) (0.000) (0.005) Product Concentration -0.0246*** -0.020*** -0.0277*** -0.020*** (Herfindahl Index) (0.000) (0.000) (0.000) (0.000) Secondary enrollment rate 0.00951*** 0.015*** 0.009*** 0.00822*** 0.014*** 0.008*** (initial level, logs) (0.000) (0.000) (0.000) (0.000) (0.000) (0.000) ICRG Political Risk Index 0.00475*** 0.009*** 0.004*** 0.00381*** 0.008*** 0.003*** (principal components) (0.000) (0.000) (0.000) (0.000) (0.000) (0.000) Credit to private sector -0.0125*** -0.015*** -0.017*** -0.0148*** -0.015*** -0.019*** (% of GDP) (0.000) (0.000) (0.000) (0.000) (0.000) (0.000) Government consumption 0.00572*** 0.006** 0.011*** 0.00119 -0.001 0.005*** (% of GDP) (0.000) (0.001) (0.000) (0.521) (0.400) (0.000) Growth volatility 0.137*** 0.227*** 0.156*** 0.201*** 0.265*** 0.221*** (S.D. growth per worker) (0.000) (0.000) (0.000) (0.000) (0.000) (0.000) Constant 0.195*** 0.194*** 0.181*** 0.180*** 0.191*** 0.170*** (0.000) (0.000) (0.000) (0.000) (0.000) (0.000) Observations 595 614 595 589 607 589 AR(1) 0.002 0.005 0.003 0.001 0.003 0.002 AR(2) 0.425 0.675 0.516 0.505 0.809 0.676 Hansen 0.566 0.426 0.724 0.507 0.521 0.689
p-values in parentheses * p < 0.05, ** p < 0.01, *** p < 0.001
Using our coefficient estimates in column [6] of Table 4, we find that reducing in half the ratio of
exports and imports of primary goods (as a percentage to GDP) in Sub-Saharan Africa would lead to an
increase in the annual rate of growth per worker of 0.5 percentage point. Another way to estimate the
18
economic impact of trade in primary goods is to estimate the potential growth effects of reducing this
share to the median level of industrial countries. Under this scenario, growth per worker would increase
by 0.3 percentage point. On the other hand, doubling the ratio of exports and imports of manufacturing
goods (as a percentage of GDP) in Sub-Saharan Africa would lead to higher growth per worker of about
1.5 percentage points per year. If manufacturing trade in Sub-Saharan Africa were to increase to the levels
of the median level of industrial countries, economic growth would increase by 0.7 percentage point per
year.
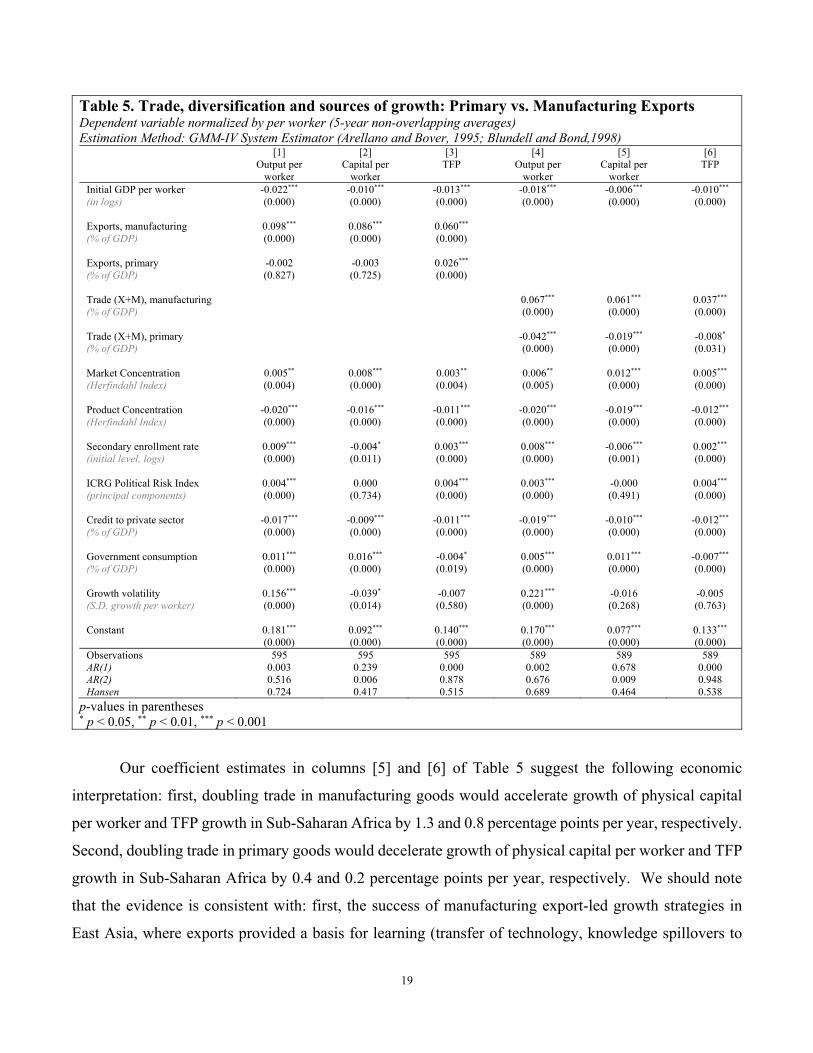
Table 5 estimates the impact of trade in primary and manufacturing goods (proxied by either
exports or total trade as a percentage of GDP) on the sources of growth using the specification in columns
[3] and [6] of Table 4. Analogous to Table 3, the first three columns of Table 5 reproduced the growth per
worker regression equation (column [3] of Table 4) and estimate a similar specification for the growth of
physical capital per worker and TFP growth. The remaining three columns in Table 5 repeats the
specification in column [6] of Table 4 and estimates a similar specification for the sources of growth. In
the first three columns of Table 5, manufacturing exports have a positive and significant impact on growth
per worker through both faster accumulation of physical capital per worker and higher TFP growth —
although the coefficient of the former variable seems to be larger than the latter. Primary exports have a
negative and not significant impact on growth per worker and the accumulation of capital per worker.
Surprisingly, it has a positive and significant impact on TFP growth.
The last three columns of Table 5 depict the impact of trade in primary and manufacturing goods
on the sources of growth. The impact of manufacturing trade (as % of GDP) on long-term growth is
positive and it is transmitted through either a faster accumulation of the physical capital stock per worker
or through an acceleration of TFP growth. Manufacturing trade has a greater effect on growth through
capital accumulation than through TFP growth (with a coefficient of 0.061 in the capital accumulation
equation, and 0.037 in the TFP growth equation). In contrast, trade in primary goods have a negative and
significant impact on growth, and it is transmitted through both capital accumulation and TFP growth.
Again, the adverse impact is larger on the accumulation of physical capital per worker.
19
Table 5. Trade, diversification and sources of growth: Primary vs. Manufacturing Exports Dependent variable normalized by per worker (5-year non-overlapping averages) Estimation Method: GMM-IV System Estimator (Arellano and Bover, 1995; Blundell and Bond,1998)
[1] [2] [3] [4] [5] [6] Output per
worker Capital per
worker TFP Output per
worker Capital per
worker TFP
Initial GDP per worker -0.022*** -0.010*** -0.013*** -0.018*** -0.006*** -0.010*** (in logs) (0.000) (0.000) (0.000) (0.000) (0.000) (0.000) Exports, manufacturing 0.098*** 0.086*** 0.060*** (% of GDP) (0.000) (0.000) (0.000) Exports, primary -0.002 -0.003 0.026*** (% of GDP) (0.827) (0.725) (0.000) Trade (X+M), manufacturing 0.067*** 0.061*** 0.037*** (% of GDP) (0.000) (0.000) (0.000) Trade (X+M), primary -0.042*** -0.019*** -0.008* (% of GDP) (0.000) (0.000) (0.031) Market Concentration 0.005** 0.008*** 0.003** 0.006** 0.012*** 0.005*** (Herfindahl Index) (0.004) (0.000) (0.004) (0.005) (0.000) (0.000) Product Concentration -0.020*** -0.016*** -0.011*** -0.020*** -0.019*** -0.012*** (Herfindahl Index) (0.000) (0.000) (0.000) (0.000) (0.000) (0.000) Secondary enrollment rate 0.009*** -0.004* 0.003*** 0.008*** -0.006*** 0.002*** (initial level, logs) (0.000) (0.011) (0.000) (0.000) (0.001) (0.000) ICRG Political Risk Index 0.004*** 0.000 0.004*** 0.003*** -0.000 0.004*** (principal components) (0.000) (0.734) (0.000) (0.000) (0.491) (0.000) Credit to private sector -0.017*** -0.009*** -0.011*** -0.019*** -0.010*** -0.012*** (% of GDP) (0.000) (0.000) (0.000) (0.000) (0.000) (0.000) Government consumption 0.011*** 0.016*** -0.004* 0.005*** 0.011*** -0.007*** (% of GDP) (0.000) (0.000) (0.019) (0.000) (0.000) (0.000) Growth volatility 0.156*** -0.039* -0.007 0.221*** -0.016 -0.005 (S.D. growth per worker) (0.000) (0.014) (0.580) (0.000) (0.268) (0.763) Constant 0.181*** 0.092*** 0.140*** 0.170*** 0.077*** 0.133*** (0.000) (0.000) (0.000) (0.000) (0.000) (0.000) Observations 595 595 595 589 589 589 AR(1) 0.003 0.239 0.000 0.002 0.678 0.000 AR(2) 0.516 0.006 0.878 0.676 0.009 0.948 Hansen 0.724 0.417 0.515 0.689 0.464 0.538
p-values in parentheses * p < 0.05, ** p < 0.01, *** p < 0.001
Our coefficient estimates in columns [5] and [6] of Table 5 suggest the following economic
interpretation: first, doubling trade in manufacturing goods would accelerate growth of physical capital
per worker and TFP growth in Sub-Saharan Africa by 1.3 and 0.8 percentage points per year, respectively.
Second, doubling trade in primary goods would decelerate growth of physical capital per worker and TFP
growth in Sub-Saharan Africa by 0.4 and 0.2 percentage points per year, respectively. We should note
that the evidence is consistent with: first, the success of manufacturing export-led growth strategies in
East Asia, where exports provided a basis for learning (transfer of technology, knowledge spillovers to
20
other industries and sectors and greater demand for skilled labor). Second, the negative impact of
commodity exports on growth due to, among other factors, the instability of export proceeds, the negative
spillovers on non-resource-based activities in countries with poor governance and, more broadly,
misallocation of resources.
3.4 International trade integration and economic growth: Inter-regional vs. Intra-
regional trade
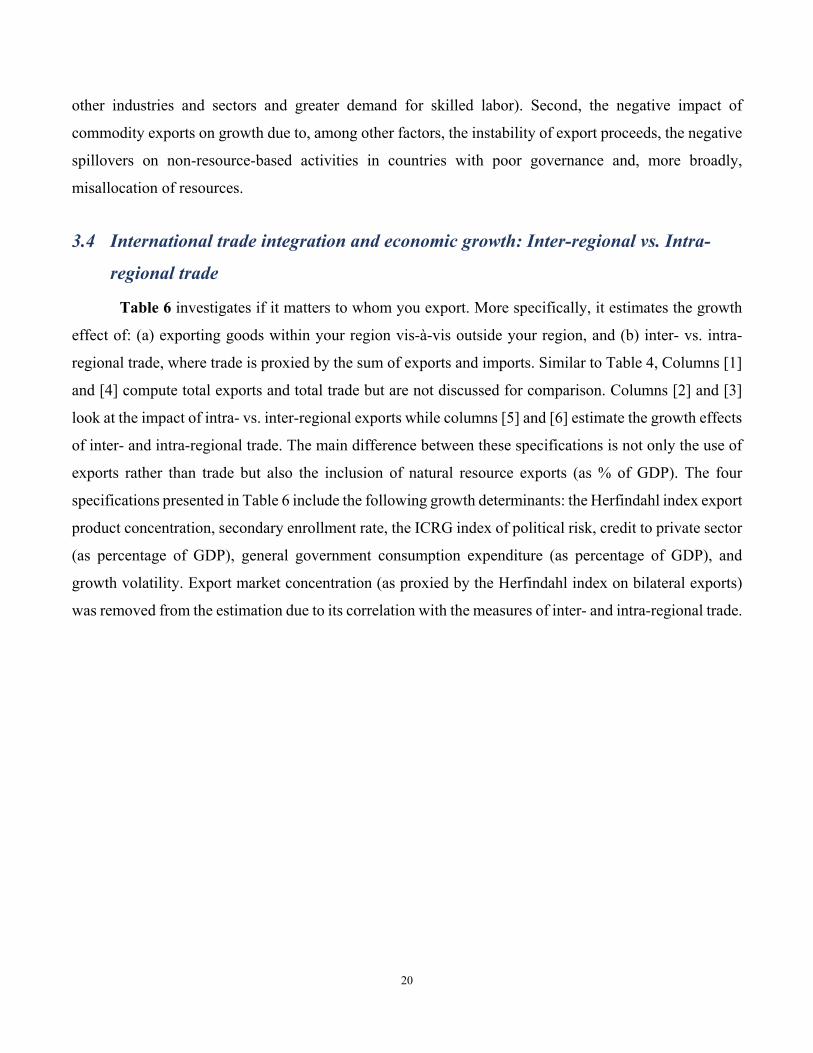
Table 6 investigates if it matters to whom you export. More specifically, it estimates the growth
effect of: (a) exporting goods within your region vis-à-vis outside your region, and (b) inter- vs. intra-
regional trade, where trade is proxied by the sum of exports and imports. Similar to Table 4, Columns [1]
and [4] compute total exports and total trade but are not discussed for comparison. Columns [2] and [3]
look at the impact of intra- vs. inter-regional exports while columns [5] and [6] estimate the growth effects
of inter- and intra-regional trade. The main difference between these specifications is not only the use of
exports rather than trade but also the inclusion of natural resource exports (as % of GDP). The four
specifications presented in Table 6 include the following growth determinants: the Herfindahl index export
product concentration, secondary enrollment rate, the ICRG index of political risk, credit to private sector
(as percentage of GDP), general government consumption expenditure (as percentage of GDP), and
growth volatility. Export market concentration (as proxied by the Herfindahl index on bilateral exports)
was removed from the estimation due to its correlation with the measures of inter- and intra-regional trade.
21
Table 6. Trade, diversification, and growth: Inter- and intra-regional trade Dependent variable, Growth of real GDP per worker (5-year non-overlapping averages) Estimation Method: GMM-IV System Estimator (Arellano and Bover, 1995; Blundell and Bond,1998)
[1] [2] [3] [4] [5] [6] Initial GDP per worker -0.0245*** -0.0225*** -0.0214*** -0.0198*** -0.019*** -0.018*** (in logs) (0.000) (0.000) (0.000) (0.000) (0.000) (0.000) Exports, total 0.0610*** (inter + intra) (0.000) Exports, inter-regional 0.0869*** 0.101*** (0.000) (0.000) Exports, intra-regional 0.0137 0.00914 (0.059) (0.291) Trade, total 0.0350*** (inter + intra) (0.000) Trade, inter-regional 0.048*** 0.054*** (0.000) (0.000) Trade, intra-regional 0.019** 0.006 (0.003) (0.174) Natural Resource exports -0.00628*** -0.020*** (% of GDP) (0.000) (0.000) Product Concentration -0.0197*** -0.0214*** -0.0181*** -0.0215*** -0.023*** -0.005*** (Herfindahl Index) (0.000) (0.000) (0.000) (0.000) (0.000) (0.000) Secondary enrollment rate 0.00868*** 0.00976*** 0.00911*** 0.00704*** 0.007*** 0.008*** (initial level, logs) (0.000) (0.000) (0.000) (0.000) (0.000) (0.000) ICRG Political Risk Index 0.00620*** 0.00621*** 0.00655*** 0.00681*** 0.007*** 0.007*** (principal components) (0.000) (0.000) (0.000) (0.000) (0.000) (0.000) Credit to private sector -0.0115*** -0.0107*** -0.0107*** -0.0135*** -0.013*** -0.013*** (% of GDP) (0.000) (0.000) (0.000) (0.000) (0.000) (0.000) Government consumption 0.00806*** 0.00738*** 0.00613*** 0.00495** 0.005** 0.005*** (% of GDP) (0.000) (0.000) (0.000) (0.003) (0.003) (0.000) Growth volatility 0.181*** 0.194*** 0.217*** 0.201*** 0.215*** 0.232*** (S.D. growth per worker) (0.000) (0.000) (0.000) (0.000) (0.000) (0.000) Constant 0.151*** 0.151*** 0.163*** 0.142*** 0.130*** 0.137*** (0.000) (0.000) (0.000) (0.000) (0.000) (0.000) Observations 606 606 597 602 602 594 AR(1) 0.000 0.000 0.001 0.000 0.000 0.001 AR(2) 0.481 0.478 0.456 0.504 0.493 0.495 Hansen 0.515 0.435 0.498 0.426 0.356 0.463
p-values in parentheses * p < 0.05, ** p < 0.01, *** p < 0.001
Our regression estimates from Table 6 yield the following results: first, the coefficient of inter-
regional exports is positive and significant while that of intra-regional exports has a negligible impact on
long-term growth (see columns [2] and [3] of Table 6). Second, inter-regional and intra-regional trade
have a positive and significant impact on growth per worker; especially, when we do not account for
22
natural resource exports (as a percentage of GDP) in the regression specification.3 We illustrate the
economic impact of greater inter- and intra-regional trade using the regression estimates in column [5] of
Table 6. Doubling the amount of inter-regional trade would lead to an average annual increase of the rate
of growth per worker of about 1.7 percentage points. An alternative scenario is to increase the level of
inter-regional trade of Sub-Saharan African countries to the 75th percentile of non-SSA developing
countries —which amounts to an increase of 14 percentage points of GDP. Under this scenario, growth
per capita would increase by 0.7 percentage point per year. On the other hand, intra-regional trade also
renders positive growth returns although they are smaller than those of inter-regional trade. For instance,
doubling intra-regional trade in Sub-Saharan Africa would accelerate growth per worker by 0.5 percentage
points per year. Analogously, raising the level of intra-regional trade of Sub-Saharan African countries to
the 75th percentile of non-SSA developing countries (almost 39 percentage points of GDP) would increase
the growth rate by 0.7 percentage point of GDP.
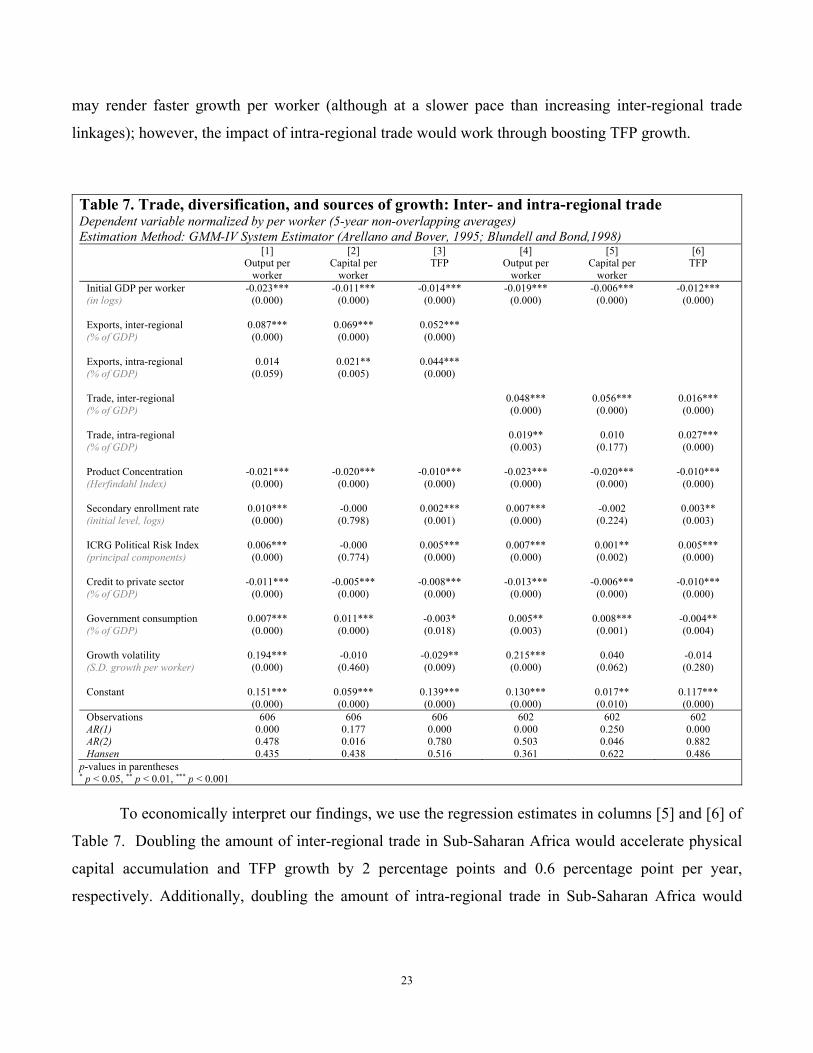
Table 7 evaluates the impact of inter- and intra-regional trade on the sources of growth. Again,
the growth regressions in columns [2] and [5] of Table 6 are selected to estimate the impact of trade on
the growth of physical capital per worker and TFP growth. The first three columns of Table 7 estimate the
effects of inter- and intra-regional exports while the remaining three columns present the impact of inter-
and intra-regional trade (that is, exports and imports).
Inter-regional exports enhance growth per worker and the impact is significant through both a
faster accumulation of capital per worker and higher TFP growth, and the impact through the capital
accumulation channel is larger than that of TFP growth (0.069 and 0.052 in columns [2] and [3] of Table
7, respectively). Intra-regional exports, on the other hand, have a muted impact on growth per worker.
However, they appear to have a significant impact on capital accumulation and TFP growth (0.021 vs.
0.044 in columns [2] and [3] of Table 7, respectively).
The last three columns of Table 7 empirically show that: (a) inter-regional trade has an impact on
long-term growth through the capital accumulation channel rather than the TFP growth channel, and (b)
intra-regional trade affects long-term growth through the TFP growth channel only.4 Overall, these
findings show that elevating the intensity of intra-regional trade linkages among countries in the region
3 Note that natural resource exports (as percentage of GDP) is detrimental to growth in our regression analysis. The coefficient estimates suggest that if countries were to cut the dependence of natural resources from their export baskets in half, growth per worker would increase by 1 percentage point (using column [6] of Table 6). 4 Note that all these regressions also reveal that export product diversification contributes positively to growth.
23
may render faster growth per worker (although at a slower pace than increasing inter-regional trade
linkages); however, the impact of intra-regional trade would work through boosting TFP growth.
Table 7. Trade, diversification, and sources of growth: Inter- and intra-regional trade Dependent variable normalized by per worker (5-year non-overlapping averages) Estimation Method: GMM-IV System Estimator (Arellano and Bover, 1995; Blundell and Bond,1998)
[1] [2] [3] [4] [5] [6] Output per
worker Capital per
worker TFP Output per
worker Capital per
worker TFP
Initial GDP per worker -0.023*** -0.011*** -0.014*** -0.019*** -0.006*** -0.012*** (in logs) (0.000) (0.000) (0.000) (0.000) (0.000) (0.000) Exports, inter-regional 0.087*** 0.069*** 0.052*** (% of GDP) (0.000) (0.000) (0.000) Exports, intra-regional 0.014 0.021** 0.044*** (% of GDP) (0.059) (0.005) (0.000) Trade, inter-regional 0.048*** 0.056*** 0.016*** (% of GDP) (0.000) (0.000) (0.000) Trade, intra-regional 0.019** 0.010 0.027*** (% of GDP) (0.003) (0.177) (0.000) Product Concentration -0.021*** -0.020*** -0.010*** -0.023*** -0.020*** -0.010*** (Herfindahl Index) (0.000) (0.000) (0.000) (0.000) (0.000) (0.000) Secondary enrollment rate 0.010*** -0.000 0.002*** 0.007*** -0.002 0.003** (initial level, logs) (0.000) (0.798) (0.001) (0.000) (0.224) (0.003) ICRG Political Risk Index 0.006*** -0.000 0.005*** 0.007*** 0.001** 0.005*** (principal components) (0.000) (0.774) (0.000) (0.000) (0.002) (0.000) Credit to private sector -0.011*** -0.005*** -0.008*** -0.013*** -0.006*** -0.010*** (% of GDP) (0.000) (0.000) (0.000) (0.000) (0.000) (0.000) Government consumption 0.007*** 0.011*** -0.003* 0.005** 0.008*** -0.004** (% of GDP) (0.000) (0.000) (0.018) (0.003) (0.001) (0.004) Growth volatility 0.194*** -0.010 -0.029** 0.215*** 0.040 -0.014 (S.D. growth per worker) (0.000) (0.460) (0.009) (0.000) (0.062) (0.280) Constant 0.151*** 0.059*** 0.139*** 0.130*** 0.017** 0.117*** (0.000) (0.000) (0.000) (0.000) (0.010) (0.000) Observations 606 606 606 602 602 602 AR(1) 0.000 0.177 0.000 0.000 0.250 0.000 AR(2) 0.478 0.016 0.780 0.503 0.046 0.882 Hansen 0.435 0.438 0.516 0.361 0.622 0.486
p-values in parentheses * p < 0.05, ** p < 0.01, *** p < 0.001
To economically interpret our findings, we use the regression estimates in columns [5] and [6] of
Table 7. Doubling the amount of inter-regional trade in Sub-Saharan Africa would accelerate physical
capital accumulation and TFP growth by 2 percentage points and 0.6 percentage point per year,
respectively. Additionally, doubling the amount of intra-regional trade in Sub-Saharan Africa would
24
increase the average annual growth rate of physical capital per worker by 0.2 percentage point and enhance
TFP growth by 0.6 percentage point per year.
4 Potential Growth Benefits of Greater International Trade Integration: A Comparative Statics Analysis
This section uses the econometric analysis from section 3 to conduct a series of exercises through
which we calculate the potential growth benefits of improving international trade integration in Sub-
Saharan Africa. In this section, improving international trade integration involves illustrating the growth
effects of: (a) expanding manufacturing trade volumes, (b) increasing export product diversification, and
(c) increasing intra-regional trade. The (potential) improvement of the aforementioned dimensions of
international trade integration implies comparing the trade performance of Sub-Saharan African countries
(including country groups classified by their extent of natural resource abundance within the region) to a
series of regional/international benchmarks.
Specifically, the comparative statics analysis conducted in this section consists of increasing the
degree of manufacturing trade, reducing the Herfindahl index of export product concentration, and raising
the extent of intra-regional trade to a determined benchmark. The comparative analysis is conducted across
two different dimensions: first, we compute the growth benefits of narrowing the gap (using the latest time
series observation for each country in the panel database) in manufacturing trade, export product
diversification, and intra-regional trade for the whole region (and natural-resource-dependent country
groups in Sub-Saharan Africa) vis-à-vis select regional benchmarks. Second, we compute the growth
benefits from improvements in manufacturing trade, product diversification and intra-regional trade over
time (say, over either a 10- or a 20-year horizon). Note that, in both cases, we compute the growth effects
as well as the impact on physical capital accumulation, and TFP growth. Furthermore, the comparative
statistical analysis is illustrative rather than conclusive because —among other simplifying assumptions—
it is based on the implicit hypothesis that changes in trade do not lead to changes in any of the other growth
determinants.
We will first look at the impact of narrowing the gaps in international trade integration on growth
per worker, the accumulation of physical capital per worker and TFP growth for specific period in time
(in our case, it is the most recent available). The benchmark countries/regions selected for this comparative
exercise are: (i) the country leader in Sub-Saharan Africa (SSA), (ii) the 90th percentile of the world sample
excluding SSA countries, (iii) the median value of the industrialized countries, and (iv) the median for the
25
East Asia and the Pacific (EAP) region. Computing the growth benefits of closing the gap relative to a
specific benchmark uses the values of the different dimensions of trade integration over the last five-year
period (2010-14) using the following formula:
𝐺𝑟𝑜𝑤𝑡ℎ 𝑏𝑒𝑛𝑒𝑓𝑖𝑡 𝛽 𝑧 𝑧
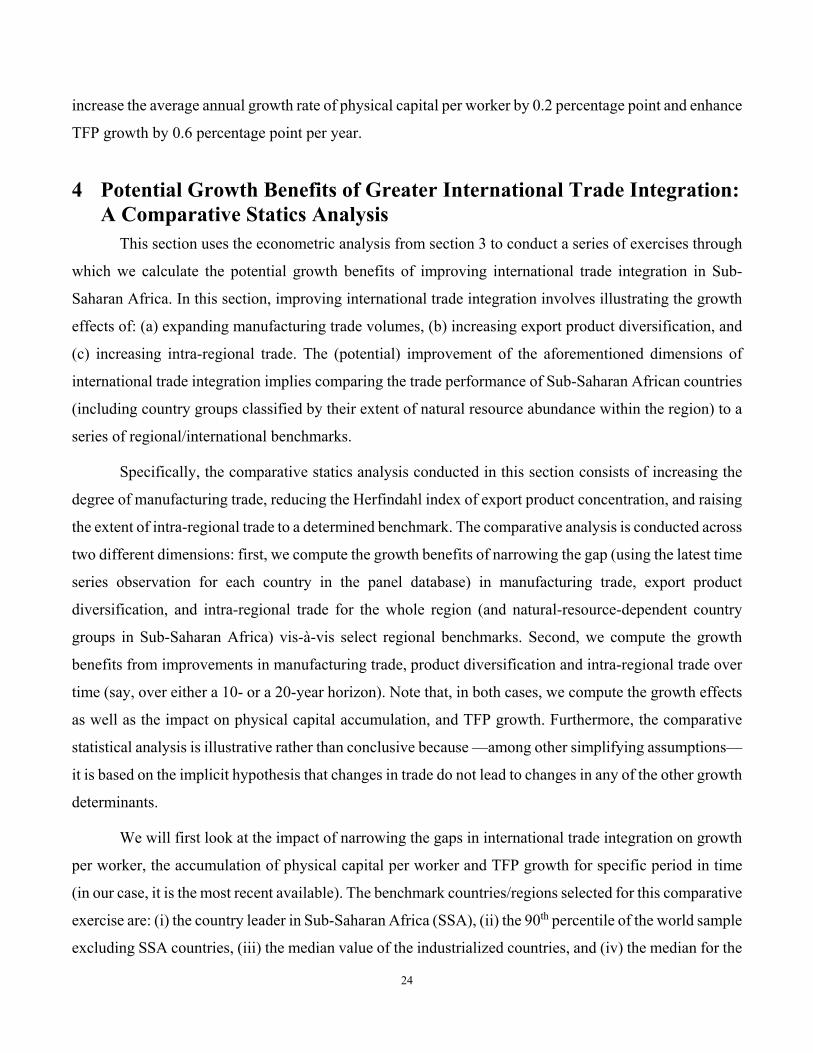
Table 8 reports the potential benefits on economic growth, physical capital accumulation, and TFP
growth of increasing manufacturing trade in SSA (including the different Sub-Saharan Africa country
groups by natural resource abundance) and narrowing the gap relative to other benchmarks. Panel A of
Table 8 reports the potential economic growth benefits of closing the gap in terms of manufacturing trade
using the coefficient estimates in column [4] of Table 5 (0.067 for manufacturing trade). Our calculations
reveal that growth per worker in Sub-Saharan Africa would accelerate by 3.85 percentage points per year
if the region were to closet its gap in manufacturing trade volumes relative to the SSA leader. Note that
the estimated gap for the region as a whole differs from the potential gains across country groups classified
according to their degree of natural resource abundance. For instance, in SSA, the largest potential growth
benefits of rising trade volumes are likely to be accrued by non-resource abundant SSA countries (3.87
percentage points per year) while the smallest growth benefits are attained by resource abundant SSA
countries in the region (3.72 percentage points per year).
Table 8. Comparative Statistics, Manufacturing Trade (2010 – 2014)
Region Leader
World excl. SSA (90th percentile)
Industrial countries (median)
East Asia & the Pacific (median)
Panel A. Growth 0.067
SSA 3.85% 4.17% 0.76% 0.63%
Resource Rich 3.72% 4.03% 0.63% 0.50%
Non-Resource Rich 3.87% 4.19% 0.79% 0.66% Panel B. Capital SSA 3.51% 3.79% 0.70% 0.58%
0.061 Resource Rich 3.39% 3.67% 0.57% 0.46%
Non-Resource Rich 3.53% 3.81% 0.71% 0.60% Panel C.
TFP SSA 2.13% 2.30% 0.42% 0.35%
0.037 Resource Rich 2.05% 2.23% 0.35% 0.28%
Non-Resource Rich 2.14% 2.31% 0.43% 0.36%
NOTE: The estimations are calculated based on the results from regressions in Table 5 Columns [4] [5] and [6].
Similarly, we look at the channels of transmission of closing the gap in manufacturing trade by
assessing their benefit in terms of (potential) growth of physical capital per worker and total factor
26
productivity (TFP) growth. Panel B in Table 8 shows the sensitivity of physical capital accumulation to
manufacturing trade (0.061 as reported in column [5] of Table 5) and the Panel C reports the sensitivity
of TFP (0.037 as in column [6] of Table 5). In all cases, the largest gains in physical capital accumulation
and TFP growth from closing the trade openness gap vis-à-vis the corresponding region leader would be
attained by the non-resource rich countries in SSA (3.53 and 2.14 percentage points per year). Finally, the
potential gains in capital accumulation and TFP growth for the region as a whole vis-à-vis the region
leader for SSA amount to 3.51 and 2.13 percentage points per year.5
Next, we analyze the likely benefits of SSA (and the corresponding sub-groups of resource
dependence) in narrowing the gaps in manufacturing trade integration relative to the median of the
industrialized countries. For instance, narrowing the manufacturing trade gap of SSA relative to the
industrialized countries median would improve economic growth by 0.76 percentage points, capital
accumulation by 0.70 percentage points, and TFP by 0.42 percentage points. Resource rich countries in
the SSA region reap the smallest growth benefits in all three variables: growth, capital and TFP. The non-
resource rich countries would have greater than average (potential) benefits in terms of growth (0.63
percentage points), capital accumulation (0.57 percentage points), and TFP growth (0.35 percentage
points).
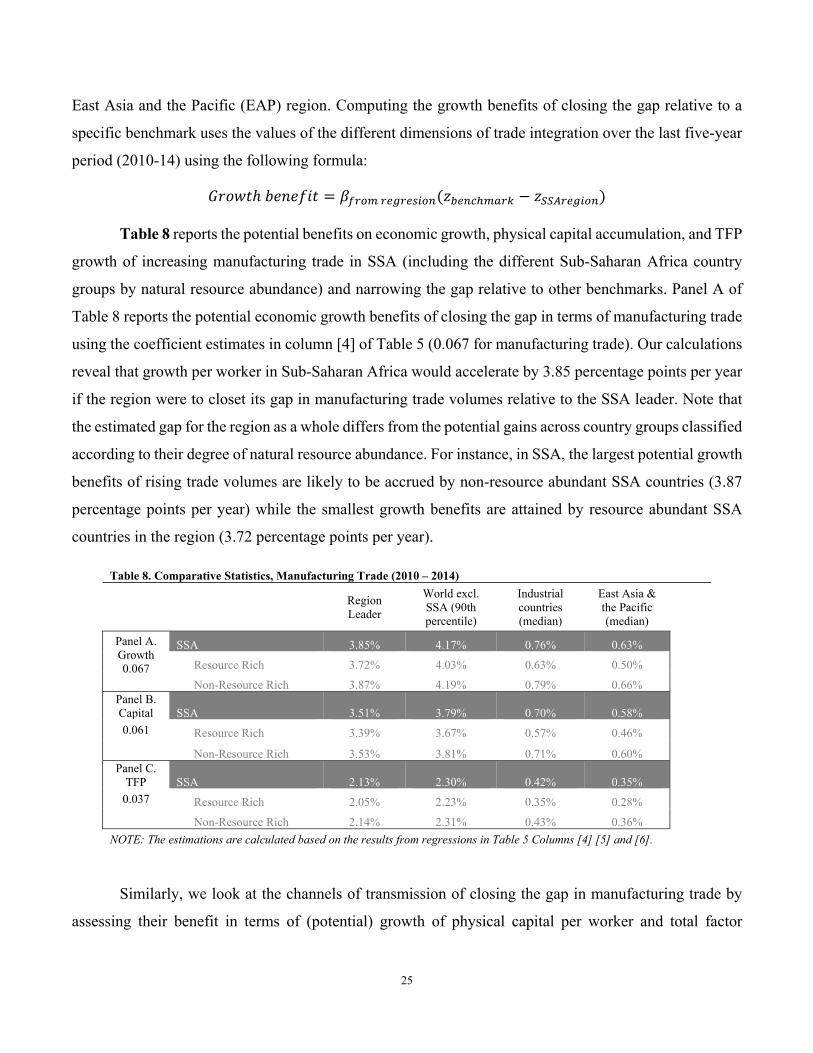
Table 9 reports the (potential) gains of closing the gap of diversifying the export product basket
in terms of growth, physical capital, and TPF compared to benchmark countries/regions (holding constant
all other international trade integration dimensions). The coefficient estimates of product market
concentration from the growth, physical capital accumulation and TFP growth are taken from the columns
[4] [5] and [6] of Table 7 (or -0.023, -0.02, and -0.01, respectively). As expected, these coefficient
estimates are negative —as lower concentration signals greater diversification. The higher the number,
the more concentrated the products are. In this sense, if SSA were to close its gap in terms of export
product market concentration to the regional lead (i.e. if its basket of products were to become more
diverse), growth of output per worker would increase by 0.40 percentage point per year. In addition, their
physical capital would expand by 0.35 percentage point annually and TFP growth would accelerate by
0.18 percentage point. The sub-group that would attain the highest growth benefit from reaching the
5 Note that closing the gap in international trade integration relative to the 90th percentile of the world (excluding SSA) would render higher potential benefits in terms of growth, capital accumulation and TFP growth than by closing the gap with respect to the SSA leader. For the sake of space, the rest of the results (those for the industrial countries’ median and the East Asia and Pacific median) are reported in Table 8, but they are not discussed in the document.
27
regional leader’s figures would be the resource rich countries (that is, countries that are abundant in metals
and minerals). This group is probably the most laggard in terms of export product diversification.
Specifically, if these countries were to diversify their export product basket more, their growth rate per
worker would increase by 1.18 percentage points. In terms of physical capital accumulation, the average
annual gains would be 1.02 percentage points while TFP growth accelerates by 0.51 percentage point
annually. Finally, note that non-resource rich countries attain the lowest potential growth benefits (0.30
percentage point per year) from narrowing the gap in terms of export product diversification. The gains in
physical capital accumulation and TFP growth are about 0.26 and 0.13 percent per year.
Table 9. Comparative Statistics, Product concentration (2010 -2014)
Region Leader
World excl. SSA (10th percentile)
Industrial countries (median)
East Asia & the Pacific
(median)
Panel A. Growth SSA 0.40% 0.42% 0.38% 0.07%
-0.023 Resource Rich 1.18% 1.19% 1.16% 0.85%
Non-Resource Rich 0.30% 0.31% 0.28% -0.04% Panel B. Capital SSA 0.35% 0.36% 0.33% 0.06%
-0.02 Resource Rich 1.02% 1.04% 1.01% 0.74%
Non-Resource Rich 0.26% 0.27% 0.24% -0.03% Panel C.
TFP SSA 0.18% 0.18% 0.17% 0.03%
-0.01 Resource Rich 0.51% 0.52% 0.50% 0.37%
Non-Resource Rich 0.13% 0.14% 0.12% -0.02% NOTE: The estimations are calculated based on the results from regressions in Table 7 Columns [4] [5] and [6]. These coefficients are expressed in negative numbers are higher figures would mean more concentration and less would mean more diversity.
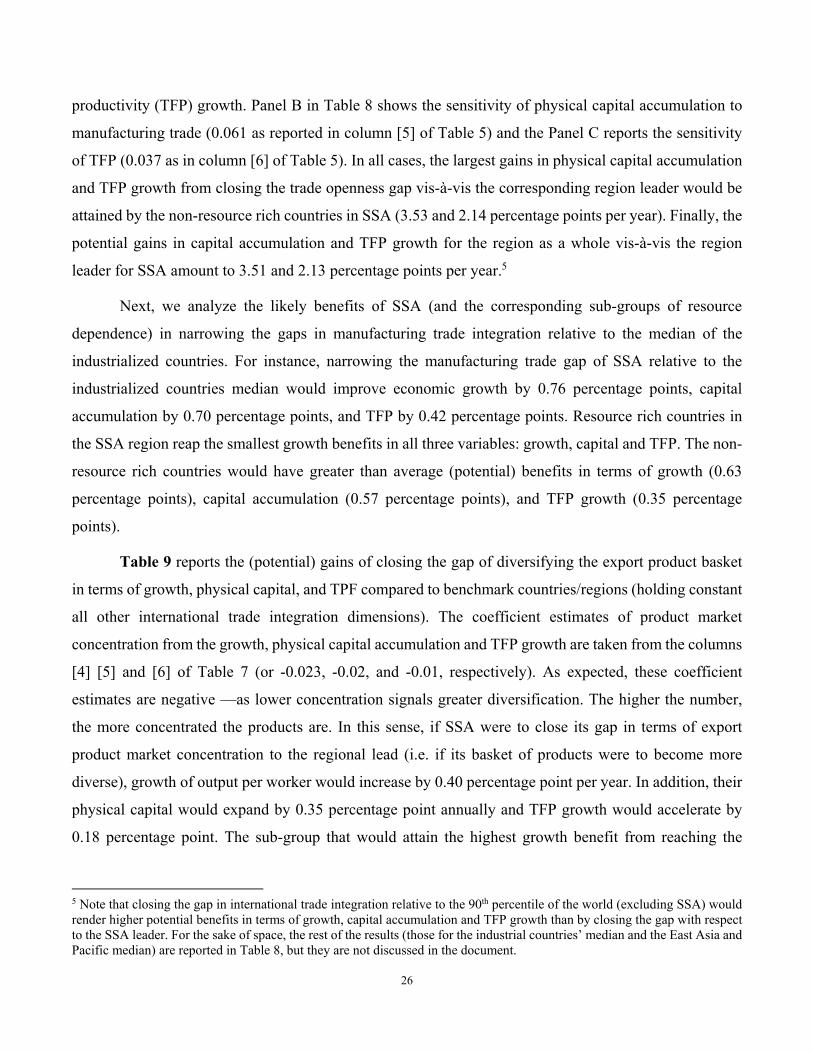
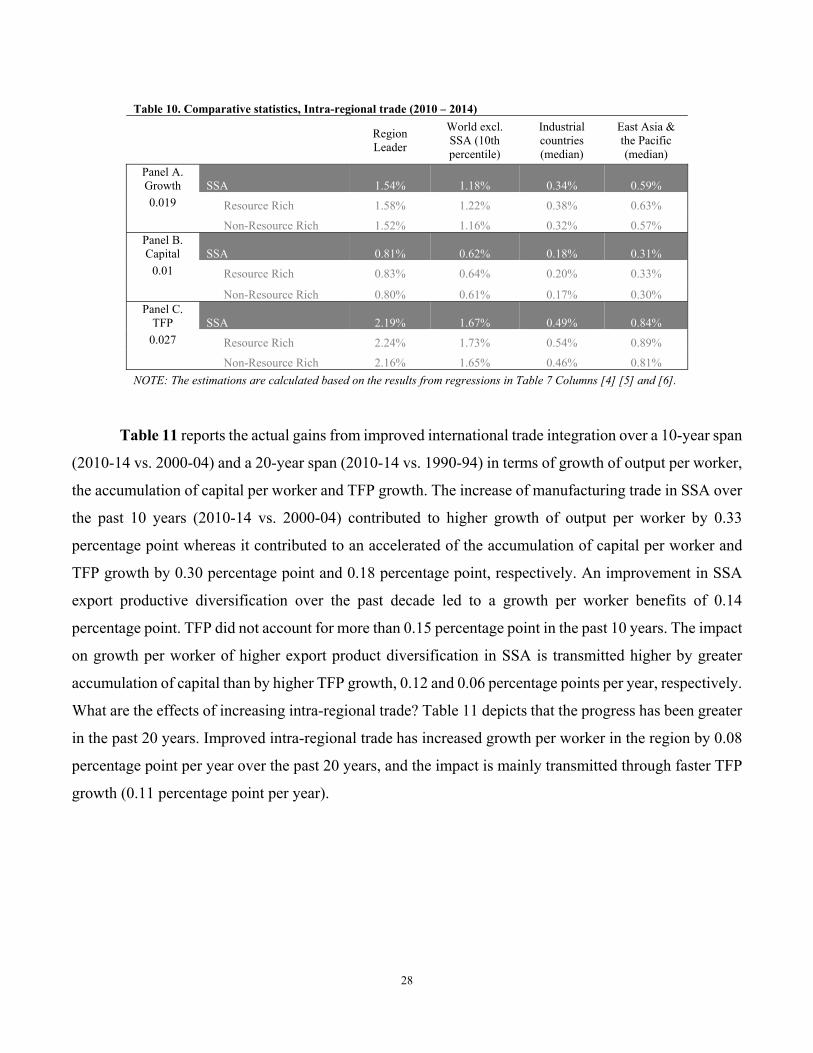
Additionally, Table 10 presents the potential increase in economic growth, physical capital growth
and TFP growth if the gap in intra-regional trade was to close relative to the four benchmarks mentioned
earlier. If SSA were to match the regional leader’s intra-regional trade in their overall export basket,
growth would accelerate 1.54 percentage points, capital accumulation would be enhanced by 0.81
percentage points and TFP growth would rise by 2.19 percentage points. If we look at the potential gains
(including the sub-groups) relative to the regional leader, the resource rich countries would benefit the
most from closing the gap with the benchmarks in terms of growth, capital accumulation, and TFP growth.
28
Table 10. Comparative statistics, Intra-regional trade (2010 – 2014)
Region Leader
World excl. SSA (10th percentile)
Industrial countries (median)
East Asia & the Pacific (median)
Panel A. Growth SSA 1.54% 1.18% 0.34% 0.59%
0.019 Resource Rich 1.58% 1.22% 0.38% 0.63%
Non-Resource Rich 1.52% 1.16% 0.32% 0.57% Panel B. Capital SSA 0.81% 0.62% 0.18% 0.31%
0.01 Resource Rich 0.83% 0.64% 0.20% 0.33%
Non-Resource Rich 0.80% 0.61% 0.17% 0.30% Panel C.
TFP SSA 2.19% 1.67% 0.49% 0.84%
0.027 Resource Rich 2.24% 1.73% 0.54% 0.89%
Non-Resource Rich 2.16% 1.65% 0.46% 0.81%
NOTE: The estimations are calculated based on the results from regressions in Table 7 Columns [4] [5] and [6].
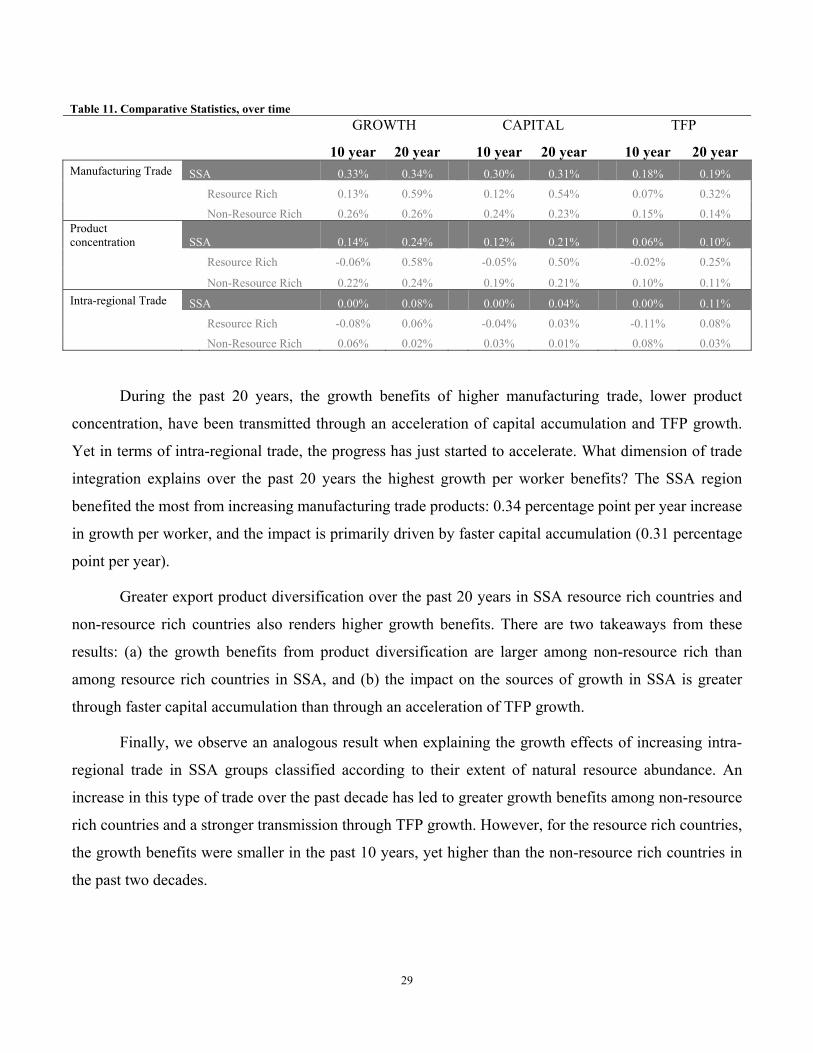
Table 11 reports the actual gains from improved international trade integration over a 10-year span
(2010-14 vs. 2000-04) and a 20-year span (2010-14 vs. 1990-94) in terms of growth of output per worker,
the accumulation of capital per worker and TFP growth. The increase of manufacturing trade in SSA over
the past 10 years (2010-14 vs. 2000-04) contributed to higher growth of output per worker by 0.33
percentage point whereas it contributed to an accelerated of the accumulation of capital per worker and
TFP growth by 0.30 percentage point and 0.18 percentage point, respectively. An improvement in SSA
export productive diversification over the past decade led to a growth per worker benefits of 0.14
percentage point. TFP did not account for more than 0.15 percentage point in the past 10 years. The impact
on growth per worker of higher export product diversification in SSA is transmitted higher by greater
accumulation of capital than by higher TFP growth, 0.12 and 0.06 percentage points per year, respectively.
What are the effects of increasing intra-regional trade? Table 11 depicts that the progress has been greater
in the past 20 years. Improved intra-regional trade has increased growth per worker in the region by 0.08
percentage point per year over the past 20 years, and the impact is mainly transmitted through faster TFP
growth (0.11 percentage point per year).
29
Table 11. Comparative Statistics, over time GROWTH CAPITAL TFP
10 year 20 year 10 year 20 year 10 year 20 year Manufacturing Trade SSA 0.33% 0.34% 0.30% 0.31% 0.18% 0.19%
Resource Rich 0.13% 0.59% 0.12% 0.54% 0.07% 0.32%
Non-Resource Rich 0.26% 0.26% 0.24% 0.23% 0.15% 0.14% Product concentration SSA 0.14% 0.24% 0.12% 0.21% 0.06% 0.10%
Resource Rich -0.06% 0.58% -0.05% 0.50% -0.02% 0.25%
Non-Resource Rich 0.22% 0.24% 0.19% 0.21% 0.10% 0.11%
Intra-regional Trade SSA 0.00% 0.08% 0.00% 0.04% 0.00% 0.11%
Resource Rich -0.08% 0.06% -0.04% 0.03% -0.11% 0.08%
Non-Resource Rich 0.06% 0.02% 0.03% 0.01% 0.08% 0.03%
During the past 20 years, the growth benefits of higher manufacturing trade, lower product
concentration, have been transmitted through an acceleration of capital accumulation and TFP growth.
Yet in terms of intra-regional trade, the progress has just started to accelerate. What dimension of trade
integration explains over the past 20 years the highest growth per worker benefits? The SSA region
benefited the most from increasing manufacturing trade products: 0.34 percentage point per year increase
in growth per worker, and the impact is primarily driven by faster capital accumulation (0.31 percentage
point per year).
Greater export product diversification over the past 20 years in SSA resource rich countries and
non-resource rich countries also renders higher growth benefits. There are two takeaways from these
results: (a) the growth benefits from product diversification are larger among non-resource rich than
among resource rich countries in SSA, and (b) the impact on the sources of growth in SSA is greater
through faster capital accumulation than through an acceleration of TFP growth.
Finally, we observe an analogous result when explaining the growth effects of increasing intra-
regional trade in SSA groups classified according to their extent of natural resource abundance. An
increase in this type of trade over the past decade has led to greater growth benefits among non-resource
rich countries and a stronger transmission through TFP growth. However, for the resource rich countries,
the growth benefits were smaller in the past 10 years, yet higher than the non-resource rich countries in
the past two decades.
30
5 Policy Discussion
The econometric analysis and comparative statics exercises conducted in sections 3 and 4 reveal
important messages on the relationship between trade integration and long-term growth: first, there is
evidence of a causal relationship from trade openness (i.e. export and import volumes) to long-term
growth. This relationship is robust to the inclusion of variables that measure diversified export baskets
distinct patterns of geographical trade. Second, export product diversification has a robust positive
relationship with long-term growth, and its impact is transmitted through both faster capital accumulation
and total factor productivity growth. Additionally, diversifying away from primary goods and towards
higher-value added products (e.g. manufactured goods) renders higher growth returns in the long run.6
Third, intra-regional trade has a positive and causal impact on growth per worker. The sensitivity of
growth to intra-regional trade is lower than that of inter-regional trade. However, the former is an
additional engine of growth with the potential to bring about economies of scale and scope to enhance its
estimated impact on growth. The effect is mainly transmitted through faster TFP growth. Market
expansion within the region is key to ignite other drivers of growth such as the entry of FDI, and the
development and/or deepening of regional value chains. Overall, it matters for long-term growth how
much you trade, what you trade and to whom you trade.
The empirical analysis conducted in this paper provides the basis for the discussion of three broad
policy actions for Sub-Saharan Africa. First, the diversification of the export basket away from primary
goods and towards higher value-added goods. In doing so, the economy will increase its resilience towards
volatile fluctuations in commodity prices. Second, the build-up of stronger links with emerging trade
partners that play a big role in global markets —e.g. China and India. This implies that Sub-Saharan Africa
will have a more ample group of trading partners that may help —to some extent— smoothen adverse
(international) shocks. Finally, polices should be implemented to increase intra-regional trade not only to
reduce volatility from external shocks but to also exploit economies of scale and benefit from a larger and
unified regional market. This section discusses the rationale behind these three policy options.
6 This finding is related to the negative relationship between primary goods and growth as opposed to the positive relationship between manufacturing goods and growth. Specifically, the price of primary commodities declines relative to the price of manufactured goods over the long-run causing deterioration of those economies which are predominately primary-based goods, such as those in SSA.
31
5.1 Export product diversification
Export diversification is at the top of the agenda of policy makers in the region. Designing policies
to reduce the export product concentration of countries in Africa —especially those countries that are
abundant in natural resources— is not a trivial issue. There are several drivers that policy makers may
take into consideration such as trade, market access, trade costs, FDI, human capital, public investment,
exchange rate volatility, terms of trade, financial development, infrastructure, quality of institutions, and
resource wealth, among others.
Assessing the main drivers of export diversification is beyond the scope of this paper. However,
empirical evidence suggests that export diversification can deliver successful outcomes for developing
countries. For instance, firms in Malawi, Mali, Senegal and Tanzania that continue operating beyond the
first year of business are those that diversify in terms of products and markets (Cadot et al. 2011). Tanzania
stands out as an example of export diversification and greater output. Since the late 1990s, mining,
manufacturing, construction and services experienced sustained growth while the production and exports
of traditional cash crops (e.g. cotton, coffee, tea, sisal, cashew nuts, and tobacco) declined. The broader
selection of higher-value added goods came along with changes in the export market shares. For instance,
the share of exports to the euro zone diminished while intra-regional trade —particularly within the East
African Community— increased (Papageorgiou and Spatafora 2012).
Rwanda is another example of trade diversification in Sub-Saharan Africa. The government
introduced a series of changes to the trade framework from 2000 to 2016; for instance, policies to mitigate
the effects of swings of international commodity prices —including quality upgrading of traditional
exports (e.g. coffee) and measures to diversify trade destinations. As a result, the share of traditional
exports (i.e. tea, coffee and minerals) in total exports decreased from 41 to 25 percent, and yet their overall
export value more than tripled —it increased from US$ 415 million to US$ 4,125 million (World Bank
2019a).
5.2 Emerging inter-regional partners and rising intra-regional trade
Policies to promote trade integration in Sub-Saharan Africa can help increase overall economic
activity and total factor productivity. Figure 2 plots Sub-Saharan Africa’s average export and import
shares over the period 1990-2018 within the region and with trading partners outside the region such as
China, India, and the United States + euro area. Three facts emerge from this figure: first, China and India
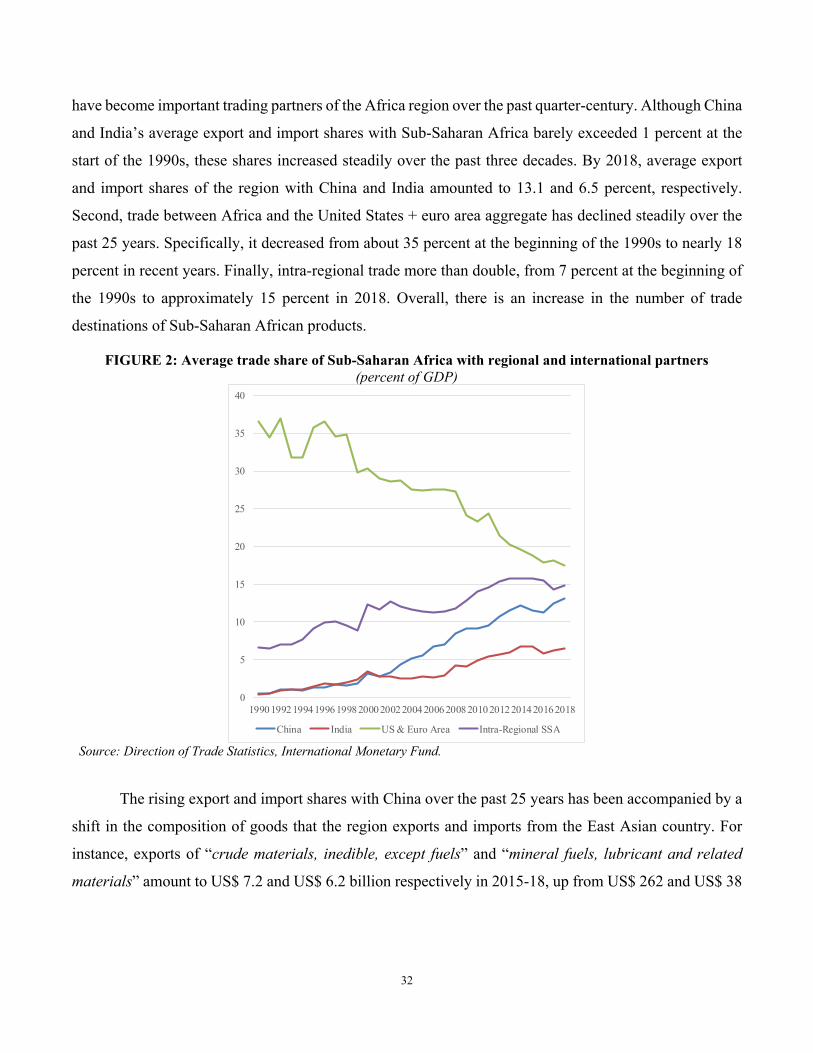
32
have become important trading partners of the Africa region over the past quarter-century. Although China
and India’s average export and import shares with Sub-Saharan Africa barely exceeded 1 percent at the
start of the 1990s, these shares increased steadily over the past three decades. By 2018, average export
and import shares of the region with China and India amounted to 13.1 and 6.5 percent, respectively.
Second, trade between Africa and the United States + euro area aggregate has declined steadily over the
past 25 years. Specifically, it decreased from about 35 percent at the beginning of the 1990s to nearly 18
percent in recent years. Finally, intra-regional trade more than double, from 7 percent at the beginning of
the 1990s to approximately 15 percent in 2018. Overall, there is an increase in the number of trade
destinations of Sub-Saharan African products.
FIGURE 2: Average trade share of Sub-Saharan Africa with regional and international partners (percent of GDP)
Source: Direction of Trade Statistics, International Monetary Fund.
The rising export and import shares with China over the past 25 years has been accompanied by a
shift in the composition of goods that the region exports and imports from the East Asian country. For
instance, exports of “crude materials, inedible, except fuels” and “mineral fuels, lubricant and related
materials” amount to US$ 7.2 and US$ 6.2 billion respectively in 2015-18, up from US$ 262 and US$ 38
0
5
10
15
20
25
30
35
40
1990 1992 1994 1996 1998 2000 2002 2004 2006 2008 2010 2012 2014 2016 2018
China India US & Euro Area Intra-Regional SSA
33
million in 1995-98 respectively.7 On the other hand, the two main groups of products imported from China
to Sub-Saharan Africa during 2015-18 were “machinery and transport equipment” and “manufactured
goods classified by material”. Each group represented US$ 18.7 and US$ 9 billion in 2015-18, respectively
—a sharp increase from US$ 433 and US$ 416 million in 1995-98, respectively.
5.3 Is there greater scope for intra-regional trade?
Across the world, countries have increasingly engaged in regional trade agreements (RTAs). For
instance, the number of RTAs in force worldwide has increased from 50 in 1990 to 280 in 270. Currently,
the most notable examples around the world are the Trans-Pacific Partnership (TPP), the Transatlantic
Trade and Investment Partnership (T-TIP), the Regional Comprehensive Economic Partnership (RCEP)
in Asia, the Pacific Alliance in Latin America, and the Tripartite Free Trade Agreement in Africa.8
These agreements have also become more complex in nature. Regional trade negotiations go beyond
tariffs and include policies that boost trade and investment in goods and services such as competition
policies, government procurement rules, and intellectual property rights. These more complex agreements
—also known as deep agreements— are found to boost trade, foreign investment, and global value chain
participation (more than less complex trade agreements). On average, deep trade agreements increase
goods trade by more than 35 percent, services trade by more than 15 percent, and GVC integration by
more than 10 percent (Mattoo et al. 2017, Osnago et al. 2017, and Ruta 2017).
Negotiating and enacting regional trade agreements can help: (a) promote long-term growth by
enabling countries to exploit comparative advantage and economies of scale, and (b) accelerate the process
of structural transformation by facilitating the transmission of knowledge and technology and the
development of new products. In the case of Sub-Saharan Africa, a question that emerges is how trade
can be further increased within the region and exploit the scale of a larger and unified regional market to
create opportunities for economic transformation.
7 The export product categories are based on COMTRADE SITC Revision 1. 8 The Tripartite Free Trade Area (TFTA) was signed in 2015. It proposed a free trade agreement between the Common Market for Eastern and Southern Africa (COMESA), Southern African Development Community (SADC), and East African Community (EAC). Overall, it enabled the participation of trade between 27 African countries.
34
5.3.1 Patterns of intra-regional trade
Intra-regional trade in Africa grew by 8 percentage points of GDP since 1990 (see Figure 2).
However, the actual volume of trade across borders might be underestimated as it does not account for
informal (or unrecorded) trade in the region.9 The share (and size) of intra-regional trade in Sub-Saharan
Africa is significantly lower compared with other regions —especially with East Asia (See Figure 3). In
2017, intra-regional trade in Africa represented only 17 percent of total exports, an amount that is
considerably lower than that of Asia (59 percent) or Europe (69 percent). Additionally, one of the main
drivers of the gap in Africa’s intra-regional trade vis-à-vis Asia and Europe is the large share of intra-
regional trade of manufactured goods in the latter regions.10
The evolution of the patterns of intra- vs. inter-regional exports and imports in Sub-Saharan Africa
over the last decade is presented in Figure 4. Shifts in the extent of Sub-Saharan Africa’s trade openness
in the region are mainly driven by fluctuations in exports and imports outside the region. In turn, inter-
regional trade is vastly influenced by fluctuations in international commodity prices —where exports still
heavily rely on extractive industries (say, mineral ores, metals, and energy commodities). Intra-regional
exports and imports represent a small and fairly stable share of total exports and imports over time. The
low levels of intra-regional trade suggest significant barriers to trade across borders as well as the lack of
depth in regional value chains.
9 Recent estimates suggest that informal cross-border trading contributes about 30-40 percent of the overall intra-regional trade in the Southern Africa Development Community (SADC) and 40 percent in the Common Market for Eastern and Southern Africa (COMESA) (Nshimbi and Moyo 2017). 10 When exporting to manufactured markets with different income levels, Sub-Saharan African firms face a cost-quality trade-off. Quality tends to matter when exporting manufactured goods to markets with higher income level such as the United States and the euro area. Cost considerations seem to be more important when exporting to markets with lower income level (Easterly and Reshef 2016).
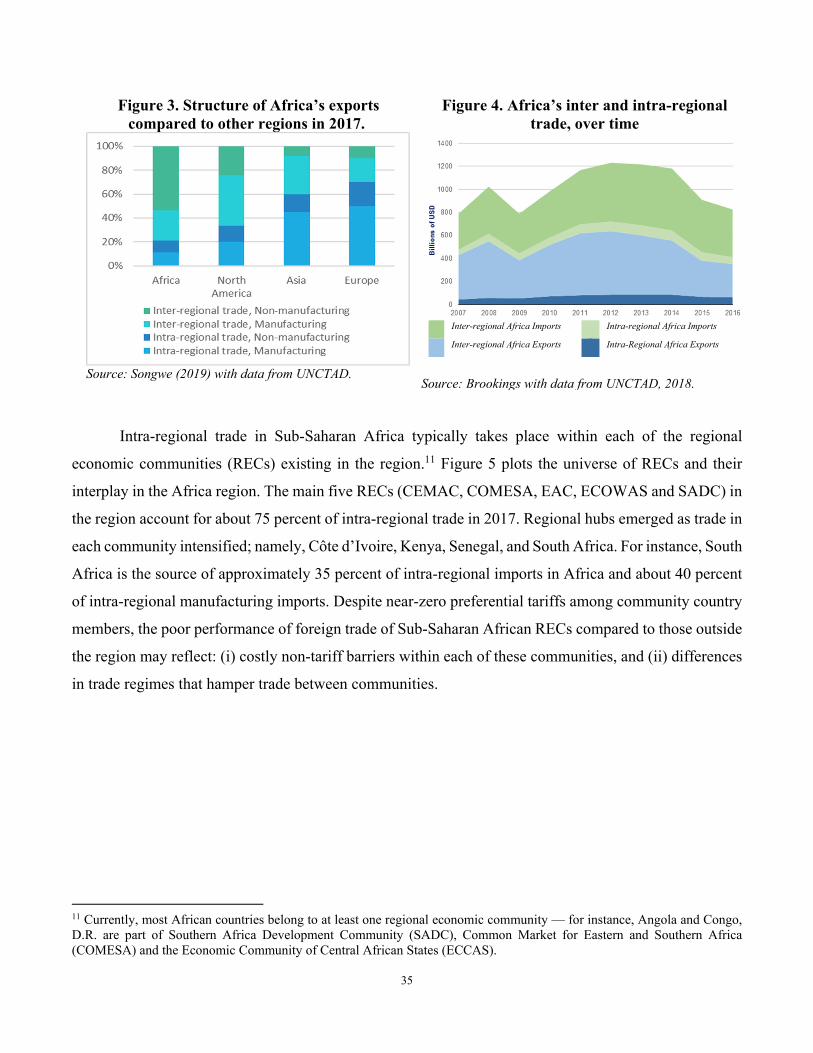
35
Figure 3. Structure of Africa’s exports compared to other regions in 2017.
Source: Songwe (2019) with data from UNCTAD.
Figure 4. Africa’s inter and intra-regional trade, over time
Inter-regional Africa Imports Intra-regional Africa Imports
Inter-regional Africa Exports Intra-Regional Africa Exports
Source: Brookings with data from UNCTAD, 2018.
Intra-regional trade in Sub-Saharan Africa typically takes place within each of the regional
economic communities (RECs) existing in the region.11 Figure 5 plots the universe of RECs and their
interplay in the Africa region. The main five RECs (CEMAC, COMESA, EAC, ECOWAS and SADC) in
the region account for about 75 percent of intra-regional trade in 2017. Regional hubs emerged as trade in
each community intensified; namely, Côte d’Ivoire, Kenya, Senegal, and South Africa. For instance, South
Africa is the source of approximately 35 percent of intra-regional imports in Africa and about 40 percent
of intra-regional manufacturing imports. Despite near-zero preferential tariffs among community country
members, the poor performance of foreign trade of Sub-Saharan African RECs compared to those outside
the region may reflect: (i) costly non-tariff barriers within each of these communities, and (ii) differences
in trade regimes that hamper trade between communities.
11 Currently, most African countries belong to at least one regional economic community — for instance, Angola and Congo, D.R. are part of Southern Africa Development Community (SADC), Common Market for Eastern and Southern Africa (COMESA) and the Economic Community of Central African States (ECCAS).
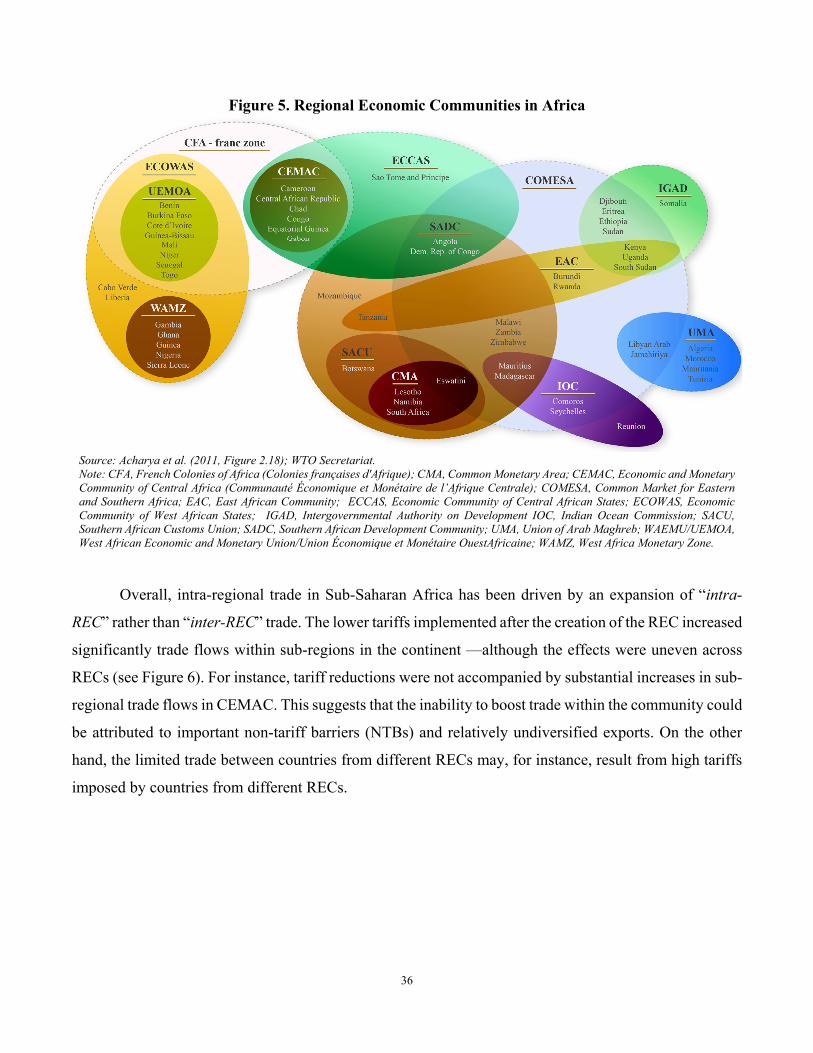
36
Figure 5. Regional Economic Communities in Africa
Source: Acharya et al. (2011, Figure 2.18); WTO Secretariat. Note: CFA, French Colonies of Africa (Colonies françaises d'Afrique); CMA, Common Monetary Area; CEMAC, Economic and Monetary Community of Central Africa (Communauté Économique et Monétaire de l’Afrique Centrale); COMESA, Common Market for Eastern and Southern Africa; EAC, East African Community; ECCAS, Economic Community of Central African States; ECOWAS, Economic Community of West African States; IGAD, Intergovernmental Authority on Development IOC, Indian Ocean Commission; SACU, Southern African Customs Union; SADC, Southern African Development Community; UMA, Union of Arab Maghreb; WAEMU/UEMOA, West African Economic and Monetary Union/Union Économique et Monétaire OuestAfricaine; WAMZ, West Africa Monetary Zone.
Overall, intra-regional trade in Sub-Saharan Africa has been driven by an expansion of “intra-
REC” rather than “inter-REC” trade. The lower tariffs implemented after the creation of the REC increased
significantly trade flows within sub-regions in the continent —although the effects were uneven across
RECs (see Figure 6). For instance, tariff reductions were not accompanied by substantial increases in sub-
regional trade flows in CEMAC. This suggests that the inability to boost trade within the community could
be attributed to important non-tariff barriers (NTBs) and relatively undiversified exports. On the other
hand, the limited trade between countries from different RECs may, for instance, result from high tariffs
imposed by countries from different RECs.
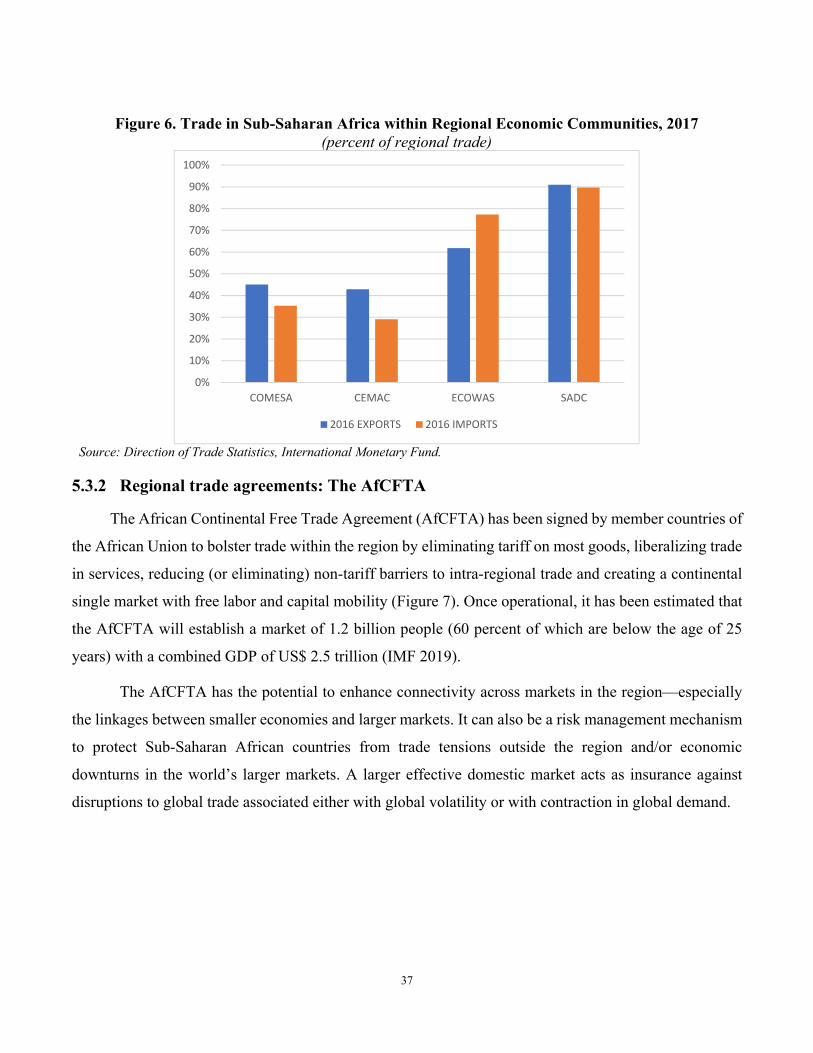
37
Figure 6. Trade in Sub-Saharan Africa within Regional Economic Communities, 2017
(percent of regional trade)
Source: Direction of Trade Statistics, International Monetary Fund.
5.3.2 Regional trade agreements: The AfCFTA
The African Continental Free Trade Agreement (AfCFTA) has been signed by member countries of
the African Union to bolster trade within the region by eliminating tariff on most goods, liberalizing trade
in services, reducing (or eliminating) non-tariff barriers to intra-regional trade and creating a continental
single market with free labor and capital mobility (Figure 7). Once operational, it has been estimated that
the AfCFTA will establish a market of 1.2 billion people (60 percent of which are below the age of 25
years) with a combined GDP of US$ 2.5 trillion (IMF 2019).
The AfCFTA has the potential to enhance connectivity across markets in the region—especially
the linkages between smaller economies and larger markets. It can also be a risk management mechanism
to protect Sub-Saharan African countries from trade tensions outside the region and/or economic
downturns in the world’s larger markets. A larger effective domestic market acts as insurance against
disruptions to global trade associated either with global volatility or with contraction in global demand.
0%
10%
20%
30%
40%
50%
60%
70%
80%
90%
100%
COMESA CEMAC ECOWAS SADC
2016 EXPORTS 2016 IMPORTS
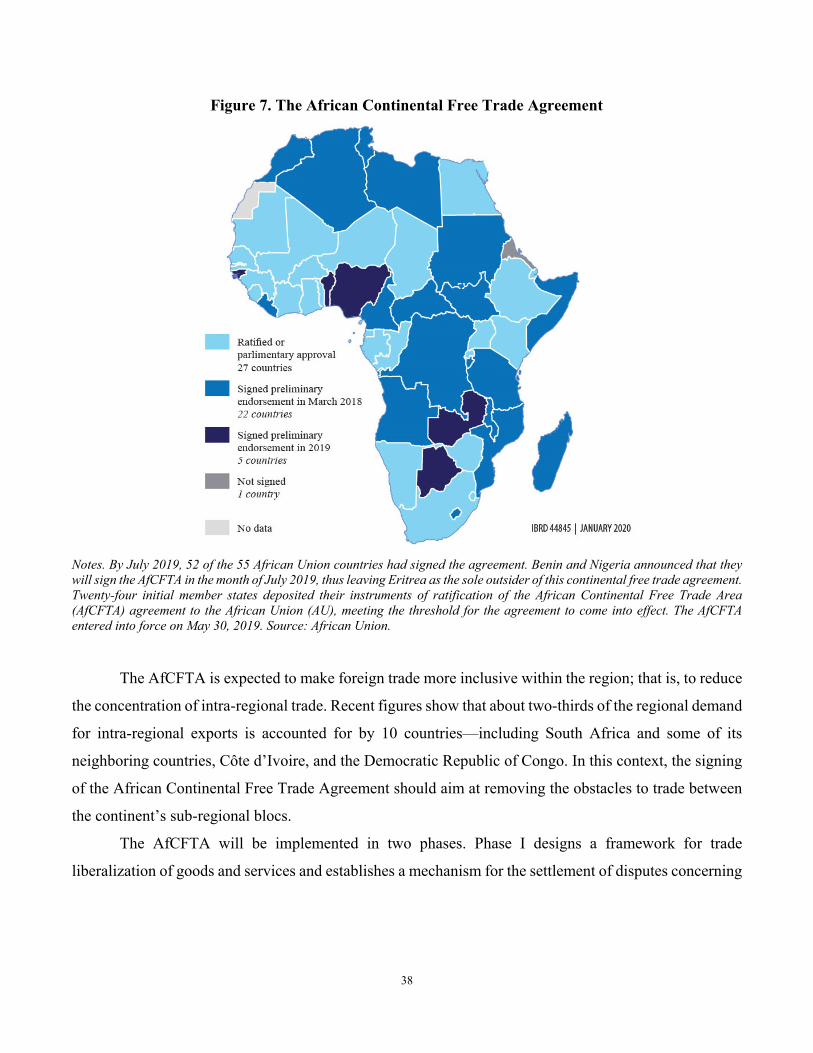
38
Figure 7. The African Continental Free Trade Agreement
Notes. By July 2019, 52 of the 55 African Union countries had signed the agreement. Benin and Nigeria announced that they will sign the AfCFTA in the month of July 2019, thus leaving Eritrea as the sole outsider of this continental free trade agreement. Twenty-four initial member states deposited their instruments of ratification of the African Continental Free Trade Area (AfCFTA) agreement to the African Union (AU), meeting the threshold for the agreement to come into effect. The AfCFTA entered into force on May 30, 2019. Source: African Union.
The AfCFTA is expected to make foreign trade more inclusive within the region; that is, to reduce
the concentration of intra-regional trade. Recent figures show that about two-thirds of the regional demand
for intra-regional exports is accounted for by 10 countries—including South Africa and some of its
neighboring countries, Côte d’Ivoire, and the Democratic Republic of Congo. In this context, the signing
of the African Continental Free Trade Agreement should aim at removing the obstacles to trade between
the continent’s sub-regional blocs.
The AfCFTA will be implemented in two phases. Phase I designs a framework for trade
liberalization of goods and services and establishes a mechanism for the settlement of disputes concerning
39
members’ rights and obligations.12 It will also address the issue of non-tariff barriers (NTBs), a major
obstacle to trade in Africa.13 Recent evidence suggests that trade logistics constitute the most important
non-tariff factor in explaining trade linkages among countries, followed by infrastructure, access to credit
and the business environment (IMF 2019). The liberalization of trade in services proposes a request-and-
offer approach by member countries based on seven priority sectors: logistics and transport, financial
services, tourism, professional services, energy services, construction, and communications. Finally,
Phase II will address issues of competition policy, investment, and intellectual property rights.14
The African continent lacks an economy that plays the role of a continent-wide trading hub. Except
for South Africa, which operates as a trading hub for Southern Africa, the continent does not have a
systemic global exporter that imports value added within Africa. This feature, along with the high NTBs,
limit the creation or deepening of regional value chains. The implementation of trade facilitation measures
and enhanced border management could curtail costs within Africa and shorten the distance to global
hubs. The AfCTA should address then the obstacles that deter the formation of regional value chains and,
thus help insert African economies into global supply and value chains. Despite increasing outsource
production to a wider array of countries, a large proportion of the value-added distribution in global value
chains remains within regional blocs. This is attributed to lower transit costs and shorter supply chains
related to the distance from suppliers (sourcing) or targeted export markets (Fofack 2018).
Recent research evaluates the welfare effects of reductions in tariffs and non-tariff barriers as well
as the implementation of trade facilitation measures in Sub-Saharan Africa (World Bank 2019b). Welfare
gains are larger when policies address NTBs and trade facilitation measures rather than tariffs. For
12 On the liberalization of trade in goods, Phase I determines the path to eliminate tariffs on 90 percent of product categories. Countries can prolong the period to implement tariff reductions in the case of sensitive goods or maintain existing tariffs among the 10% of excluded products. Additionally, the new protocol on trade in goods includes institutional structures for the categorization, reporting, monitoring and gradual elimination of non-tariff barriers (NTBs), rules of origin, customs operation, technical barriers to trade, sanitary and phytosanitary measures, and transit and trade remedies. 13 The most common non-tariff barriers to trade include quotas, licenses, dissimilar rules of origin, technical barriers to trade (e.g. labeling requirements, standards on technical specification and quality standards, measures to protect the environment, and procedures for certification, testing and inspection, among others), sanitary and phytosanitary barriers to trade (rules for food safety and animal and plant health standards), infrastructure gaps in quantity, quality and access (high ground transportation costs, low quality of ports, air transportation, and poor infrastructure efficiency), and other trade-related transaction costs (say, time and cost to start a new business, lack of access to trade financing or getting bank credit to start/expand firms). Some regional initiatives have been launched in recent years to address infrastructure gaps —for instance, the Presidential Infrastructure Champion Initiative (PICI), the Program for Infrastructure Development in Africa (PIDA), the Dakar Financing Summit (DFS) for Africa’s Infrastructure, and the Continental Business Network on Infrastructure Financing. However, they will take time to narrow the existing infrastructure network and quality gaps. 14 The AfCFTA is complemented by other continental initiatives, including the Protocol on Free Movement of Persons, Right to Residence and Right to Establishment, and the Single African Air Transport Market (SAATM).
40
instance, reduced tariffs will yield welfare gains of 0.2 percent for AfCFTA country members. Cutting
NTBs in half would increase welfare gains by 1.6 percent while the full implementation of the WTO’s
Trade Facilitation agreement would lead to overall welfare gains of 5 percent by 2035 (World Bank
2019b).15
6 Conclusions The goal of this paper is to provide evidence on the nature of the relationship between international
trade integration for Sub-Saharan Africa in a comprehensive and systematic manner. Unlike previous
research in this strand of the literature, this paper first examines the impact of trade integration on growth
as well as on the sources of growth —that is, physical capital accumulation and TFP growth. Second, it
evaluates the impact on growth (and its sources) of the different dimensions of trade integration (trade
volume, trade diversification, and natural resource dependence). This implies that the nature of the trade-
growth relationship depends not only on how much you trade but also on what you export and to whom
you export (or have trade with). Third, it examines the impact of growth of the composition of trade
volumes by product (primary goods vs. manufacturing goods) and the composition of trade volumes by
destination (inter- vs. intra-regional trade).
We have collected a comprehensive data set on international trade integration indicators, growth
per worker, capital accumulation, and TFP growth for 174 countries across the world, including 45 Sub-
Saharan African countries, from 1970 to 2014. The relationship between international trade integration
and growth is estimated using the GMM-IV system estimator (Arellano and Bover 1995, Blundell and
Bond 1998). This estimation method accounts for unobserved country and time fixed effects as well as
the likely endogeneity (or reverse causality) of explanatory variables, thus providing evidence of a causal
relationship between trade integration and growth. The GMM-IV estimation is also corrected for the likely
downward-biased estimation of the asymptotic standard errors of the two-step GMM estimator in small
samples (Windmeijer 2005) and the overfitting of endogenous variables due to the existence of too many
instruments (Roodman 2009).
The econometric analysis finds a causal relationship from (the different dimensions of) trade
integration to growth (including the sources of growth). The amount of trade is not the only dimension
15 The estimated aggregate welfare gains mass the cross-country heterogeneity in the impact of the AfCFTA. Welfare gains by 2035 are estimated to range from 0.4 percent (Mozambique) to 19 percent (Togo). In this context, the welfare effects of the AfCFTA depend on the depth and extent to which the policy changes cover non-trade barriers and services (especially in transport and logistics) and on the structure of the export basket and the economy.
41
that matters for long-term growth. It also matters what (type of goods) you export and to whom you export.
The evidence presented in this paper can be summarized by the following findings:
1. Higher trade volumes, greater export product diversification and lower natural resource export
dependence help promote economic growth. The effects of international trade integration are
transmitted significantly through faster accumulation of capital per worker and enhanced TFP
growth. The impact of greater trade volumes and lower natural resource dependence is primarily
driven by the TFP growth channel while that of export product diversification is transmitted mainly
through faster capital accumulation.
2. Our regression estimates suggest that the diffusion of technology, managerial know-how, and
competitive practices as well as enhanced allocative efficiency are likely channels through which
greater trade volumes influences growth. Reduced resource misallocation and greater productivity
of non-resource-based sectors will be the channels of transmission for lower natural resource
export dependence. Greater investment across sectors of economic activity will be the channel
through which export product diversification may affect growth.
3. We look at the impact on growth (and its sources) of trade volume by product (trade in primary
goods vis-à-vis trade in manufactured goods) and trade volume by destination (inter-regional vis-
à-vis intra-regional trade). In brief, we find that the composition of trade volume by either product
of destination —as distinguished in this paper— matters for long-term growth.
4. When looking at the product composition of trade volume, we find that manufacturing trade fosters
economic growth while trade in primary goods hinders it. The regression analysis suggests that
doubling the manufacturing trade share in GDP would increase economic growth by 1.9
percentage points per year while a similar increase in the primary goods trade share in GDP would
lower economic growth by 1 percentage point per year. The negative impact of trade in primary
goods is transmitted through both slower capital accumulation and sluggish TFP growth, although
the impact through decreased investments —especially, in non-resource-based sectors of economic
activity— appears to be larger.
5. The assessment of the impact of the composition of trade volume by destination shows that both
inter- and intra-regional trade have a positive, significant and causal impact on growth. Our
empirical analysis suggests that doubling the inter-regional trade share in GDP would increase
economic growth by 1.9 percentage points per year while a similar increase in the intra-regional
share in GDP enhances growth by 0.6 percentage point per year. Inter-regional trade affects growth
42
significantly through faster capital accumulation and enhanced TFP growth. Intra-regional trade,
on the other hand, influences growth mainly through the productivity channel. These findings
suggest that the diffusion of technology, managerial know-how, and competitive practices as well
as the operation of economies of scale and scope are the main channels of transmission of greater
intra-regional trade. An expanded African market can play a key role in triggering other drivers of
growth such as FDI entry, and the development or deepening of regional value chains.
Finally, trade policies that foster growth should highlight actions that accelerate export product
diversification, product diversification, and trade not only outside but also within the Africa region. Recent
evidence shows that when African countries trade with each other, they tend to exchange more
manufactured and processed goods, have more knowledge transfer and create more value added.
Manufactured goods represent a higher share of exports within the region than outside the region —42
and 15 percent in 2014, respectively (UNECA 2017). The test of the African Continental Free Trade
Agreement (AfCFTA) is whether the scheduled tariff reduction and dismantling of non-tariff barriers help
boost trade across the different regional economic communities (RECs) in Africa. The success of the
AfCFTA may require complementing trade policies with national policies that make the gains from trade
more inclusive —for instance, policies that may range from re-training workers for new tasks/jobs as a
result of technological changes, adequate regulatory frameworks to promote investment and competition,
to social protection of the most vulnerable to opening the trade account.
43
References Acharya, R., J. Crawford, M. Maliszewska, and C. Renard (2011). ‘Landscape’. In J.P. Chauffour and J.C. Maur
(eds), Preferential Trade Agreement Policies for Development: A Handbook. Washington, DC: World Bank.
Aizenman, Joshua and Mark M. Spiegel (2010) “Takeoffs." Review of Development Economics 14(2): 177-196. Arellano, Manuel, and Olympia Bover (1995) “Another Look at the Instrumental Variable Estimation of Error-
Components Models.” Journal of Econometrics 68, 29-51. Aslam, Aqib, Emine Boz, Eugenio Cerutti, Marcos Poplawski-Ribeiro, and Petia Topalova (2017) “The Slowdown
in Global Trade: A Symptom of a Weak Recovery.” IMF Working Paper WP/17/242 Baggs, Jen, and James A. Brander (2006) “Trade liberalization, profitability, and financial leverage.” Journal of
International Business Studies 37(2): 196-211. Baier, Scott L. and Jeffrey H. Bergstrand (2004) “Economic determinants of free trade agreements.” Journal of
International Economics 64(1): 29-63. Beaton, Kimberly, Aliona Cebotari, Xiaodan Ding, and Andras Komaromi (2017) “Trade Integration in Latin
America: A Network Perspective.” IMF Working Paper WP/17/148. Bhagwati, Jagdish, and Arvind Panagariya (1996) “Preferential Trading Areas and Multilateralism: Strangers,
Friends or Foes,” in: Bhagwati, Jagdish and Arvind Panagariya (Eds.) The Economics Of Preferential Trade Agreements. AEI Press: Washington DC (1996): 1-78.
Blundell, Richard, and Stephen Bond (1998) “Initial Conditions and Moment Restrictions in Dynamic Panel Data Models.” Journal of Econometrics 87, 115-143.
Cadot, O., C. Carrère, and V. Strauss‐Kahn (2011) “Export Diversification: What's behind the Hump?” The Review of Economics and Statistics 93(2): 590-605.
Cadot, O., Iacovone, L., Pierola, M. D., & Rauch, F. (2013). Success and failure of African exporters. Journal of Development Economics, 101, 284-296.
Cadot, O., C. Carrère, and V. Strauss‐Kahn (2013) “Trade diversification, income, and growth: What do we know?” Journal of Economic Surveys 27(4): 790-812.
Chang, R., Kaltani, L., & Loayza, N. V. (2009). Openness can be good for growth: The role of policy complementarities. Journal of development economics, 90(1), 33-49.
Dollar, David, and Aart Kraay (2003) “Institutions, Trade and Growth.” Journal of Monetary Economics 50(1): 133-162
Easterly, W.R. and A. Reshef (2016) “African Export Successes: Surprises, Stylized Facts, and Explanations.” In: Edwards, S., S. Johnson, and D.N. Weil, eds., African Successes, Volume III: Modernization and Development. University of Chicago Press, Chicago, IL, pp. 297-342.
Estevadeordal, Antoni, and Alan M. Taylor (2013) “Is the Washington Consensus Dead? Growth, Openness, and the Great Liberalization, 1970s–2000s.” Review of Economics and Statistics 95: 1669–90.
Fofack, Hippolyte (2018) “A Competitive Africa: Economic integration could make the continent a global player.” Finance & Development 55(4): 48-51.
Freund, Caroline, and Martha D. Pierola (2012) “Export surges.” Journal of Development Economics 97(2): 387-395.
Haddad, M., J. Lim, C. Pancaro, and C. Saborowski (2013) “Trade openness reduces growth volatility when countries are well diversified.” Canadian Journal of Economics 46(2): 765-790.
Hausmann, Ricardo, Lant Pritchett, and Dani Rodrik (2005) “Growth Accelerations.” Journal of Economic Growth 10(4): 303-329.
Havranek, T., R. Horvath, and A. Zeynalov (2016) “Natural Resources and Economic Growth: A Meta-Analysis.” World Development 88(C): 134-151.
IMF (2019) Sub-Saharan Africa Regional Economic Outlook: Recovery Amid Elevated Uncertainty. Washington, DC: International Monetary Fund, April.
Jong-A-Pin, R., & De Haan, J. (2011). Political regime change, economic liberalization and growth accelerations. Public Choice, 146(1-2), 93-115.
Lederman, D., & Maloney, W. F. (2008). In search of the missing resource curse. The World Bank.
44
Lewis, W. Arthur (1980) “The slowing down of the engine of growth.” American Economic Review 70(4): 555-64.
Lileeva, Alla, and Daniel Trefler (2010) “Improved Access to Foreign Markets Raises Plant-Level Productivity... for Some Plants.” The Quarterly Journal of Economics 125(3): 1051-1099.
Magee, Christopher S.P. (2008) “New Measures of Trade Creation and Trade Diversion.” Journal of International Economics 75(2): 349-362.
Malik, A., & Temple, J. R. (2009). The geography of output volatility. Journal of Development Economics, 90(2), 163-178.
Mattoo, A., A. Mulabdic, and M. Ruta. 2017. “Trade Creation and Trade Diversion in Deep Agreements.” Policy Research Working Paper Series 8206, World Bank, Washington, DC.
Melitz, Marc J. (2003) “The Impact of Trade on Intra-Industry Reallocations and Aggregate Industry Productivity.” Econometrica 71(6): 1695-1725.
Nshimbi, Chris and Inocent Moyo (2017) Migration, Cross-Border Trade and Development in Africa: Exploring the Role of Non-State Actors in the SADC Region. Palgrave Macmillan, Palgrave Studies of Sustainable Business in Africa.
Osnago, A., N. Rocha, and M. Ruta. 2017. “Do Deep Trade Agreements Boost Vertical FDI?” World Bank Economic Review 30 (Supplement): 119–125.
Papageorgiou, C., & Spatafora, M. N. (2012). Economic diversification in LICs: Stylized facts and macroeconomic implications (No. 12-13). International Monetary Fund.
Roodman, David (2009) “A Note on the Theme of Too Many Instruments.” Oxford Bulletin of Economics and Statistics 71(1): 135-158.
Ruta, M. 2017. “Preferential Trade Agreements and Global Value Chains: Theory, Evidence, and Open Questions.” Policy Research Working Paper Series 8190. World Bank, Washington, DC.
Songwe, Vera (2019) Boositng trade and Investment: a new agenda for regional and international engagement. Brookings.
UNECA (2017) “Transforming African economies through smart trade and industrial policy.” Addis Ababa, Ethiopia: Economic Commission for Africa.
Viner, Jacob (1950) “The Economics of Customs Unions.” New York: Carnegie Endowment for International Peace.
Wacziarg, R., & Welch, K. H. (2008). Trade liberalization and growth: New evidence. The World Bank Economic Review, 22(2), 187-231.
Windmeijer, Frank (2005) “A Finite Sample Correction for the Variance of Linear Two-Step GMM Estimators.” Journal of Econometrics 126(1): 25-51.
World Bank (2015) Global Economic Prospects: Having Fiscal Space and Using It. Washington, DC: The World Bank, January.
World Bank (2018) Africa’s Pulse, Volume 18. Washington, DC: The World Bank, October. World Bank (2019a) Future Drivers of Growth in Rwanda: Innovation, Integration, Agglomeration, and
Competition. Conference Edition, Washington, D.C.: The World Bank Group, available at https://openknowledge.worldbank.org/ handle/10986/30732
World Bank (2019b) World Development Report 2020: Trading for Development in the Age of Global Value Chains. The World Bank, Washington, DC.