Embed Size (px)
Citation preview
DEVELOPING EXPORT-BASED MANUFACTURING IN SUB-SAHARAN AFRICA
DEVELOPING EXPORT-BASED MANUFACTURING IN SUB-SAHARAN AFRICA
Neil Balchin, Stephen Gelb, Jane Kennan, Hope Martin, Dirk Willem te Velde and Carolin Williams
Report, March 2016
DEVELOPING EXPORT-BASED MANUFACTURING IN SUB-SAHARAN AFRICA
i
© SUPPORTING ECONOMIC TRANSFORMATION. The views presented in this publication are those of the author(s) and do not necessarily represent the views of DFID or ODI.
Acknowledgements This is a paper commissioned by the UK Department for International Development. We would like to thank Andrew Clark for guidance and Maximiliano Mendez-Parra, Maggie McMillan and Martyn Shannon for their reviews and comments.
DEVELOPING EXPORT-BASED MANUFACTURING IN SUB-SAHARAN AFRICA
ii
ACRONYMS AfDB African Development Bank AGOA African Growth and Opportunity Act BEA US Bureau for Economic Analysis CDIS Coordinated Direct Investment Survey CMT Cut, Make and Trim CSO Central Statistics Office Zambia DFID Department for International Development DVA Domestic Value Added EAC East African Community EBA Everything But Arms EPA Economic Partnership Agreement EU European Union FVA Foreign Value Added FDI Foreign Direct Investment FMCG Fast-Moving Consumer Goods FTA Free Trade Agreement GDP Gross Domestic Product GVC Global Value Chain ICT Information and Communication Technology ILO International Labour Organization IMF International Monetary Fund LDC Least Developed Country LIC Low-Income Country LMIC Lower-Middle-Income Country MIC Middle-Income Country NBS National Bureau of Statistics Tanzania nes Not Elsewhere Specified OECD Organisation for Economic Co-operation and Development ONS UK Office of National Statistics RCA Revealed Comparative Advantage RULC Relative Unit Labour Cost SDG Sustainable Development Goal SET Supporting Economic Transformation SEZ Special Economic Zone SITC Standard Industrial Trade Classification SSA Sub-Saharan Africa UBoS Uganda Bureau of Statistics UK United Kingdom UMIC Upper-Middle-Income Country UN United Nations UNCTAD UN Conference on Trade and Development UNDP UN Development Programme UNIDO UN Industrial Development Organization US United States USITC United States International Trade Commission
VA Value Added WDI World Development Indicators
DEVELOPING EXPORT-BASED MANUFACTURING IN SUB-SAHARAN AFRICA
iii
TABLE OF CONTENTS
Executive summary _______________________________________________ iv
1. Introduction ____________________________________________________ 1
2. Manufacturing production in Sub-Saharan Africa _______________________ 2
3. Trends in African manufacturing exports _____________________________ 4
4. Trends in FDI to Africa __________________________________________ 11
5. Identifying opportunities in African manufacturing _____________________ 18
6. Realising opportunities in African manufacturing ______________________ 24
7. Conclusions __________________________________________________ 30
References _____________________________________________________ 34
Appendix I: Global and African manufacturing exports ____________________ 37
Appendix II: Comparative analysis ___________________________________ 46
Appendix III: Manufacturing profiles __________________________________ 48
DEVELOPING EXPORT-BASED MANUFACTURING IN SUB-SAHARAN AFRICA
iv
EXECUTIVE SUMMARY Strong growth in the African region, rebalancing and rising wages in China and improvements in the policy and institutional context provide a unique opportunity that African countries should use now to attract investment in higher value-added, export-led manufacturing. Contrary to some perceptions, production, employment, trade and foreign direct investment (FDI) in the manufacturing sectors has actually increased over the past decade in Sub-Saharan Africa (SSA). Quantitative and qualitative accounts of the manufacturing sectors and the policy context in nine SSA counties suggest there are now excellent experiences and opportunities in a range of manufacturing subsectors (garments and textiles, agro-processing/horticulture, automobiles and consumer goods) and countries such as Ethiopia, Kenya, Mozambique, Nigeria and Zambia. The challenge for policy-makers in these countries and sectors is to build on the experiences and make the opportunities a reality by tackling constraints that are common and specific to countries and sectors. Two SET-ACET papers (Ansu et al, 2016a, 2016b) provide further insights into what needs to be done, and how.
Manufacturing production in SSA has more than doubled, from $73 billion in 2005 to $157 billion in current prices in 2014 (or $98 billion in 2005 prices; equivalent to a 3.5% annual growth in real terms over the past decade). National statistics point to strong recent annual manufacturing real growth overall, for example 6% over 2008–2012 in Zambia and 5% in Uganda over 2010–2014. The food and beverages sector has increased above average partly because of the importance of growing domestic demand, whereas the textiles and clothing sector has found it hard to withstand the competition from Asian imports in the past. But this is now changing owing to increased Chinese investment interests.
SSA manufacturing exports (including re-exports) doubled between 2005 and 2014 from more than $50 billion to more than $100 billon. SSA countries are increasingly exporting manufactures to each other (20% of total trade in 2005, 34% in 2014). Asian countries have also become much more important destinations for African manufacturing exports. Top exporting products from SSA include leather manufactures from Ethiopia, Nigeria and Uganda, textiles and clothing from Kenya and Ethiopia and several other products (e.g. construction materials, chemical and machinery in other countries examined, such as Ghana, Mozambique, Nigeria, Uganda and Zambia).
FDI in African manufacturing has been low but is increasing; much FDI is among African countries. The FDI stock in SSA is 29% of GDP, not far below the figure for the world as a whole (33.6%), but there is wide variation among SSA countries. Absolute stock levels in Africa tend be relatively small and often dominated by a few very large investments. Manufacturing FDI has so far taken an important share in only a few countries, such as Ethiopia (75% of the total), followed by Kenya and Nigeria (around a quarter of the total). Nonetheless, manufacturing FDI rose in nine African countries considered between 2003–2006 and 2010–2014, with the exception of Nigeria. Intra-African FDI is a significant source of FDI in African countries (ranging from 4% in Ghana to more than 40% on Rwanda). There is increased attention from Chinese investors in labour-intensive manufacturing FDI (e.g. in Ethiopia or Rwanda).
Our analysis suggests a number of promising manufacturing subsectors. Africa’s shares in world exports of fertilisers and inorganic chemicals is higher than 5%, is more than 4% for leather, leather manufactures and dressed furskins and is 2% for articles of apparel and clothing accessories. The analytical techniques discuss opportunities at product level, too detailed to cover, but our qualitative accounts suggest there are excellent manufacturing opportunities in garments and textiles, agro-processing/horticulture, automobiles and consumer goods.
Our analysis highlights five promising countries that are relatively well positioned (for different reasons as explained in Table 6) to attract manufacturing FDI: Ethiopia, Kenya, Mozambique, Nigeria and Zambia. The Manufacturing FDI Potential Index calculates a total score for each of nine African countries based on their rankings on a number of key factors influencing FDI, including past manufacturing FDI stock as a percentage of gross domestic product, recent performance in manufacturing exports, domestic value added in manufacturing, manufacturing value added per capita, economic complexity, labour productivity in manufacturing, population, quality of the business climate and infrastructure, education and cost and reliability of electricity.
DEVELOPING EXPORT-BASED MANUFACTURING IN SUB-SAHARAN AFRICA
1
1. INTRODUCTION Strong growth in the African region, rebalancing and rising wages in China and improvements in the policy and institutional context provide a unique opportunity that African countries1 can use to attract investment in higher value-added, export-led manufacturing. This paper describes the most recent trends in production, trade and foreign direct investment (FDI) in the manufacturing sectors in nine selected Sub-Saharan African (SSA) countries and reviews opportunities for the development of promising manufacturing sectors. We find much remains to be done to seize these opportunities.
Industrial development is crucial for human development in low-income countries (LICs). It is a priority area for the implementation of the Sustainable Development Goals (SDGs) in Africa. Industrial development leads to wealth creation, greater incomes and job creation and economy-wide resilience. Innovation and productivity growth in manufacturing is faster than in other sectors, and faster technology adoption and innovation raises aggregate labour productivity and reduces prices, which brings up real incomes and profits leading to faster investment. The rapid promotion of exports of manufacturing is one of very few proven routes to sustained job creation. When manufacturing is further linked to other sectors – e.g. when it adds value by processing commodities – it creates multiplier linkages throughout the economy. Manufacturing growth further builds resilience against external shocks through diversification out of commodities. 2 Manufacturing exports provide much-needed foreign exchange. Resilience to shocks protects the livelihoods of the poorest. Finally, industrial development based on broad-based private sector development helps to raise tax revenues (as a percentage of gross domestic product (GDP)), which helps provide the budget for human development.
The importance (as measured by the share) of manufacturing in the economy is, however, much lower in Africa than it is in other developing regions. This weak comparable performance over recent decades has been associated with the presence of weak productive capabilities, bad logistics and policy mistakes (Lall, 2001; Page, 2012). Other regions, especially Asia, were able to develop a strong manufacturing sector from the 1960s onwards by building industrial capabilities through skills formation, lowering transport costs, attracting FDI and other equity links and promoting exports, which supported strong job creation first in countries such as Korea, Malaysia, Singapore and Taiwan and later in Indonesia, Thailand, Vietnam and, of course, China (which is also termed the ‘factory of the world’).
A key question for policy-makers is how African countries can break more fully into the manufacturing sector. This paper informs this question by tackling four issues. We first discuss (Section 2) what we know about manufacturing production in Africa, arguing that, contrary to some perceptions, the available data, albeit patchy, do point to overall strong growth in manufacturing but with a widely varying performance across subsectors. Section 3 discusses the performance of African manufacturing exports. It reveals that Africa still plays a marginal role in world exports of manufactures (outside of certain subsectors such as fertilisers and inorganic chemicals, leather, apparel and clothing), but intra-African trade is expanding steadily, and African countries are increasingly exporting manufactures to each other. There has also been gradual technological deepening in African manufacturing exports over the past decade. Section 4 discusses the distribution of FDI stocks across countries and sectors. Section 5 discusses promising sectors. Section 6 discusses what needs to be done to realise opportunities in export-based manufacturing in Africa and which countries are well placed to make use of the opportunities (we are focusing on policy analysis). Section 7 concludes.
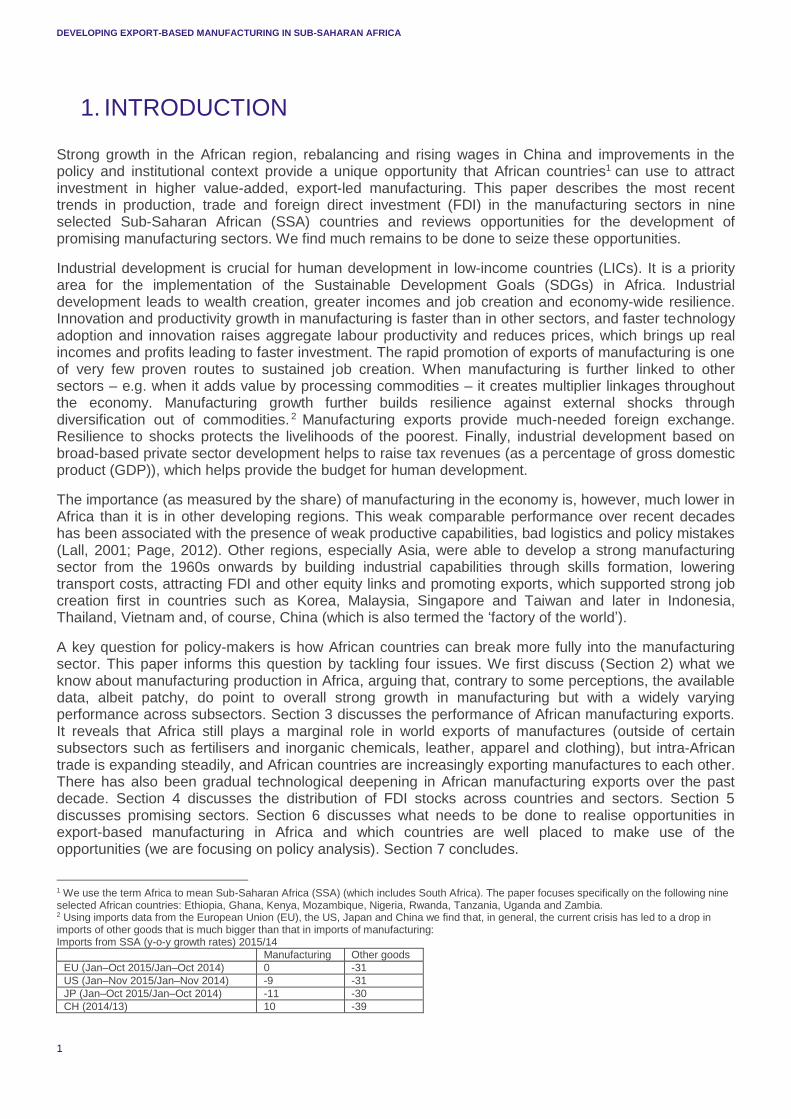
1 We use the term Africa to mean Sub-Saharan Africa (SSA) (which includes South Africa). The paper focuses specifically on the following nine selected African countries: Ethiopia, Ghana, Kenya, Mozambique, Nigeria, Rwanda, Tanzania, Uganda and Zambia. 2 Using imports data from the European Union (EU), the US, Japan and China we find that, in general, the current crisis has led to a drop in imports of other goods that is much bigger than that in imports of manufacturing: Imports from SSA (y-o-y growth rates) 2015/14
Manufacturing Other goods
EU (Jan–Oct 2015/Jan–Oct 2014) 0 -31
US (Jan–Nov 2015/Jan–Nov 2014) -9 -31
JP (Jan–Oct 2015/Jan–Oct 2014) -11 -30
CH (2014/13) 10 -39
DEVELOPING EXPORT-BASED MANUFACTURING IN SUB-SAHARAN AFRICA
2
2. MANUFACTURING PRODUCTION IN SUB-SAHARAN AFRICA
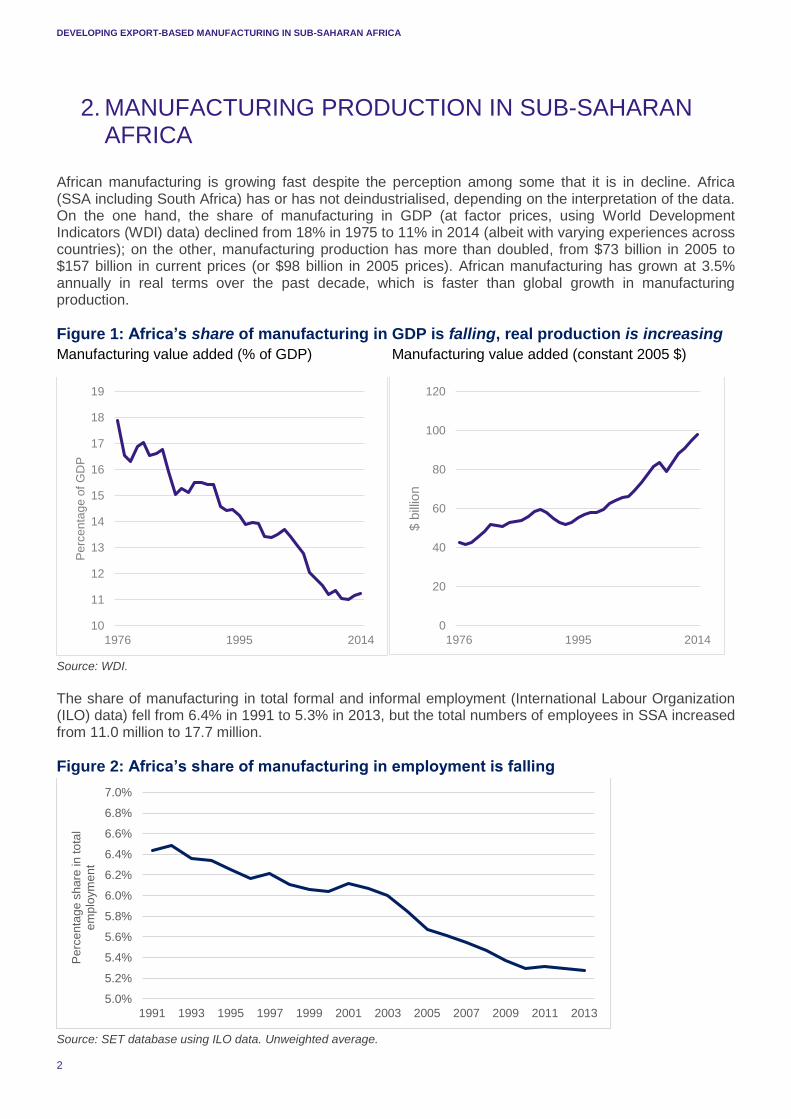
African manufacturing is growing fast despite the perception among some that it is in decline. Africa (SSA including South Africa) has or has not deindustrialised, depending on the interpretation of the data. On the one hand, the share of manufacturing in GDP (at factor prices, using World Development Indicators (WDI) data) declined from 18% in 1975 to 11% in 2014 (albeit with varying experiences across countries); on the other, manufacturing production has more than doubled, from $73 billion in 2005 to $157 billion in current prices (or $98 billion in 2005 prices). African manufacturing has grown at 3.5% annually in real terms over the past decade, which is faster than global growth in manufacturing production.
Figure 1: Africa’s share of manufacturing in GDP is falling, real production is increasing
Manufacturing value added (% of GDP) Manufacturing value added (constant 2005 $)
Source: WDI.
The share of manufacturing in total formal and informal employment (International Labour Organization (ILO) data) fell from 6.4% in 1991 to 5.3% in 2013, but the total numbers of employees in SSA increased from 11.0 million to 17.7 million.
Figure 2: Africa’s share of manufacturing in employment is falling
Source: SET database using ILO data. Unweighted average.
10
11
12
13
14
15
16
17
18
19
1976 1995 2014
Pe
rce
nta
ge
of
GD
P
0
20
40
60
80
100
120
1976 1995 2014
$ b
illio
n
5.0%
5.2%
5.4%
5.6%
5.8%
6.0%
6.2%
6.4%
6.6%
6.8%
7.0%
1991 1993 1995 1997 1999 2001 2003 2005 2007 2009 2011 2013
Pe
rce
nta
ge
sh
are
in
to
tal
em
plo
ym
en
t
DEVELOPING EXPORT-BASED MANUFACTURING IN SUB-SAHARAN AFRICA
3
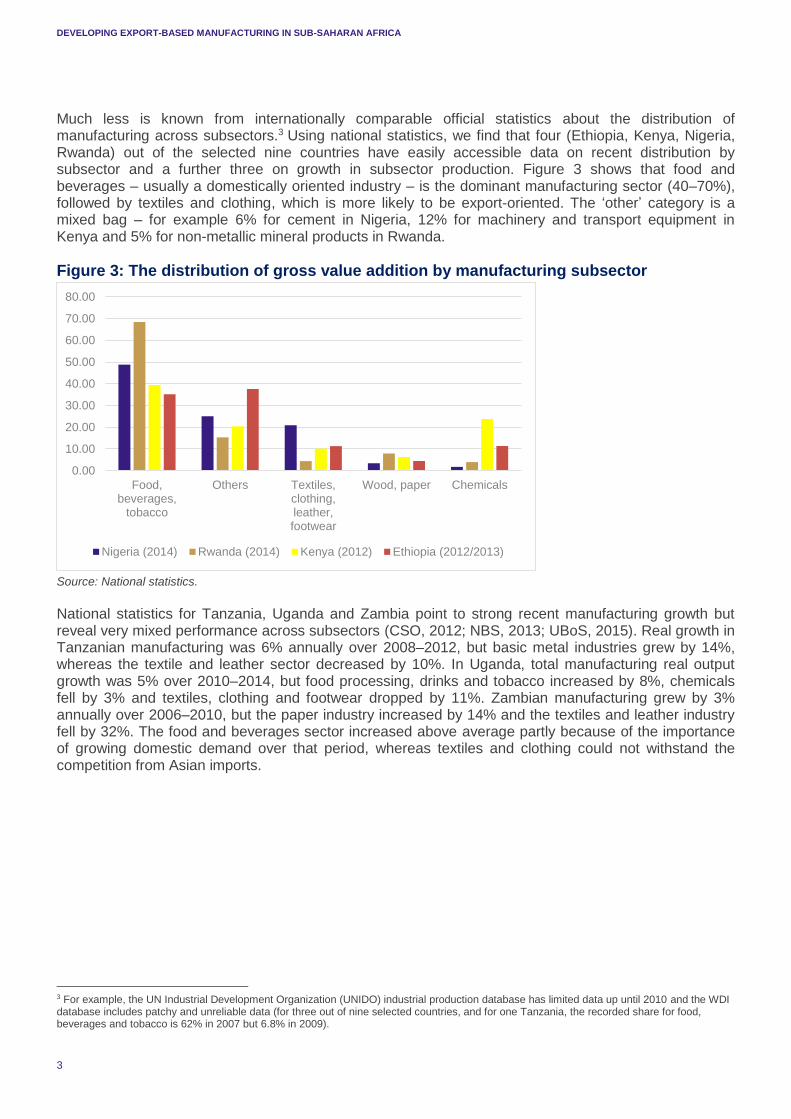
Much less is known from internationally comparable official statistics about the distribution of manufacturing across subsectors.3 Using national statistics, we find that four (Ethiopia, Kenya, Nigeria, Rwanda) out of the selected nine countries have easily accessible data on recent distribution by subsector and a further three on growth in subsector production. Figure 3 shows that food and beverages – usually a domestically oriented industry – is the dominant manufacturing sector (40–70%), followed by textiles and clothing, which is more likely to be export-oriented. The ‘other’ category is a mixed bag – for example 6% for cement in Nigeria, 12% for machinery and transport equipment in Kenya and 5% for non-metallic mineral products in Rwanda.
Figure 3: The distribution of gross value addition by manufacturing subsector
Source: National statistics.
National statistics for Tanzania, Uganda and Zambia point to strong recent manufacturing growth but reveal very mixed performance across subsectors (CSO, 2012; NBS, 2013; UBoS, 2015). Real growth in Tanzanian manufacturing was 6% annually over 2008–2012, but basic metal industries grew by 14%, whereas the textile and leather sector decreased by 10%. In Uganda, total manufacturing real output growth was 5% over 2010–2014, but food processing, drinks and tobacco increased by 8%, chemicals fell by 3% and textiles, clothing and footwear dropped by 11%. Zambian manufacturing grew by 3% annually over 2006–2010, but the paper industry increased by 14% and the textiles and leather industry fell by 32%. The food and beverages sector increased above average partly because of the importance of growing domestic demand over that period, whereas textiles and clothing could not withstand the competition from Asian imports.
3 For example, the UN Industrial Development Organization (UNIDO) industrial production database has limited data up until 2010 and the WDI database includes patchy and unreliable data (for three out of nine selected countries, and for one Tanzania, the recorded share for food, beverages and tobacco is 62% in 2007 but 6.8% in 2009).
0.00
10.00
20.00
30.00
40.00
50.00
60.00
70.00
80.00
Food,beverages,
tobacco
Others Textiles,clothing,leather,footwear
Wood, paper Chemicals
Nigeria (2014) Rwanda (2014) Kenya (2012) Ethiopia (2012/2013)
DEVELOPING EXPORT-BASED MANUFACTURING IN SUB-SAHARAN AFRICA
4
3. TRENDS IN AFRICAN MANUFACTURING EXPORTS The continued globalisation of the world economy has been accompanied by generally rapid growth in international trade over much of the past few decades. The total value of international trade in goods and services has increased six-fold since 1990, to around $24 trillion in 2014 (UNCTAD, 2015). Global trade in manufacturing products accounts for more than half of this share ($13 trillion) and the growth in trade of these products has outpaced the growth in trade in natural resources or agricultural products over the past decade. In this section, we highlight a number of recent trends in global trade in manufacturing products (Section 3.1) and undertake a more detailed analysis of African manufacturing export performance, including in the nine selected SSA countries (Section 3.2).
3.1 TRENDS IN GLOBAL TRADE IN MANUFACTURING PRODUCTS
Growth in world manufacturing exports has slowed since the crisis amid a global trade slowdown
The value of world exports of manufactures increased by 67% between 2005 and 2014, reaching close to $12.3 trillion in 2014. However, in the wake of the global economic crisis, and amid persistently low growth rates in both developed and emerging economies, global trade growth has been weak – at less than 2% per year between 2011 and 2014 (Hoekman, 2015; UNCTAD, 2015). This has been matched by much lower average annual growth in the value of manufacturing exports since 2011 (see Figure A.1 in Appendix I) and a declining share of manufactures in total merchandise trade (from 70% to 65% in 2014, see Figure A.2 in Appendix I).
Developing countries are playing an increasingly influential role in global trade in manufactures
The value of manufacturing exports from developing countries more than doubled between 2005 and 2014, reaching nearly $5.4 trillion in 2014 (see Figure A.3 in Appendix I). Much of this growth has been driven by expansion in exports of manufactures from developing LICs and middle-income countries (MICs). Growth in manufacturing exports from least developed countries (LDCs) has also been strong – expanding at an average annual rate of 12.5%, albeit off a low base.4 As a group, developing countries (low- and middle-, as well as high-income developing countries such as China) accounted for around 60% of world merchandise exports in 2014 (up from 50% in 2005). Developing countries (including China) are also importing more manufactures (see Figure A.4 in Appendix I).
Asia and Africa are important centres of growth in manufacturing trade, but Africa still plays only a marginal role in world exports of manufactures
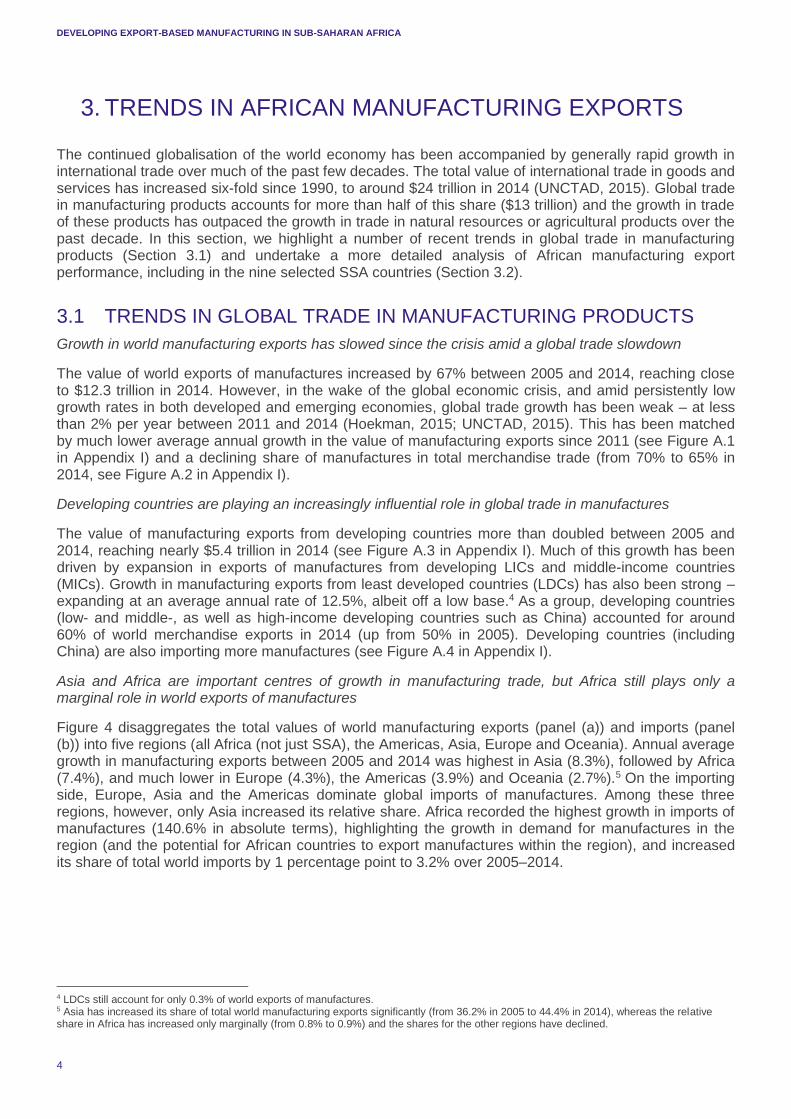
Figure 4 disaggregates the total values of world manufacturing exports (panel (a)) and imports (panel (b)) into five regions (all Africa (not just SSA), the Americas, Asia, Europe and Oceania). Annual average growth in manufacturing exports between 2005 and 2014 was highest in Asia (8.3%), followed by Africa (7.4%), and much lower in Europe (4.3%), the Americas (3.9%) and Oceania (2.7%).5 On the importing side, Europe, Asia and the Americas dominate global imports of manufactures. Among these three regions, however, only Asia increased its relative share. Africa recorded the highest growth in imports of manufactures (140.6% in absolute terms), highlighting the growth in demand for manufactures in the region (and the potential for African countries to export manufactures within the region), and increased its share of total world imports by 1 percentage point to 3.2% over 2005–2014.
4 LDCs still account for only 0.3% of world exports of manufactures. 5 Asia has increased its share of total world manufacturing exports significantly (from 36.2% in 2005 to 44.4% in 2014), whereas the relative share in Africa has increased only marginally (from 0.8% to 0.9%) and the shares for the other regions have declined.
DEVELOPING EXPORT-BASED MANUFACTURING IN SUB-SAHARAN AFRICA
5
Figure 4: Value of manufacturing exports and imports by region, 2005–2014
(a) Manufacturing exports (b) Manufacturing imports
Note: Oceania values too small to show on graph.
Source: UNCTADstat.
Developed countries and China remain the top destination markets sourcing manufactures, but some other developing countries rank among the top importers
Table A.1 in Appendix I compares the top 10 importing countries in 2014 by share of the total value of imports for different manufactured products. China is the largest importer of several products6 and ranks among the top two or three countries in certain others. Imports of manufactures are otherwise dominated by developed countries in Europe (e.g. Belgium, France, Germany, Italy) and North America (Canada, the US). However, some developing countries rank among the top 10 importers of specific manufactures, including India (organic and inorganic chemicals, plastics in primary forms, metal working machinery), Vietnam (fertilisers, leather, leather manufactures and dressed furskins, textile yarn and related products), Thailand (fertilisers, iron and steel, metal working machinery) and Bangladesh (fertilisers, textile yarn and related products). Moreover, we show below that other African countries are emerging as increasingly important destination markets for African manufacturing exports.
3.2 AFRICAN TRADE IN MANUFACTURES
3.2.1 OVERVIEW OF TRENDS IN AFRICAN MANUFACTURING EXPORTS Africa’s (all Africa, not just SSA) share in total world manufacturing exports remains less than 1%, and this has fallen marginally since 2010. This aggregate figure does, however, mask significant variation across manufacturing sectors. The continent’s shares in world exports of fertilisers and inorganic chemicals both exceed 5%, and Africa accounts for more than 4% of global exports of leather, leather manufactures and dressed furskins, and around 2% of world exports of articles of apparel and clothing accessories (see Figure A.5 in Appendix I). In many other manufacturing sectors, Africa has increased its share of global exports since 2005.
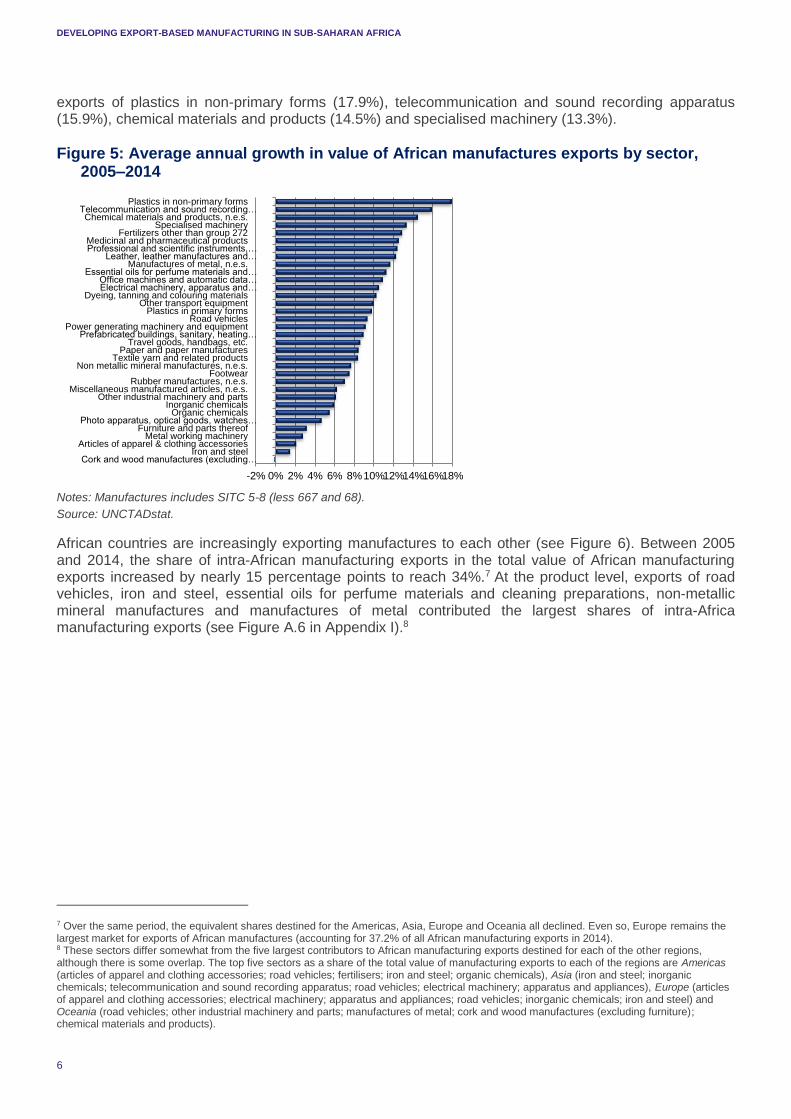
There has also been strong growth in exports from Africa in many manufacturing product groups. As Figure 5 shows, between 2005 and 2014 exports from Africa as a whole (not just SSA) grew at an average annual rate of 10% or higher in 14 out of 34 product groups, with the fastest growth recorded in
6 Organic chemicals; dyeing, tanning and colouring materials; plastics in primary or non-primary forms; chemical materials and products; leather, leather manufactures and dressed furskins; metal working machinery; electrical machinery, apparatus and appliances; professional and scientific instruments; photo apparatus, optical goods, watches and clocks.
0
1,000
2,000
3,000
4,000
5,000
6,000
2005200620072008200920102011201220132014
US
$ b
illio
ns
Africa Americas Asia Europe Oceania
0
1,000
2,000
3,000
4,000
5,000
6,000
2005200620072008200920102011201220132014
US
$ b
illio
ns
Africa Americas Asia Europe Oceania
DEVELOPING EXPORT-BASED MANUFACTURING IN SUB-SAHARAN AFRICA
6
exports of plastics in non-primary forms (17.9%), telecommunication and sound recording apparatus (15.9%), chemical materials and products (14.5%) and specialised machinery (13.3%).
Figure 5: Average annual growth in value of African manufactures exports by sector, 2005–2014
Notes: Manufactures includes SITC 5-8 (less 667 and 68).
Source: UNCTADstat.
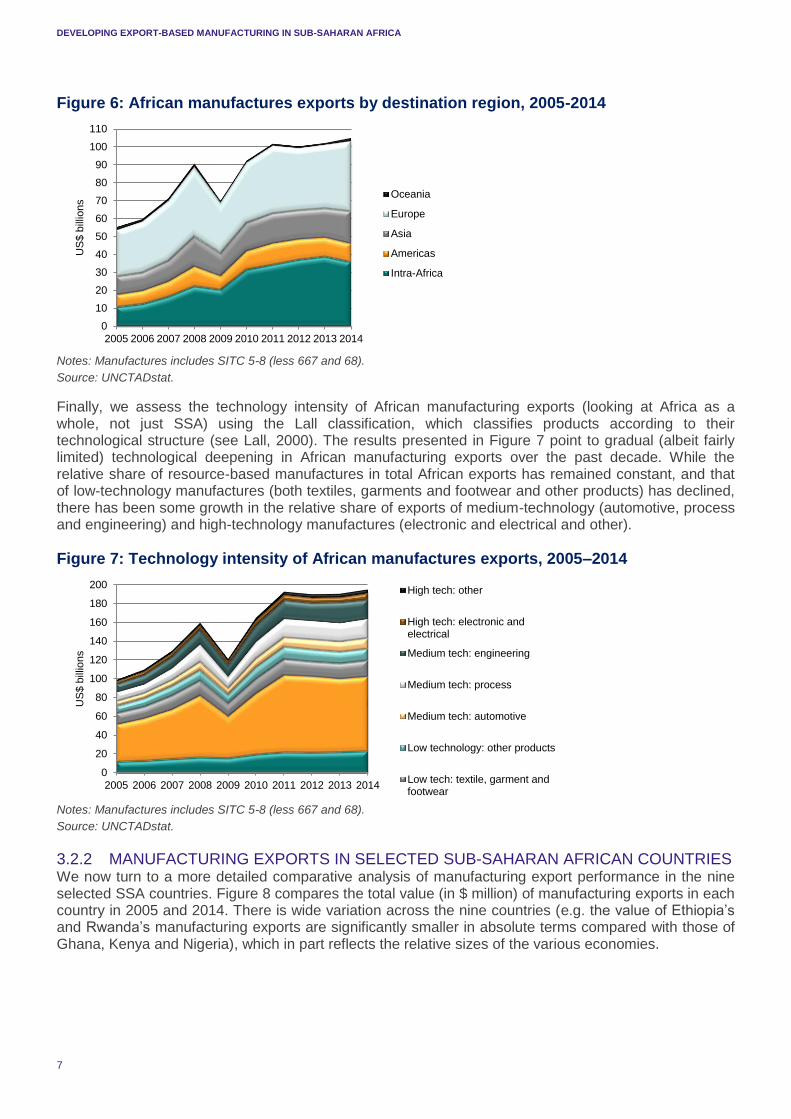
African countries are increasingly exporting manufactures to each other (see Figure 6). Between 2005 and 2014, the share of intra-African manufacturing exports in the total value of African manufacturing exports increased by nearly 15 percentage points to reach 34%.7 At the product level, exports of road vehicles, iron and steel, essential oils for perfume materials and cleaning preparations, non-metallic mineral manufactures and manufactures of metal contributed the largest shares of intra-Africa manufacturing exports (see Figure A.6 in Appendix I).8
7 Over the same period, the equivalent shares destined for the Americas, Asia, Europe and Oceania all declined. Even so, Europe remains the largest market for exports of African manufactures (accounting for 37.2% of all African manufacturing exports in 2014). 8 These sectors differ somewhat from the five largest contributors to African manufacturing exports destined for each of the other regions, although there is some overlap. The top five sectors as a share of the total value of manufacturing exports to each of the regions are Americas (articles of apparel and clothing accessories; road vehicles; fertilisers; iron and steel; organic chemicals), Asia (iron and steel; inorganic chemicals; telecommunication and sound recording apparatus; road vehicles; electrical machinery; apparatus and appliances), Europe (articles of apparel and clothing accessories; electrical machinery; apparatus and appliances; road vehicles; inorganic chemicals; iron and steel) and Oceania (road vehicles; other industrial machinery and parts; manufactures of metal; cork and wood manufactures (excluding furniture); chemical materials and products).
-2% 0% 2% 4% 6% 8%10%12%14%16%18%
Cork and wood manufactures (excluding…Iron and steel
Articles of apparel & clothing accessoriesMetal working machinery
Furniture and parts thereofPhoto apparatus, optical goods, watches…
Organic chemicalsInorganic chemicals
Other industrial machinery and partsMiscellaneous manufactured articles, n.e.s.
Rubber manufactures, n.e.s.Footwear
Non metallic mineral manufactures, n.e.s.Textile yarn and related products
Paper and paper manufacturesTravel goods, handbags, etc.
Prefabricated buildings, sanitary, heating…Power generating machinery and equipment
Road vehiclesPlastics in primary forms
Other transport equipmentDyeing, tanning and colouring materials
Electrical machinery, apparatus and…Office machines and automatic data…
Essential oils for perfume materials and…Manufactures of metal, n.e.s.
Leather, leather manufactures and…Professional and scientific instruments,…Medicinal and pharmaceutical products
Fertilizers other than group 272Specialised machinery
Chemical materials and products, n.e.s.Telecommunication and sound recording…
Plastics in non-primary forms
DEVELOPING EXPORT-BASED MANUFACTURING IN SUB-SAHARAN AFRICA
7
Figure 6: African manufactures exports by destination region, 2005-2014
Notes: Manufactures includes SITC 5-8 (less 667 and 68).
Source: UNCTADstat.
Finally, we assess the technology intensity of African manufacturing exports (looking at Africa as a whole, not just SSA) using the Lall classification, which classifies products according to their technological structure (see Lall, 2000). The results presented in Figure 7 point to gradual (albeit fairly limited) technological deepening in African manufacturing exports over the past decade. While the relative share of resource-based manufactures in total African exports has remained constant, and that of low-technology manufactures (both textiles, garments and footwear and other products) has declined, there has been some growth in the relative share of exports of medium-technology (automotive, process and engineering) and high-technology manufactures (electronic and electrical and other).
Figure 7: Technology intensity of African manufactures exports, 2005–2014
Notes: Manufactures includes SITC 5-8 (less 667 and 68).
Source: UNCTADstat.
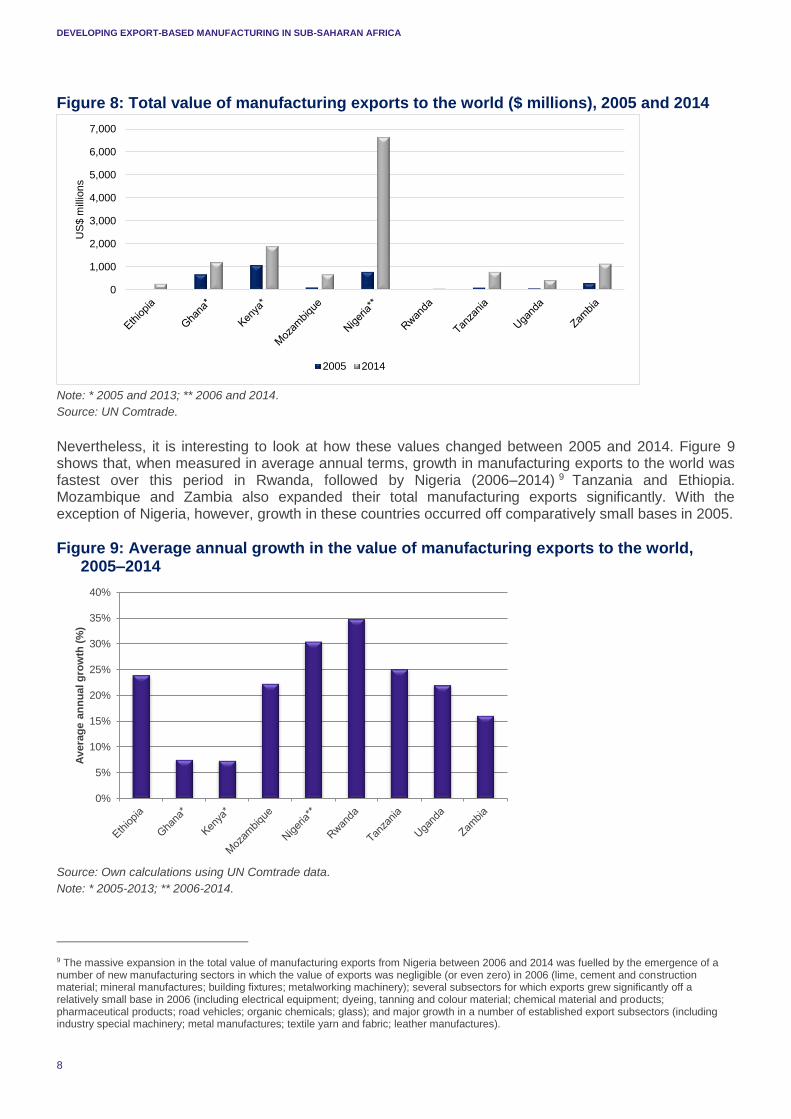
3.2.2 MANUFACTURING EXPORTS IN SELECTED SUB-SAHARAN AFRICAN COUNTRIES We now turn to a more detailed comparative analysis of manufacturing export performance in the nine selected SSA countries. Figure 8 compares the total value (in $ million) of manufacturing exports in each country in 2005 and 2014. There is wide variation across the nine countries (e.g. the value of Ethiopia’s and Rwanda’s manufacturing exports are significantly smaller in absolute terms compared with those of Ghana, Kenya and Nigeria), which in part reflects the relative sizes of the various economies.
0
10
20
30
40
50
60
70
80
90
100
110
2005 2006 2007 2008 2009 2010 2011 2012 2013 2014
US
$ b
illio
ns
Oceania
Europe
Asia
Americas
Intra-Africa
0
20
40
60
80
100
120
140
160
180
200
2005 2006 2007 2008 2009 2010 2011 2012 2013 2014
US
$ b
illio
ns
High tech: other
High tech: electronic andelectrical
Medium tech: engineering
Medium tech: process
Medium tech: automotive
Low technology: other products
Low tech: textile, garment andfootwear
DEVELOPING EXPORT-BASED MANUFACTURING IN SUB-SAHARAN AFRICA
8
Figure 8: Total value of manufacturing exports to the world ($ millions), 2005 and 2014
Note: * 2005 and 2013; ** 2006 and 2014.
Source: UN Comtrade.
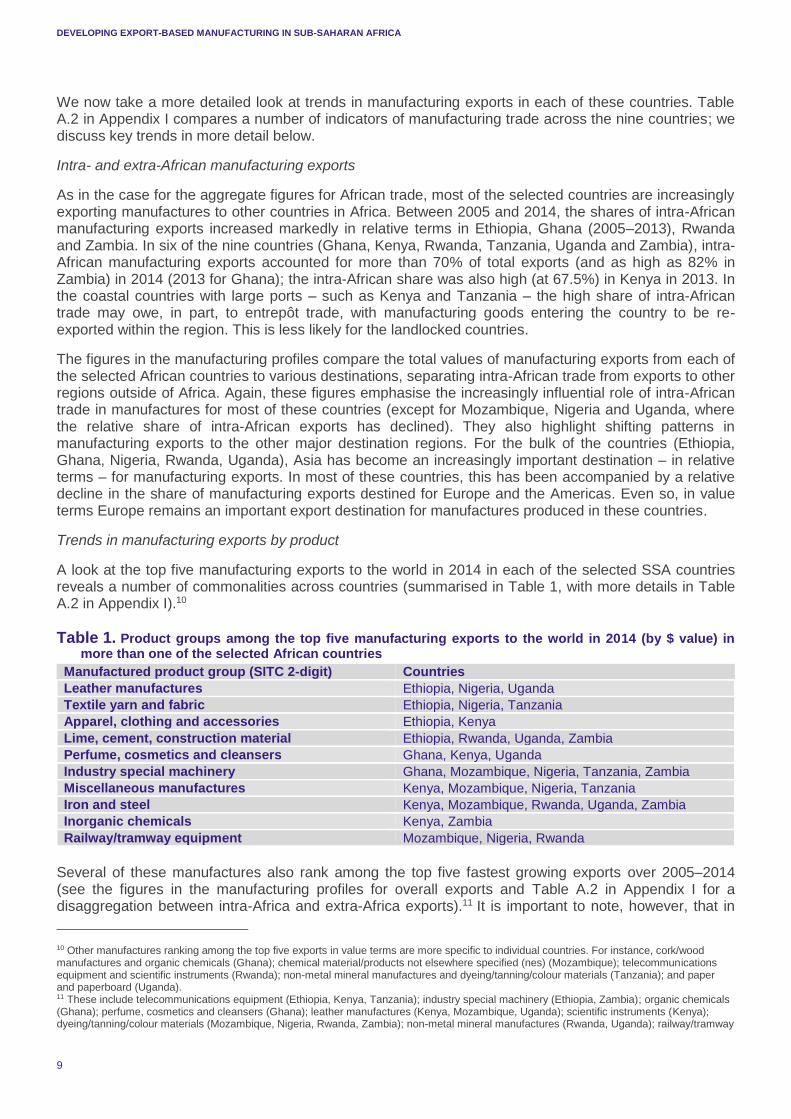
Nevertheless, it is interesting to look at how these values changed between 2005 and 2014. Figure 9 shows that, when measured in average annual terms, growth in manufacturing exports to the world was fastest over this period in Rwanda, followed by Nigeria (2006–2014) 9 Tanzania and Ethiopia. Mozambique and Zambia also expanded their total manufacturing exports significantly. With the exception of Nigeria, however, growth in these countries occurred off comparatively small bases in 2005.
Figure 9: Average annual growth in the value of manufacturing exports to the world, 2005–2014
Source: Own calculations using UN Comtrade data.
Note: * 2005-2013; ** 2006-2014.
9 The massive expansion in the total value of manufacturing exports from Nigeria between 2006 and 2014 was fuelled by the emergence of a number of new manufacturing sectors in which the value of exports was negligible (or even zero) in 2006 (lime, cement and construction material; mineral manufactures; building fixtures; metalworking machinery); several subsectors for which exports grew significantly off a relatively small base in 2006 (including electrical equipment; dyeing, tanning and colour material; chemical material and products; pharmaceutical products; road vehicles; organic chemicals; glass); and major growth in a number of established export subsectors (including industry special machinery; metal manufactures; textile yarn and fabric; leather manufactures).
0
1,000
2,000
3,000
4,000
5,000
6,000
7,000
US
$ m
illio
ns
2005 2014
0%
5%
10%
15%
20%
25%
30%
35%
40%
Avera
ge
an
nu
al g
row
th (
%)
DEVELOPING EXPORT-BASED MANUFACTURING IN SUB-SAHARAN AFRICA
9
We now take a more detailed look at trends in manufacturing exports in each of these countries. Table A.2 in Appendix I compares a number of indicators of manufacturing trade across the nine countries; we discuss key trends in more detail below.
Intra- and extra-African manufacturing exports
As in the case for the aggregate figures for African trade, most of the selected countries are increasingly exporting manufactures to other countries in Africa. Between 2005 and 2014, the shares of intra-African manufacturing exports increased markedly in relative terms in Ethiopia, Ghana (2005–2013), Rwanda and Zambia. In six of the nine countries (Ghana, Kenya, Rwanda, Tanzania, Uganda and Zambia), intra-African manufacturing exports accounted for more than 70% of total exports (and as high as 82% in Zambia) in 2014 (2013 for Ghana); the intra-African share was also high (at 67.5%) in Kenya in 2013. In the coastal countries with large ports – such as Kenya and Tanzania – the high share of intra-African trade may owe, in part, to entrepôt trade, with manufacturing goods entering the country to be re-exported within the region. This is less likely for the landlocked countries.
The figures in the manufacturing profiles compare the total values of manufacturing exports from each of the selected African countries to various destinations, separating intra-African trade from exports to other regions outside of Africa. Again, these figures emphasise the increasingly influential role of intra-African trade in manufactures for most of these countries (except for Mozambique, Nigeria and Uganda, where the relative share of intra-African exports has declined). They also highlight shifting patterns in manufacturing exports to the other major destination regions. For the bulk of the countries (Ethiopia, Ghana, Nigeria, Rwanda, Uganda), Asia has become an increasingly important destination – in relative terms – for manufacturing exports. In most of these countries, this has been accompanied by a relative decline in the share of manufacturing exports destined for Europe and the Americas. Even so, in value terms Europe remains an important export destination for manufactures produced in these countries.
Trends in manufacturing exports by product
A look at the top five manufacturing exports to the world in 2014 in each of the selected SSA countries reveals a number of commonalities across countries (summarised in Table 1, with more details in Table A.2 in Appendix I).10
Table 1. Product groups among the top five manufacturing exports to the world in 2014 (by $ value) in more than one of the selected African countries
Manufactured product group (SITC 2-digit) Countries
Leather manufactures Ethiopia, Nigeria, Uganda
Textile yarn and fabric Ethiopia, Nigeria, Tanzania
Apparel, clothing and accessories Ethiopia, Kenya
Lime, cement, construction material Ethiopia, Rwanda, Uganda, Zambia
Perfume, cosmetics and cleansers Ghana, Kenya, Uganda
Industry special machinery Ghana, Mozambique, Nigeria, Tanzania, Zambia
Miscellaneous manufactures Kenya, Mozambique, Nigeria, Tanzania
Iron and steel Kenya, Mozambique, Rwanda, Uganda, Zambia
Inorganic chemicals Kenya, Zambia
Railway/tramway equipment Mozambique, Nigeria, Rwanda
Several of these manufactures also rank among the top five fastest growing exports over 2005–2014 (see the figures in the manufacturing profiles for overall exports and Table A.2 in Appendix I for a disaggregation between intra-Africa and extra-Africa exports).11 It is important to note, however, that in
10 Other manufactures ranking among the top five exports in value terms are more specific to individual countries. For instance, cork/wood manufactures and organic chemicals (Ghana); chemical material/products not elsewhere specified (nes) (Mozambique); telecommunications equipment and scientific instruments (Rwanda); non-metal mineral manufactures and dyeing/tanning/colour materials (Tanzania); and paper and paperboard (Uganda). 11 These include telecommunications equipment (Ethiopia, Kenya, Tanzania); industry special machinery (Ethiopia, Zambia); organic chemicals (Ghana); perfume, cosmetics and cleansers (Ghana); leather manufactures (Kenya, Mozambique, Uganda); scientific instruments (Kenya); dyeing/tanning/colour materials (Mozambique, Nigeria, Rwanda, Zambia); non-metal mineral manufactures (Rwanda, Uganda); railway/tramway
DEVELOPING EXPORT-BASED MANUFACTURING IN SUB-SAHARAN AFRICA
10
many cases this growth occurred off a very small base in 2005. Nevertheless, the growth in the value of exports of these manufactures over the past decade does point to promising areas for future expansion.
Finally, we examine the technological intensity of each of the selected countries’ manufacturing export bundles using the Lall (2000) classification (see Figure A.7 in Appendix I). Mirroring the broader pattern for Africa as a whole (in Figure 7 above), manufacturing exports in most of the countries are still concentrated in resource-based (especially in Rwanda, but less so in Ethiopia and Kenya) and low-tech manufactures (particularly in Tanzania and Uganda). The concentration of manufactures in resource-based products, in particular, is important given Africa’s relative abundance of natural resources, highlighting a degree of specialisation according to comparative advantage. But there is some evidence of technological deepening, reflected in growing shares of low- and medium-technology manufactures in total manufacturing exports (and, to a lesser extent, high-tech manufactures).
Trade in value-added and intermediate inputs
For each of the nine SSA countries, we compare the domestic value-added (DVA) and foreign value-added (FVA) content of gross exports as a share of total exported value added (VA) for a selection of manufacturing sectors.12 We calculate the average DVA and FVA content across these manufacturing sectors for each country in 2000 and 2011 (the latest year in which data are available). The results are compared across countries in the final row of Table A.2 in Appendix I.
The most striking country in terms of change between 2000 and 2011 is Ethiopia, where DVA content as a share of total exported VA was very low in 2000 (just 2.9%) but increased by nearly 39 percentage points to reach 41.8% in 2011.13 This suggests that the import dependence of Ethiopia’s manufacturing exports has declined substantially since 2000. In most of the other countries, the share of DVA content in total exported VA fell close to the range of 70–80% (Kenya and Tanzania are exceptions, with lower average DVA content of 62% and 68%, respectively, in 2011) and the changes in the relative shares of DVA and FVA content between 2000 and 2011 were relatively moderate (apart from in Tanzania and Rwanda).
We also look more closely at trends in trade in intermediate goods in each of the nine SSA countries (see Table A.3 in Appendix I).14 All countries recorded strong average annual growth in exports of intermediates between 2005 and 2014, with this growth most pronounced in Zambia, Ethiopia and Ghana. The growth in exports of intermediate goods may be indicative of rising participation in global value chains (GVCs). In turn, the varying degrees of growth in imports of intermediate goods in these countries may point to early progress in the establishment of transformative industries wherein foreign manufacturing inputs are processed locally for domestic use or re-exportation.
equipment (Rwanda, Tanzania); and inorganic chemicals (Zambia). In addition, there are other types of manufactures that also rank among the fastest growing in terms of exports, including photographic equipment/clocks (Ethiopia, Ghana); building fixtures (Ethiopia, Nigeria, Tanzania, Zambia); office/data-processing machines (Ethiopia, Kenya, Tanzania); manufactured fertilisers (Ghana, Mozambique); footwear (Ghana); chemical material/products nes (Mozambique, Nigeria, Rwanda, Uganda); plastics in non-primary form (Mozambique, Uganda); metalworking machinery (Nigeria, Rwanda); electrical equipment (Nigeria); power-generating equipment (Tanzania); travel goods, handbags, etc. (Uganda); and road vehicles (Zambia). 12 Electrical and machinery; food and beverages; metal products; petroleum, chemical and non-metallic mineral products; textiles and wearing apparel; transport equipment; wood and paper; and other manufacturing. The selection is determined by data availability. The data are sourced from the SET database (http://set.odi.org/data-portal/).
13 This is unsurprising given Ethiopia’s long-standing ban (in place since 1989) on exports of raw materials (hides and skin) in the leather sector. The ban is designed to encourage domestic value addition and boost revenues in the sector. 14 We classify intermediate goods as defined according to basic economic categories. This comprises the following: food and beverages, primary, mainly for industry; food and beverages, processed, mainly for industry; fuels and lubricants, primary; fuels and lubricants, processed (other than motor spirit); industrial supplies nes, primary; industrial supplies nes, processed; parts and accessories of capital goods (except transport equipment); parts and accessories of transport equipment.
DEVELOPING EXPORT-BASED MANUFACTURING IN SUB-SAHARAN AFRICA
11
4. TRENDS IN FDI TO AFRICA This section discusses the performance and patterns of FDI in the nine selected African countries. It looks at available data, starting with aggregate stocks and flows, and then examines their disaggregation by sector and by home country origin. It relies mainly on official data collected at national government level, by the central bank or the national statistical office of each country.
It is worth introducing a cautionary note right at the outset, regarding the FDI trends and patterns presented in this section. There are severe limitations in the FDI data for all countries, and these tend to be more severe for African countries, where data problems are rife owing to capacity and resource shortages in statistical offices in governments and central banks.15
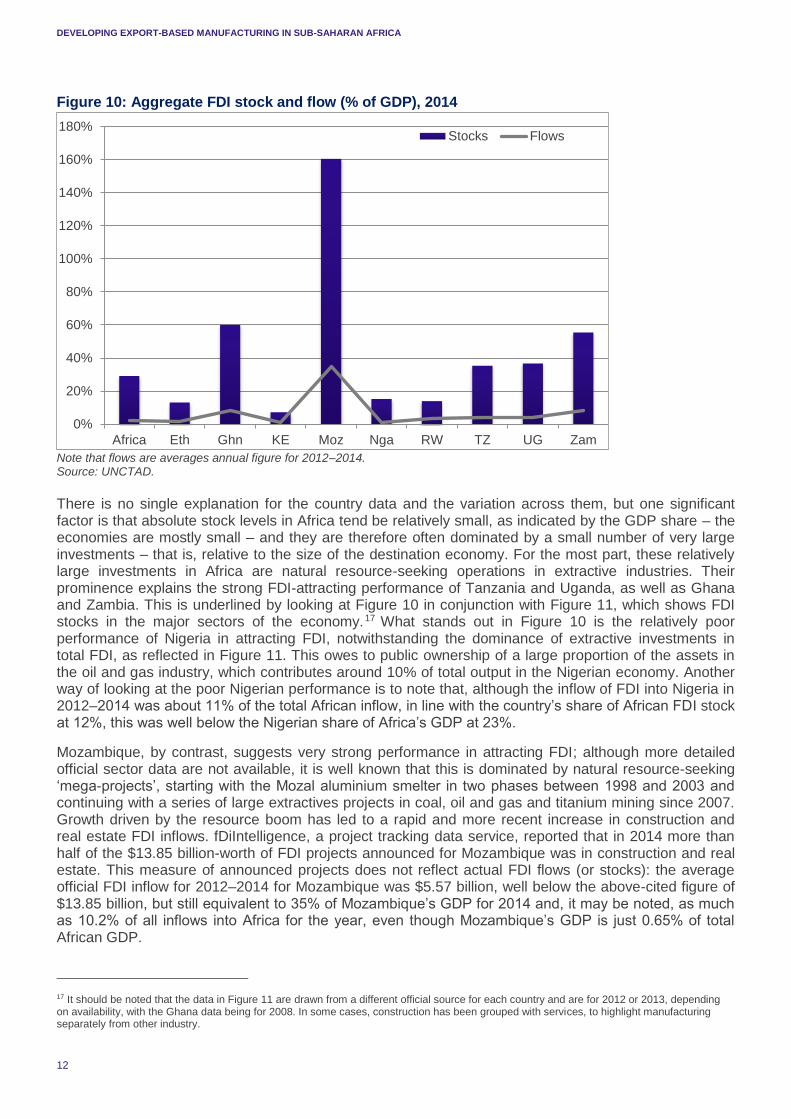
Notwithstanding the many caveats regarding the data, there is little alternative but to use available data to develop a picture of FDI patterns in the countries of interest. Figure 10 shows stocks and flows, normalised as a share of GDP, for Africa as a whole (including North Africa) and for the group of nine countries. The flow data reflect the average for the three years 2012–2014, since FDI inflows into small economies can fluctuate relatively strongly from year to year, as the presence or absence of a few large projects reflects strongly in the aggregate national data. The data are taken from the UN Conference on Trade and Development (UNCTAD) FDI database, but this simply collates and reports data provided to UNCTAD by each government’s agency for collecting FDI data. For Africa as a whole, the FDI stock is 29% of GDP, not far below the figure for the world as a whole, which is 33.6%. But Figure 10 reflects wide variation among the nine countries, with only Tanzania and Uganda in the neighbourhood of the continental and global averages. Mozambique’s stock is startlingly high at 160% of GDP, whereas Kenya, perhaps also surprisingly, is the lowest, at below 10% of GDP. The flows show similar variation to the stocks, being largest as a share of GDP for those countries where the stock share is highest – Mozambique, Ghana and Zambia.16 It is also worth reporting the growth rates for FDI stocks since 2000, at over 20% per annum (compound annual growth) for Ghana, Mozambique, Rwanda and Uganda and between 13% and 20% for Ethiopia and Tanzania. For Kenya, Nigeria and Zambia, the stock growth rate has been around 10% per annum since 2000.
15 The difficulties of collecting FDI data, which requires substantial investments of time and resources, more so than in the case of trade data, means FDI data are usually partial and not available on an annual basis. There has been limited standardisation of methods and approaches to data collection, so mirror data are often not an adequate substitute where countries’ own data are insufficient. The International Monetary Fund (IMF) has recently begun a process of constructing a comprehensive database – the Coordinated Direct Investment Survey (CDIS) – containing countries’ own stock data for inward and outward direct investments by origin and destination countries, together with the mirror data for the counterpart countries. The large number of gaps, where mirror data do not exist, as well as the huge disparities in corresponding entries for investment, illustrates some of the problems with existing data, even for investments between Organisation for Economic Co-operation and Development (OECD) countries. The CDIS over time should contribute to data improvement. Meanwhile, some standard difficulties with FDI data are worth mentioning briefly here. One is that some governments rely on foreign exchange transactions to track capital flows, measuring stocks as cumulated flows, so measuring FDI via cross-border flows, analogous to the measurements of goods trade. Some countries follow the more accurate approach of measuring foreign investment stocks by surveying operating enterprises in their jurisdiction regarding the foreign ownership of domestic assets and domestic ownership of foreign assets. For countries with limited statistical capacity, the former is often easier and cheaper to carry out but it is less effective as a measure since it excludes reinvested earnings and funds raised either in the host country or third countries. In the latter method, different approaches to the valuation of assets often introduces problems into the data. A further problem is the distortion of data disaggregated by country resulting from ‘third country routing’ whereby investments from Country A into Country B are routed via a subsidiary in Country C for reasons of tax benefits or capital controls or other regulations. Furthermore, at present, very few countries, even in the OECD, provide cross-tabulated data on a sector and partner country basis. 16 It is worth noting that the share of FDI stocks in GDP in South Africa is 45%, well above the African average.
DEVELOPING EXPORT-BASED MANUFACTURING IN SUB-SAHARAN AFRICA
12
Figure 10: Aggregate FDI stock and flow (% of GDP), 2014
Note that flows are averages annual figure for 2012–2014. Source: UNCTAD.
There is no single explanation for the country data and the variation across them, but one significant factor is that absolute stock levels in Africa tend be relatively small, as indicated by the GDP share – the economies are mostly small – and they are therefore often dominated by a small number of very large investments – that is, relative to the size of the destination economy. For the most part, these relatively large investments in Africa are natural resource-seeking operations in extractive industries. Their prominence explains the strong FDI-attracting performance of Tanzania and Uganda, as well as Ghana and Zambia. This is underlined by looking at Figure 10 in conjunction with Figure 11, which shows FDI stocks in the major sectors of the economy.17 What stands out in Figure 10 is the relatively poor performance of Nigeria in attracting FDI, notwithstanding the dominance of extractive investments in total FDI, as reflected in Figure 11. This owes to public ownership of a large proportion of the assets in the oil and gas industry, which contributes around 10% of total output in the Nigerian economy. Another way of looking at the poor Nigerian performance is to note that, although the inflow of FDI into Nigeria in 2012–2014 was about 11% of the total African inflow, in line with the country’s share of African FDI stock at 12%, this was well below the Nigerian share of Africa’s GDP at 23%.
Mozambique, by contrast, suggests very strong performance in attracting FDI; although more detailed official sector data are not available, it is well known that this is dominated by natural resource-seeking ‘mega-projects’, starting with the Mozal aluminium smelter in two phases between 1998 and 2003 and continuing with a series of large extractives projects in coal, oil and gas and titanium mining since 2007. Growth driven by the resource boom has led to a rapid and more recent increase in construction and real estate FDI inflows. fDiIntelligence, a project tracking data service, reported that in 2014 more than half of the $13.85 billion-worth of FDI projects announced for Mozambique was in construction and real estate. This measure of announced projects does not reflect actual FDI flows (or stocks): the average official FDI inflow for 2012–2014 for Mozambique was $5.57 billion, well below the above-cited figure of $13.85 billion, but still equivalent to 35% of Mozambique’s GDP for 2014 and, it may be noted, as much as 10.2% of all inflows into Africa for the year, even though Mozambique’s GDP is just 0.65% of total African GDP.
17 It should be noted that the data in Figure 11 are drawn from a different official source for each country and are for 2012 or 2013, depending on availability, with the Ghana data being for 2008. In some cases, construction has been grouped with services, to highlight manufacturing separately from other industry.
0%
20%
40%
60%
80%
100%
120%
140%
160%
180%
Africa Eth Ghn KE Moz Nga RW TZ UG Zam
Stocks Flows
DEVELOPING EXPORT-BASED MANUFACTURING IN SUB-SAHARAN AFRICA
13
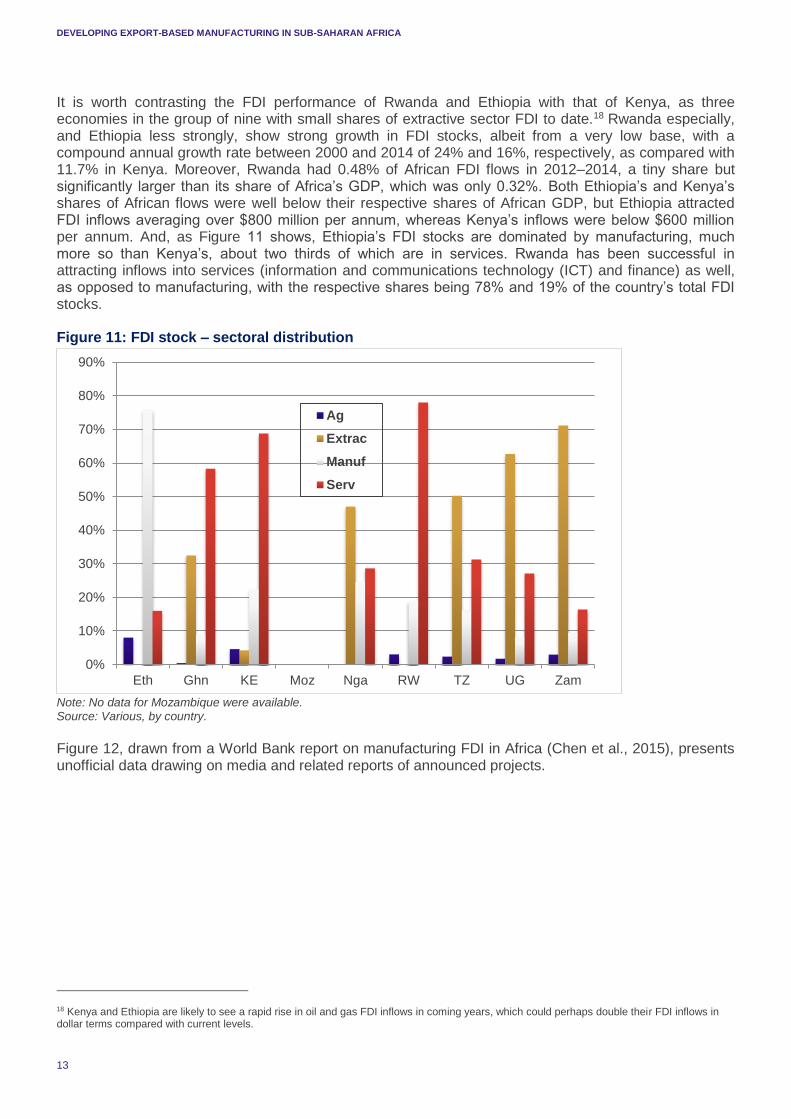
It is worth contrasting the FDI performance of Rwanda and Ethiopia with that of Kenya, as three economies in the group of nine with small shares of extractive sector FDI to date.18 Rwanda especially, and Ethiopia less strongly, show strong growth in FDI stocks, albeit from a very low base, with a compound annual growth rate between 2000 and 2014 of 24% and 16%, respectively, as compared with 11.7% in Kenya. Moreover, Rwanda had 0.48% of African FDI flows in 2012–2014, a tiny share but significantly larger than its share of Africa’s GDP, which was only 0.32%. Both Ethiopia’s and Kenya’s shares of African flows were well below their respective shares of African GDP, but Ethiopia attracted FDI inflows averaging over $800 million per annum, whereas Kenya’s inflows were below $600 million per annum. And, as Figure 11 shows, Ethiopia’s FDI stocks are dominated by manufacturing, much more so than Kenya’s, about two thirds of which are in services. Rwanda has been successful in attracting inflows into services (information and communications technology (ICT) and finance) as well, as opposed to manufacturing, with the respective shares being 78% and 19% of the country’s total FDI stocks.
Figure 11: FDI stock – sectoral distribution
Note: No data for Mozambique were available. Source: Various, by country.
Figure 12, drawn from a World Bank report on manufacturing FDI in Africa (Chen et al., 2015), presents unofficial data drawing on media and related reports of announced projects.
18 Kenya and Ethiopia are likely to see a rapid rise in oil and gas FDI inflows in coming years, which could perhaps double their FDI inflows in dollar terms compared with current levels.
0%
10%
20%
30%
40%
50%
60%
70%
80%
90%
Eth Ghn KE Moz Nga RW TZ UG Zam
Ag
Extrac
Manuf
Serv
DEVELOPING EXPORT-BASED MANUFACTURING IN SUB-SAHARAN AFRICA
14
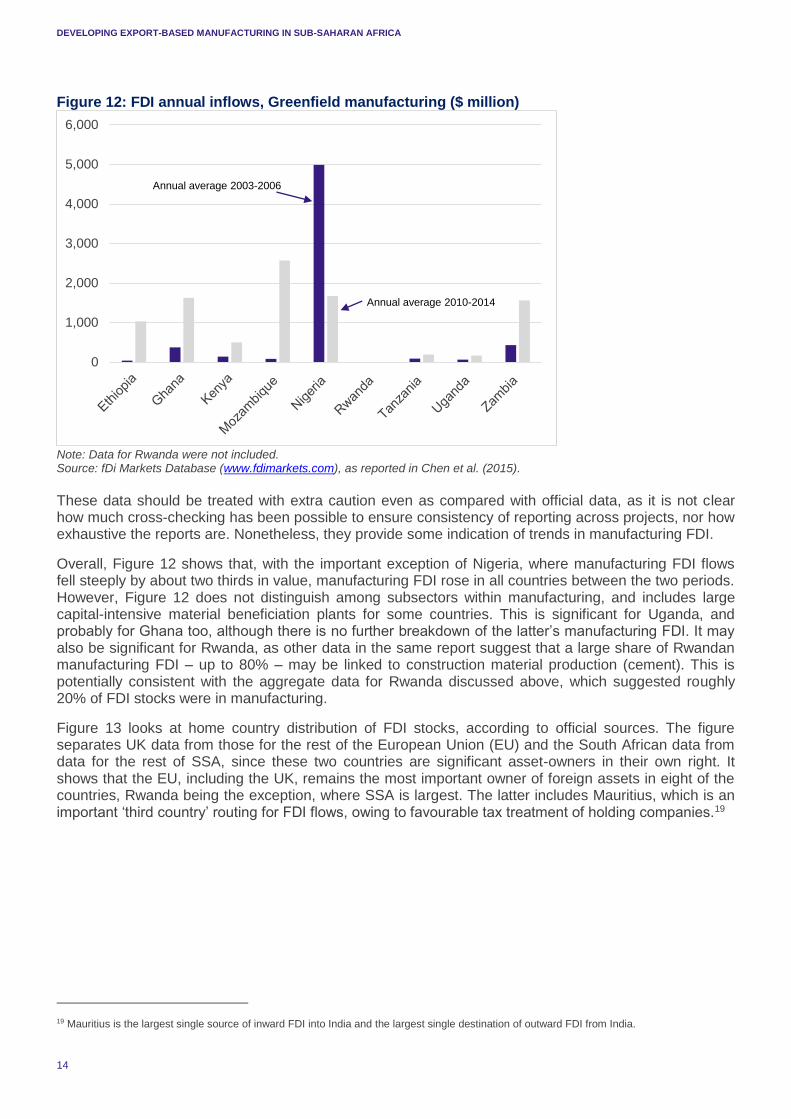
Figure 12: FDI annual inflows, Greenfield manufacturing ($ million)
Note: Data for Rwanda were not included. Source: fDi Markets Database (www.fdimarkets.com), as reported in Chen et al. (2015).
These data should be treated with extra caution even as compared with official data, as it is not clear how much cross-checking has been possible to ensure consistency of reporting across projects, nor how exhaustive the reports are. Nonetheless, they provide some indication of trends in manufacturing FDI.
Overall, Figure 12 shows that, with the important exception of Nigeria, where manufacturing FDI flows fell steeply by about two thirds in value, manufacturing FDI rose in all countries between the two periods. However, Figure 12 does not distinguish among subsectors within manufacturing, and includes large capital-intensive material beneficiation plants for some countries. This is significant for Uganda, and probably for Ghana too, although there is no further breakdown of the latter’s manufacturing FDI. It may also be significant for Rwanda, as other data in the same report suggest that a large share of Rwandan manufacturing FDI – up to 80% – may be linked to construction material production (cement). This is potentially consistent with the aggregate data for Rwanda discussed above, which suggested roughly 20% of FDI stocks were in manufacturing.
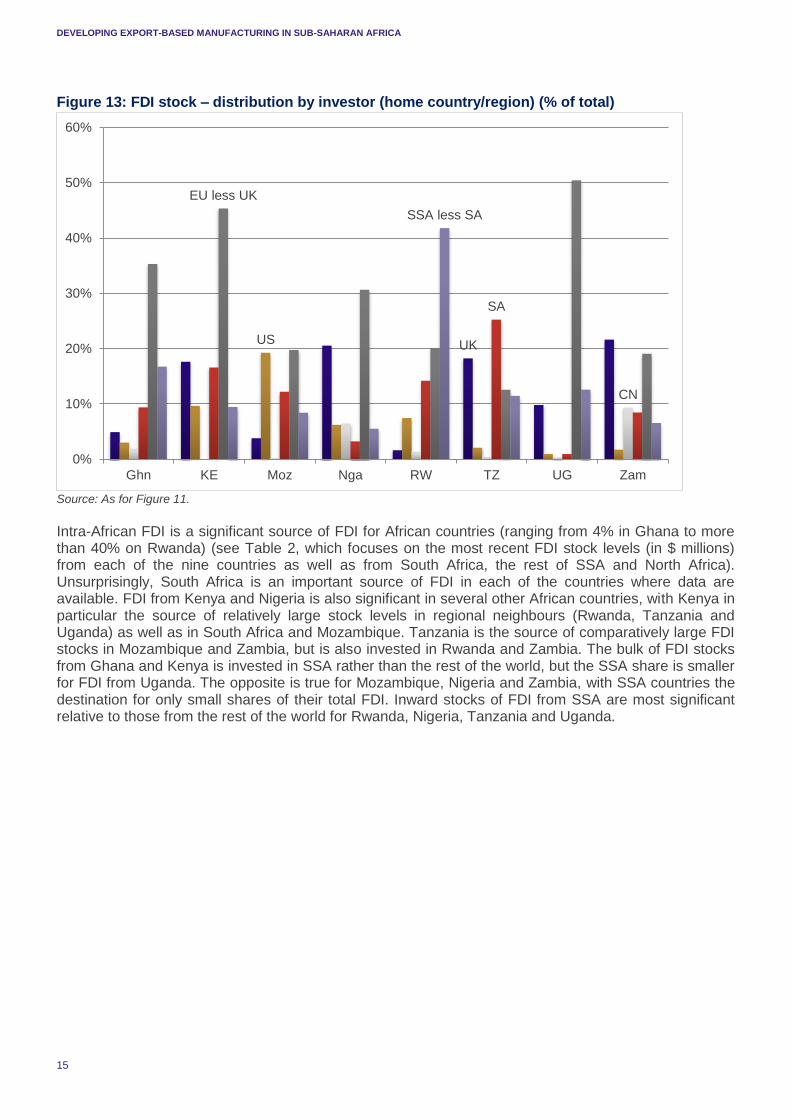
Figure 13 looks at home country distribution of FDI stocks, according to official sources. The figure separates UK data from those for the rest of the European Union (EU) and the South African data from data for the rest of SSA, since these two countries are significant asset-owners in their own right. It shows that the EU, including the UK, remains the most important owner of foreign assets in eight of the countries, Rwanda being the exception, where SSA is largest. The latter includes Mauritius, which is an important ‘third country’ routing for FDI flows, owing to favourable tax treatment of holding companies.19
19 Mauritius is the largest single source of inward FDI into India and the largest single destination of outward FDI from India.
0
1,000
2,000
3,000
4,000
5,000
6,000
Annual average 2003-2006
Annual average 2010-2014
DEVELOPING EXPORT-BASED MANUFACTURING IN SUB-SAHARAN AFRICA
15
Figure 13: FDI stock – distribution by investor (home country/region) (% of total)
Source: As for Figure 11.
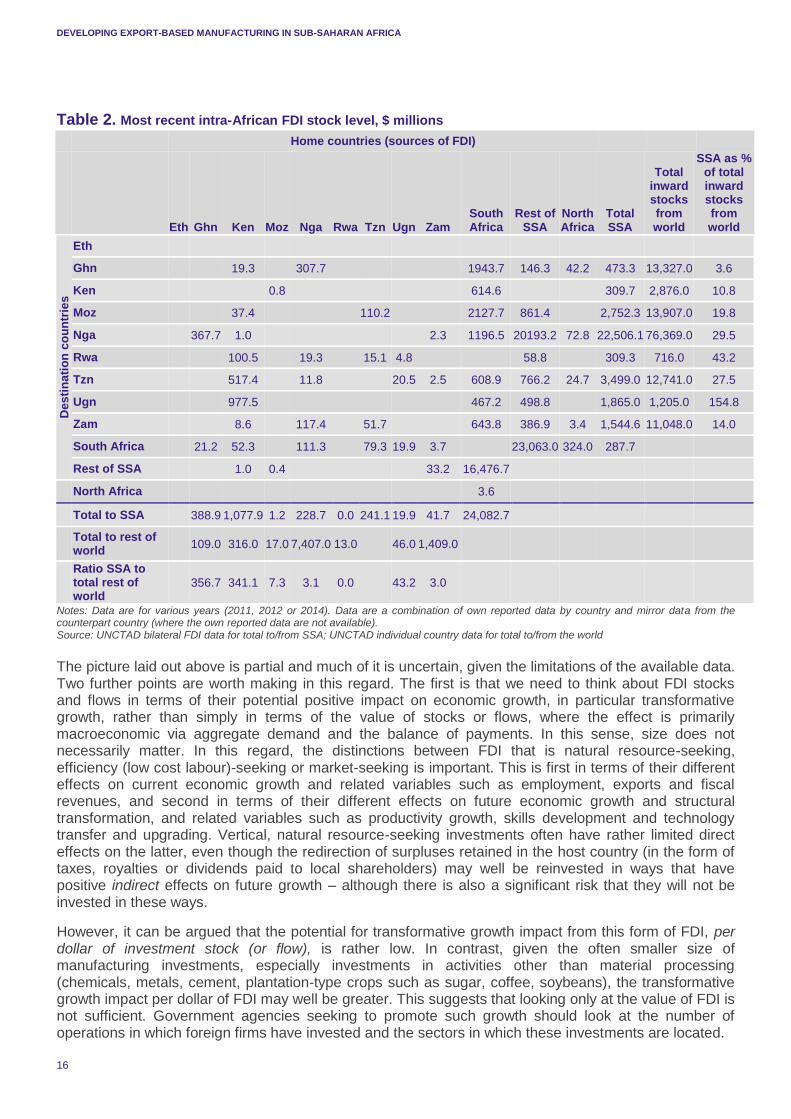
Intra-African FDI is a significant source of FDI for African countries (ranging from 4% in Ghana to more than 40% on Rwanda) (see Table 2, which focuses on the most recent FDI stock levels (in $ millions) from each of the nine countries as well as from South Africa, the rest of SSA and North Africa). Unsurprisingly, South Africa is an important source of FDI in each of the countries where data are available. FDI from Kenya and Nigeria is also significant in several other African countries, with Kenya in particular the source of relatively large stock levels in regional neighbours (Rwanda, Tanzania and Uganda) as well as in South Africa and Mozambique. Tanzania is the source of comparatively large FDI stocks in Mozambique and Zambia, but is also invested in Rwanda and Zambia. The bulk of FDI stocks from Ghana and Kenya is invested in SSA rather than the rest of the world, but the SSA share is smaller for FDI from Uganda. The opposite is true for Mozambique, Nigeria and Zambia, with SSA countries the destination for only small shares of their total FDI. Inward stocks of FDI from SSA are most significant relative to those from the rest of the world for Rwanda, Nigeria, Tanzania and Uganda.
UKUS
CN
SA
EU less UK
SSA less SA
0%
10%
20%
30%
40%
50%
60%
Ghn KE Moz Nga RW TZ UG Zam
DEVELOPING EXPORT-BASED MANUFACTURING IN SUB-SAHARAN AFRICA
16
Table 2. Most recent intra-African FDI stock level, $ millions
Home countries (sources of FDI)
Eth Ghn Ken Moz Nga Rwa Tzn Ugn Zam South Africa
Rest of SSA
North Africa
Total SSA
Total inward stocks from world
SSA as % of total inward stocks from world
De
sti
na
tio
n c
ou
ntr
ies
Eth
Ghn 19.3 307.7 1943.7 146.3 42.2 473.3 13,327.0 3.6
Ken 0.8 614.6 309.7 2,876.0 10.8
Moz 37.4 110.2 2127.7 861.4 2,752.3 13,907.0 19.8
Nga 367.7 1.0 2.3 1196.5 20193.2 72.8 22,506.1 76,369.0 29.5
Rwa 100.5 19.3 15.1 4.8 58.8 309.3 716.0 43.2
Tzn 517.4 11.8 20.5 2.5 608.9 766.2 24.7 3,499.0 12,741.0 27.5
Ugn 977.5 467.2 498.8 1,865.0 1,205.0 154.8
Zam 8.6 117.4 51.7 643.8 386.9 3.4 1,544.6 11,048.0 14.0
South Africa 21.2 52.3 111.3 79.3 19.9 3.7 23,063.0 324.0 287.7
Rest of SSA 1.0 0.4 33.2 16,476.7
North Africa 3.6
Total to SSA 388.9 1,077.9 1.2 228.7 0.0 241.1 19.9 41.7 24,082.7
Total to rest of world
109.0 316.0 17.0 7,407.0 13.0 46.0 1,409.0
Ratio SSA to total rest of world
356.7 341.1 7.3 3.1 0.0 43.2 3.0
Notes: Data are for various years (2011, 2012 or 2014). Data are a combination of own reported data by country and mirror data from the counterpart country (where the own reported data are not available). Source: UNCTAD bilateral FDI data for total to/from SSA; UNCTAD individual country data for total to/from the world
The picture laid out above is partial and much of it is uncertain, given the limitations of the available data. Two further points are worth making in this regard. The first is that we need to think about FDI stocks and flows in terms of their potential positive impact on economic growth, in particular transformative growth, rather than simply in terms of the value of stocks or flows, where the effect is primarily macroeconomic via aggregate demand and the balance of payments. In this sense, size does not necessarily matter. In this regard, the distinctions between FDI that is natural resource-seeking, efficiency (low cost labour)-seeking or market-seeking is important. This is first in terms of their different effects on current economic growth and related variables such as employment, exports and fiscal revenues, and second in terms of their different effects on future economic growth and structural transformation, and related variables such as productivity growth, skills development and technology transfer and upgrading. Vertical, natural resource-seeking investments often have rather limited direct effects on the latter, even though the redirection of surpluses retained in the host country (in the form of taxes, royalties or dividends paid to local shareholders) may well be reinvested in ways that have positive indirect effects on future growth – although there is also a significant risk that they will not be invested in these ways.
However, it can be argued that the potential for transformative growth impact from this form of FDI, per dollar of investment stock (or flow), is rather low. In contrast, given the often smaller size of manufacturing investments, especially investments in activities other than material processing (chemicals, metals, cement, plantation-type crops such as sugar, coffee, soybeans), the transformative growth impact per dollar of FDI may well be greater. This suggests that looking only at the value of FDI is not sufficient. Government agencies seeking to promote such growth should look at the number of operations in which foreign firms have invested and the sectors in which these investments are located.
DEVELOPING EXPORT-BASED MANUFACTURING IN SUB-SAHARAN AFRICA
17
In contrast, given the often smaller size of manufacturing investments, especially efficiency- and market-seeking investments that are in activities other than materials processing (chemicals, metals, cement, plantation-type crops such as sugar, coffee, soybeans and so on), the transformative growth impact per dollar of FDI may well be greater than for natural resource-seeking activities. This suggests that looking only at the value of FDI stocks and flows is not sufficient. Government agencies seeking to promote such growth should look at the number of operations in which foreign firms have invested and the sectors in which these investments are located, in addition to the value of the investments, as this will provide a useful guide to policies to enhance transformative growth.
The increased attention to, and resources devoted to, attracting potential Chinese manufacturing investment into Africa, as a result of developments in China’s own economy – the need for ‘rebalancing’ in China and the consequences for increased outward investment – is very positive from this perspective. There are already signs of increasing Chinese investment into African manufacturing, reflected in the well-known examples of Huajian Shoes in Ethiopia and C&H Garments in Rwanda (Manson, Financial Times, May 6 2015). These two labour-intensive light-manufacturing plants represent relatively small capital investment of a few million dollars each, and so are unlikely to have had a discernible impact on the dollar value of FDI flows or stocks reported in the charts here. But they have contributed to increases in manufacturing employment and exports, and likely also to productivity increases in manufacturing. Widespread emulation of these examples of successful investments could lead to significant upscaling of these outcomes.20
There is a second point about FDI flow and stock values, which reinforces the need to focus on the growth outcomes of FDI rather than on the FDI data and the value of inflows and/or assets. The increasing prevalence of GVCs involving non-equity modes of interaction between lead firms largely located in Organisation for Economic Co-operation and Development (OECD) countries, and input supplier and/or product assembly firms located in developing countries, means much (and increasing shares of) internationalised production is taking place without being reflected in FDI flows and stocks between the ‘home’ and ‘host’ economy. Activities in the host economy underpinning its participation in GVCs may be activities of domestic firms rather than foreign firms. The continuing pertinence of GVCs may in fact lead to lower FDI stocks and flows – at least in these subsectors – than ‘would have been’ the case in earlier periods when production was usually internalised within the multinational corporation and resulted in vertical investment. To the extent this is true (and we do not know the extent), this underlines the need to focus less on the value of FDI stock and flow variables, and indeed to develop new and different metrics of the internationalisation of production in any specific economy.
High returns on foreign investments would of course motivate increased inflows, but data on rates of return on foreign investments are scarce and unreliable. Only the UK Office of National Statistics (ONS) and the US Bureau for Economic Analysis (BEA) provide systematic information on FDI returns, and even here it is very limited for Africa. The BEA reports that returns to US foreign equity holdings in Africa were 8% in 2014, which was very similar to returns to US equity holdings globally (9%) and in Europe (8%). However, in manufacturing, returns in Africa of 4% were well below those globally (9%) and in Europe (10%), but they were above Asia and the Pacific (3%).21 The ONS reports only the return on equity for investments in Africa across all sectors for 2014, a rate of 9%, very similar to that of the US. It also reported rates of return for investments in Kenya (all sectors) at 15%, and for Nigeria, a scarcely credible 46%. The latter figure is hard to reconcile with the rather poor performance of Nigeria in attracting FDI inflows, as discussed above.
Of the group of countries of interest, only Rwanda reports data on rates of return: 16.1% for foreign investment across all sectors, 24% in manufacturing and 23% and 15% in extractives and services, respectively (National Bank of Rwanda, 2013). These numbers are much higher than those for US and UK investment in Africa, though the basis for the net profit estimate in the numerator is not clear.22
20 For discussion of the potential for economic transformation of Chinese FDI in Africa, see Tang (2015). 21 Returns to US investments in extractive sectors in Africa were 7%, and in services were highest at 12%. 22 The National Bank of Rwanda (2103) suggests the rate of return on equity for 2012 was 20%, implying it dropped by 4 percentage points between 2012 and 2013.
DEVELOPING EXPORT-BASED MANUFACTURING IN SUB-SAHARAN AFRICA
18
5. IDENTIFYING OPPORTUNITIES IN AFRICAN MANUFACTURING
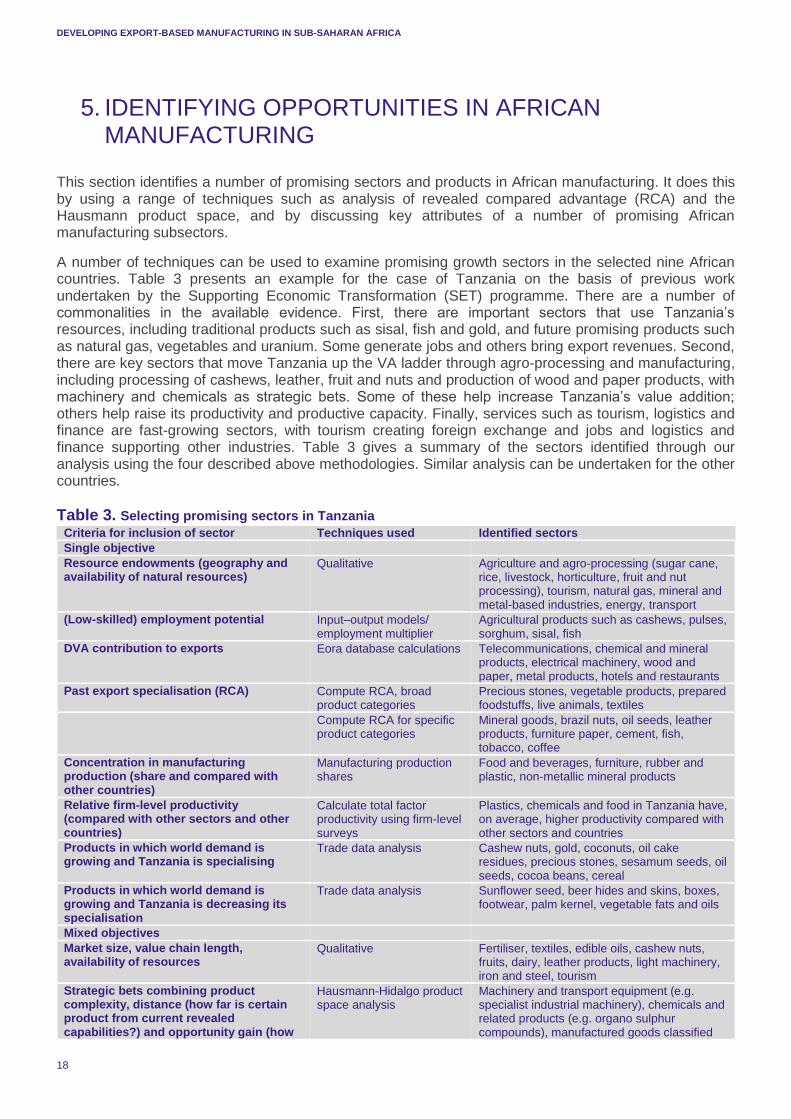
This section identifies a number of promising sectors and products in African manufacturing. It does this by using a range of techniques such as analysis of revealed compared advantage (RCA) and the Hausmann product space, and by discussing key attributes of a number of promising African manufacturing subsectors.
A number of techniques can be used to examine promising growth sectors in the selected nine African countries. Table 3 presents an example for the case of Tanzania on the basis of previous work undertaken by the Supporting Economic Transformation (SET) programme. There are a number of commonalities in the available evidence. First, there are important sectors that use Tanzania’s resources, including traditional products such as sisal, fish and gold, and future promising products such as natural gas, vegetables and uranium. Some generate jobs and others bring export revenues. Second, there are key sectors that move Tanzania up the VA ladder through agro-processing and manufacturing, including processing of cashews, leather, fruit and nuts and production of wood and paper products, with machinery and chemicals as strategic bets. Some of these help increase Tanzania’s value addition; others help raise its productivity and productive capacity. Finally, services such as tourism, logistics and finance are fast-growing sectors, with tourism creating foreign exchange and jobs and logistics and finance supporting other industries. Table 3 gives a summary of the sectors identified through our analysis using the four described above methodologies. Similar analysis can be undertaken for the other countries.
Table 3. Selecting promising sectors in Tanzania
Criteria for inclusion of sector Techniques used Identified sectors
Single objective
Resource endowments (geography and availability of natural resources)
Qualitative Agriculture and agro-processing (sugar cane, rice, livestock, horticulture, fruit and nut processing), tourism, natural gas, mineral and metal-based industries, energy, transport
(Low-skilled) employment potential Input–output models/ employment multiplier
Agricultural products such as cashews, pulses, sorghum, sisal, fish
DVA contribution to exports Eora database calculations Telecommunications, chemical and mineral products, electrical machinery, wood and paper, metal products, hotels and restaurants
Past export specialisation (RCA) Compute RCA, broad product categories
Precious stones, vegetable products, prepared foodstuffs, live animals, textiles
Compute RCA for specific product categories
Mineral goods, brazil nuts, oil seeds, leather products, furniture paper, cement, fish, tobacco, coffee
Concentration in manufacturing production (share and compared with other countries)
Manufacturing production shares
Food and beverages, furniture, rubber and plastic, non-metallic mineral products
Relative firm-level productivity (compared with other sectors and other countries)
Calculate total factor productivity using firm-level surveys
Plastics, chemicals and food in Tanzania have, on average, higher productivity compared with other sectors and countries
Products in which world demand is growing and Tanzania is specialising
Trade data analysis Cashew nuts, gold, coconuts, oil cake residues, precious stones, sesamum seeds, oil seeds, cocoa beans, cereal
Products in which world demand is growing and Tanzania is decreasing its specialisation
Trade data analysis Sunflower seed, beer hides and skins, boxes, footwear, palm kernel, vegetable fats and oils
Mixed objectives
Market size, value chain length, availability of resources
Qualitative Fertiliser, textiles, edible oils, cashew nuts, fruits, dairy, leather products, light machinery, iron and steel, tourism
Strategic bets combining product complexity, distance (how far is certain product from current revealed capabilities?) and opportunity gain (how
Hausmann-Hidalgo product space analysis
Machinery and transport equipment (e.g. specialist industrial machinery), chemicals and related products (e.g. organo sulphur compounds), manufactured goods classified
DEVELOPING EXPORT-BASED MANUFACTURING IN SUB-SAHARAN AFRICA
19
Criteria for inclusion of sector Techniques used Identified sectors
strategic is product in terms of its proximity/connectedness to other complex products?)
chiefly by material (e.g. glass sheets), miscellaneous manufactured articles (e.g. microscopes)
Products Tanzania does not export but that are ‘close’ to the one it is already exporting
Hausmann-Hidalgo product space analysis
Agriculture: rice, nuts, vegetables (cucumbers and lettuce), agro-business: preserved fruits and processed meat, manufacturing: sheepskins, rubber tires, wool, silk, paper and pulp products, hand-woven tapestries
Employment potential, growth capacity and capacity to produce
RCA, Hausmann-Hidalgo High-value vegetables and fruits, processed grains and wheat, processed meat, wood products, paper products, leather processing, tourism
Growth potential; shifting from low- to high-productivity sectors; employment creation
RCA, Hausmann-Hidalgo and Justin Lin’s Growth Identification Framework
Tourism, wood, leather, agro-processing
Natural resource and ability to boost labour-intensive industrialisation path.
Qualitative Natural gas, iron and steel, agro-processing, minerals
Stakeholder views
Employment intensity of industries given structure of labour force and intensive use of local raw materials
Private sector stakeholder analysis
Pulp and paper, cashew processing, leather industries, textiles, mineral beneficiation
Source: SET work in Tanzania.
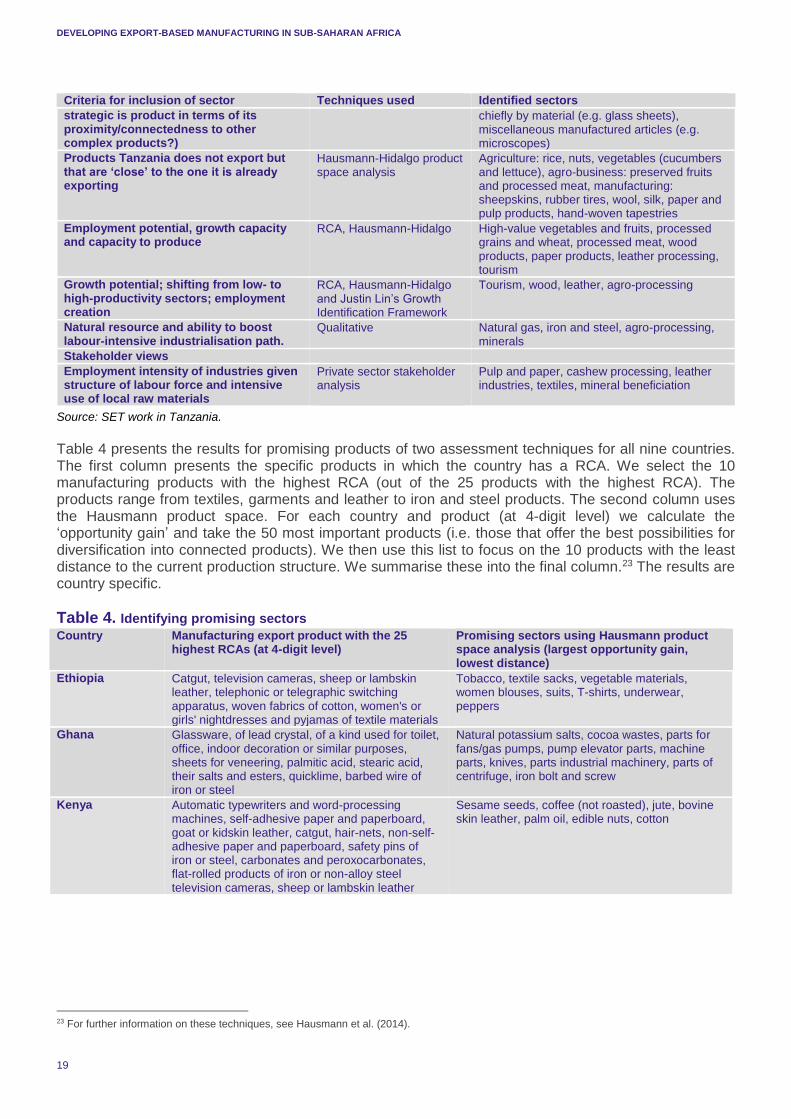
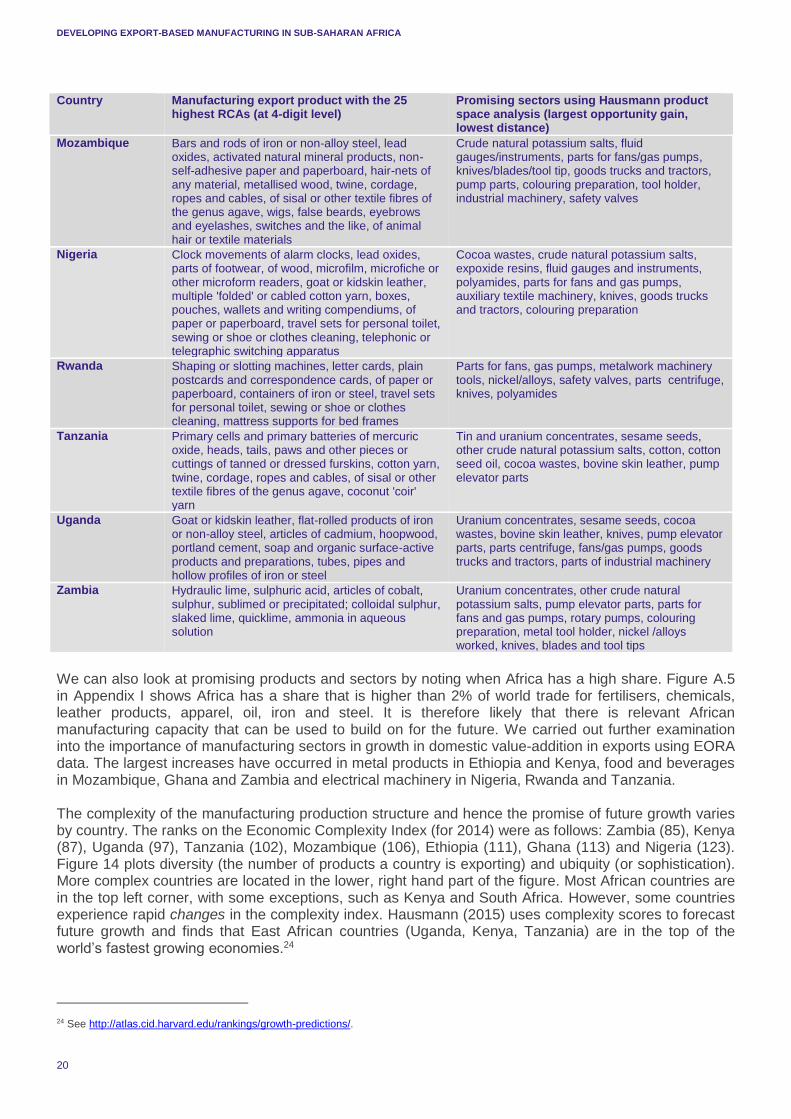
Table 4 presents the results for promising products of two assessment techniques for all nine countries. The first column presents the specific products in which the country has a RCA. We select the 10 manufacturing products with the highest RCA (out of the 25 products with the highest RCA). The products range from textiles, garments and leather to iron and steel products. The second column uses the Hausmann product space. For each country and product (at 4-digit level) we calculate the ‘opportunity gain’ and take the 50 most important products (i.e. those that offer the best possibilities for diversification into connected products). We then use this list to focus on the 10 products with the least distance to the current production structure. We summarise these into the final column.23 The results are country specific.
Table 4. Identifying promising sectors
Country Manufacturing export product with the 25 highest RCAs (at 4-digit level)
Promising sectors using Hausmann product space analysis (largest opportunity gain, lowest distance)
Ethiopia Catgut, television cameras, sheep or lambskin leather, telephonic or telegraphic switching apparatus, woven fabrics of cotton, women's or girls' nightdresses and pyjamas of textile materials
Tobacco, textile sacks, vegetable materials, women blouses, suits, T-shirts, underwear, peppers
Ghana Glassware, of lead crystal, of a kind used for toilet, office, indoor decoration or similar purposes, sheets for veneering, palmitic acid, stearic acid, their salts and esters, quicklime, barbed wire of iron or steel
Natural potassium salts, cocoa wastes, parts for fans/gas pumps, pump elevator parts, machine parts, knives, parts industrial machinery, parts of centrifuge, iron bolt and screw
Kenya Automatic typewriters and word-processing machines, self-adhesive paper and paperboard, goat or kidskin leather, catgut, hair-nets, non-self-adhesive paper and paperboard, safety pins of iron or steel, carbonates and peroxocarbonates, flat-rolled products of iron or non-alloy steel television cameras, sheep or lambskin leather
Sesame seeds, coffee (not roasted), jute, bovine skin leather, palm oil, edible nuts, cotton
23 For further information on these techniques, see Hausmann et al. (2014).
DEVELOPING EXPORT-BASED MANUFACTURING IN SUB-SAHARAN AFRICA
20
Country Manufacturing export product with the 25 highest RCAs (at 4-digit level)
Promising sectors using Hausmann product space analysis (largest opportunity gain, lowest distance)
Mozambique Bars and rods of iron or non-alloy steel, lead oxides, activated natural mineral products, non-self-adhesive paper and paperboard, hair-nets of any material, metallised wood, twine, cordage, ropes and cables, of sisal or other textile fibres of the genus agave, wigs, false beards, eyebrows and eyelashes, switches and the like, of animal hair or textile materials
Crude natural potassium salts, fluid gauges/instruments, parts for fans/gas pumps, knives/blades/tool tip, goods trucks and tractors, pump parts, colouring preparation, tool holder, industrial machinery, safety valves
Nigeria Clock movements of alarm clocks, lead oxides, parts of footwear, of wood, microfilm, microfiche or other microform readers, goat or kidskin leather, multiple 'folded' or cabled cotton yarn, boxes, pouches, wallets and writing compendiums, of paper or paperboard, travel sets for personal toilet, sewing or shoe or clothes cleaning, telephonic or telegraphic switching apparatus
Cocoa wastes, crude natural potassium salts, expoxide resins, fluid gauges and instruments, polyamides, parts for fans and gas pumps, auxiliary textile machinery, knives, goods trucks and tractors, colouring preparation
Rwanda Shaping or slotting machines, letter cards, plain postcards and correspondence cards, of paper or paperboard, containers of iron or steel, travel sets for personal toilet, sewing or shoe or clothes cleaning, mattress supports for bed frames
Parts for fans, gas pumps, metalwork machinery tools, nickel/alloys, safety valves, parts centrifuge, knives, polyamides
Tanzania Primary cells and primary batteries of mercuric oxide, heads, tails, paws and other pieces or cuttings of tanned or dressed furskins, cotton yarn, twine, cordage, ropes and cables, of sisal or other textile fibres of the genus agave, coconut 'coir' yarn
Tin and uranium concentrates, sesame seeds, other crude natural potassium salts, cotton, cotton seed oil, cocoa wastes, bovine skin leather, pump elevator parts
Uganda Goat or kidskin leather, flat-rolled products of iron or non-alloy steel, articles of cadmium, hoopwood, portland cement, soap and organic surface-active products and preparations, tubes, pipes and hollow profiles of iron or steel
Uranium concentrates, sesame seeds, cocoa wastes, bovine skin leather, knives, pump elevator parts, parts centrifuge, fans/gas pumps, goods trucks and tractors, parts of industrial machinery
Zambia Hydraulic lime, sulphuric acid, articles of cobalt, sulphur, sublimed or precipitated; colloidal sulphur, slaked lime, quicklime, ammonia in aqueous solution
Uranium concentrates, other crude natural potassium salts, pump elevator parts, parts for fans and gas pumps, rotary pumps, colouring preparation, metal tool holder, nickel /alloys worked, knives, blades and tool tips
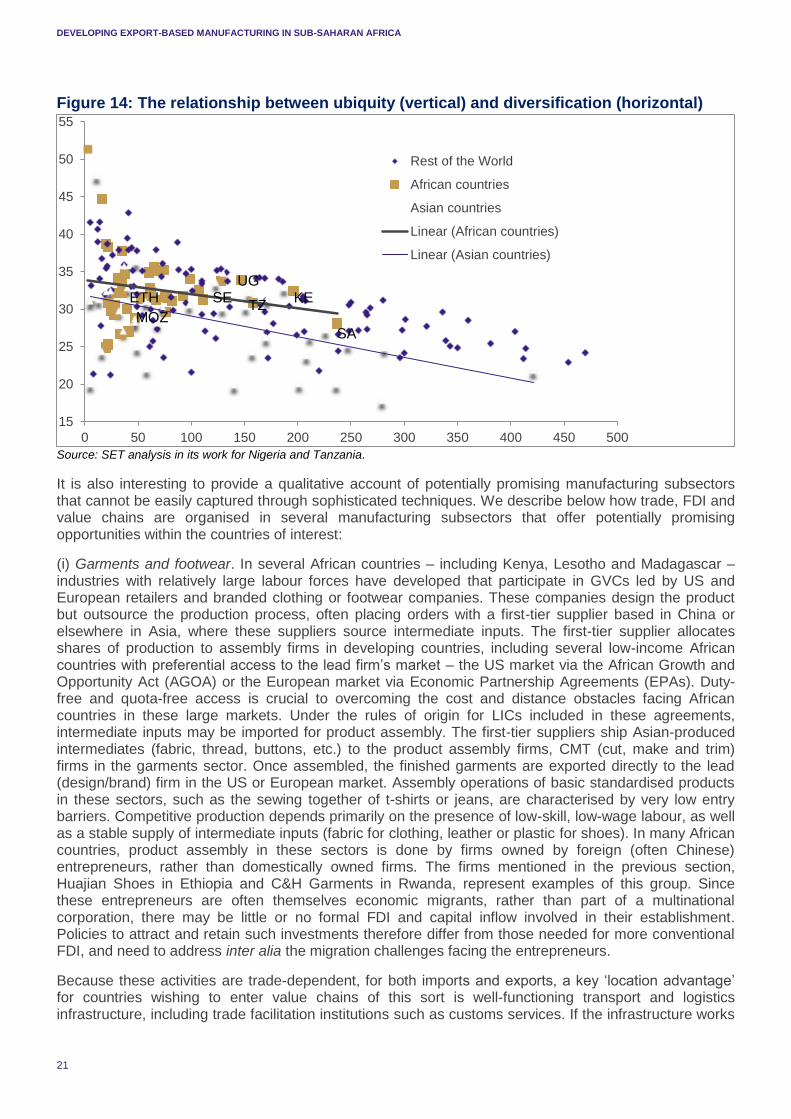
We can also look at promising products and sectors by noting when Africa has a high share. Figure A.5 in Appendix I shows Africa has a share that is higher than 2% of world trade for fertilisers, chemicals, leather products, apparel, oil, iron and steel. It is therefore likely that there is relevant African manufacturing capacity that can be used to build on for the future. We carried out further examination into the importance of manufacturing sectors in growth in domestic value-addition in exports using EORA data. The largest increases have occurred in metal products in Ethiopia and Kenya, food and beverages in Mozambique, Ghana and Zambia and electrical machinery in Nigeria, Rwanda and Tanzania. The complexity of the manufacturing production structure and hence the promise of future growth varies by country. The ranks on the Economic Complexity Index (for 2014) were as follows: Zambia (85), Kenya (87), Uganda (97), Tanzania (102), Mozambique (106), Ethiopia (111), Ghana (113) and Nigeria (123). Figure 14 plots diversity (the number of products a country is exporting) and ubiquity (or sophistication). More complex countries are located in the lower, right hand part of the figure. Most African countries are in the top left corner, with some exceptions, such as Kenya and South Africa. However, some countries experience rapid changes in the complexity index. Hausmann (2015) uses complexity scores to forecast future growth and finds that East African countries (Uganda, Kenya, Tanzania) are in the top of the world’s fastest growing economies.24
24 See http://atlas.cid.harvard.edu/rankings/growth-predictions/.
DEVELOPING EXPORT-BASED MANUFACTURING IN SUB-SAHARAN AFRICA
21
Figure 14: The relationship between ubiquity (vertical) and diversification (horizontal)
Source: SET analysis in its work for Nigeria and Tanzania.
It is also interesting to provide a qualitative account of potentially promising manufacturing subsectors that cannot be easily captured through sophisticated techniques. We describe below how trade, FDI and value chains are organised in several manufacturing subsectors that offer potentially promising opportunities within the countries of interest:
(i) Garments and footwear. In several African countries – including Kenya, Lesotho and Madagascar – industries with relatively large labour forces have developed that participate in GVCs led by US and European retailers and branded clothing or footwear companies. These companies design the product but outsource the production process, often placing orders with a first-tier supplier based in China or elsewhere in Asia, where these suppliers source intermediate inputs. The first-tier supplier allocates shares of production to assembly firms in developing countries, including several low-income African countries with preferential access to the lead firm’s market – the US market via the African Growth and Opportunity Act (AGOA) or the European market via Economic Partnership Agreements (EPAs). Duty-free and quota-free access is crucial to overcoming the cost and distance obstacles facing African countries in these large markets. Under the rules of origin for LICs included in these agreements, intermediate inputs may be imported for product assembly. The first-tier suppliers ship Asian-produced intermediates (fabric, thread, buttons, etc.) to the product assembly firms, CMT (cut, make and trim) firms in the garments sector. Once assembled, the finished garments are exported directly to the lead (design/brand) firm in the US or European market. Assembly operations of basic standardised products in these sectors, such as the sewing together of t-shirts or jeans, are characterised by very low entry barriers. Competitive production depends primarily on the presence of low-skill, low-wage labour, as well as a stable supply of intermediate inputs (fabric for clothing, leather or plastic for shoes). In many African countries, product assembly in these sectors is done by firms owned by foreign (often Chinese) entrepreneurs, rather than domestically owned firms. The firms mentioned in the previous section, Huajian Shoes in Ethiopia and C&H Garments in Rwanda, represent examples of this group. Since these entrepreneurs are often themselves economic migrants, rather than part of a multinational corporation, there may be little or no formal FDI and capital inflow involved in their establishment. Policies to attract and retain such investments therefore differ from those needed for more conventional FDI, and need to address inter alia the migration challenges facing the entrepreneurs.
Because these activities are trade-dependent, for both imports and exports, a key ‘location advantage’ for countries wishing to enter value chains of this sort is well-functioning transport and logistics infrastructure, including trade facilitation institutions such as customs services. If the infrastructure works
15
20
25
30
35
40
45
50
55
0 50 100 150 200 250 300 350 400 450 500
Rest of the World
African countries
Asian countries
Linear (African countries)
Linear (Asian countries)
ETH SEUG
MOZTZ
KE
SA
DEVELOPING EXPORT-BASED MANUFACTURING IN SUB-SAHARAN AFRICA
22
well, being landlocked is not necessarily a barrier to a country’s participation in these GVCs, as the large garment sector in Lesotho illustrates.
The challenge facing African governments in these sectors is two-fold. Among the nine countries of interest, only Kenya has built a very substantial presence in garment assembly, supplying the US market. There is considerable scope in the other countries to expand output, employment and exports from the sector, to the US and Europe. Notwithstanding the low domestic VA per unit of output in these activities, they represent significant structural change and productivity gain, in bringing thousands of people (usually disproportionately female) into formal employment from rural or informal urban activities, as well as boosting manufacturing exports, even though domestic VA is often very low owing to the high share of imported intermediates. Lead firms and first-tier suppliers engage actively with lower tier suppliers and assemblers to improve product quality and plant efficiency among the latter through workforce skills development, activities often supported by governments and donor agencies.
However, the second challenge is to move from a once-off increase in productivity when people are first employed in these activities to ongoing and sustainable productivity increases, which would result from firms in the domestic industry (whether domestic-owned or foreign) moving beyond the status of ‘captive suppliers’ of product assembly services using intermediates sourced and supplied by their large international producer customers. What is needed here are policies and interventions to support management capability development, to supplement those focused on infrastructure and workforce skills development.
(ii) Horticulture. In several African countries, notably Ethiopia, Ghana, Kenya, Tanzania and Uganda among the countries of interest, substantial industries processing fresh fruit and vegetables and/or cut flowers for exports have emerged over the past 20 years. These sectors are now employing large numbers of people in crop-growing activities that are usually a mix of small-scale independent farmers and large-scale industrial-type farms, with a larger share in processing and logistics activities, serving large export markets in Europe. The lead firms in GVCs in these activities are usually European supermarkets or flower wholesalers, which do not themselves own or operate production or distribution operations in the supplier countries but work with locally owned firms that are their first or second-tier suppliers. Thus in this sector too internationalised production is not reflected in capital inflows or in FDI data.
In Kenya, probably the most successful country in this sector among the nine countries of interest, an estimated 200,000 people are employed in the sector, of whom fewer than 10,000 are small-scale growers.25 They provide over $1 billion in exports annually, about 20% of total Kenyan goods exports. But Kenya supplies a very small share of EU imports of fresh fruits and vegetables, possibly below 1%, suggesting there is considerable scope for output, employment and productivity growth in the countries of interest.
The challenges in this sector from an economic transformation perspective are similar to those in garments. First, the scope of activities carried out by local firms in Africa is limited, and largely restricted to packaging and refrigeration, plus export logistics and distribution. Product quality and delivery standards imposed by lead firms have led to substantial productivity improvements among growers and distributors, including in logistics and distribution installations. There is considerable scope for local firms to enter new markets for the products and services they are already producing, and to expand their product range, even if the nature of the value chains limits the scope for local firms to move into new segments. Second, the transport (roads and air) and trade facilitation infrastructure is crucial in this industry, given the need for products to remain fresh until they reach the retail stage.
(iii) Automobiles. An incipient auto industry exists in several of the countries of interest. In Nigeria, eight assembly plants operated until the 1980s, in partnership with European producers such as Volkswagen and Peugeot, but the sector collapsed in the 1990s; only three plants have survived, albeit not very successfully. The market is large, however, and has been served via imports of new and used vehicles.
25 Small-scale growers in the horticulture GVCs are generally much higher-productivity farmers than those involved in subsistence or local-market production.
DEVELOPING EXPORT-BASED MANUFACTURING IN SUB-SAHARAN AFRICA
23
There is now an attempt by the Nigerian government to revive the industry, and several European and Asian assemblers – Ford, Nissan, Hyundai, Kia, Honda and Tata – have announced plans to establish assembly operations. Twelve licences were awarded to prospective assemblers in late 2015, including three Chinese assemblers. Several of the licences involve joint ventures with Nigerian partners. In Kenya, several companies have small assembly operations that are in the process of being expanded, including a total of $85 million in current new investment by Hyundai, Tata and Foton (a Chinese truck and commercial vehicle assembler). Ethiopia has two Chinese assembly operations, Lifan and Geely. The latter has doubled its capacity since opening in 2007, but 80–90% of the components used are imported. Toyota has a small assembly plant in Tanzania, as well as a presence in Kenya. Many other European and Asian auto assembly firms have investments in African countries in sales and distribution, as well as after-sales services, which are commonly used in the auto industry as precursors to more substantial investments in assembly plants. In sum, the auto industry across the nine countries of interest is at a point where there is considerable potential for rapid expansion. The Nigerian government argues that the assembly industry could provide as many as 70,000 jobs directly, and another 200,000 indirectly, in components production and after-sales services. In addition, there are potential export benefits, although the increase in imported inputs and equipment needs to be taken into account.
The structure of the auto GVC means the entry of auto assemblers will involve capital inflows and be reflected in the FDI data. More significantly, the GVC structure implies specific policies to attract entrants and establish the industry. The Nigerian government is primarily using the traditional instruments of tariff policy to encourage entry, raising tariffs on fully assembled vehicle imports including used car imports and lowering tariffs on semi-/completely knocked-down kits involving component imports. As experience elsewhere has demonstrated, this policy approach, if used alone, can lead to the emergence of uncompetitive low-productivity, and hence unsustainable, industry. There is also some danger that awarding too many licences could lead to over-capacity in Nigeria. The possible expansion plans of firms in several of the countries of focus here could have the same damaging outcome at a regional level. Thus, promoting investment by assemblers into African economies has to be directed carefully. What is also crucial to long-term success in building an auto industry, and also for the transformative growth impact of the industry, is to attract investment also into component production – that is, not restricting the focus to assembly alone. Many of the European and Asian assemblers have global suppliers for key product components, and investment in economies such as Nigeria and Kenya by these first-tier suppliers in the assemblers in the auto GVC would increase the potential backward linkages. This might offer opportunities to local firms, raising growth as well as its transformative effects via technology and skills diffusion and hence productivity increases. (iv) Fast-moving consumer goods. This sector (known as FMCG) encompasses products such as cosmetics and soaps, household cleaning products and processed food (such as dairy products, beer and soft drinks). Rising per capita incomes over the past 15 years or so in many of the countries of interest here, the low price per unit cost of products in the sector and the rapid pace of urbanisation many of the large multinational corporate producers in the sector see Africa as a major market growth opportunity over the next two decades. Production processes here are often not complex, but distribution is key to producer success in the sector and relies on good logistics and transport infrastructure. It also relies on an extensive retail network, which has increased rapidly in the countries of interest over the past 15 years, illustrating the complementarity between foreign investments in services and manufacturing. Growing domestic FMCG production will raise overall manufacturing productivity and have a positive impact on transformative growth. Lead firms, which usually have designed the product and, importantly, own the brand, tend to make extensive use of local input suppliers and even producers of finished products, because many of the goods need to be produced close to their sales, for reasons of freshness and quality. As a result, FDI in this industry often offers numerous backward linkage opportunities, with the attendant spillovers in terms of product and process quality upgrading and skills and technology transfers. A major challenge to attracting investment into the sector is the regulatory environment for product standards, which can be a deterrent if overly complex and if regulations in different jurisdictions are not well harmonised and deter trade in finished products.
These qualitative accounts and the calculations using standard techniques indicate there are some very interesting opportunities in African manufacturing.
DEVELOPING EXPORT-BASED MANUFACTURING IN SUB-SAHARAN AFRICA
24
6. REALISING OPPORTUNITIES IN AFRICAN MANUFACTURING
This section discusses what needs to be done to realise the opportunities in African manufacturing. Section 6.1 discusses the determinants of exports and FDI into manufacturing. Section 6.2 then discusses how the selected African countries are placed to take advantage of the new opportunities. Section 6.3 concludes by arguing that it is up to countries to position themselves to take advantage of the new manufacturing opportunities such as the rebalancing in China.
6.1 DETERMINANTS OF TRADE AND FDI IN MANUFACTURING
A range of different factors influence the ability of African countries to export manufactures, compete effectively in global markets for manufactured products and attract FDI into export-based manufacturing. In this subsection we highlight several important factors, including general determinants of African manufacturing trade and FDI, and recent trends in the global economy that present opportunities for African countries to boost trade and investment in the manufacturing sector.
We focus initially on determinants of African manufacturing trade although, as we argue later, many of these are relevant factors in attracting FDI as well. General determinants of manufacturing trade include factors that influence (1) access to markets for manufactures and (2) the ability of individual countries to produce particular types of export-based manufactures competitively. Access to markets has several components. One is proximity to key markets. At a fundamental level, the selected African countries with coastal access – Ghana, Kenya, Mozambique, Nigeria, Tanzania – have a natural advantage over the landlocked countries (Ethiopia, Rwanda, Uganda, Zambia) in that they have ready access to overseas markets through their ports. As a result, manufactures produced in these countries do not first have to transit through another country en route to key overseas markets. Certain countries also benefit from being located closer to large centres of demand for manufactures (either regionally or outside the African continent).
Access to markets for manufacturing exports is also influenced by membership in trade agreements, which provide export opportunities through preferential access into certain markets. For instance, AGOA permits tariff- and quota-free access for exports to the US from certain countries in SSA, providing them an advantage over competing exporters such as Bangladesh and China. Among the selected countries, the LDCs (Ethiopia, Mozambique, Rwanda, Uganda, Tanzania and Zambia) are also beneficiaries of the Everything But Arms (EBA) arrangement under which their exports to the EU are duty- and quota-free. In addition, growth in intra-African trade in manufactures has been spurred by the liberalisation of trade within African regional economic communities, and may be boosted further by the ongoing efforts to establish the Tripartite Free Trade Area (involving the Southern African Development Community, the Common Market for Eastern and Southern Africa and the East African Community (EAC)).
Importantly, however, the rising tide of protectionist policies and other trade restrictions worldwide threatens to undermine market access for manufactured products. For example, the G20 countries have since 2014 tended to disproportionately impose trade restrictions on manufactured products (Evenett and Fritz, 2015). Moreover, the growing number of free trade agreements (FTAs) globally is increasingly eroding the preferential access certain African countries enjoy to developed country markets through North–South trade agreements, with similar preferences extended to other non-African countries that are party to FTAs with these countries (Mendez-Parra et al., 2015). Furthermore, the role of trade agreements in facilitating diversification in manufacturing exports from Africa is not always clear. Studies show AGOA has not had a large impact on non-energy imports to the US from eligible countries. Between 2008 and 2013, crude petroleum accounted for 90%, on average, of US imports under AGOA. Moreover, 89% of non-petroleum exports were made up of transportation equipment, mostly from South
DEVELOPING EXPORT-BASED MANUFACTURING IN SUB-SAHARAN AFRICA
25
Africa, refined petroleum products and apparel (USITC, 2014). 26 Apparel is a low-skill and low-technology sector, leading to concerns it will not build up the productive capacity necessary to turn SSA into a manufacturing powerhouse (Williams, 2015).
The ability of African countries to export manufactures, and the locations to which these products are exported, is influenced by their capabilities and the extent to which they are competitive in key areas related to the cost of production and trade. But trade and transportation costs are not simply a product of proximity; they are also influenced by the quality of infrastructure (domestic and cross-border) and the business climate, as well as the efficiency of trade logistics services, all of which tend to be relatively poor in most African countries (see Section 6.2, although there are exceptions, and trade-related infrastructure on the continent is improving).
Other drivers of cost competitiveness are also important determinants of African manufacturing trade. For example, relative unit labour costs (RULCs) influence competitiveness in production. While SSA has historically had comparatively high RULCs in relation to other developing and emerging countries, in recent years China has seen faster wage growth than productivity growth, creating an opportunity for stronger competition from other countries. In many SSA countries, productivity growth has outpaced wage growth, leading to a decreasing trend in RULCs. However, in most countries, this has still not generated sufficient reductions to bring RULCs in line with those in Chinese manufacturing export sectors, although Ethiopia and Tanzania are two important exceptions (Ceglowski et al., 2015). In these countries, the comparative shift in RULCs makes them more attractive for labour-intensive manufacturing (though in Tanzania tax and other levies on labour makes the use of labour expensive).
Similarly, exchange rates influence the competitiveness of manufacturing exports. In a number of SSA countries, the exchange rate is closely aligned with the dollar to help maintain stability. However, misaligned exchange rates can hurt African exports of manufactures. For example, external factors that cause the domestic currency to appreciate will, in turn, make exports more expensive overseas.
More generally, skills shortages and a lack of new productive capabilities have traditionally affected the ability of SSA countries to export manufactures competitively. These factors often make it difficult for African countries to meet product quality standards or produce sufficient volumes with the speed and efficiency required to make their manufactures internationally competitive, particularly in medium- and high-technology product categories. Instead, as we show above, manufacturing exports in most African countries still tend to be concentrated in resource-based or low-tech manufactures. Nevertheless, continued expansion of exports of resource-based and low-tech manufactures may provide the necessary base from which African countries can build the capabilities required to eventually move into the production and export of more technology-intensive manufactures.
On the other hand, competitiveness in export-based manufacturing can be enhanced through special economic zones (SEZs) or industrial parks and other forms of trade promotion. Ethiopia has already established several industrial parts to support light manufacturing industries and recently announced plans to develop new industrial parks with the aim of alleviating traditional soft and hard infrastructure bottlenecks and allowing for more competitive production and trading (World Bank, 2015).27
External factors also influence African trade in manufactures. The global economic crisis, and the persistence of low growth rates in much of the developed world, has sparked a slowdown in global trade (see Section 3.1), which has affected global demand for manufactures. At the same time, however, growth in regional markets, alongside an expanding middle class in Africa, has raised demand for manufactured products on the continent, creating opportunities for greater intra-African trade in manufactures. Looking ahead, further opportunities for export-based manufacturing in Africa are likely to
26 One reason for the relatively limited impact of AGOA outside of the petroleum sector is that few African countries make significant use of the preferences it offers (Williams, 2015). Another concern is that a significant share of African exports under AGOA are, in effect, repackaged products originally sourced from China (Rotunno et al., 2012). Most AGOA-eligible countries have found it difficult to utilise the short-term benefits provided by the AGOA preferences as a platform from which to improve their manufacturing capabilities and competitiveness (Condon and Stern, 2011). 27 There do appear to be a range of other issues the presence of industrial parks has been unable to solve, such as shortages of raw materials.
DEVELOPING EXPORT-BASED MANUFACTURING IN SUB-SAHARAN AFRICA
26
be generated by the increasing trend in offshoring investment in manufacturing production, particularly by large companies (although near-shoring is also occurring); shifts in the global location of labour-intensive manufacturing production as a result of rising wages in China; the increasing fragmentation of production networks; and new opportunities to integrate into GVCs.
We find that a similar set of factors that help exports can also help attract manufacturing FDI: (1) general policy factors (e.g. political stability, governance, investment climate); (2) macroeconomic and structural factors (human resources, infrastructure, market size and growth); (3) specific FDI policies (FDI promotion agencies and incentives packaged in a strategy, investment promotion to address imperfect information, international trade and investment treaties, home country measures); and (4) firm-specific factors (e.g. technology) and one-off factors such as the availability of natural resources or large-scale privatisation (Dunning, 1993; te Velde, 2002, 2006; UNCTAD, 1999).
The literature suggests specific FDI incentives are less effective in attracting FDI than so-called general economic fundamentals, such as good-quality and appropriate education and infrastructure. Incentives do tend to have an effect on the choice of location at the margin (examples include Ireland and Singapore over the 1970–1990 period) (te Velde, 2002), and tax lawyers take tax treaties into consideration when advising their clients. Incentives are most effective in determining in which of a number of similar locations footloose export-oriented investment will focus. Morrisset (2003) also argues that time-series analysis and surveys indicate that tax incentives are a poor means to compensate for negative factors in a country’s investment climate, but that incentives do affect the decisions of some investors some of the time. Since incentives are costly in terms of forgone revenues, the question is how to minimise wasteful tax incentives and avoid a ‘race to the bottom’ for tax incentives (and tax levels generally, as expressed in the OECD’s work on base erosion and profit-sharing).
Global and regional trade and bilateral investment agreements may help mobilise FDI. Although causalities are difficult to disentangle, multilateral trade liberalisation in the framework of the General Agreement on Tariffs and Trade/World Trade Organization has probably contributed to an increase in vertical FDI over the past 20 years. While the impact of bilateral investment agreements on FDI flows remains controversial (Berger et al., 2011; Sauvant and Sachs, 2009; UNCTAD, 2009), empirical studies on the impact of regional trade agreements on FDI tend to suggest they encourage extra-regional FDI flows and for some regions intra-regional FDI (Büge, 2012; Büthe and Milner, 2008; te Velde and Bezemer, 2006). Other studies also show that different countries within a region experience different effects with respect to attracting FDI. This reflects variations in the relative size of the industrial sector, but also in the degree to which economic integration, directly or indirectly, increases the geographical advantage of a country relative to others in the region.
6.2 COMPARATIVE ANALYSIS OF ATTRACTING FDI IN EXPORT-ORIENTED MANUFACTURING
Globally, competition among countries to attract FDI that creates jobs and stimulates local economic activity is fierce. African countries not only are competing among themselves to attract FDI but also must compete against a multitude of countries with similar profiles in developing regions outside of Africa. Section 6.1 showed that the confluence of a range of different factors ultimately influences decisions regarding where to locate FDI, some of which deal specifically with manufacturing and others that are more general. These factors relate to geographical advantages, the size of domestic and regional markets, a range of economic fundamentals (skills, the quality of infrastructure, labour productivity, and the cost of labour and energy inputs into production), the general investment climate and specific trade and investment policies. In this section, we assess how the nine selected African countries compare with similar competitor countries in Asia (Bangladesh, Cambodia, Myanmar, the Philippines, Thailand and Vietnam) and Latin America (Peru) along a range of indicators that relate to the factors we have identified as important for attracting FDI in export-oriented manufacturing.
We first compare these countries along several different measures of labour productivity in manufacturing and annual labour costs (see Table 5). High levels of labour productivity and competitive labour costs (of which wages are a key component) are important factors in the development of competitive manufacturing sectors. In general, the relative performance of the selected African
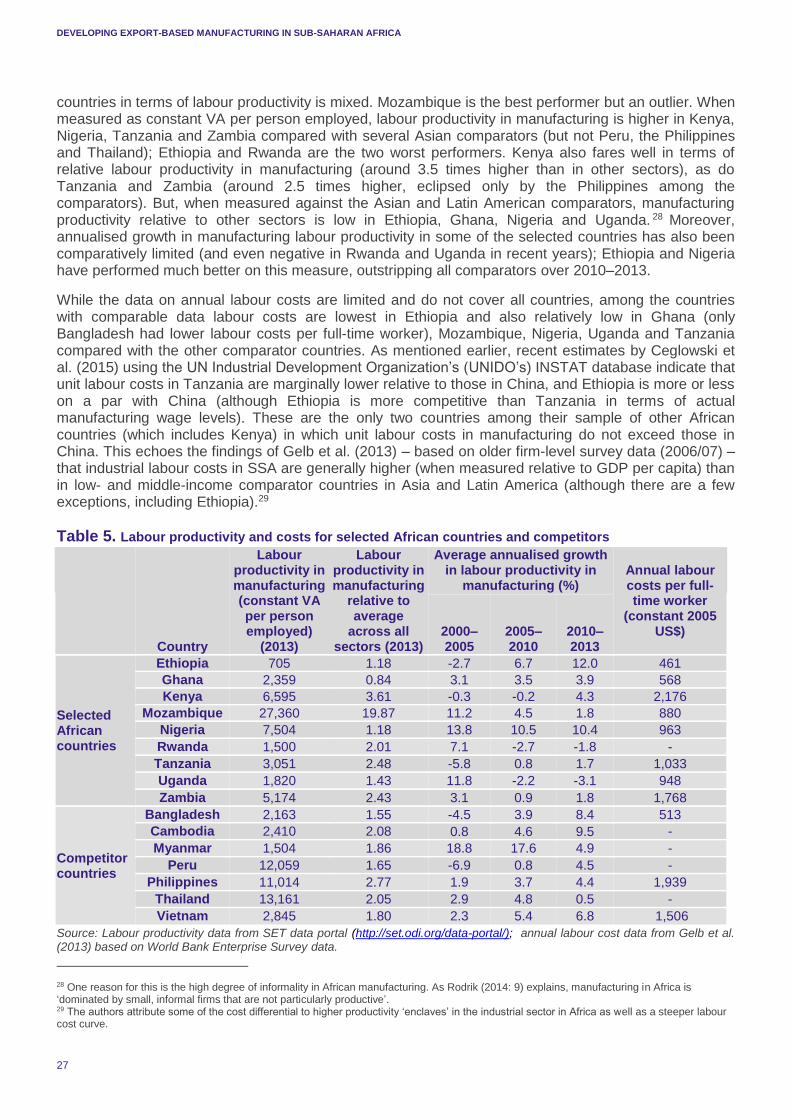
DEVELOPING EXPORT-BASED MANUFACTURING IN SUB-SAHARAN AFRICA
27
countries in terms of labour productivity is mixed. Mozambique is the best performer but an outlier. When measured as constant VA per person employed, labour productivity in manufacturing is higher in Kenya, Nigeria, Tanzania and Zambia compared with several Asian comparators (but not Peru, the Philippines and Thailand); Ethiopia and Rwanda are the two worst performers. Kenya also fares well in terms of relative labour productivity in manufacturing (around 3.5 times higher than in other sectors), as do Tanzania and Zambia (around 2.5 times higher, eclipsed only by the Philippines among the comparators). But, when measured against the Asian and Latin American comparators, manufacturing productivity relative to other sectors is low in Ethiopia, Ghana, Nigeria and Uganda. 28 Moreover, annualised growth in manufacturing labour productivity in some of the selected countries has also been comparatively limited (and even negative in Rwanda and Uganda in recent years); Ethiopia and Nigeria have performed much better on this measure, outstripping all comparators over 2010–2013.
While the data on annual labour costs are limited and do not cover all countries, among the countries with comparable data labour costs are lowest in Ethiopia and also relatively low in Ghana (only Bangladesh had lower labour costs per full-time worker), Mozambique, Nigeria, Uganda and Tanzania compared with the other comparator countries. As mentioned earlier, recent estimates by Ceglowski et al. (2015) using the UN Industrial Development Organization’s (UNIDO’s) INSTAT database indicate that unit labour costs in Tanzania are marginally lower relative to those in China, and Ethiopia is more or less on a par with China (although Ethiopia is more competitive than Tanzania in terms of actual manufacturing wage levels). These are the only two countries among their sample of other African countries (which includes Kenya) in which unit labour costs in manufacturing do not exceed those in China. This echoes the findings of Gelb et al. (2013) – based on older firm-level survey data (2006/07) – that industrial labour costs in SSA are generally higher (when measured relative to GDP per capita) than in low- and middle-income comparator countries in Asia and Latin America (although there are a few exceptions, including Ethiopia).29
Table 5. Labour productivity and costs for selected African countries and competitors
Country
Labour productivity in manufacturing (constant VA per person employed)
(2013)
Labour productivity in manufacturing
relative to average
across all sectors (2013)
Average annualised growth in labour productivity in
manufacturing (%) Annual labour costs per full-time worker
(constant 2005 US$)
2000–2005
2005–2010
2010–2013
Selected African countries
Ethiopia 705 1.18 -2.7 6.7 12.0 461
Ghana 2,359 0.84 3.1 3.5 3.9 568
Kenya 6,595 3.61 -0.3 -0.2 4.3 2,176
Mozambique 27,360 19.87 11.2 4.5 1.8 880
Nigeria 7,504 1.18 13.8 10.5 10.4 963
Rwanda 1,500 2.01 7.1 -2.7 -1.8 -
Tanzania 3,051 2.48 -5.8 0.8 1.7 1,033
Uganda 1,820 1.43 11.8 -2.2 -3.1 948
Zambia 5,174 2.43 3.1 0.9 1.8 1,768
Competitor countries
Bangladesh 2,163 1.55 -4.5 3.9 8.4 513
Cambodia 2,410 2.08 0.8 4.6 9.5 -
Myanmar 1,504 1.86 18.8 17.6 4.9 -
Peru 12,059 1.65 -6.9 0.8 4.5 -
Philippines 11,014 2.77 1.9 3.7 4.4 1,939
Thailand 13,161 2.05 2.9 4.8 0.5 -
Vietnam 2,845 1.80 2.3 5.4 6.8 1,506
Source: Labour productivity data from SET data portal (http://set.odi.org/data-portal/); annual labour cost data from Gelb et al. (2013) based on World Bank Enterprise Survey data.
28 One reason for this is the high degree of informality in African manufacturing. As Rodrik (2014: 9) explains, manufacturing in Africa is ‘dominated by small, informal firms that are not particularly productive’. 29 The authors attribute some of the cost differential to higher productivity ‘enclaves’ in the industrial sector in Africa as well as a steeper labour cost curve.
DEVELOPING EXPORT-BASED MANUFACTURING IN SUB-SAHARAN AFRICA
28
We also compare the performance of these countries on a range of more general indicators related to determinants of FDI in manufacturing, including the size of the domestic market (total population), domestic input costs (the cost of electricity), education and skill levels (gross enrolment ratios in secondary, vocational and tertiary education; proportion of unskilled workers in manufacturing firms), quality of the business climate (World Bank’s ease of doing business ranking), infrastructure (ranking of the quality of overall infrastructure) and trade logistics services (overall rank and score on the World Bank’s Logistics Performance Index). Competitive input costs, a sufficiently skilled workforce, good-quality infrastructure and logistics services and a favourable business climate are all key drivers of competitiveness in manufacturing. To provide a more general reference point, we also compare how these competing countries perform relative to the LIC, lower-middle-income country (LMIC) and upper-middle-income country (UMIC) averages on selected indicators (depending on data availability). The comparative data for these indicators are presented in Table A.4 in Appendix II.
Among the selected African countries, Ethiopia and Nigeria benefit from large domestic markets in which to potentially supply manufactured products, with Nigeria boasting the largest population by some margin, and Ethiopia’s population eclipsed only by Bangladesh and the Philippines (marginally). While lower down the list in terms of domestic market size, Kenya and Tanzania do benefit from proximity to a large, and growing, regional market within the EAC, as well as being favourably located in terms of access to key overseas markets for manufactures. In contrast, Ghana, Mozambique, Rwanda and Zambia have relatively small domestic markets compared with their African counterparts and most of the Asian competitors (excluding Cambodia).
There is wide variation among the African focus countries on the other comparator indicators. Ethiopia also has the lowest price per kWh of electricity, followed by Zambia, Mozambique and Tanzania (the prices in these countries are all below the LIC, LMIC and UMIC averages). However, some of the other focus countries fare less well on this indicator. The price of electricity is highest in Ghana (above both the LIC and LMIC averages), Kenya and Uganda (both above the LMIC average). On balance, however, the selected African countries generally have lower average costs of electricity than their Asian and Latin American counterparts (but, aside from Bangladesh and Myanmar, and to a lesser extent Cambodia, the supply of electricity tends to be more reliable in the comparator countries).
Rwanda boasts a favourable ranking (higher than the UMIC average) on quality of the overall business climate and is surpassed only by Peru and Thailand. Zambia also performs comparatively well on this measure and, along with Ghana, Kenya and Uganda, has a ranking above the LMIC average. Rwanda also performs best among the comparator countries on the ranking of the overall quality of infrastructure, followed by Kenya (both countries have better rankings than the UMIC and LMIC averages); Uganda and Zambia also rank relatively high (Thailand holds the position of the highest ranked non-African competitor country on this measure.) In the case of logistics performance, three Asian countries (Thailand, Vietnam and the Philippines) are highest placed, followed by Peru; Kenya and Nigeria (both ranked above the UMIC average) followed by Rwanda are the highest ranked among the African countries (and they are all ranked above the LMIC average).
Again, however, several African countries fare poorly on these measures. Nigeria (below the LIC average), Ethiopia, Mozambique and Tanzania rank among the countries with the worst business climates. With the exception of Ethiopia, these countries (and Ghana) are also among the worst performers on the rankings of the overall quality of infrastructure (and their rankings are all below the LIC average). Mozambique, Tanzania, Uganda and Zambia rank among the worst performing in terms of logistics (all below the LIC average).
The selected African countries generally perform comparatively poorly on the education indicators. In terms of gross enrolment in secondary education, Peru, the Philippines and Thailand are the best performers, followed by Kenya (above the LMIC average) and Ghana (below the LMIC average); the other African countries have the lowest levels of enrolment. Similarly, Thailand, Peru and the Philippines are the best performers in terms of gross enrolment in tertiary education, whereas Ghana is the best performer of the nine African countries (although enrolment in Ghana is still below the LMIC average). Ghana aside, the other African countries all fare poorly compared with the Asian and Latin American competitors, and the enrolment ratios in Ethiopia, Kenya, Mozambique, Rwanda, Tanzania and Uganda
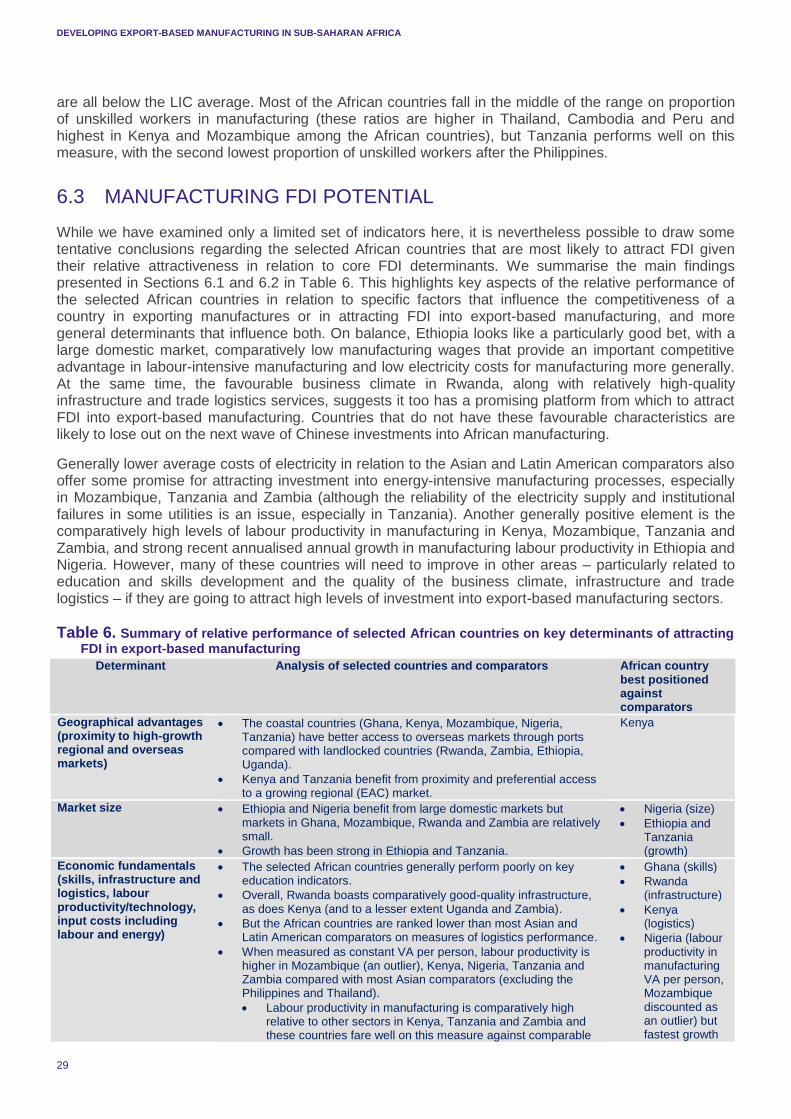
DEVELOPING EXPORT-BASED MANUFACTURING IN SUB-SAHARAN AFRICA
29
are all below the LIC average. Most of the African countries fall in the middle of the range on proportion of unskilled workers in manufacturing (these ratios are higher in Thailand, Cambodia and Peru and highest in Kenya and Mozambique among the African countries), but Tanzania performs well on this measure, with the second lowest proportion of unskilled workers after the Philippines.
6.3 MANUFACTURING FDI POTENTIAL
While we have examined only a limited set of indicators here, it is nevertheless possible to draw some tentative conclusions regarding the selected African countries that are most likely to attract FDI given their relative attractiveness in relation to core FDI determinants. We summarise the main findings presented in Sections 6.1 and 6.2 in Table 6. This highlights key aspects of the relative performance of the selected African countries in relation to specific factors that influence the competitiveness of a country in exporting manufactures or in attracting FDI into export-based manufacturing, and more general determinants that influence both. On balance, Ethiopia looks like a particularly good bet, with a large domestic market, comparatively low manufacturing wages that provide an important competitive advantage in labour-intensive manufacturing and low electricity costs for manufacturing more generally. At the same time, the favourable business climate in Rwanda, along with relatively high-quality infrastructure and trade logistics services, suggests it too has a promising platform from which to attract FDI into export-based manufacturing. Countries that do not have these favourable characteristics are likely to lose out on the next wave of Chinese investments into African manufacturing.
Generally lower average costs of electricity in relation to the Asian and Latin American comparators also offer some promise for attracting investment into energy-intensive manufacturing processes, especially in Mozambique, Tanzania and Zambia (although the reliability of the electricity supply and institutional failures in some utilities is an issue, especially in Tanzania). Another generally positive element is the comparatively high levels of labour productivity in manufacturing in Kenya, Mozambique, Tanzania and Zambia, and strong recent annualised annual growth in manufacturing labour productivity in Ethiopia and Nigeria. However, many of these countries will need to improve in other areas – particularly related to education and skills development and the quality of the business climate, infrastructure and trade logistics – if they are going to attract high levels of investment into export-based manufacturing sectors.
Table 6. Summary of relative performance of selected African countries on key determinants of attracting FDI in export-based manufacturing
Determinant Analysis of selected countries and comparators African country best positioned against comparators
Geographical advantages (proximity to high-growth regional and overseas markets)
The coastal countries (Ghana, Kenya, Mozambique, Nigeria, Tanzania) have better access to overseas markets through ports compared with landlocked countries (Rwanda, Zambia, Ethiopia, Uganda).
Kenya and Tanzania benefit from proximity and preferential access to a growing regional (EAC) market.
Kenya
Market size Ethiopia and Nigeria benefit from large domestic markets but markets in Ghana, Mozambique, Rwanda and Zambia are relatively small.
Growth has been strong in Ethiopia and Tanzania.
Nigeria (size)
Ethiopia and Tanzania (growth)
Economic fundamentals (skills, infrastructure and logistics, labour productivity/technology, input costs including labour and energy)
The selected African countries generally perform poorly on key education indicators.
Overall, Rwanda boasts comparatively good-quality infrastructure, as does Kenya (and to a lesser extent Uganda and Zambia).
But the African countries are ranked lower than most Asian and Latin American comparators on measures of logistics performance.
When measured as constant VA per person, labour productivity is higher in Mozambique (an outlier), Kenya, Nigeria, Tanzania and Zambia compared with most Asian comparators (excluding the Philippines and Thailand).
Labour productivity in manufacturing is comparatively high relative to other sectors in Kenya, Tanzania and Zambia and these countries fare well on this measure against comparable
Ghana (skills)
Rwanda (infrastructure)
Kenya (logistics)
Nigeria (labour productivity in manufacturing VA per person, Mozambique discounted as an outlier) but fastest growth
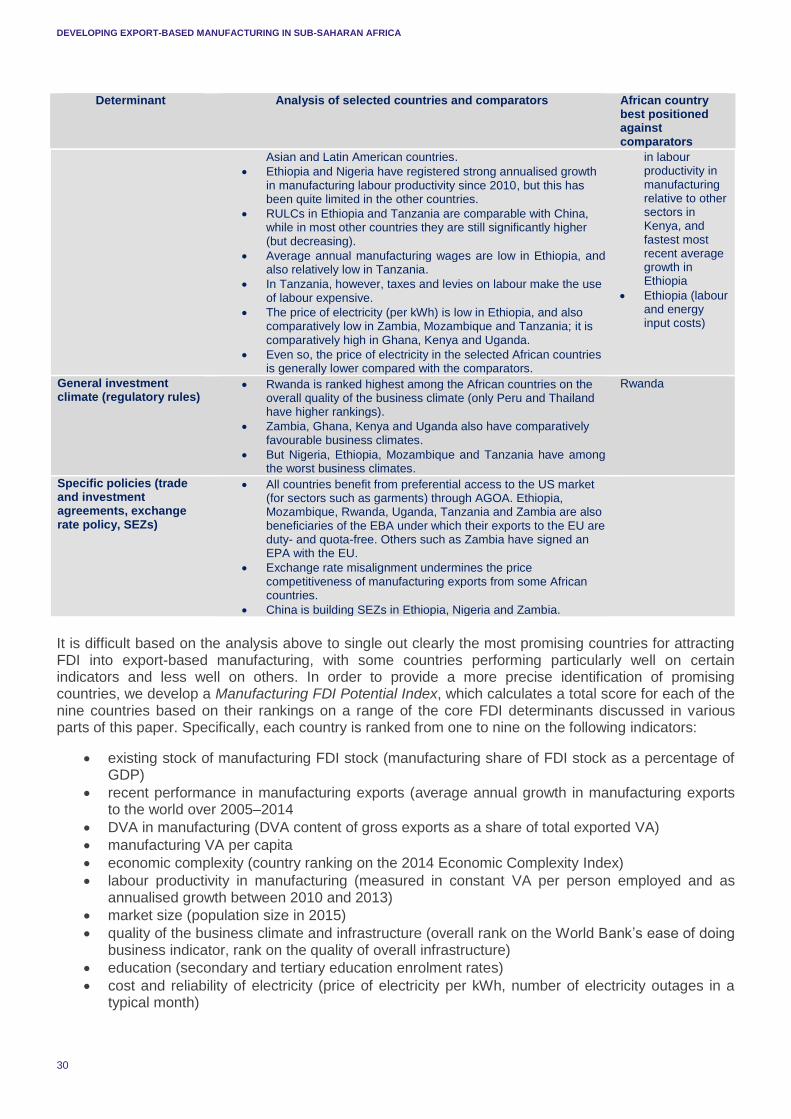
DEVELOPING EXPORT-BASED MANUFACTURING IN SUB-SAHARAN AFRICA
30
Determinant Analysis of selected countries and comparators African country best positioned against comparators
Asian and Latin American countries.
Ethiopia and Nigeria have registered strong annualised growth in manufacturing labour productivity since 2010, but this has been quite limited in the other countries.
RULCs in Ethiopia and Tanzania are comparable with China, while in most other countries they are still significantly higher (but decreasing).
Average annual manufacturing wages are low in Ethiopia, and also relatively low in Tanzania.
In Tanzania, however, taxes and levies on labour make the use of labour expensive.
The price of electricity (per kWh) is low in Ethiopia, and also comparatively low in Zambia, Mozambique and Tanzania; it is comparatively high in Ghana, Kenya and Uganda.
Even so, the price of electricity in the selected African countries is generally lower compared with the comparators.
in labour productivity in manufacturing relative to other sectors in Kenya, and fastest most recent average growth in Ethiopia
Ethiopia (labour and energy input costs)
General investment climate (regulatory rules)
Rwanda is ranked highest among the African countries on the overall quality of the business climate (only Peru and Thailand have higher rankings).
Zambia, Ghana, Kenya and Uganda also have comparatively favourable business climates.
But Nigeria, Ethiopia, Mozambique and Tanzania have among the worst business climates.
Rwanda
Specific policies (trade and investment agreements, exchange rate policy, SEZs)
All countries benefit from preferential access to the US market (for sectors such as garments) through AGOA. Ethiopia, Mozambique, Rwanda, Uganda, Tanzania and Zambia are also beneficiaries of the EBA under which their exports to the EU are duty- and quota-free. Others such as Zambia have signed an EPA with the EU.
Exchange rate misalignment undermines the price competitiveness of manufacturing exports from some African countries.
China is building SEZs in Ethiopia, Nigeria and Zambia.
It is difficult based on the analysis above to single out clearly the most promising countries for attracting FDI into export-based manufacturing, with some countries performing particularly well on certain indicators and less well on others. In order to provide a more precise identification of promising countries, we develop a Manufacturing FDI Potential Index, which calculates a total score for each of the nine countries based on their rankings on a range of the core FDI determinants discussed in various parts of this paper. Specifically, each country is ranked from one to nine on the following indicators:
existing stock of manufacturing FDI stock (manufacturing share of FDI stock as a percentage of GDP)
recent performance in manufacturing exports (average annual growth in manufacturing exports to the world over 2005–2014
DVA in manufacturing (DVA content of gross exports as a share of total exported VA) manufacturing VA per capita economic complexity (country ranking on the 2014 Economic Complexity Index) labour productivity in manufacturing (measured in constant VA per person employed and as
annualised growth between 2010 and 2013) market size (population size in 2015) quality of the business climate and infrastructure (overall rank on the World Bank’s ease of doing
business indicator, rank on the quality of overall infrastructure) education (secondary and tertiary education enrolment rates) cost and reliability of electricity (price of electricity per kWh, number of electricity outages in a
typical month)
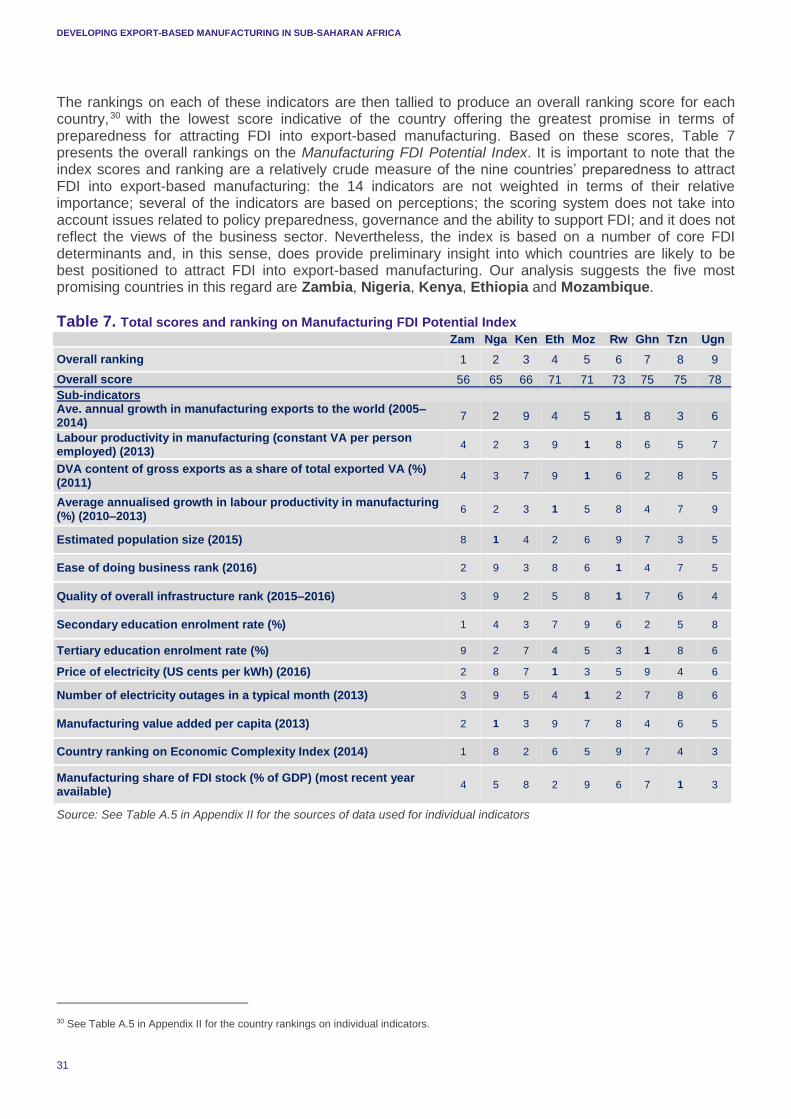
DEVELOPING EXPORT-BASED MANUFACTURING IN SUB-SAHARAN AFRICA
31
The rankings on each of these indicators are then tallied to produce an overall ranking score for each country,30 with the lowest score indicative of the country offering the greatest promise in terms of preparedness for attracting FDI into export-based manufacturing. Based on these scores, Table 7 presents the overall rankings on the Manufacturing FDI Potential Index. It is important to note that the index scores and ranking are a relatively crude measure of the nine countries’ preparedness to attract FDI into export-based manufacturing: the 14 indicators are not weighted in terms of their relative importance; several of the indicators are based on perceptions; the scoring system does not take into account issues related to policy preparedness, governance and the ability to support FDI; and it does not reflect the views of the business sector. Nevertheless, the index is based on a number of core FDI determinants and, in this sense, does provide preliminary insight into which countries are likely to be best positioned to attract FDI into export-based manufacturing. Our analysis suggests the five most promising countries in this regard are Zambia, Nigeria, Kenya, Ethiopia and Mozambique.
Table 7. Total scores and ranking on Manufacturing FDI Potential Index
Zam Nga Ken Eth Moz Rw Ghn Tzn Ugn
Overall ranking 1 2 3 4 5 6 7 8 9
Overall score 56 65 66 71 71 73 75 75 78
Sub-indicators Ave. annual growth in manufacturing exports to the world (2005–2014)
7 2 9 4 5 1 8 3 6
Labour productivity in manufacturing (constant VA per person employed) (2013)
4 2 3 9 1 8 6 5 7
DVA content of gross exports as a share of total exported VA (%) (2011)
4 3 7 9 1 6 2 8 5
Average annualised growth in labour productivity in manufacturing (%) (2010–2013)
6 2 3 1 5 8 4 7 9
Estimated population size (2015) 8 1 4 2 6 9 7 3 5
Ease of doing business rank (2016) 2 9 3 8 6 1 4 7 5
Quality of overall infrastructure rank (2015–2016) 3 9 2 5 8 1 7 6 4
Secondary education enrolment rate (%) 1 4 3 7 9 6 2 5 8
Tertiary education enrolment rate (%) 9 2 7 4 5 3 1 8 6
Price of electricity (US cents per kWh) (2016) 2 8 7 1 3 5 9 4 6
Number of electricity outages in a typical month (2013) 3 9 5 4 1 2 7 8 6
Manufacturing value added per capita (2013) 2 1 3 9 7 8 4 6 5
Country ranking on Economic Complexity Index (2014) 1 8 2 6 5 9 7 4 3
Manufacturing share of FDI stock (% of GDP) (most recent year available)
4 5 8 2 9 6 7 1 3
Source: See Table A.5 in Appendix II for the sources of data used for individual indicators
30 See Table A.5 in Appendix II for the country rankings on individual indicators.
DEVELOPING EXPORT-BASED MANUFACTURING IN SUB-SAHARAN AFRICA
32
7. CONCLUSIONS This paper has examined the available data on production, trade and FDI to assess current trends and future prospects of manufacturing in Africa generally and in nine selected African countries more specifically. Overall, it shows expanding production, employment, exports and FDI in SSA manufacturing, and indicates that in the nine selected African countries there are a range of promising manufacturing sectors for the future. Even so, while some countries compare better than others, all countries could do more to attract investment in export-oriented manufacturing.
Data suggest manufacturing production is increasing across Africa, but with varying experiences across countries. The share of manufacturing in GDP declined from 18% in 1975 to 11% in 2014, but manufacturing production has more than doubled from $73 billion in 2005 to $157 billion in current prices (or $98 billion in 2005 prices). African manufacturing has grown at 3.5% annually in real terms over the past decade. The share of manufacturing in total employment fell from 10% in 1991 to 8.5% in 2013, but the total numbers of employees in SSA manufacturing increased from 11.0 million to 17.7 million. Data for Nigeria, Rwanda, Kenya and Ethiopia suggest food and beverages is the dominant manufacturing sector (between 40% and 70%), which is usually a domestically oriented industry, followed by textiles and clothing, which is more likely to be export-oriented. National statistics for Tanzania, Uganda and Zambia point to strong recent manufacturing growth but reveal very mixed performance across subsectors. The food and beverages sector increased above average partly because of the importance of growing domestic demand over that period, whereas textiles and clothing could not withstand the competition from Asian imports.
Annual average growth in manufacturing exports between 2005 and 2014 was highest in Asia (8.3%), followed by Africa (whole continent) (7.4%), and much lower in Europe (4.3%), the Americas (3.9%) and Oceania (2.7%). Africa’s manufacturing share increased marginally from 0.8% to 0.9%. We highlight core centres of demand in both traditional markets and emerging or developing country markets (India, Vietnam, Thailand, Bangladesh) that African exporters of manufactures can potentially tap into. That said, we also show that other African countries are emerging as increasingly important destination markets for African manufacturing exports. Between 2005 and 2014, the share of intra-African manufacturing exports in the total value of African (whole continent) manufacturing exports (including re-exports) increased by nearly 15 percentage points to reach 34%. There has been a gradual (albeit fairly limited) technological deepening in African manufacturing exports over the past decade.
The FDI stock in Africa (whole continent) is currently 29% of GDP, not far below the figure for the world as a whole, which is 33.6%. There is wide variation among the nine selected countries, with only Tanzania and Uganda in the neighbourhood of the continental and global averages. Mozambique’s stock is very high, at 160% of GDP, whereas Kenya, perhaps surprisingly, is the lowest, at below 10% of GDP. Over 2000–2014, Ethiopia attracted FDI inflows averaging over $800 million per annum, whereas Kenya’s inflows were below $600 million per annum. Ethiopia’s FDI stocks are dominated by manufacturing, much more so than Kenya’s, about two thirds of which are in services. Rwanda has been successful in attracting inflows into services (ICT and finance) as well, as opposed to manufacturing, with the respective shares being 78% and 19% of the country’s total FDI stocks.
FDI in African manufacturing has been low but is increasing; much FDI is among African countries. Overall, manufacturing FDI rose in the nine selected African countries between 2003–2006 and 2010–2014, apart from in Nigeria. There are promising signs of increasing Chinese investment into African manufacturing, reflected in the well-known examples of Huajian Shoes in Ethiopia and C&H Garments in Rwanda. The US BEA reports that returns to US foreign equity holdings in Africa were 8% in 2014, which was very similar to returns to US equity holdings globally (9%) and in Europe (8%). In manufacturing, returns in Africa of 4% were below those globally (9%) and in Europe (10%) but above those in Asia and Pacific (3%).
The paper uses a number of techniques in the case of one country (Tanzania) to suggest a range of promising sectors, including several in manufacturing. There are key sectors that move Tanzania up the VA ladder through agro-processing and manufacturing, including processing of cashews, leather, fruit
DEVELOPING EXPORT-BASED MANUFACTURING IN SUB-SAHARAN AFRICA
33
and nuts and production of wood and paper products, with machinery and chemicals as strategic bets. Some of these help increase Tanzania’s value addition; others help raise its productivity and productive capacity.
The paper also uses a limited number of techniques (RCA, Hausmann product space) for all nine countries. These yield country-specific results. But the continent as a whole already has a share that is greater than 2% of world trade in fertilisers, chemicals, leather products, apparel, oil, iron and steel. Qualitative accounts and our calculations using standard techniques indicate some very interesting opportunities in the following African manufacturing sectors: garments, agri-business, mineral processing, manufactures of consumer goods, pharmaceuticals, automobiles and food, beverages and tobacco.
Finally, we score each of the nine African countries using a Manufacturing FDI Potential Index based on the countries’ rankings on a number of key factors influencing FDI, including past manufacturing FDI stock as a percentage of GDP, recent performance in manufacturing exports, DVA in manufacturing, manufacturing VA per capita, economic complexity, labour productivity in manufacturing, population, quality of the business climate and infrastructure, education and cost and reliability of electricity. Our analysis highlights five promising countries that are relatively well positioned to attract manufacturing FDI: Ethiopia, Kenya, Mozambique, Nigeria and Zambia.
We conclude that, while some African countries are positioned better than others, all of them will need to improve in several areas – particularly related to education and skills development and the quality of the business climate, infrastructure and trade logistics – if they are going to attract high levels of investment into export-based manufacturing sectors. African countries should act to take advantage of recent trends such as African regional growth and rising wages in Asia. The challenge for policy-makers in these countries and sectors is to build on the experiences and make the opportunities a reality by tackling constraints that are common and specific to countries and sectors. Two SET-ACET papers (Ansu et al., 2016a, 2016b) provide further insights into what needs to be done, and how.
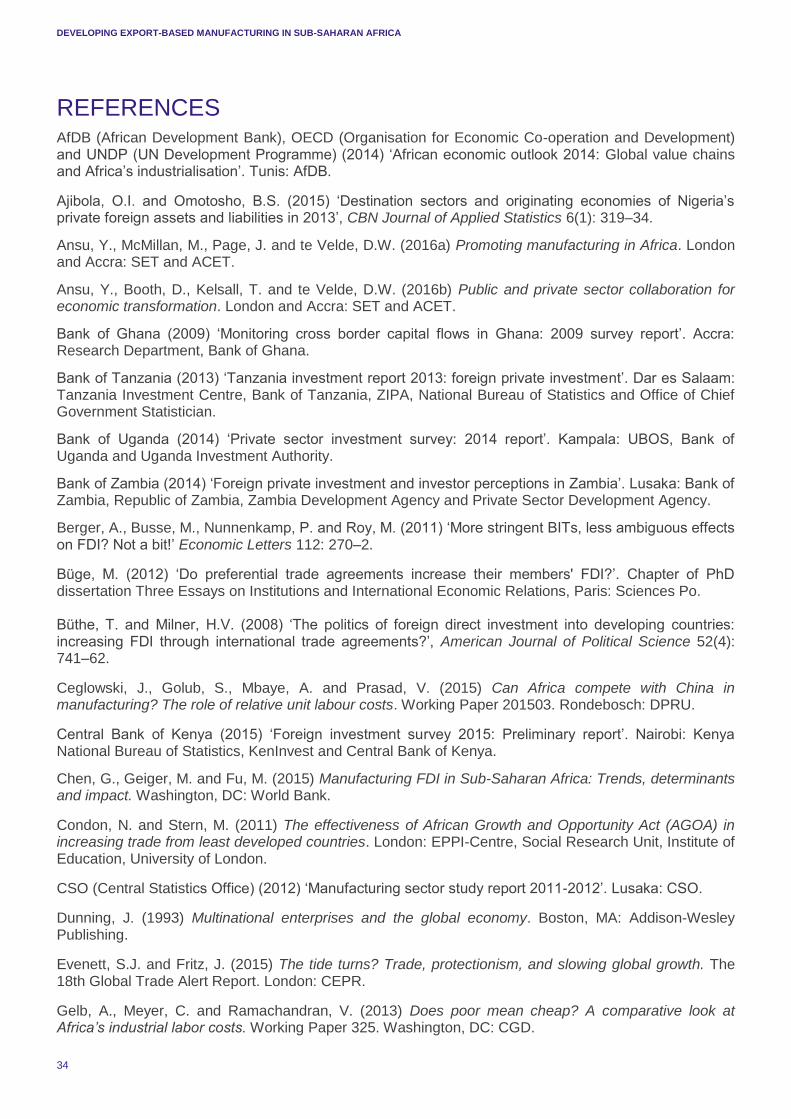
DEVELOPING EXPORT-BASED MANUFACTURING IN SUB-SAHARAN AFRICA
34
REFERENCES AfDB (African Development Bank), OECD (Organisation for Economic Co-operation and Development) and UNDP (UN Development Programme) (2014) ‘African economic outlook 2014: Global value chains and Africa’s industrialisation’. Tunis: AfDB.
Ajibola, O.I. and Omotosho, B.S. (2015) ‘Destination sectors and originating economies of Nigeria’s private foreign assets and liabilities in 2013’, CBN Journal of Applied Statistics 6(1): 319–34.
Ansu, Y., McMillan, M., Page, J. and te Velde, D.W. (2016a) Promoting manufacturing in Africa. London and Accra: SET and ACET.
Ansu, Y., Booth, D., Kelsall, T. and te Velde, D.W. (2016b) Public and private sector collaboration for economic transformation. London and Accra: SET and ACET.
Bank of Ghana (2009) ‘Monitoring cross border capital flows in Ghana: 2009 survey report’. Accra: Research Department, Bank of Ghana.
Bank of Tanzania (2013) ‘Tanzania investment report 2013: foreign private investment’. Dar es Salaam: Tanzania Investment Centre, Bank of Tanzania, ZIPA, National Bureau of Statistics and Office of Chief Government Statistician.
Bank of Uganda (2014) ‘Private sector investment survey: 2014 report’. Kampala: UBOS, Bank of Uganda and Uganda Investment Authority.
Bank of Zambia (2014) ‘Foreign private investment and investor perceptions in Zambia’. Lusaka: Bank of Zambia, Republic of Zambia, Zambia Development Agency and Private Sector Development Agency.
Berger, A., Busse, M., Nunnenkamp, P. and Roy, M. (2011) ‘More stringent BITs, less ambiguous effects on FDI? Not a bit!’ Economic Letters 112: 270–2.
Büge, M. (2012) ‘Do preferential trade agreements increase their members' FDI?’. Chapter of PhD dissertation Three Essays on Institutions and International Economic Relations, Paris: Sciences Po. Büthe, T. and Milner, H.V. (2008) ‘The politics of foreign direct investment into developing countries: increasing FDI through international trade agreements?’, American Journal of Political Science 52(4): 741–62.
Ceglowski, J., Golub, S., Mbaye, A. and Prasad, V. (2015) Can Africa compete with China in manufacturing? The role of relative unit labour costs. Working Paper 201503. Rondebosch: DPRU.
Central Bank of Kenya (2015) ‘Foreign investment survey 2015: Preliminary report’. Nairobi: Kenya National Bureau of Statistics, KenInvest and Central Bank of Kenya.
Chen, G., Geiger, M. and Fu, M. (2015) Manufacturing FDI in Sub-Saharan Africa: Trends, determinants and impact. Washington, DC: World Bank.
Condon, N. and Stern, M. (2011) The effectiveness of African Growth and Opportunity Act (AGOA) in increasing trade from least developed countries. London: EPPI-Centre, Social Research Unit, Institute of Education, University of London.
CSO (Central Statistics Office) (2012) ‘Manufacturing sector study report 2011-2012’. Lusaka: CSO.
Dunning, J. (1993) Multinational enterprises and the global economy. Boston, MA: Addison-Wesley Publishing.
Evenett, S.J. and Fritz, J. (2015) The tide turns? Trade, protectionism, and slowing global growth. The 18th Global Trade Alert Report. London: CEPR.
Gelb, A., Meyer, C. and Ramachandran, V. (2013) Does poor mean cheap? A comparative look at Africa’s industrial labor costs. Working Paper 325. Washington, DC: CGD.
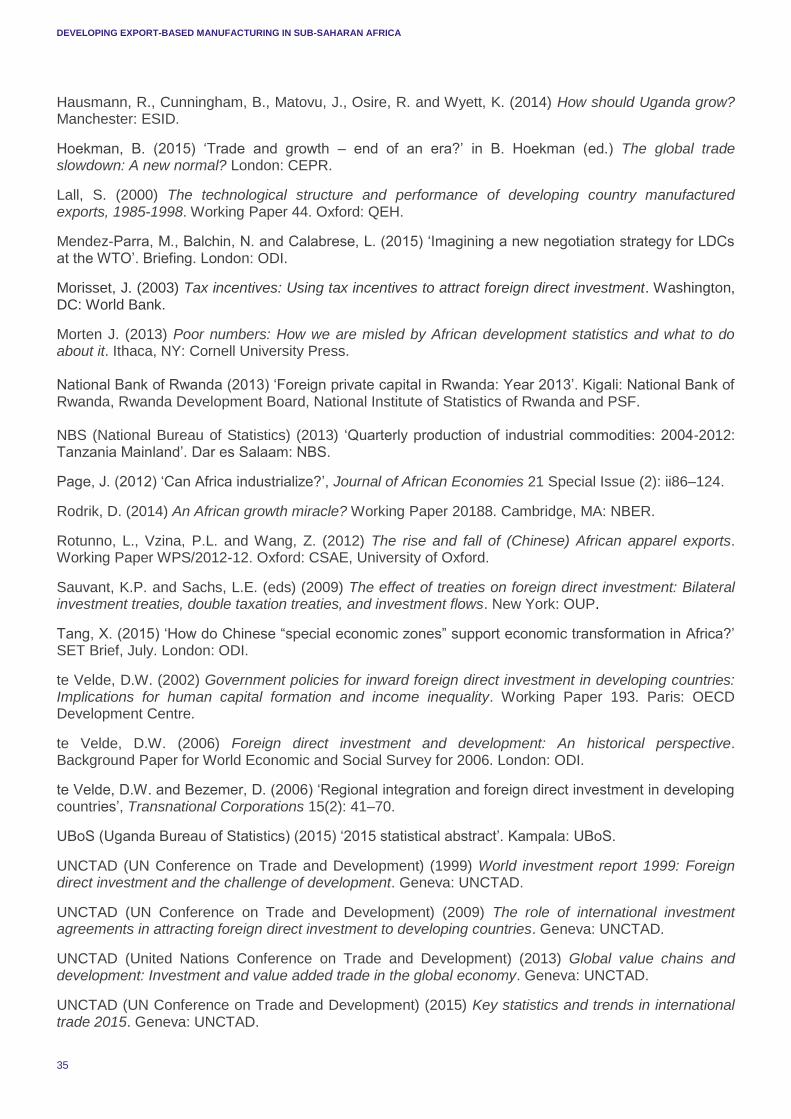
DEVELOPING EXPORT-BASED MANUFACTURING IN SUB-SAHARAN AFRICA
35
Hausmann, R., Cunningham, B., Matovu, J., Osire, R. and Wyett, K. (2014) How should Uganda grow? Manchester: ESID.
Hoekman, B. (2015) ‘Trade and growth – end of an era?’ in B. Hoekman (ed.) The global trade slowdown: A new normal? London: CEPR.
Lall, S. (2000) The technological structure and performance of developing country manufactured exports, 1985-1998. Working Paper 44. Oxford: QEH.
Mendez-Parra, M., Balchin, N. and Calabrese, L. (2015) ‘Imagining a new negotiation strategy for LDCs at the WTO’. Briefing. London: ODI.
Morisset, J. (2003) Tax incentives: Using tax incentives to attract foreign direct investment. Washington, DC: World Bank.
Morten J. (2013) Poor numbers: How we are misled by African development statistics and what to do about it. Ithaca, NY: Cornell University Press. National Bank of Rwanda (2013) ‘Foreign private capital in Rwanda: Year 2013’. Kigali: National Bank of Rwanda, Rwanda Development Board, National Institute of Statistics of Rwanda and PSF. NBS (National Bureau of Statistics) (2013) ‘Quarterly production of industrial commodities: 2004-2012: Tanzania Mainland’. Dar es Salaam: NBS.
Page, J. (2012) ‘Can Africa industrialize?’, Journal of African Economies 21 Special Issue (2): ii86–124.
Rodrik, D. (2014) An African growth miracle? Working Paper 20188. Cambridge, MA: NBER.
Rotunno, L., Vzina, P.L. and Wang, Z. (2012) The rise and fall of (Chinese) African apparel exports. Working Paper WPS/2012-12. Oxford: CSAE, University of Oxford.
Sauvant, K.P. and Sachs, L.E. (eds) (2009) The effect of treaties on foreign direct investment: Bilateral investment treaties, double taxation treaties, and investment flows. New York: OUP.
Tang, X. (2015) ‘How do Chinese “special economic zones” support economic transformation in Africa?’ SET Brief, July. London: ODI.
te Velde, D.W. (2002) Government policies for inward foreign direct investment in developing countries: Implications for human capital formation and income inequality. Working Paper 193. Paris: OECD Development Centre.
te Velde, D.W. (2006) Foreign direct investment and development: An historical perspective. Background Paper for World Economic and Social Survey for 2006. London: ODI.
te Velde, D.W. and Bezemer, D. (2006) ‘Regional integration and foreign direct investment in developing countries’, Transnational Corporations 15(2): 41–70.
UBoS (Uganda Bureau of Statistics) (2015) ‘2015 statistical abstract’. Kampala: UBoS.
UNCTAD (UN Conference on Trade and Development) (1999) World investment report 1999: Foreign direct investment and the challenge of development. Geneva: UNCTAD.
UNCTAD (UN Conference on Trade and Development) (2009) The role of international investment agreements in attracting foreign direct investment to developing countries. Geneva: UNCTAD.
UNCTAD (United Nations Conference on Trade and Development) (2013) Global value chains and development: Investment and value added trade in the global economy. Geneva: UNCTAD.
UNCTAD (UN Conference on Trade and Development) (2015) Key statistics and trends in international trade 2015. Geneva: UNCTAD.
DEVELOPING EXPORT-BASED MANUFACTURING IN SUB-SAHARAN AFRICA
36
USITC (US International Trade Commission) (2014) AGOA: Trade and investment performance overview. Washington, DC: USITC.
Williams, B.R. (2015) ‘African Growth and Opportunity Act (AGOA): Background and reauthorization’. Washington, DC: Congressional Research Service.
World Bank (2015) 4th Ethiopia economic update – overcoming constraints in the manufacturing sector. Washington, DC: World Bank.
Sources for country FDI data Ajibola, O.I. and Omotosho, B.S. (2015) ‘Destination sectors and originating economies of Nigeria’s private foreign assets and liabilities in 2013’, CBN Journal of Applied Statistics 6(1): 319–34.
Bank of Ghana (2009) ‘Monitoring cross border capital flows in Ghana: 2009 survey report’. Accra: Research Department, Bank of Ghana.
Bank of Tanzania (2013) ‘Tanzania investment report 2013: foreign private investment’. Dar es Salaam: Tanzania Investment Centre, Bank of Tanzania, ZIPA, National Bureau of Statistics and Office of Chief Government Statistician.
Bank of Uganda (2014) ‘Private sector investment survey: 2014 report’. Kampala: UBOS, Bank of Uganda and Uganda Investment Authority.
Bank of Zambia (2014) ‘Foreign private investment and investor perceptions in Zambia’. Lusaka: Bank of Zambia, Republic of Zambia, Zambia Development Agency and Private Sector Development Agency.
Central Bank of Kenya (2015) ‘Foreign investment survey 2015: Preliminary report’. Nairobi: Kenya National Bureau of Statistics, KenInvest and Central Bank of Kenya.
Chen, G., Geiger, M. and Fu, M. (2015) Manufacturing FDI in Sub-Saharan Africa: Trends, determinants, and impact. Washington, DC: World Bank.
National Bank of Rwanda (2013) ‘Foreign private capital in Rwanda: Year 2013’. Kigali: National Bank of Rwanda, Rwanda Development Board, National Institute of Statistics of Rwanda and PSF.
DEVELOPING EXPORT-BASED MANUFACTURING IN SUB-SAHARAN AFRICA
37
APPENDIX I: GLOBAL AND AFRICAN MANUFACTURING EXPORTS Figure A.1: Value of world manufactures exports, 2005–2014
Note: Manufactures includes SITC 5-8 (less 667 and 68).
Source: UNCTADStat.
Figure A.2: Share of manufactures in total world merchandise exports, 2005–2014
Note: Manufactures includes SITC 5-8 (less 667 and 68).
Source: UNCTADStat.
0
2,000
4,000
6,000
8,000
10,000
12,000
14,000
2005 2006 2007 2008 2009 2010 2011 2012 2013 2014
US
$ b
illio
ns
0%
10%
20%
30%
40%
50%
60%
70%
80%
2005 2006 2007 2008 2009 2010 2011 2012 2013 2014
US
$ b
illio
ns
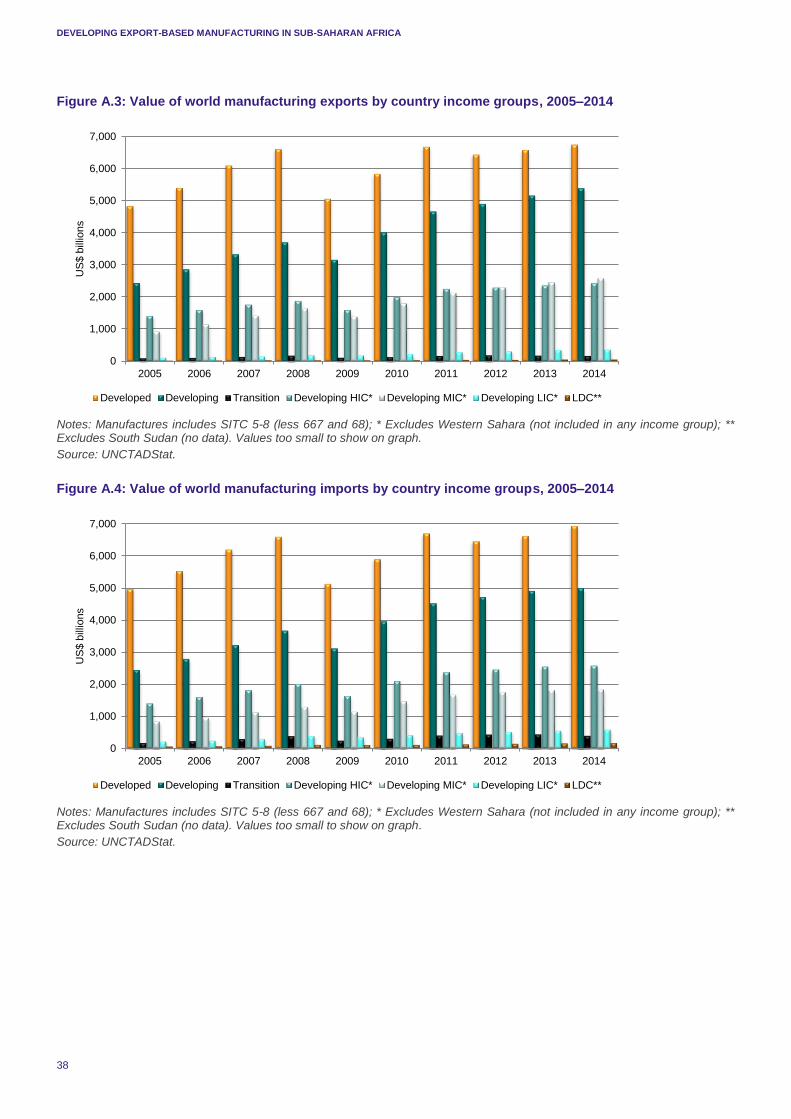
DEVELOPING EXPORT-BASED MANUFACTURING IN SUB-SAHARAN AFRICA
38
Figure A.3: Value of world manufacturing exports by country income groups, 2005–2014
Notes: Manufactures includes SITC 5-8 (less 667 and 68); * Excludes Western Sahara (not included in any income group); ** Excludes South Sudan (no data). Values too small to show on graph.
Source: UNCTADStat.
Figure A.4: Value of world manufacturing imports by country income groups, 2005–2014
Notes: Manufactures includes SITC 5-8 (less 667 and 68); * Excludes Western Sahara (not included in any income group); ** Excludes South Sudan (no data). Values too small to show on graph.
Source: UNCTADStat.
0
1,000
2,000
3,000
4,000
5,000
6,000
7,000
2005 2006 2007 2008 2009 2010 2011 2012 2013 2014
US
$ b
illio
ns
Developed Developing Transition Developing HIC* Developing MIC* Developing LIC* LDC**
0
1,000
2,000
3,000
4,000
5,000
6,000
7,000
2005 2006 2007 2008 2009 2010 2011 2012 2013 2014
US
$ b
illio
ns
Developed Developing Transition Developing HIC* Developing MIC* Developing LIC* LDC**
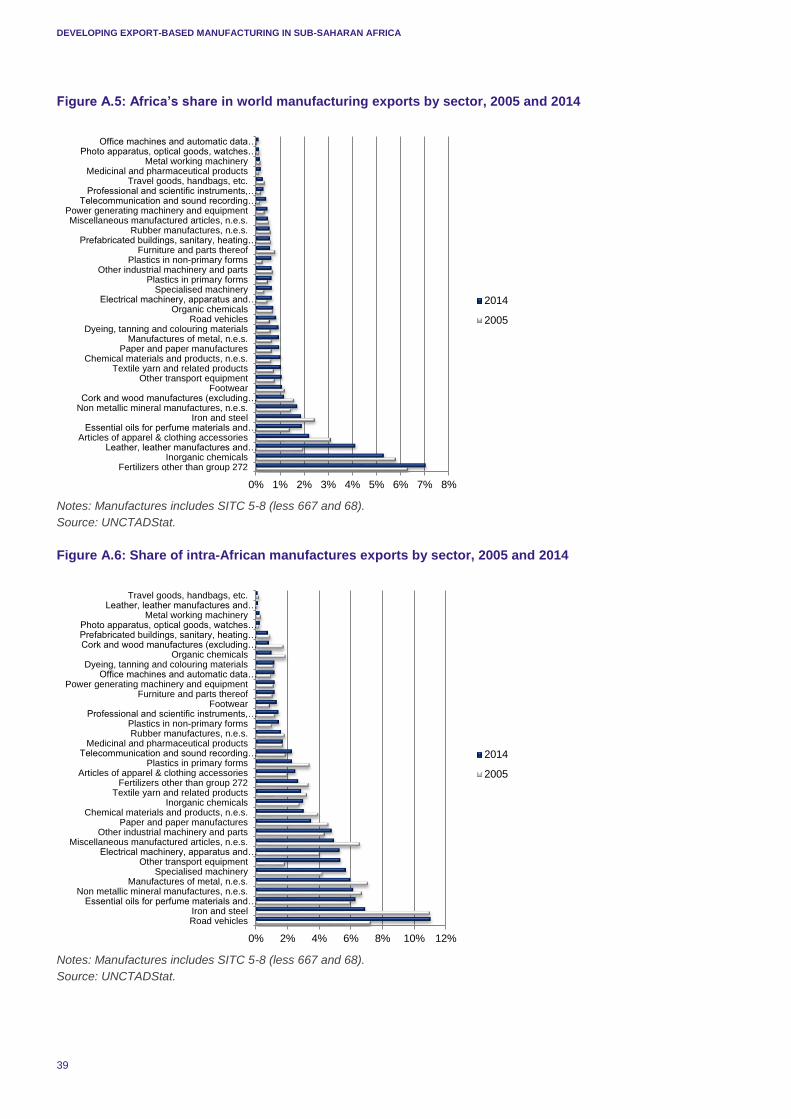
DEVELOPING EXPORT-BASED MANUFACTURING IN SUB-SAHARAN AFRICA
39
Figure A.5: Africa’s share in world manufacturing exports by sector, 2005 and 2014
Notes: Manufactures includes SITC 5-8 (less 667 and 68).
Source: UNCTADStat.
Figure A.6: Share of intra-African manufactures exports by sector, 2005 and 2014
Notes: Manufactures includes SITC 5-8 (less 667 and 68).
Source: UNCTADStat.
0% 1% 2% 3% 4% 5% 6% 7% 8%
Fertilizers other than group 272Inorganic chemicals
Leather, leather manufactures and…Articles of apparel & clothing accessories
Essential oils for perfume materials and…Iron and steel
Non metallic mineral manufactures, n.e.s.Cork and wood manufactures (excluding…
FootwearOther transport equipment
Textile yarn and related productsChemical materials and products, n.e.s.
Paper and paper manufacturesManufactures of metal, n.e.s.
Dyeing, tanning and colouring materialsRoad vehicles
Organic chemicalsElectrical machinery, apparatus and…
Specialised machineryPlastics in primary forms
Other industrial machinery and partsPlastics in non-primary forms
Furniture and parts thereofPrefabricated buildings, sanitary, heating…
Rubber manufactures, n.e.s.Miscellaneous manufactured articles, n.e.s.
Power generating machinery and equipmentTelecommunication and sound recording…
Professional and scientific instruments,…Travel goods, handbags, etc.
Medicinal and pharmaceutical productsMetal working machinery
Photo apparatus, optical goods, watches…Office machines and automatic data…
2014
2005
0% 2% 4% 6% 8% 10% 12%
Road vehiclesIron and steel
Essential oils for perfume materials and…Non metallic mineral manufactures, n.e.s.
Manufactures of metal, n.e.s.Specialised machinery
Other transport equipmentElectrical machinery, apparatus and…
Miscellaneous manufactured articles, n.e.s.Other industrial machinery and parts
Paper and paper manufacturesChemical materials and products, n.e.s.
Inorganic chemicalsTextile yarn and related products
Fertilizers other than group 272Articles of apparel & clothing accessories
Plastics in primary formsTelecommunication and sound recording…
Medicinal and pharmaceutical productsRubber manufactures, n.e.s.Plastics in non-primary forms
Professional and scientific instruments,…Footwear
Furniture and parts thereofPower generating machinery and equipment
Office machines and automatic data…Dyeing, tanning and colouring materials
Organic chemicalsCork and wood manufactures (excluding…Prefabricated buildings, sanitary, heating…Photo apparatus, optical goods, watches…
Metal working machineryLeather, leather manufactures and…
Travel goods, handbags, etc.
2014
2005
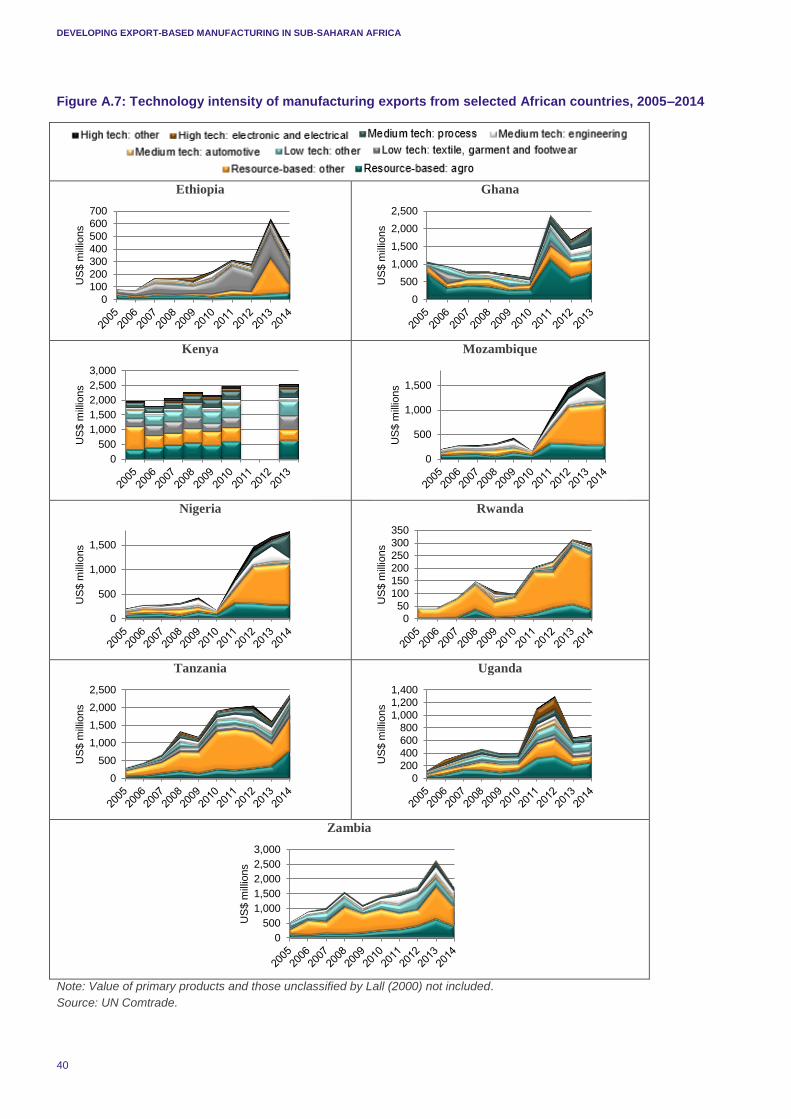
DEVELOPING EXPORT-BASED MANUFACTURING IN SUB-SAHARAN AFRICA
40
Figure A.7: Technology intensity of manufacturing exports from selected African countries, 2005–2014
Ethiopia
Ghana
Kenya
Mozambique
Nigeria
Rwanda
Tanzania
Uganda
Zambia
Note: Value of primary products and those unclassified by Lall (2000) not included.
Source: UN Comtrade.
0
100
200
300
400
500
600
700
US
$ m
illio
ns
0
500
1,000
1,500
2,000
2,500
US
$ m
illio
ns
0
500
1,000
1,500
2,000
2,500
3,000
US
$ m
illio
ns
0
500
1,000
1,500U
S$ m
illio
ns
0
500
1,000
1,500
US
$ m
illio
ns
0
50
100
150
200
250
300
350
US
$ m
illio
ns
0
500
1,000
1,500
2,000
2,500
US
$ m
illio
ns
0
200
400
600
800
1,000
1,200
1,400
US
$ m
illio
ns
0
500
1,000
1,500
2,000
2,500
3,000
US
$ m
illio
ns
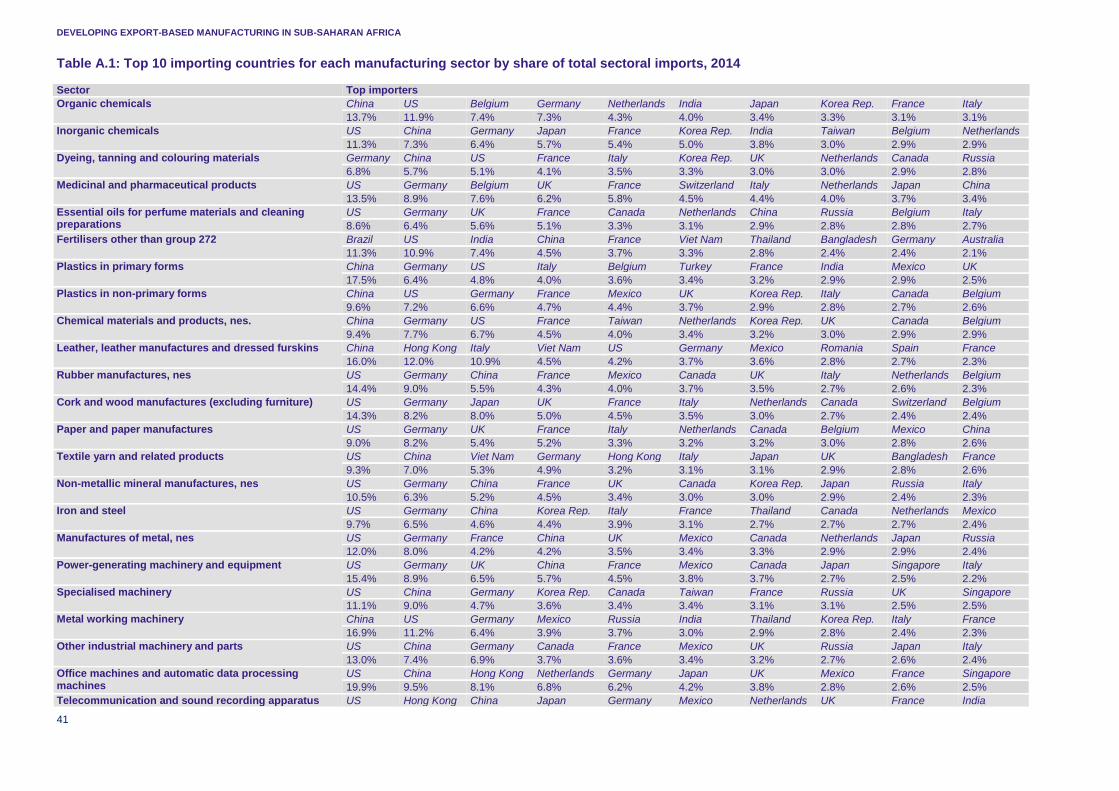
DEVELOPING EXPORT-BASED MANUFACTURING IN SUB-SAHARAN AFRICA
41
Table A.1: Top 10 importing countries for each manufacturing sector by share of total sectoral imports, 2014
Sector Top importers
Organic chemicals China US Belgium Germany Netherlands India Japan Korea Rep. France Italy
13.7% 11.9% 7.4% 7.3% 4.3% 4.0% 3.4% 3.3% 3.1% 3.1%
Inorganic chemicals US China Germany Japan France Korea Rep. India Taiwan Belgium Netherlands
11.3% 7.3% 6.4% 5.7% 5.4% 5.0% 3.8% 3.0% 2.9% 2.9%
Dyeing, tanning and colouring materials Germany China US France Italy Korea Rep. UK Netherlands Canada Russia
6.8% 5.7% 5.1% 4.1% 3.5% 3.3% 3.0% 3.0% 2.9% 2.8%
Medicinal and pharmaceutical products US Germany Belgium UK France Switzerland Italy Netherlands Japan China
13.5% 8.9% 7.6% 6.2% 5.8% 4.5% 4.4% 4.0% 3.7% 3.4%
Essential oils for perfume materials and cleaning preparations
US Germany UK France Canada Netherlands China Russia Belgium Italy
8.6% 6.4% 5.6% 5.1% 3.3% 3.1% 2.9% 2.8% 2.8% 2.7%
Fertilisers other than group 272 Brazil US India China France Viet Nam Thailand Bangladesh Germany Australia
11.3% 10.9% 7.4% 4.5% 3.7% 3.3% 2.8% 2.4% 2.4% 2.1%
Plastics in primary forms China Germany US Italy Belgium Turkey France India Mexico UK
17.5% 6.4% 4.8% 4.0% 3.6% 3.4% 3.2% 2.9% 2.9% 2.5%
Plastics in non-primary forms China US Germany France Mexico UK Korea Rep. Italy Canada Belgium
9.6% 7.2% 6.6% 4.7% 4.4% 3.7% 2.9% 2.8% 2.7% 2.6%
Chemical materials and products, nes. China Germany US France Taiwan Netherlands Korea Rep. UK Canada Belgium
9.4% 7.7% 6.7% 4.5% 4.0% 3.4% 3.2% 3.0% 2.9% 2.9%
Leather, leather manufactures and dressed furskins China Hong Kong Italy Viet Nam US Germany Mexico Romania Spain France
16.0% 12.0% 10.9% 4.5% 4.2% 3.7% 3.6% 2.8% 2.7% 2.3%
Rubber manufactures, nes US Germany China France Mexico Canada UK Italy Netherlands Belgium
14.4% 9.0% 5.5% 4.3% 4.0% 3.7% 3.5% 2.7% 2.6% 2.3%
Cork and wood manufactures (excluding furniture) US Germany Japan UK France Italy Netherlands Canada Switzerland Belgium
14.3% 8.2% 8.0% 5.0% 4.5% 3.5% 3.0% 2.7% 2.4% 2.4%
Paper and paper manufactures US Germany UK France Italy Netherlands Canada Belgium Mexico China
9.0% 8.2% 5.4% 5.2% 3.3% 3.2% 3.2% 3.0% 2.8% 2.6%
Textile yarn and related products US China Viet Nam Germany Hong Kong Italy Japan UK Bangladesh France
9.3% 7.0% 5.3% 4.9% 3.2% 3.1% 3.1% 2.9% 2.8% 2.6%
Non-metallic mineral manufactures, nes US Germany China France UK Canada Korea Rep. Japan Russia Italy
10.5% 6.3% 5.2% 4.5% 3.4% 3.0% 3.0% 2.9% 2.4% 2.3%
Iron and steel US Germany China Korea Rep. Italy France Thailand Canada Netherlands Mexico
9.7% 6.5% 4.6% 4.4% 3.9% 3.1% 2.7% 2.7% 2.7% 2.4%
Manufactures of metal, nes US Germany France China UK Mexico Canada Netherlands Japan Russia
12.0% 8.0% 4.2% 4.2% 3.5% 3.4% 3.3% 2.9% 2.9% 2.4%
Power-generating machinery and equipment US Germany UK China France Mexico Canada Japan Singapore Italy
15.4% 8.9% 6.5% 5.7% 4.5% 3.8% 3.7% 2.7% 2.5% 2.2%
Specialised machinery US China Germany Korea Rep. Canada Taiwan France Russia UK Singapore
11.1% 9.0% 4.7% 3.6% 3.4% 3.4% 3.1% 3.1% 2.5% 2.5%
Metal working machinery China US Germany Mexico Russia India Thailand Korea Rep. Italy France
16.9% 11.2% 6.4% 3.9% 3.7% 3.0% 2.9% 2.8% 2.4% 2.3%
Other industrial machinery and parts US China Germany Canada France Mexico UK Russia Japan Italy
13.0% 7.4% 6.9% 3.7% 3.6% 3.4% 3.2% 2.7% 2.6% 2.4%
Office machines and automatic data processing machines
US China Hong Kong Netherlands Germany Japan UK Mexico France Singapore
19.9% 9.5% 8.1% 6.8% 6.2% 4.2% 3.8% 2.8% 2.6% 2.5%
Telecommunication and sound recording apparatus US Hong Kong China Japan Germany Mexico Netherlands UK France India
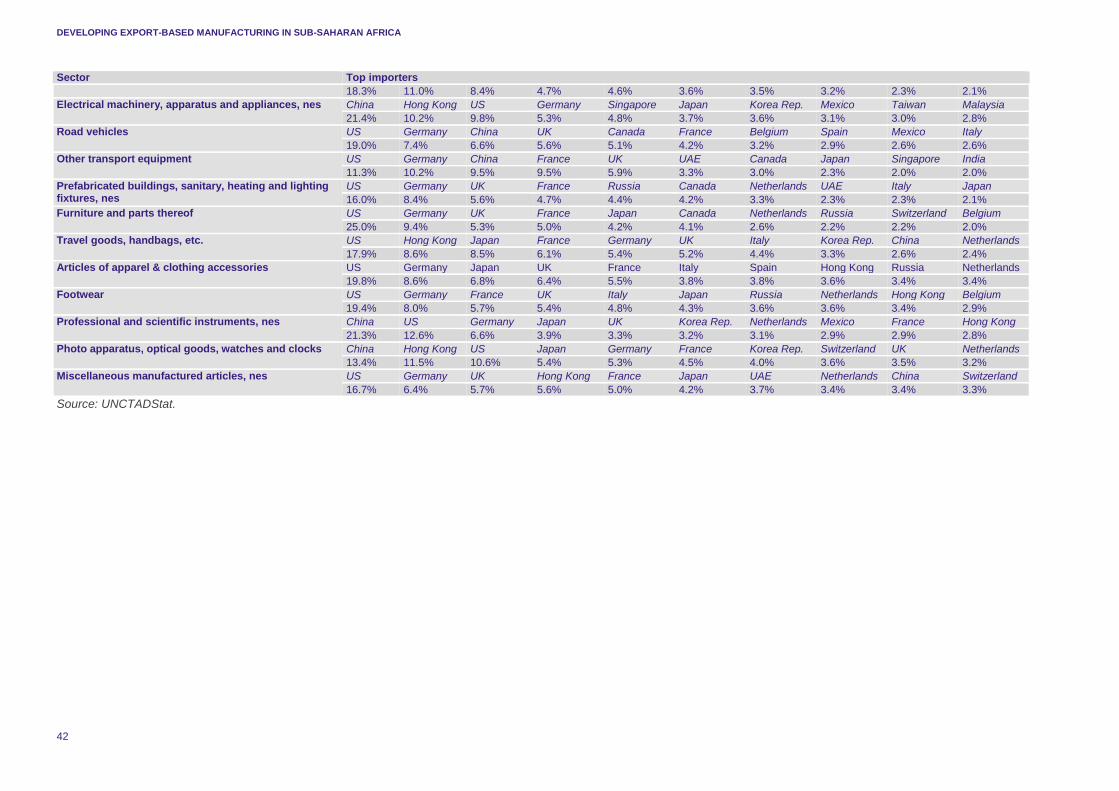
DEVELOPING EXPORT-BASED MANUFACTURING IN SUB-SAHARAN AFRICA
42
Sector Top importers
18.3% 11.0% 8.4% 4.7% 4.6% 3.6% 3.5% 3.2% 2.3% 2.1%
Electrical machinery, apparatus and appliances, nes China Hong Kong US Germany Singapore Japan Korea Rep. Mexico Taiwan Malaysia
21.4% 10.2% 9.8% 5.3% 4.8% 3.7% 3.6% 3.1% 3.0% 2.8%
Road vehicles US Germany China UK Canada France Belgium Spain Mexico Italy
19.0% 7.4% 6.6% 5.6% 5.1% 4.2% 3.2% 2.9% 2.6% 2.6%
Other transport equipment US Germany China France UK UAE Canada Japan Singapore India
11.3% 10.2% 9.5% 9.5% 5.9% 3.3% 3.0% 2.3% 2.0% 2.0%
Prefabricated buildings, sanitary, heating and lighting fixtures, nes
US Germany UK France Russia Canada Netherlands UAE Italy Japan
16.0% 8.4% 5.6% 4.7% 4.4% 4.2% 3.3% 2.3% 2.3% 2.1%
Furniture and parts thereof US Germany UK France Japan Canada Netherlands Russia Switzerland Belgium
25.0% 9.4% 5.3% 5.0% 4.2% 4.1% 2.6% 2.2% 2.2% 2.0%
Travel goods, handbags, etc. US Hong Kong Japan France Germany UK Italy Korea Rep. China Netherlands
17.9% 8.6% 8.5% 6.1% 5.4% 5.2% 4.4% 3.3% 2.6% 2.4%
Articles of apparel & clothing accessories US Germany Japan UK France Italy Spain Hong Kong Russia Netherlands
19.8% 8.6% 6.8% 6.4% 5.5% 3.8% 3.8% 3.6% 3.4% 3.4%
Footwear US Germany France UK Italy Japan Russia Netherlands Hong Kong Belgium
19.4% 8.0% 5.7% 5.4% 4.8% 4.3% 3.6% 3.6% 3.4% 2.9%
Professional and scientific instruments, nes China US Germany Japan UK Korea Rep. Netherlands Mexico France Hong Kong
21.3% 12.6% 6.6% 3.9% 3.3% 3.2% 3.1% 2.9% 2.9% 2.8%
Photo apparatus, optical goods, watches and clocks China Hong Kong US Japan Germany France Korea Rep. Switzerland UK Netherlands
13.4% 11.5% 10.6% 5.4% 5.3% 4.5% 4.0% 3.6% 3.5% 3.2%
Miscellaneous manufactured articles, nes US Germany UK Hong Kong France Japan UAE Netherlands China Switzerland
16.7% 6.4% 5.7% 5.6% 5.0% 4.2% 3.7% 3.4% 3.4% 3.3%
Source: UNCTADStat.
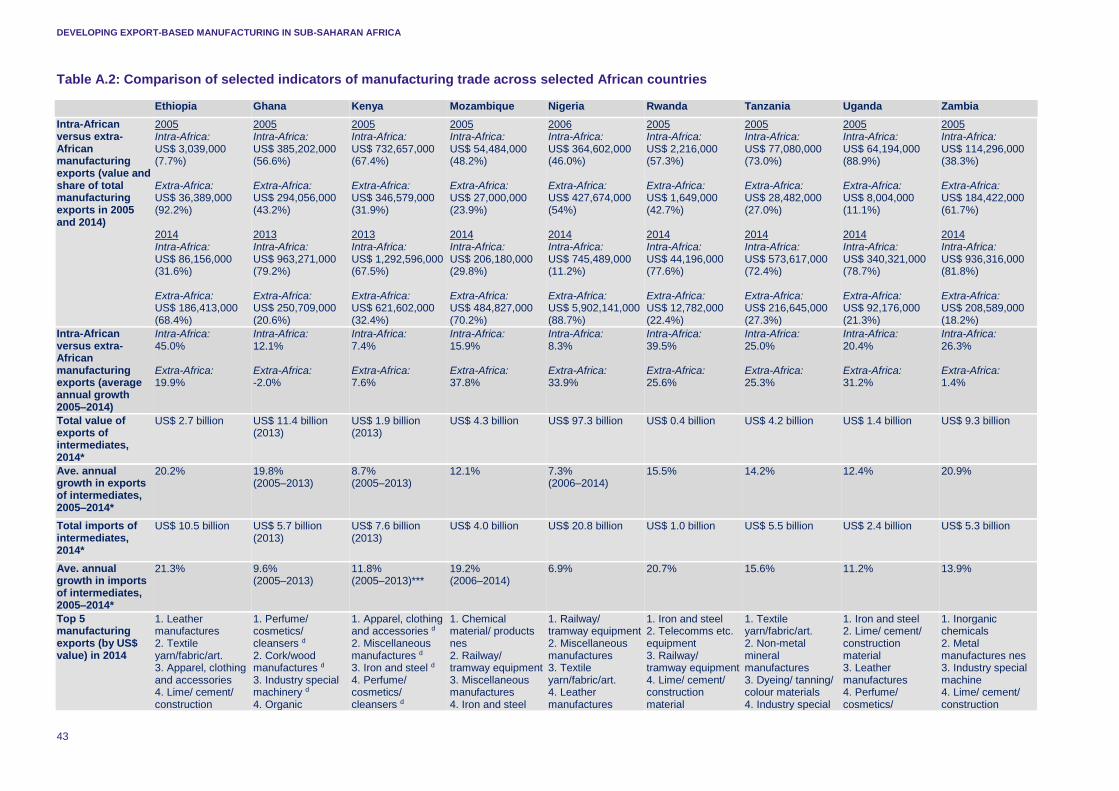
DEVELOPING EXPORT-BASED MANUFACTURING IN SUB-SAHARAN AFRICA
43
Table A.2: Comparison of selected indicators of manufacturing trade across selected African countries
Ethiopia Ghana Kenya Mozambique Nigeria Rwanda Tanzania Uganda Zambia
Intra-African versus extra-African manufacturing exports (value and share of total manufacturing exports in 2005 and 2014)
2005 Intra-Africa: US$ 3,039,000 (7.7%) Extra-Africa: US$ 36,389,000 (92.2%) 2014 Intra-Africa: US$ 86,156,000 (31.6%) Extra-Africa: US$ 186,413,000 (68.4%)
2005 Intra-Africa: US$ 385,202,000 (56.6%) Extra-Africa: US$ 294,056,000 (43.2%) 2013 Intra-Africa: US$ 963,271,000 (79.2%) Extra-Africa: US$ 250,709,000 (20.6%)
2005 Intra-Africa: US$ 732,657,000 (67.4%) Extra-Africa: US$ 346,579,000 (31.9%) 2013 Intra-Africa: US$ 1,292,596,000 (67.5%) Extra-Africa: US$ 621,602,000 (32.4%)
2005 Intra-Africa: US$ 54,484,000 (48.2%) Extra-Africa: US$ 27,000,000 (23.9%) 2014 Intra-Africa: US$ 206,180,000 (29.8%) Extra-Africa: US$ 484,827,000 (70.2%)
2006 Intra-Africa: US$ 364,602,000 (46.0%) Extra-Africa: US$ 427,674,000 (54%) 2014 Intra-Africa: US$ 745,489,000 (11.2%) Extra-Africa: US$ 5,902,141,000 (88.7%)
2005 Intra-Africa: US$ 2,216,000 (57.3%) Extra-Africa: US$ 1,649,000 (42.7%) 2014 Intra-Africa: US$ 44,196,000 (77.6%) Extra-Africa: US$ 12,782,000 (22.4%)
2005 Intra-Africa: US$ 77,080,000 (73.0%) Extra-Africa: US$ 28,482,000 (27.0%) 2014 Intra-Africa: US$ 573,617,000 (72.4%) Extra-Africa: US$ 216,645,000 (27.3%)
2005 Intra-Africa: US$ 64,194,000 (88.9%) Extra-Africa: US$ 8,004,000 (11.1%) 2014 Intra-Africa: US$ 340,321,000 (78.7%) Extra-Africa: US$ 92,176,000 (21.3%)
2005 Intra-Africa: US$ 114,296,000 (38.3%) Extra-Africa: US$ 184,422,000 (61.7%) 2014 Intra-Africa: US$ 936,316,000 (81.8%) Extra-Africa: US$ 208,589,000 (18.2%)
Intra-African versus extra-African manufacturing exports (average annual growth 2005–2014)
Intra-Africa: 45.0% Extra-Africa: 19.9%
Intra-Africa: 12.1% Extra-Africa: -2.0%
Intra-Africa: 7.4% Extra-Africa: 7.6%
Intra-Africa: 15.9% Extra-Africa: 37.8%
Intra-Africa: 8.3% Extra-Africa: 33.9%
Intra-Africa: 39.5% Extra-Africa: 25.6%
Intra-Africa: 25.0% Extra-Africa: 25.3%
Intra-Africa: 20.4% Extra-Africa: 31.2%
Intra-Africa: 26.3% Extra-Africa: 1.4%
Total value of exports of intermediates, 2014*
US$ 2.7 billion US$ 11.4 billion (2013)
US$ 1.9 billion (2013)
US$ 4.3 billion US$ 97.3 billion US$ 0.4 billion US$ 4.2 billion US$ 1.4 billion US$ 9.3 billion
Ave. annual growth in exports of intermediates, 2005–2014*
20.2%
19.8% (2005–2013)
8.7% (2005–2013)
12.1%
7.3% (2006–2014)
15.5%
14.2%
12.4%
20.9%
Total imports of intermediates, 2014*
US$ 10.5 billion US$ 5.7 billion (2013)
US$ 7.6 billion (2013)
US$ 4.0 billion US$ 20.8 billion US$ 1.0 billion US$ 5.5 billion US$ 2.4 billion US$ 5.3 billion
Ave. annual growth in imports of intermediates, 2005–2014*
21.3%
9.6% (2005–2013)
11.8% (2005–2013)***
19.2% (2006–2014)
6.9%
20.7%
15.6%
11.2%
13.9%
Top 5 manufacturing exports (by US$ value) in 2014
1. Leather manufactures 2. Textile yarn/fabric/art. 3. Apparel, clothing and accessories 4. Lime/ cement/ construction
1. Perfume/ cosmetics/ cleansers d 2. Cork/wood manufactures d 3. Industry special machinery d 4. Organic
1. Apparel, clothing and accessories d 2. Miscellaneous manufactures d 3. Iron and steel d 4. Perfume/ cosmetics/ cleansers d
1. Chemical material/ products nes 2. Railway/ tramway equipment 3. Miscellaneous manufactures 4. Iron and steel
1. Railway/ tramway equipment 2. Miscellaneous manufactures 3. Textile yarn/fabric/art. 4. Leather manufactures
1. Iron and steel 2. Telecomms etc. equipment 3. Railway/ tramway equipment 4. Lime/ cement/ construction material
1. Textile yarn/fabric/art. 2. Non-metal mineral manufactures 3. Dyeing/ tanning/ colour materials 4. Industry special
1. Iron and steel 2. Lime/ cement/ construction material 3. Leather manufactures 4. Perfume/ cosmetics/
1. Inorganic chemicals 2. Metal manufactures nes 3. Industry special machine 4. Lime/ cement/ construction
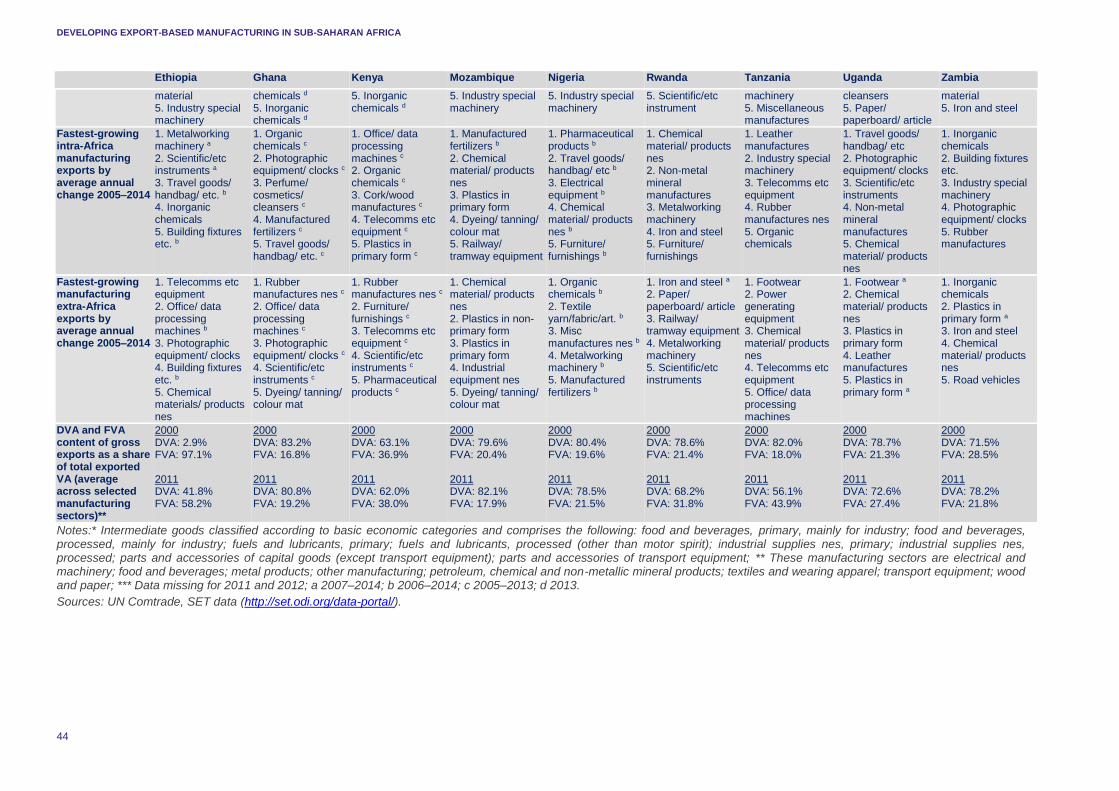
DEVELOPING EXPORT-BASED MANUFACTURING IN SUB-SAHARAN AFRICA
44
Ethiopia Ghana Kenya Mozambique Nigeria Rwanda Tanzania Uganda Zambia
material 5. Industry special machinery
chemicals d 5. Inorganic chemicals d
5. Inorganic chemicals d
5. Industry special machinery
5. Industry special machinery
5. Scientific/etc instrument
machinery 5. Miscellaneous manufactures
cleansers 5. Paper/ paperboard/ article
material 5. Iron and steel
Fastest-growing intra-Africa manufacturing exports by average annual change 2005–2014
1. Metalworking machinery a 2. Scientific/etc instruments a 3. Travel goods/ handbag/ etc. b 4. Inorganic chemicals 5. Building fixtures etc. b
1. Organic chemicals c 2. Photographic equipment/ clocks c 3. Perfume/ cosmetics/ cleansers c 4. Manufactured fertilizers c 5. Travel goods/ handbag/ etc. c
1. Office/ data processing machines c 2. Organic chemicals c 3. Cork/wood manufactures c 4. Telecomms etc equipment c 5. Plastics in primary form c
1. Manufactured fertilizers b 2. Chemical material/ products nes 3. Plastics in primary form 4. Dyeing/ tanning/ colour mat 5. Railway/ tramway equipment
1. Pharmaceutical products b 2. Travel goods/ handbag/ etc b 3. Electrical equipment b 4. Chemical material/ products nes b 5. Furniture/ furnishings b
1. Chemical material/ products nes 2. Non-metal mineral manufactures 3. Metalworking machinery 4. Iron and steel 5. Furniture/ furnishings
1. Leather manufactures 2. Industry special machinery 3. Telecomms etc equipment 4. Rubber manufactures nes 5. Organic chemicals
1. Travel goods/ handbag/ etc 2. Photographic equipment/ clocks 3. Scientific/etc instruments 4. Non-metal mineral manufactures 5. Chemical material/ products nes
1. Inorganic chemicals 2. Building fixtures etc. 3. Industry special machinery 4. Photographic equipment/ clocks 5. Rubber manufactures
Fastest-growing manufacturing extra-Africa exports by average annual change 2005–2014
1. Telecomms etc equipment 2. Office/ data processing machines b 3. Photographic equipment/ clocks 4. Building fixtures etc. b 5. Chemical materials/ products nes
1. Rubber manufactures nes c 2. Office/ data processing machines c 3. Photographic equipment/ clocks c 4. Scientific/etc instruments c 5. Dyeing/ tanning/ colour mat
1. Rubber manufactures nes c 2. Furniture/ furnishings c 3. Telecomms etc equipment c 4. Scientific/etc instruments c 5. Pharmaceutical products c
1. Chemical material/ products nes 2. Plastics in non-primary form 3. Plastics in primary form 4. Industrial equipment nes 5. Dyeing/ tanning/ colour mat
1. Organic chemicals b 2. Textile yarn/fabric/art. b 3. Misc manufactures nes b 4. Metalworking machinery b 5. Manufactured fertilizers b
1. Iron and steel a 2. Paper/ paperboard/ article 3. Railway/ tramway equipment 4. Metalworking machinery 5. Scientific/etc instruments
1. Footwear 2. Power generating equipment 3. Chemical material/ products nes 4. Telecomms etc equipment 5. Office/ data processing machines
1. Footwear a 2. Chemical material/ products nes 3. Plastics in primary form 4. Leather manufactures 5. Plastics in primary form a
1. Inorganic chemicals 2. Plastics in primary form a 3. Iron and steel 4. Chemical material/ products nes 5. Road vehicles
DVA and FVA content of gross exports as a share of total exported VA (average across selected manufacturing sectors)**
2000 DVA: 2.9% FVA: 97.1% 2011 DVA: 41.8% FVA: 58.2%
2000 DVA: 83.2% FVA: 16.8% 2011 DVA: 80.8% FVA: 19.2%
2000 DVA: 63.1% FVA: 36.9% 2011 DVA: 62.0% FVA: 38.0%
2000 DVA: 79.6% FVA: 20.4% 2011 DVA: 82.1% FVA: 17.9%
2000 DVA: 80.4% FVA: 19.6% 2011 DVA: 78.5% FVA: 21.5%
2000 DVA: 78.6% FVA: 21.4% 2011 DVA: 68.2% FVA: 31.8%
2000 DVA: 82.0% FVA: 18.0% 2011 DVA: 56.1% FVA: 43.9%
2000 DVA: 78.7% FVA: 21.3% 2011 DVA: 72.6% FVA: 27.4%
2000 DVA: 71.5% FVA: 28.5% 2011 DVA: 78.2% FVA: 21.8%
Notes:* Intermediate goods classified according to basic economic categories and comprises the following: food and beverages, primary, mainly for industry; food and beverages, processed, mainly for industry; fuels and lubricants, primary; fuels and lubricants, processed (other than motor spirit); industrial supplies nes, primary; industrial supplies nes, processed; parts and accessories of capital goods (except transport equipment); parts and accessories of transport equipment; ** These manufacturing sectors are electrical and machinery; food and beverages; metal products; other manufacturing; petroleum, chemical and non-metallic mineral products; textiles and wearing apparel; transport equipment; wood and paper; *** Data missing for 2011 and 2012; a 2007–2014; b 2006–2014; c 2005–2013; d 2013.
Sources: UN Comtrade, SET data (http://set.odi.org/data-portal/).
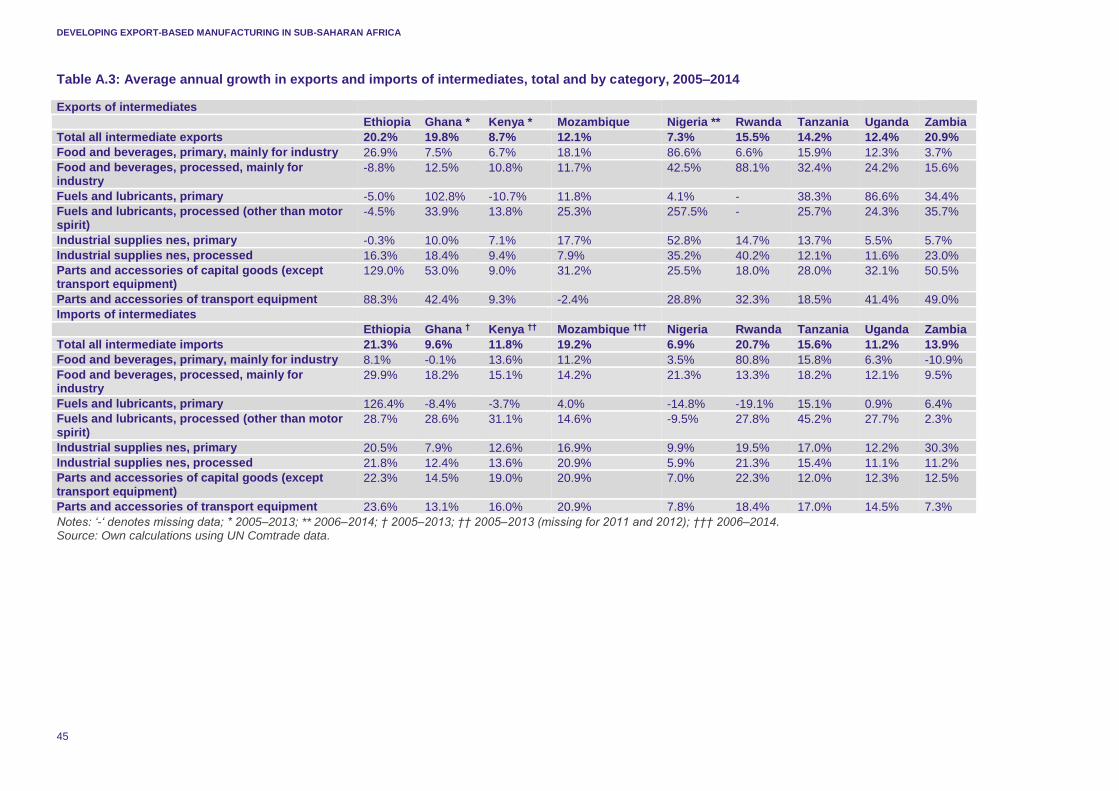
DEVELOPING EXPORT-BASED MANUFACTURING IN SUB-SAHARAN AFRICA
45
Table A.3: Average annual growth in exports and imports of intermediates, total and by category, 2005–2014
Exports of intermediates
Ethiopia Ghana * Kenya * Mozambique Nigeria ** Rwanda Tanzania Uganda Zambia
Total all intermediate exports 20.2% 19.8% 8.7% 12.1% 7.3% 15.5% 14.2% 12.4% 20.9%
Food and beverages, primary, mainly for industry 26.9% 7.5% 6.7% 18.1% 86.6% 6.6% 15.9% 12.3% 3.7%
Food and beverages, processed, mainly for industry
-8.8% 12.5% 10.8% 11.7% 42.5% 88.1% 32.4% 24.2% 15.6%
Fuels and lubricants, primary -5.0% 102.8% -10.7% 11.8% 4.1% - 38.3% 86.6% 34.4%
Fuels and lubricants, processed (other than motor spirit)
-4.5% 33.9% 13.8% 25.3% 257.5% - 25.7% 24.3% 35.7%
Industrial supplies nes, primary -0.3% 10.0% 7.1% 17.7% 52.8% 14.7% 13.7% 5.5% 5.7%
Industrial supplies nes, processed 16.3% 18.4% 9.4% 7.9% 35.2% 40.2% 12.1% 11.6% 23.0%
Parts and accessories of capital goods (except transport equipment)
129.0% 53.0% 9.0% 31.2% 25.5% 18.0% 28.0% 32.1% 50.5%
Parts and accessories of transport equipment 88.3% 42.4% 9.3% -2.4% 28.8% 32.3% 18.5% 41.4% 49.0%
Imports of intermediates
Ethiopia Ghana † Kenya †† Mozambique ††† Nigeria Rwanda Tanzania Uganda Zambia
Total all intermediate imports 21.3% 9.6% 11.8% 19.2% 6.9% 20.7% 15.6% 11.2% 13.9%
Food and beverages, primary, mainly for industry 8.1% -0.1% 13.6% 11.2% 3.5% 80.8% 15.8% 6.3% -10.9%
Food and beverages, processed, mainly for industry
29.9% 18.2% 15.1% 14.2% 21.3% 13.3% 18.2% 12.1% 9.5%
Fuels and lubricants, primary 126.4% -8.4% -3.7% 4.0% -14.8% -19.1% 15.1% 0.9% 6.4%
Fuels and lubricants, processed (other than motor spirit)
28.7% 28.6% 31.1% 14.6% -9.5% 27.8% 45.2% 27.7% 2.3%
Industrial supplies nes, primary 20.5% 7.9% 12.6% 16.9% 9.9% 19.5% 17.0% 12.2% 30.3%
Industrial supplies nes, processed 21.8% 12.4% 13.6% 20.9% 5.9% 21.3% 15.4% 11.1% 11.2%
Parts and accessories of capital goods (except transport equipment)
22.3% 14.5% 19.0% 20.9% 7.0% 22.3% 12.0% 12.3% 12.5%
Parts and accessories of transport equipment 23.6% 13.1% 16.0% 20.9% 7.8% 18.4% 17.0% 14.5% 7.3%
Notes: ‘-‘ denotes missing data; * 2005–2013; ** 2006–2014; † 2005–2013; †† 2005–2013 (missing for 2011 and 2012); ††† 2006–2014. Source: Own calculations using UN Comtrade data.
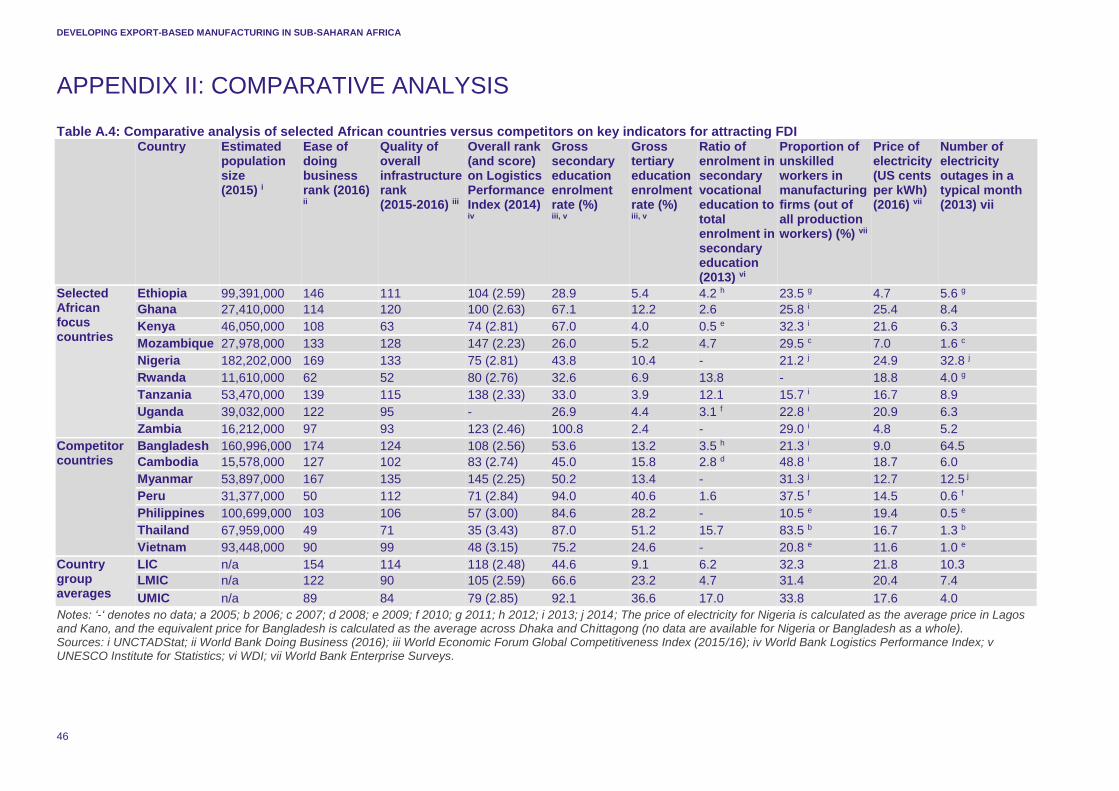
DEVELOPING EXPORT-BASED MANUFACTURING IN SUB-SAHARAN AFRICA
46
APPENDIX II: COMPARATIVE ANALYSIS Table A.4: Comparative analysis of selected African countries versus competitors on key indicators for attracting FDI Country Estimated
population size (2015) i
Ease of doing business rank (2016) ii
Quality of overall infrastructure rank (2015-2016) iii
Overall rank (and score) on Logistics Performance Index (2014) iv
Gross secondary education enrolment rate (%) iii, v
Gross tertiary education enrolment rate (%) iii, v
Ratio of enrolment in secondary vocational education to total enrolment in secondary education (2013) vi
Proportion of unskilled workers in manufacturing firms (out of all production workers) (%) vii
Price of electricity (US cents per kWh) (2016) vii
Number of electricity outages in a typical month (2013) vii
Selected African focus countries
Ethiopia 99,391,000 146 111 104 (2.59) 28.9 5.4 4.2 h 23.5 g 4.7 5.6 g
Ghana 27,410,000 114 120 100 (2.63) 67.1 12.2 2.6 25.8 i 25.4 8.4
Kenya 46,050,000 108 63 74 (2.81) 67.0 4.0 0.5 e 32.3 i 21.6 6.3
Mozambique 27,978,000 133 128 147 (2.23) 26.0 5.2 4.7 29.5 c 7.0 1.6 c
Nigeria 182,202,000 169 133 75 (2.81) 43.8 10.4 - 21.2 j 24.9 32.8 j
Rwanda 11,610,000 62 52 80 (2.76) 32.6 6.9 13.8 - 18.8 4.0 g
Tanzania 53,470,000 139 115 138 (2.33) 33.0 3.9 12.1 15.7 i 16.7 8.9
Uganda 39,032,000 122 95 - 26.9 4.4 3.1 f 22.8 i 20.9 6.3
Zambia 16,212,000 97 93 123 (2.46) 100.8 2.4 - 29.0 i 4.8 5.2
Competitor countries
Bangladesh 160,996,000 174 124 108 (2.56) 53.6 13.2 3.5 h 21.3 i 9.0 64.5
Cambodia 15,578,000 127 102 83 (2.74) 45.0 15.8 2.8 d 48.8 i 18.7 6.0
Myanmar 53,897,000 167 135 145 (2.25) 50.2 13.4 - 31.3 j 12.7 12.5 j
Peru 31,377,000 50 112 71 (2.84) 94.0 40.6 1.6 37.5 f 14.5 0.6 f
Philippines 100,699,000 103 106 57 (3.00) 84.6 28.2 - 10.5 e 19.4 0.5 e
Thailand 67,959,000 49 71 35 (3.43) 87.0 51.2 15.7 83.5 b 16.7 1.3 b
Vietnam 93,448,000 90 99 48 (3.15) 75.2 24.6 - 20.8 e 11.6 1.0 e
Country group averages
LIC n/a 154 114 118 (2.48) 44.6 9.1 6.2 32.3 21.8 10.3
LMIC n/a 122 90 105 (2.59) 66.6 23.2 4.7 31.4 20.4 7.4
UMIC n/a 89 84 79 (2.85) 92.1 36.6 17.0 33.8 17.6 4.0
Notes: ‘-‘ denotes no data; a 2005; b 2006; c 2007; d 2008; e 2009; f 2010; g 2011; h 2012; i 2013; j 2014; The price of electricity for Nigeria is calculated as the average price in Lagos and Kano, and the equivalent price for Bangladesh is calculated as the average across Dhaka and Chittagong (no data are available for Nigeria or Bangladesh as a whole). Sources: i UNCTADStat; ii World Bank Doing Business (2016); iii World Economic Forum Global Competitiveness Index (2015/16); iv World Bank Logistics Performance Index; v UNESCO Institute for Statistics; vi WDI; vii World Bank Enterprise Surveys.
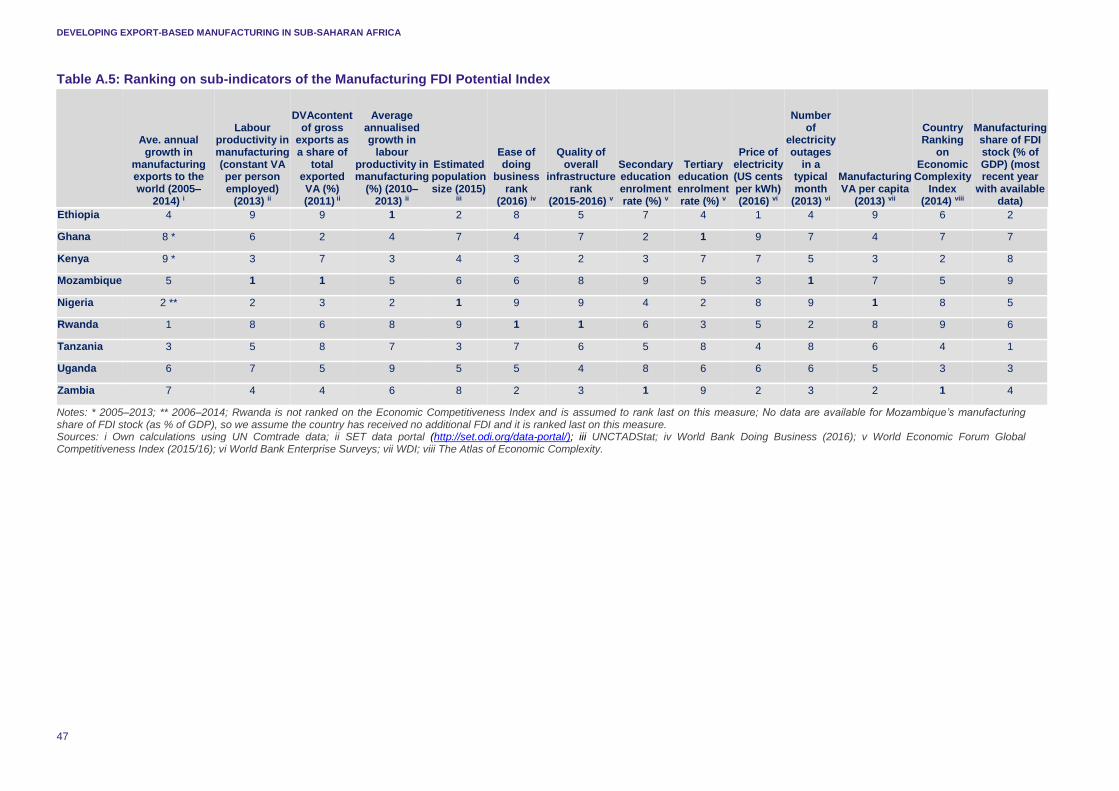
DEVELOPING EXPORT-BASED MANUFACTURING IN SUB-SAHARAN AFRICA
47
Table A.5: Ranking on sub-indicators of the Manufacturing FDI Potential Index
Ave. annual growth in
manufacturing exports to the world (2005–
2014) i
Labour productivity in manufacturing (constant VA per person employed)
(2013) ii
DVAcontent of gross
exports as a share of
total exported VA (%) (2011) ii
Average annualised growth in
labour productivity in manufacturing
(%) (2010–2013) ii
Estimated population size (2015)
iii
Ease of doing
business rank
(2016) iv
Quality of overall
infrastructure rank
(2015-2016) v
Secondary education enrolment rate (%) v
Tertiary education enrolment rate (%) v
Price of electricity (US cents per kWh) (2016) vi
Number of
electricity outages
in a typical month
(2013) vi
Manufacturing VA per capita
(2013) vii
Country Ranking
on Economic
Complexity Index
(2014) viii
Manufacturing share of FDI stock (% of GDP) (most recent year
with available data)
Ethiopia 4 9 9 1 2 8 5 7 4 1 4 9 6 2
Ghana 8 * 6 2 4 7 4 7 2 1 9 7 4 7 7
Kenya 9 * 3 7 3 4 3 2 3 7 7 5 3 2 8
Mozambique 5 1 1 5 6 6 8 9 5 3 1 7 5 9
Nigeria 2 ** 2 3 2 1 9 9 4 2 8 9 1 8 5
Rwanda 1 8 6 8 9 1 1 6 3 5 2 8 9 6
Tanzania 3 5 8 7 3 7 6 5 8 4 8 6 4 1
Uganda 6 7 5 9 5 5 4 8 6 6 6 5 3 3
Zambia 7 4 4 6 8 2 3 1 9 2 3 2 1 4
Notes: * 2005–2013; ** 2006–2014; Rwanda is not ranked on the Economic Competitiveness Index and is assumed to rank last on this measure; No data are available for Mozambique’s manufacturing share of FDI stock (as % of GDP), so we assume the country has received no additional FDI and it is ranked last on this measure. Sources: i Own calculations using UN Comtrade data; ii SET data portal (http://set.odi.org/data-portal/); iii UNCTADStat; iv World Bank Doing Business (2016); v World Economic Forum Global Competitiveness Index (2015/16); vi World Bank Enterprise Surveys; vii WDI; viii The Atlas of Economic Complexity.
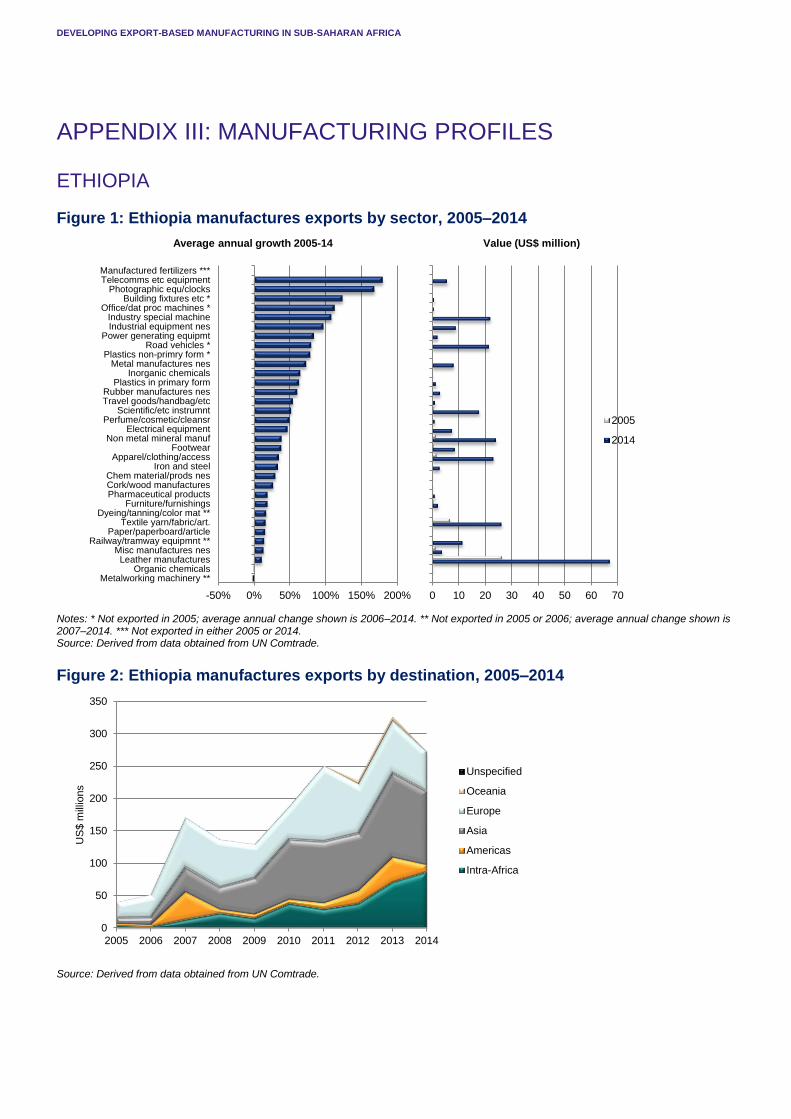
DEVELOPING EXPORT-BASED MANUFACTURING IN SUB-SAHARAN AFRICA
Website
APPENDIX III: MANUFACTURING PROFILES
ETHIOPIA
Figure 1: Ethiopia manufactures exports by sector, 2005–2014
Notes: * Not exported in 2005; average annual change shown is 2006–2014. ** Not exported in 2005 or 2006; average annual change shown is 2007–2014. *** Not exported in either 2005 or 2014. Source: Derived from data obtained from UN Comtrade.
Figure 2: Ethiopia manufactures exports by destination, 2005–2014
Source: Derived from data obtained from UN Comtrade.
0
50
100
150
200
250
300
350
2005 2006 2007 2008 2009 2010 2011 2012 2013 2014
US
$ m
illio
ns
Unspecified
Oceania
Europe
Asia
Americas
Intra-Africa
0 10 20 30 40 50 60 70
Value (US$ million)
2005
2014
-50% 0% 50% 100% 150% 200%
Metalworking machinery **Organic chemicals
Leather manufacturesMisc manufactures nes
Railway/tramway equipmnt **Paper/paperboard/article
Textile yarn/fabric/art.Dyeing/tanning/color mat **
Furniture/furnishingsPharmaceutical productsCork/wood manufacturesChem material/prods nes
Iron and steelApparel/clothing/access
FootwearNon metal mineral manuf
Electrical equipmentPerfume/cosmetic/cleansr
Scientific/etc instrumntTravel goods/handbag/etcRubber manufactures nes
Plastics in primary formInorganic chemicals
Metal manufactures nesPlastics non-primry form *
Road vehicles *Power generating equipmt
Industrial equipment nesIndustry special machine
Office/dat proc machines *Building fixtures etc *
Photographic equ/clocksTelecomms etc equipmentManufactured fertilizers ***
Average annual growth 2005-14
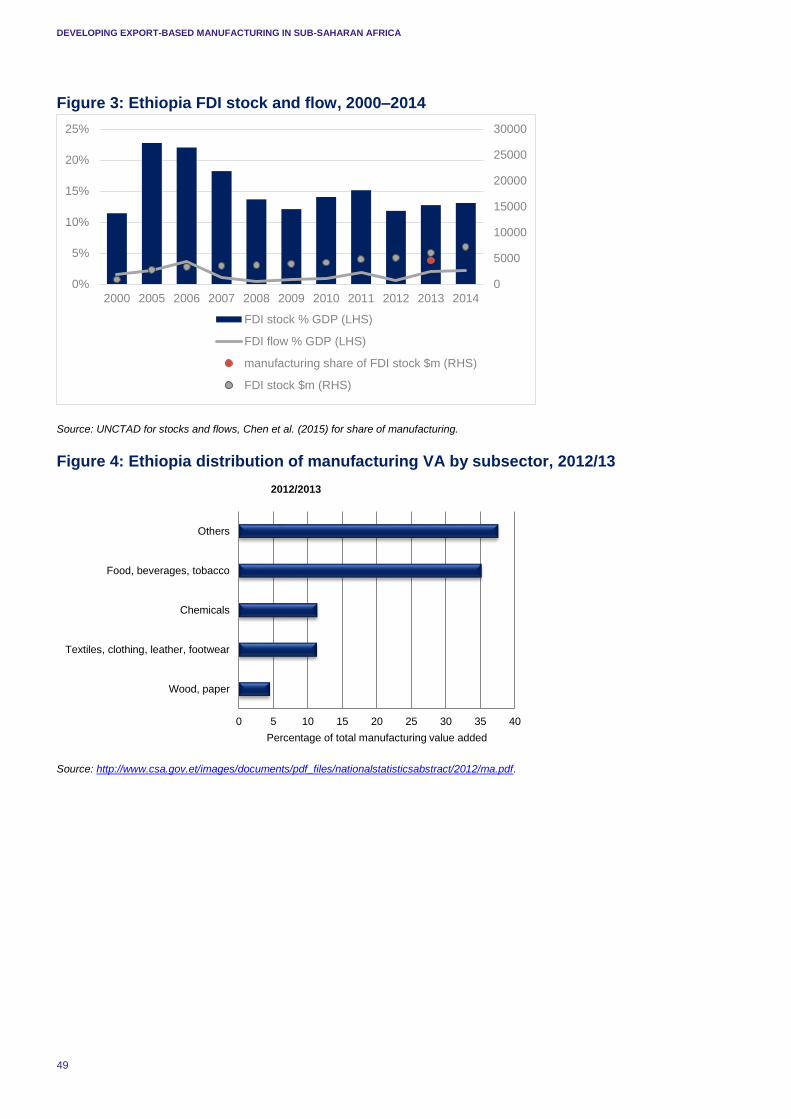
DEVELOPING EXPORT-BASED MANUFACTURING IN SUB-SAHARAN AFRICA
49
Figure 3: Ethiopia FDI stock and flow, 2000–2014
Source: UNCTAD for stocks and flows, Chen et al. (2015) for share of manufacturing.
Figure 4: Ethiopia distribution of manufacturing VA by subsector, 2012/13
Source: http://www.csa.gov.et/images/documents/pdf_files/nationalstatisticsabstract/2012/ma.pdf.
0
5000
10000
15000
20000
25000
30000
0%
5%
10%
15%
20%
25%
2000 2005 2006 2007 2008 2009 2010 2011 2012 2013 2014
FDI stock % GDP (LHS)
FDI flow % GDP (LHS)
manufacturing share of FDI stock $m (RHS)
FDI stock $m (RHS)
0 5 10 15 20 25 30 35 40
Wood, paper
Textiles, clothing, leather, footwear
Chemicals
Food, beverages, tobacco
Others
Percentage of total manufacturing value added
2012/2013
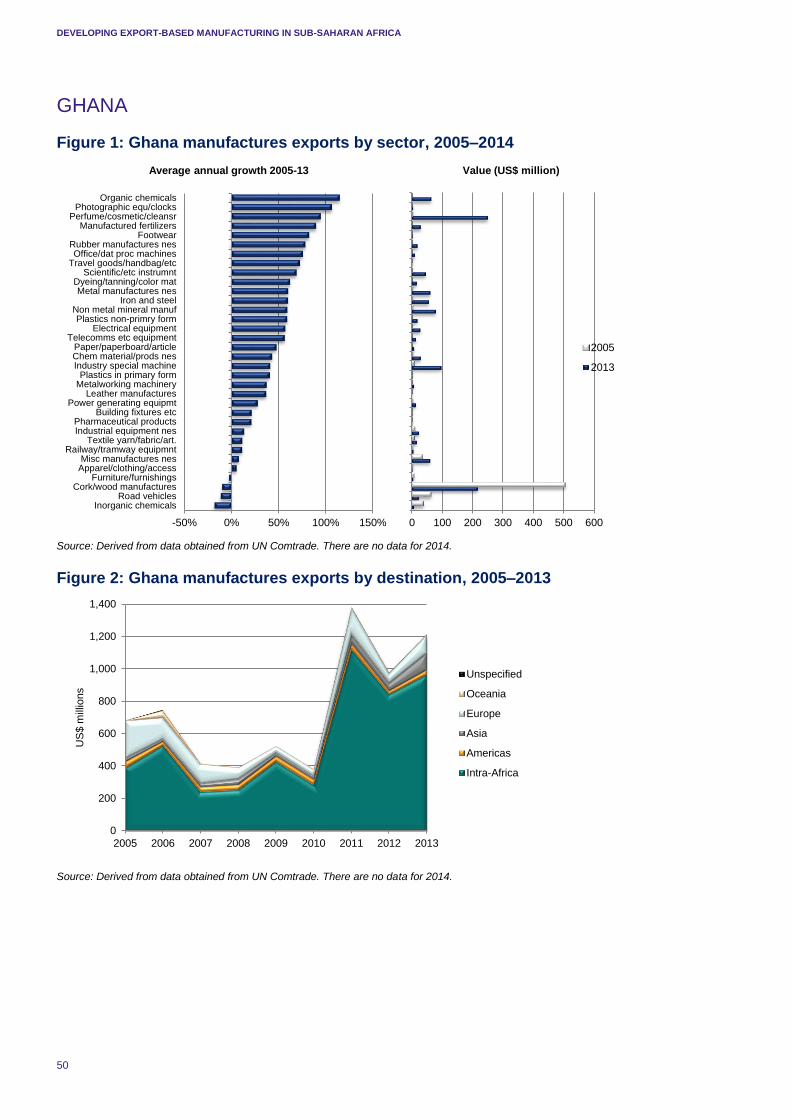
DEVELOPING EXPORT-BASED MANUFACTURING IN SUB-SAHARAN AFRICA
50
GHANA
Figure 1: Ghana manufactures exports by sector, 2005–2014
Source: Derived from data obtained from UN Comtrade. There are no data for 2014.
Figure 2: Ghana manufactures exports by destination, 2005–2013
Source: Derived from data obtained from UN Comtrade. There are no data for 2014.
0
200
400
600
800
1,000
1,200
1,400
2005 2006 2007 2008 2009 2010 2011 2012 2013
US
$ m
illio
ns
Unspecified
Oceania
Europe
Asia
Americas
Intra-Africa
0 100 200 300 400 500 600
Value (US$ million)
2005
2013
-50% 0% 50% 100% 150%
Inorganic chemicalsRoad vehicles
Cork/wood manufacturesFurniture/furnishings
Apparel/clothing/accessMisc manufactures nes
Railway/tramway equipmntTextile yarn/fabric/art.
Industrial equipment nesPharmaceutical products
Building fixtures etcPower generating equipmt
Leather manufacturesMetalworking machineryPlastics in primary form
Industry special machineChem material/prods nesPaper/paperboard/article
Telecomms etc equipmentElectrical equipment
Plastics non-primry formNon metal mineral manuf
Iron and steelMetal manufactures nes
Dyeing/tanning/color matScientific/etc instrumnt
Travel goods/handbag/etcOffice/dat proc machines
Rubber manufactures nesFootwear
Manufactured fertilizersPerfume/cosmetic/cleansr
Photographic equ/clocksOrganic chemicals
Average annual growth 2005-13
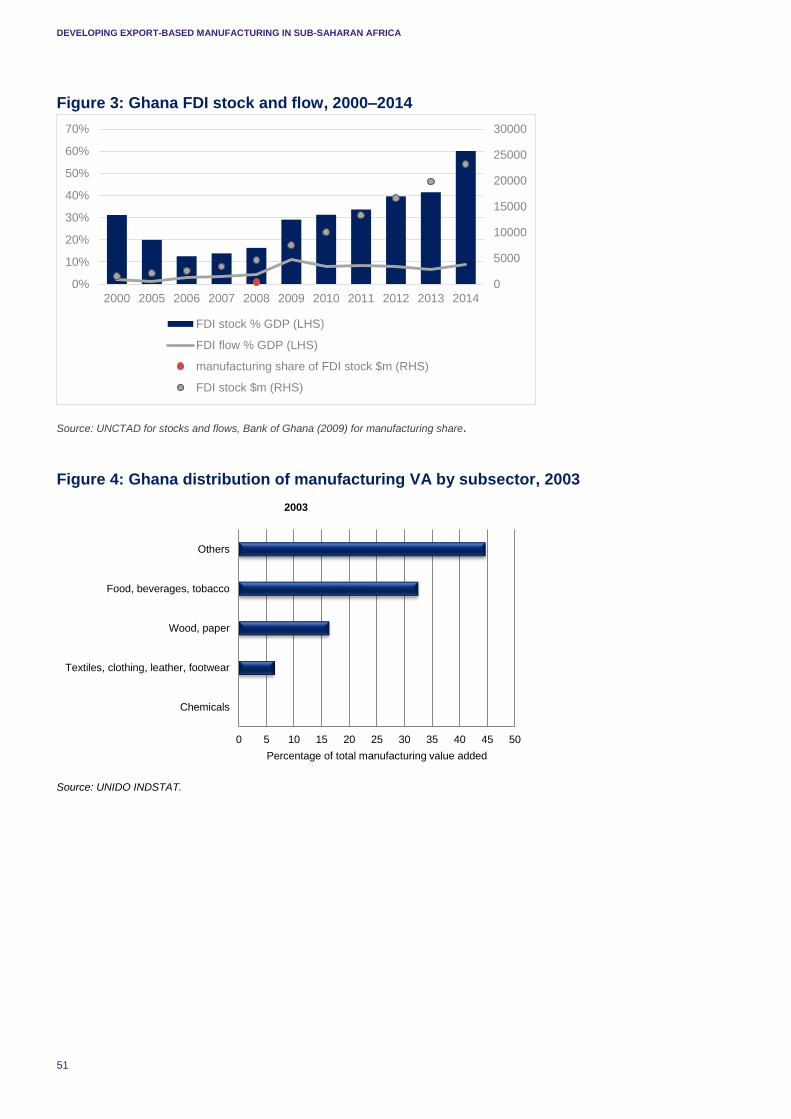
DEVELOPING EXPORT-BASED MANUFACTURING IN SUB-SAHARAN AFRICA
51
Figure 3: Ghana FDI stock and flow, 2000–2014
Source: UNCTAD for stocks and flows, Bank of Ghana (2009) for manufacturing share.
Figure 4: Ghana distribution of manufacturing VA by subsector, 2003
Source: UNIDO INDSTAT.
0
5000
10000
15000
20000
25000
30000
0%
10%
20%
30%
40%
50%
60%
70%
2000 2005 2006 2007 2008 2009 2010 2011 2012 2013 2014
FDI stock % GDP (LHS)
FDI flow % GDP (LHS)
manufacturing share of FDI stock $m (RHS)
FDI stock $m (RHS)
0 5 10 15 20 25 30 35 40 45 50
Chemicals
Textiles, clothing, leather, footwear
Wood, paper
Food, beverages, tobacco
Others
Percentage of total manufacturing value added
2003
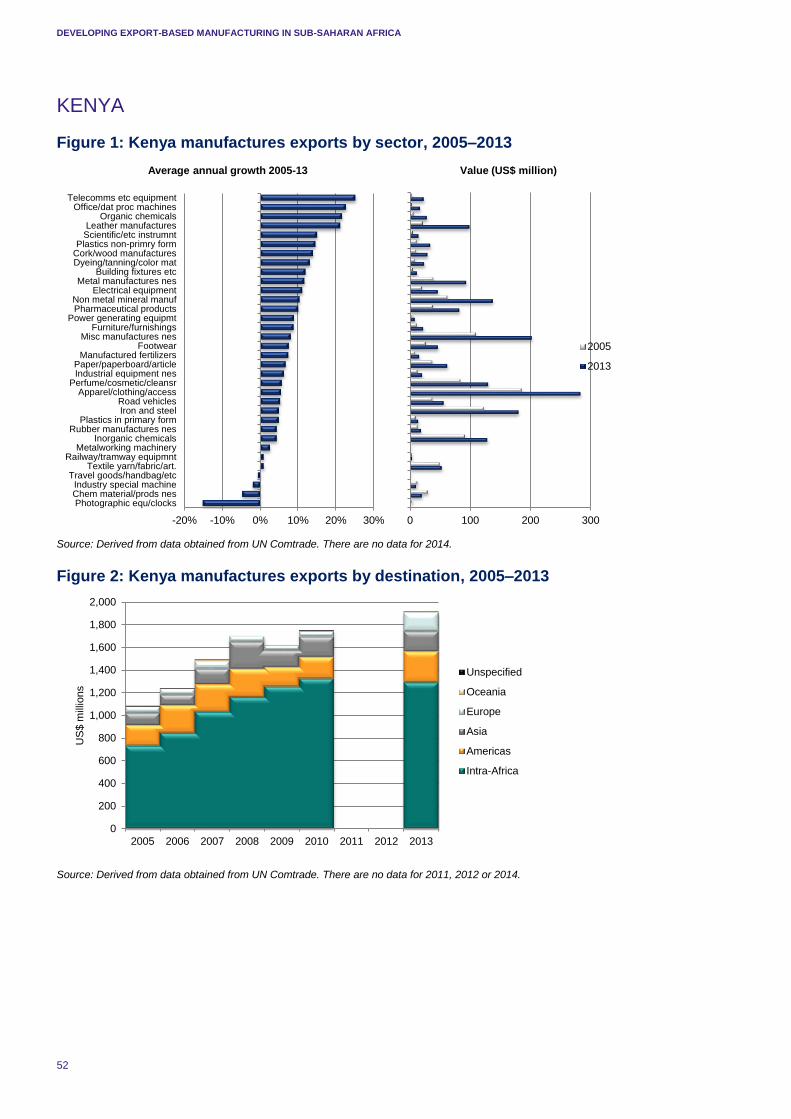
DEVELOPING EXPORT-BASED MANUFACTURING IN SUB-SAHARAN AFRICA
52
KENYA
Figure 1: Kenya manufactures exports by sector, 2005–2013
Source: Derived from data obtained from UN Comtrade. There are no data for 2014.
Figure 2: Kenya manufactures exports by destination, 2005–2013
Source: Derived from data obtained from UN Comtrade. There are no data for 2011, 2012 or 2014.
0
200
400
600
800
1,000
1,200
1,400
1,600
1,800
2,000
2005 2006 2007 2008 2009 2010 2011 2012 2013
US
$ m
illio
ns
Unspecified
Oceania
Europe
Asia
Americas
Intra-Africa
0 100 200 300
Value (US$ million)
2005
2013
-20% -10% 0% 10% 20% 30%
Photographic equ/clocksChem material/prods nesIndustry special machine
Travel goods/handbag/etcTextile yarn/fabric/art.
Railway/tramway equipmntMetalworking machinery
Inorganic chemicalsRubber manufactures nes
Plastics in primary formIron and steelRoad vehicles
Apparel/clothing/accessPerfume/cosmetic/cleansr
Industrial equipment nesPaper/paperboard/article
Manufactured fertilizersFootwear
Misc manufactures nesFurniture/furnishings
Power generating equipmtPharmaceutical productsNon metal mineral manuf
Electrical equipmentMetal manufactures nes
Building fixtures etcDyeing/tanning/color matCork/wood manufacturesPlastics non-primry form
Scientific/etc instrumntLeather manufactures
Organic chemicalsOffice/dat proc machines
Telecomms etc equipment
Average annual growth 2005-13
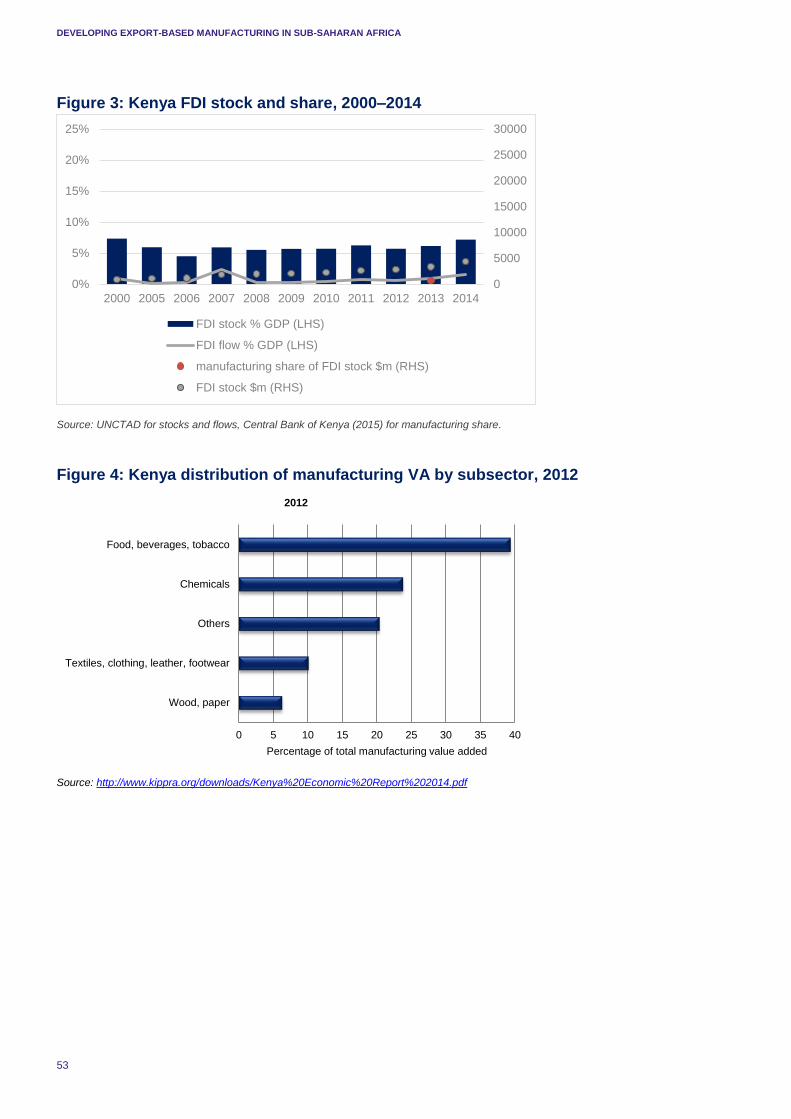
DEVELOPING EXPORT-BASED MANUFACTURING IN SUB-SAHARAN AFRICA
53
Figure 3: Kenya FDI stock and share, 2000–2014
Source: UNCTAD for stocks and flows, Central Bank of Kenya (2015) for manufacturing share.
Figure 4: Kenya distribution of manufacturing VA by subsector, 2012
Source: http://www.kippra.org/downloads/Kenya%20Economic%20Report%202014.pdf
0
5000
10000
15000
20000
25000
30000
0%
5%
10%
15%
20%
25%
2000 2005 2006 2007 2008 2009 2010 2011 2012 2013 2014
FDI stock % GDP (LHS)
FDI flow % GDP (LHS)
manufacturing share of FDI stock $m (RHS)
FDI stock $m (RHS)
0 5 10 15 20 25 30 35 40
Wood, paper
Textiles, clothing, leather, footwear
Others
Chemicals
Food, beverages, tobacco
Percentage of total manufacturing value added
2012
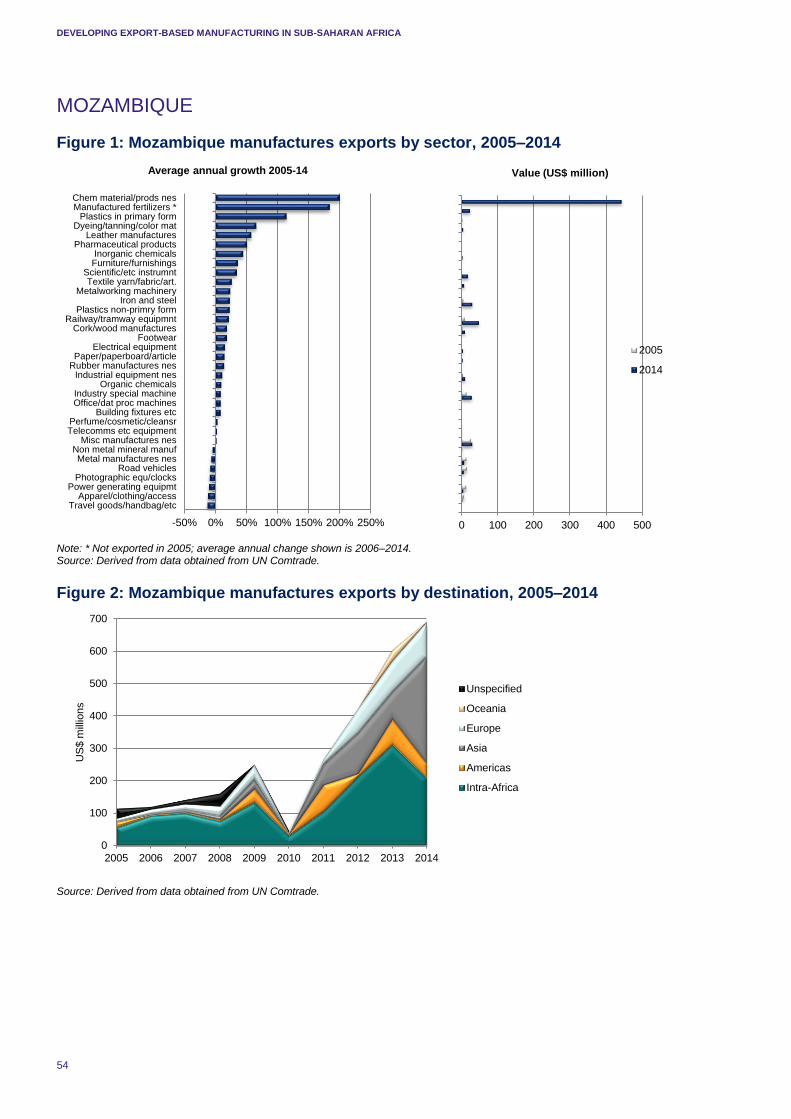
DEVELOPING EXPORT-BASED MANUFACTURING IN SUB-SAHARAN AFRICA
54
MOZAMBIQUE
Figure 1: Mozambique manufactures exports by sector, 2005–2014
Note: * Not exported in 2005; average annual change shown is 2006–2014. Source: Derived from data obtained from UN Comtrade.
Figure 2: Mozambique manufactures exports by destination, 2005–2014
Source: Derived from data obtained from UN Comtrade.
0
100
200
300
400
500
600
700
2005 2006 2007 2008 2009 2010 2011 2012 2013 2014
US
$ m
illio
ns
Unspecified
Oceania
Europe
Asia
Americas
Intra-Africa
0 100 200 300 400 500
Value (US$ million)
2005
2014
-50% 0% 50% 100% 150% 200% 250%
Travel goods/handbag/etcApparel/clothing/access
Power generating equipmtPhotographic equ/clocks
Road vehiclesMetal manufactures nes
Non metal mineral manufMisc manufactures nes
Telecomms etc equipmentPerfume/cosmetic/cleansr
Building fixtures etcOffice/dat proc machinesIndustry special machine
Organic chemicalsIndustrial equipment nes
Rubber manufactures nesPaper/paperboard/article
Electrical equipmentFootwear
Cork/wood manufacturesRailway/tramway equipmnt
Plastics non-primry formIron and steel
Metalworking machineryTextile yarn/fabric/art.
Scientific/etc instrumntFurniture/furnishingsInorganic chemicals
Pharmaceutical productsLeather manufactures
Dyeing/tanning/color matPlastics in primary form
Manufactured fertilizers *Chem material/prods nes
Average annual growth 2005-14
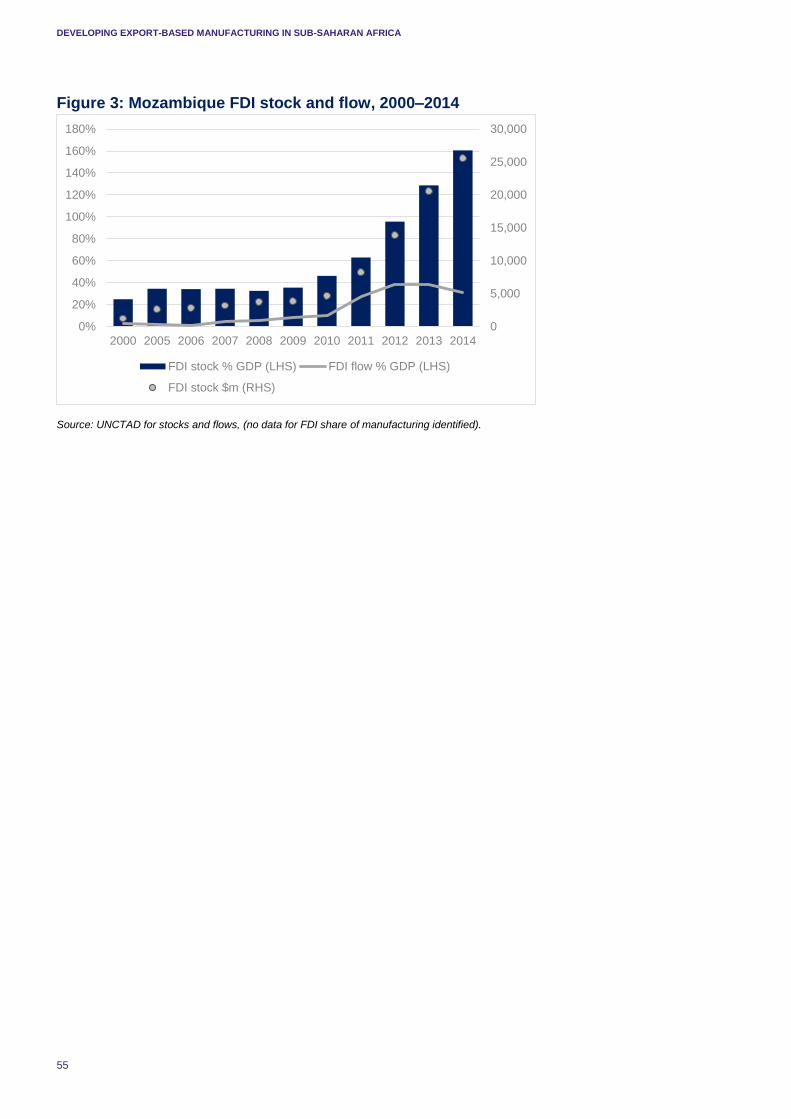
DEVELOPING EXPORT-BASED MANUFACTURING IN SUB-SAHARAN AFRICA
55
Figure 3: Mozambique FDI stock and flow, 2000–2014
Source: UNCTAD for stocks and flows, (no data for FDI share of manufacturing identified).
0
5,000
10,000
15,000
20,000
25,000
30,000
0%
20%
40%
60%
80%
100%
120%
140%
160%
180%
2000 2005 2006 2007 2008 2009 2010 2011 2012 2013 2014
FDI stock % GDP (LHS) FDI flow % GDP (LHS)
FDI stock $m (RHS)
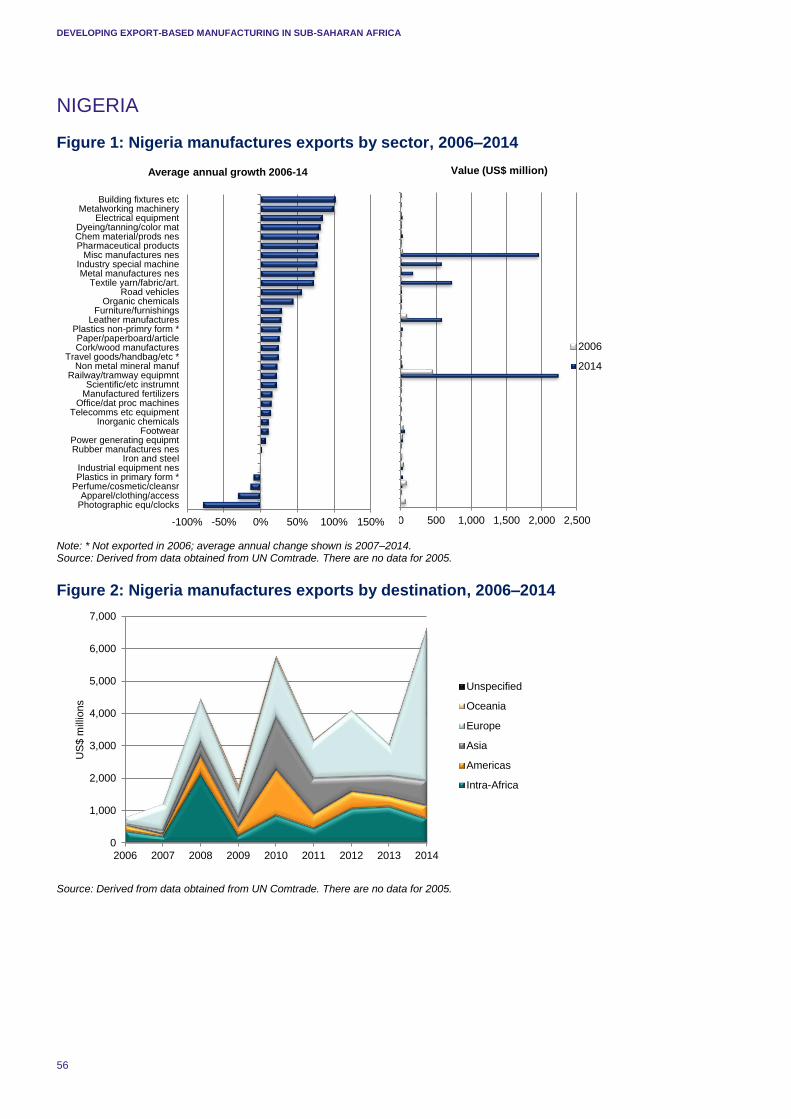
DEVELOPING EXPORT-BASED MANUFACTURING IN SUB-SAHARAN AFRICA
56
NIGERIA
Figure 1: Nigeria manufactures exports by sector, 2006–2014
Note: * Not exported in 2006; average annual change shown is 2007–2014. Source: Derived from data obtained from UN Comtrade. There are no data for 2005.
Figure 2: Nigeria manufactures exports by destination, 2006–2014
Source: Derived from data obtained from UN Comtrade. There are no data for 2005.
0
1,000
2,000
3,000
4,000
5,000
6,000
7,000
2006 2007 2008 2009 2010 2011 2012 2013 2014
US
$ m
illio
ns
Unspecified
Oceania
Europe
Asia
Americas
Intra-Africa
0 500 1,000 1,500 2,000 2,500
Value (US$ million)
2006
2014
-100% -50% 0% 50% 100% 150%
Photographic equ/clocksApparel/clothing/access
Perfume/cosmetic/cleansrPlastics in primary form *Industrial equipment nes
Iron and steelRubber manufactures nesPower generating equipmt
FootwearInorganic chemicals
Telecomms etc equipmentOffice/dat proc machines
Manufactured fertilizersScientific/etc instrumnt
Railway/tramway equipmntNon metal mineral manuf
Travel goods/handbag/etc *Cork/wood manufacturesPaper/paperboard/article
Plastics non-primry form *Leather manufactures
Furniture/furnishingsOrganic chemicals
Road vehiclesTextile yarn/fabric/art.
Metal manufactures nesIndustry special machine
Misc manufactures nesPharmaceutical productsChem material/prods nesDyeing/tanning/color mat
Electrical equipmentMetalworking machinery
Building fixtures etc
Average annual growth 2006-14
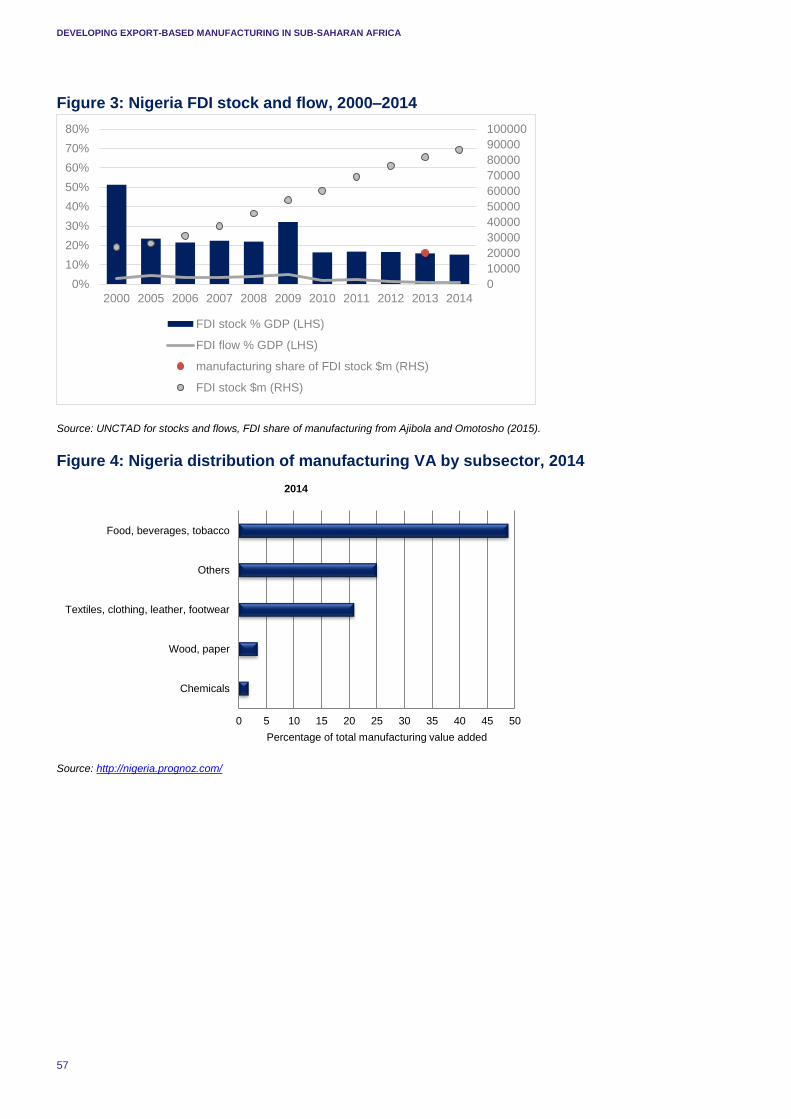
DEVELOPING EXPORT-BASED MANUFACTURING IN SUB-SAHARAN AFRICA
57
Figure 3: Nigeria FDI stock and flow, 2000–2014
Source: UNCTAD for stocks and flows, FDI share of manufacturing from Ajibola and Omotosho (2015).
Figure 4: Nigeria distribution of manufacturing VA by subsector, 2014
Source: http://nigeria.prognoz.com/
0
10000
20000
30000
40000
50000
60000
70000
80000
90000
100000
0%
10%
20%
30%
40%
50%
60%
70%
80%
2000 2005 2006 2007 2008 2009 2010 2011 2012 2013 2014
FDI stock % GDP (LHS)
FDI flow % GDP (LHS)
manufacturing share of FDI stock $m (RHS)
FDI stock $m (RHS)
0 5 10 15 20 25 30 35 40 45 50
Chemicals
Wood, paper
Textiles, clothing, leather, footwear
Others
Food, beverages, tobacco
Percentage of total manufacturing value added
2014
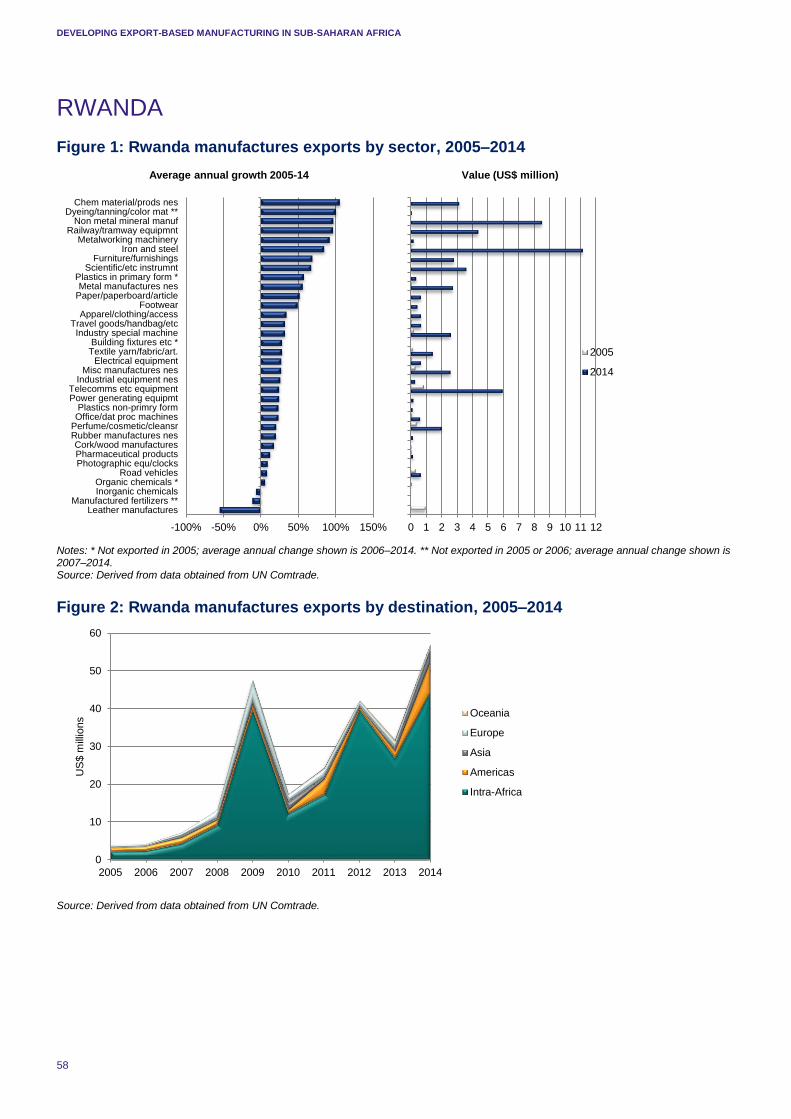
DEVELOPING EXPORT-BASED MANUFACTURING IN SUB-SAHARAN AFRICA
58
RWANDA
Figure 1: Rwanda manufactures exports by sector, 2005–2014
Notes: * Not exported in 2005; average annual change shown is 2006–2014. ** Not exported in 2005 or 2006; average annual change shown is 2007–2014. Source: Derived from data obtained from UN Comtrade.
Figure 2: Rwanda manufactures exports by destination, 2005–2014
Source: Derived from data obtained from UN Comtrade.
0
10
20
30
40
50
60
2005 2006 2007 2008 2009 2010 2011 2012 2013 2014
US
$ m
illio
ns
Oceania
Europe
Asia
Americas
Intra-Africa
0 1 2 3 4 5 6 7 8 9 10 11 12
Value (US$ million)
2005
2014
-100% -50% 0% 50% 100% 150%
Leather manufacturesManufactured fertilizers **
Inorganic chemicalsOrganic chemicals *
Road vehiclesPhotographic equ/clocksPharmaceutical productsCork/wood manufactures
Rubber manufactures nesPerfume/cosmetic/cleansrOffice/dat proc machinesPlastics non-primry form
Power generating equipmtTelecomms etc equipment
Industrial equipment nesMisc manufactures nes
Electrical equipmentTextile yarn/fabric/art.Building fixtures etc *
Industry special machineTravel goods/handbag/etc
Apparel/clothing/accessFootwear
Paper/paperboard/articleMetal manufactures nes
Plastics in primary form *Scientific/etc instrumnt
Furniture/furnishingsIron and steel
Metalworking machineryRailway/tramway equipmnt
Non metal mineral manufDyeing/tanning/color mat **
Chem material/prods nes
Average annual growth 2005-14
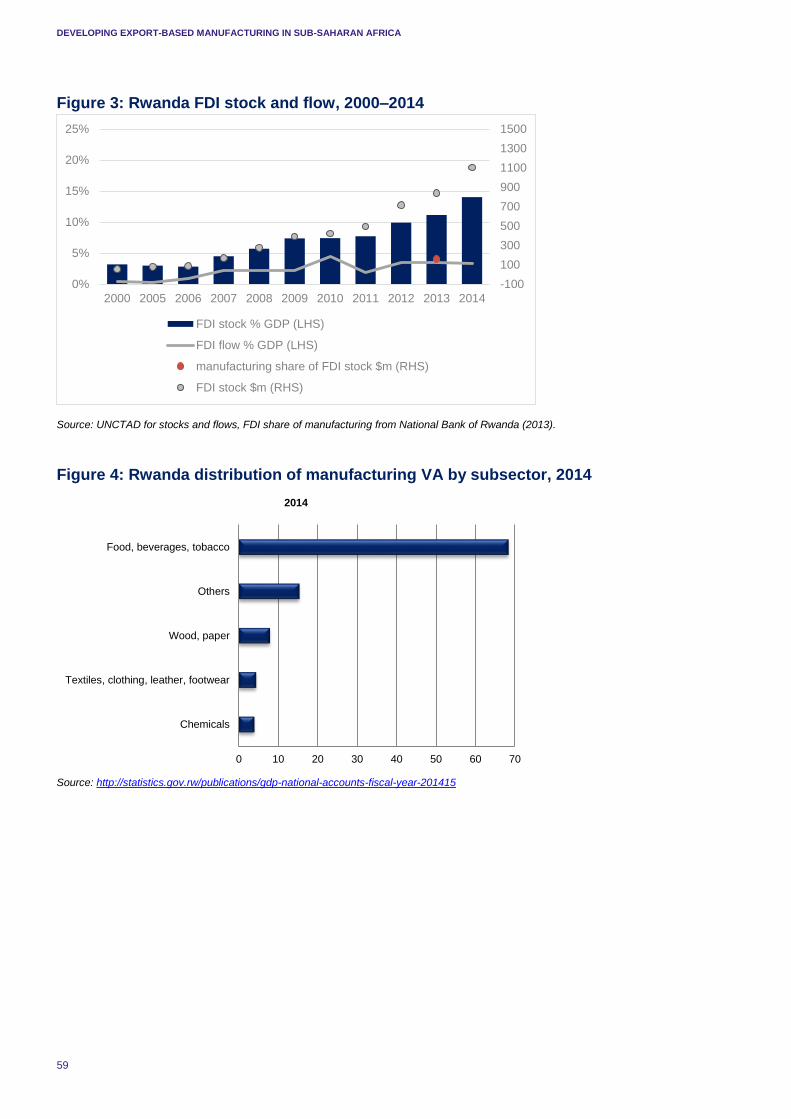
DEVELOPING EXPORT-BASED MANUFACTURING IN SUB-SAHARAN AFRICA
59
Figure 3: Rwanda FDI stock and flow, 2000–2014
Source: UNCTAD for stocks and flows, FDI share of manufacturing from National Bank of Rwanda (2013).
Figure 4: Rwanda distribution of manufacturing VA by subsector, 2014
Source: http://statistics.gov.rw/publications/gdp-national-accounts-fiscal-year-201415
-100
100
300
500
700
900
1100
1300
1500
0%
5%
10%
15%
20%
25%
2000 2005 2006 2007 2008 2009 2010 2011 2012 2013 2014
FDI stock % GDP (LHS)
FDI flow % GDP (LHS)
manufacturing share of FDI stock $m (RHS)
FDI stock $m (RHS)
0 10 20 30 40 50 60 70
Chemicals
Textiles, clothing, leather, footwear
Wood, paper
Others
Food, beverages, tobacco
2014
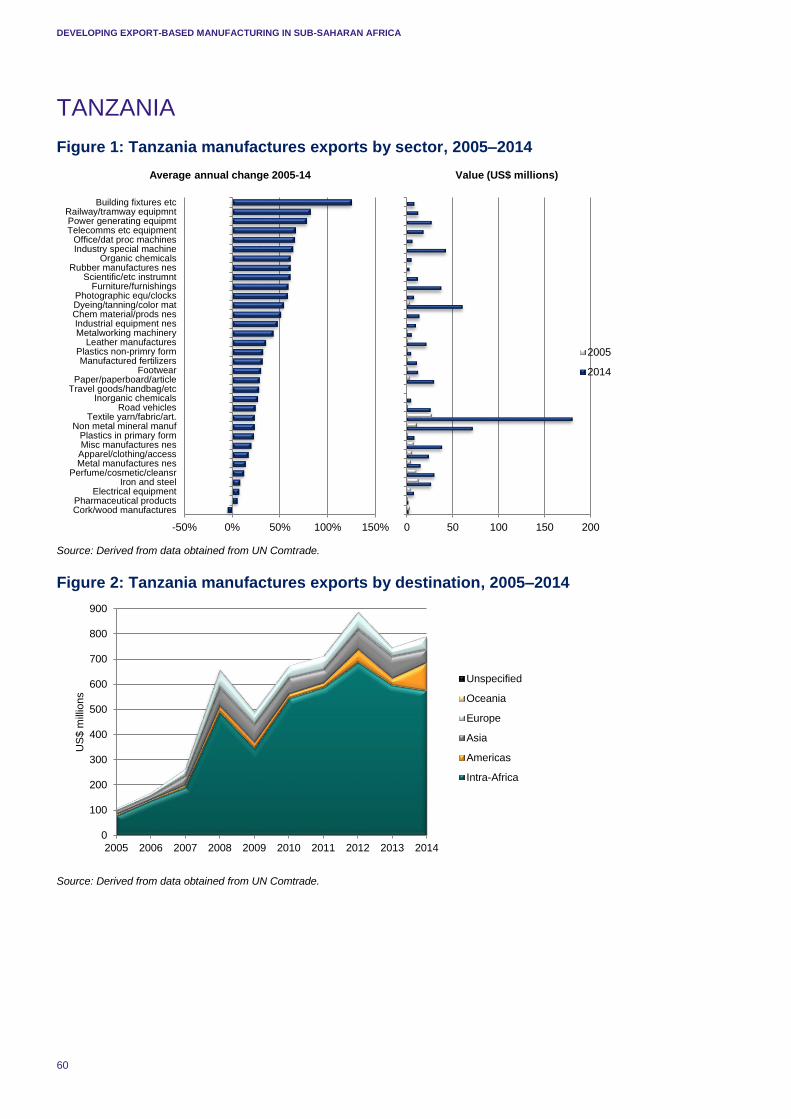
DEVELOPING EXPORT-BASED MANUFACTURING IN SUB-SAHARAN AFRICA
60
TANZANIA
Figure 1: Tanzania manufactures exports by sector, 2005–2014
Source: Derived from data obtained from UN Comtrade.
Figure 2: Tanzania manufactures exports by destination, 2005–2014
Source: Derived from data obtained from UN Comtrade.
0
100
200
300
400
500
600
700
800
900
2005 2006 2007 2008 2009 2010 2011 2012 2013 2014
US
$ m
illio
ns
Unspecified
Oceania
Europe
Asia
Americas
Intra-Africa
0 50 100 150 200
Value (US$ millions)
2005
2014
-50% 0% 50% 100% 150%
Cork/wood manufacturesPharmaceutical products
Electrical equipmentIron and steel
Perfume/cosmetic/cleansrMetal manufactures nesApparel/clothing/accessMisc manufactures nesPlastics in primary form
Non metal mineral manufTextile yarn/fabric/art.
Road vehiclesInorganic chemicals
Travel goods/handbag/etcPaper/paperboard/article
FootwearManufactured fertilizers
Plastics non-primry formLeather manufactures
Metalworking machineryIndustrial equipment nesChem material/prods nesDyeing/tanning/color matPhotographic equ/clocks
Furniture/furnishingsScientific/etc instrumnt
Rubber manufactures nesOrganic chemicals
Industry special machineOffice/dat proc machines
Telecomms etc equipmentPower generating equipmtRailway/tramway equipmnt
Building fixtures etc
Average annual change 2005-14
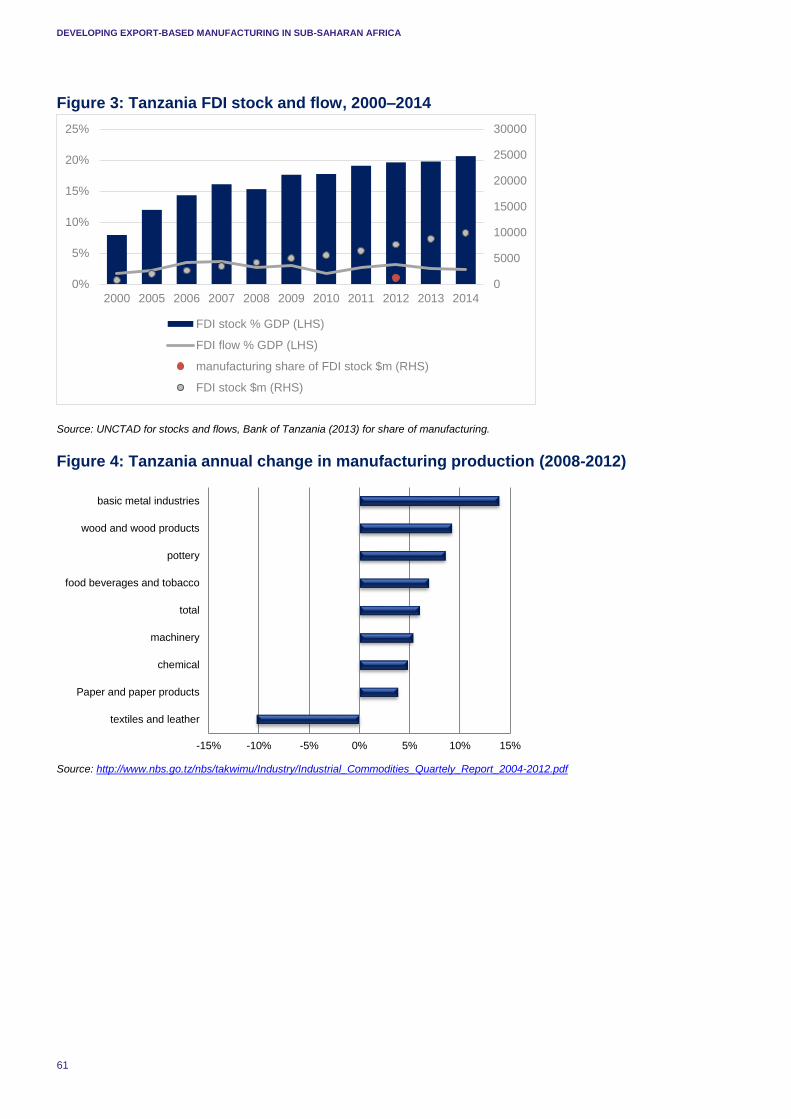
DEVELOPING EXPORT-BASED MANUFACTURING IN SUB-SAHARAN AFRICA
61
Figure 3: Tanzania FDI stock and flow, 2000–2014
Source: UNCTAD for stocks and flows, Bank of Tanzania (2013) for share of manufacturing.
Figure 4: Tanzania annual change in manufacturing production (2008-2012)
Source: http://www.nbs.go.tz/nbs/takwimu/Industry/Industrial_Commodities_Quartely_Report_2004-2012.pdf
0
5000
10000
15000
20000
25000
30000
0%
5%
10%
15%
20%
25%
2000 2005 2006 2007 2008 2009 2010 2011 2012 2013 2014
FDI stock % GDP (LHS)
FDI flow % GDP (LHS)
manufacturing share of FDI stock $m (RHS)
FDI stock $m (RHS)
-15% -10% -5% 0% 5% 10% 15%
textiles and leather
Paper and paper products
chemical
machinery
total
food beverages and tobacco
pottery
wood and wood products
basic metal industries
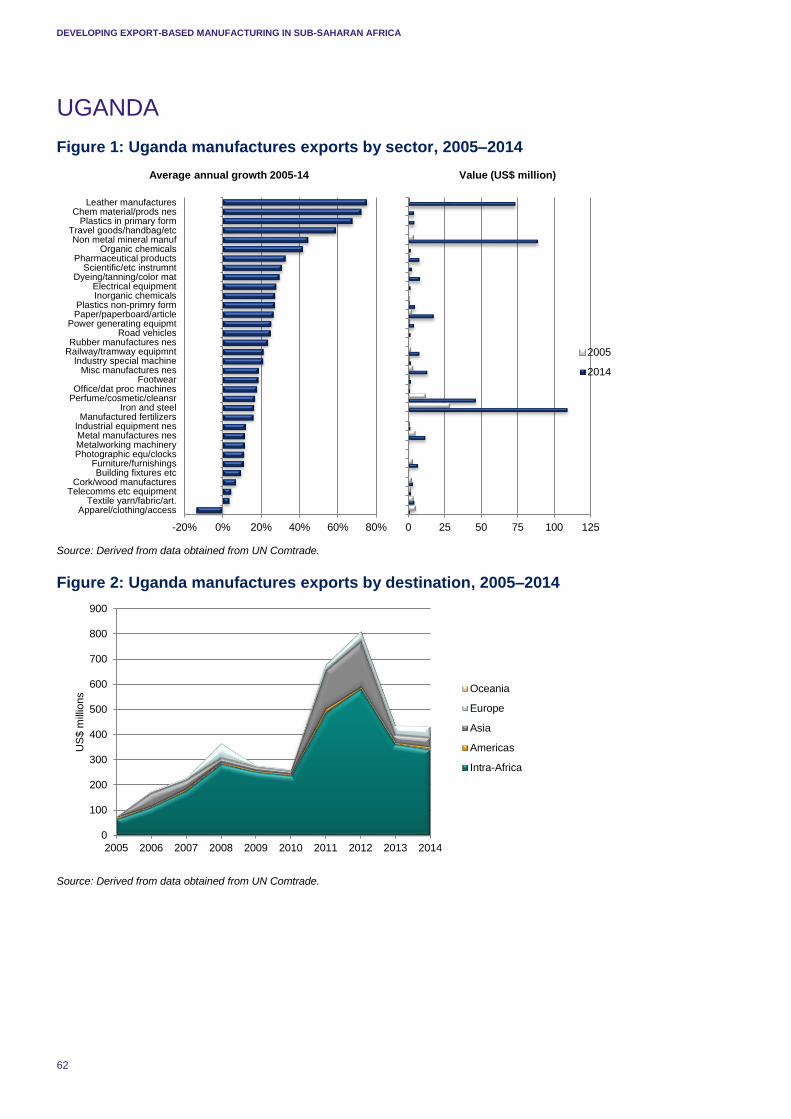
DEVELOPING EXPORT-BASED MANUFACTURING IN SUB-SAHARAN AFRICA
62
UGANDA
Figure 1: Uganda manufactures exports by sector, 2005–2014
Source: Derived from data obtained from UN Comtrade.
Figure 2: Uganda manufactures exports by destination, 2005–2014
Source: Derived from data obtained from UN Comtrade.
0
100
200
300
400
500
600
700
800
900
2005 2006 2007 2008 2009 2010 2011 2012 2013 2014
US
$ m
illio
ns
Oceania
Europe
Asia
Americas
Intra-Africa
0 25 50 75 100 125
Value (US$ million)
2005
2014
-20% 0% 20% 40% 60% 80%
Apparel/clothing/accessTextile yarn/fabric/art.
Telecomms etc equipmentCork/wood manufactures
Building fixtures etcFurniture/furnishings
Photographic equ/clocksMetalworking machineryMetal manufactures nesIndustrial equipment nesManufactured fertilizers
Iron and steelPerfume/cosmetic/cleansrOffice/dat proc machines
FootwearMisc manufactures nes
Industry special machineRailway/tramway equipmntRubber manufactures nes
Road vehiclesPower generating equipmt
Paper/paperboard/articlePlastics non-primry form
Inorganic chemicalsElectrical equipment
Dyeing/tanning/color matScientific/etc instrumnt
Pharmaceutical productsOrganic chemicals
Non metal mineral manufTravel goods/handbag/etc
Plastics in primary formChem material/prods nes
Leather manufactures
Average annual growth 2005-14
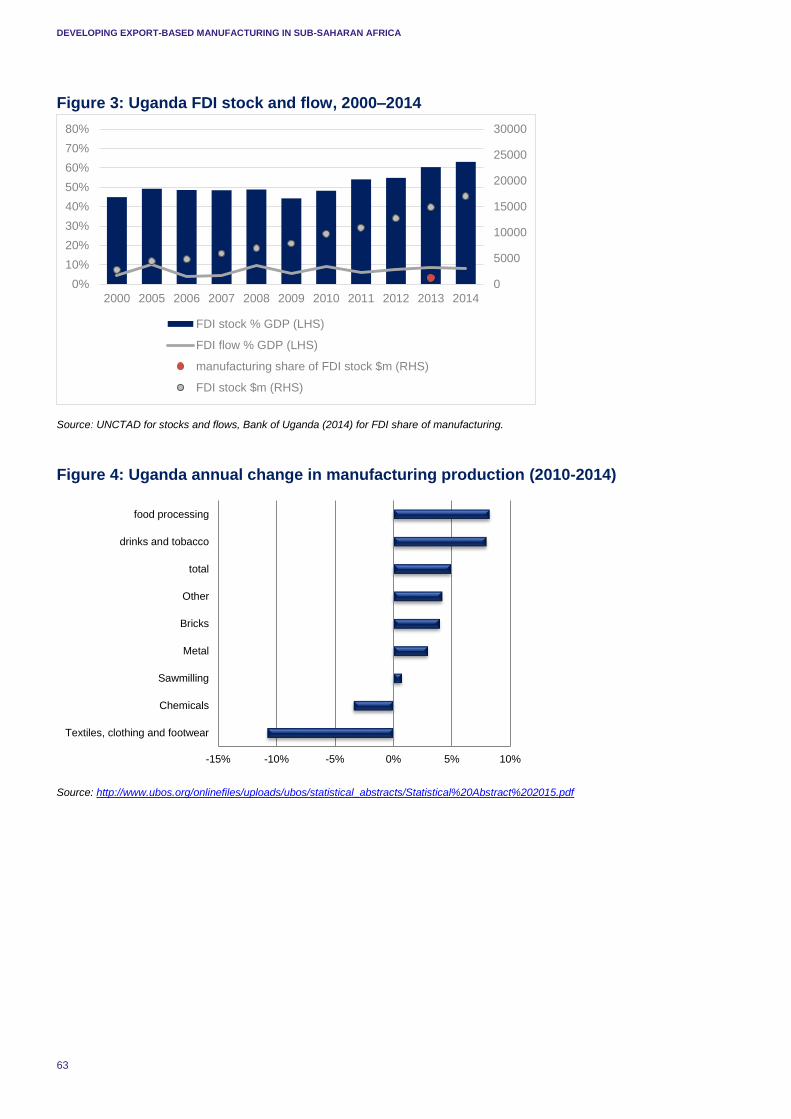
DEVELOPING EXPORT-BASED MANUFACTURING IN SUB-SAHARAN AFRICA
63
Figure 3: Uganda FDI stock and flow, 2000–2014
Source: UNCTAD for stocks and flows, Bank of Uganda (2014) for FDI share of manufacturing.
Figure 4: Uganda annual change in manufacturing production (2010-2014)
Source: http://www.ubos.org/onlinefiles/uploads/ubos/statistical_abstracts/Statistical%20Abstract%202015.pdf
0
5000
10000
15000
20000
25000
30000
0%
10%
20%
30%
40%
50%
60%
70%
80%
2000 2005 2006 2007 2008 2009 2010 2011 2012 2013 2014
FDI stock % GDP (LHS)
FDI flow % GDP (LHS)
manufacturing share of FDI stock $m (RHS)
FDI stock $m (RHS)
-15% -10% -5% 0% 5% 10%
Textiles, clothing and footwear
Chemicals
Sawmilling
Metal
Bricks
Other
total
drinks and tobacco
food processing
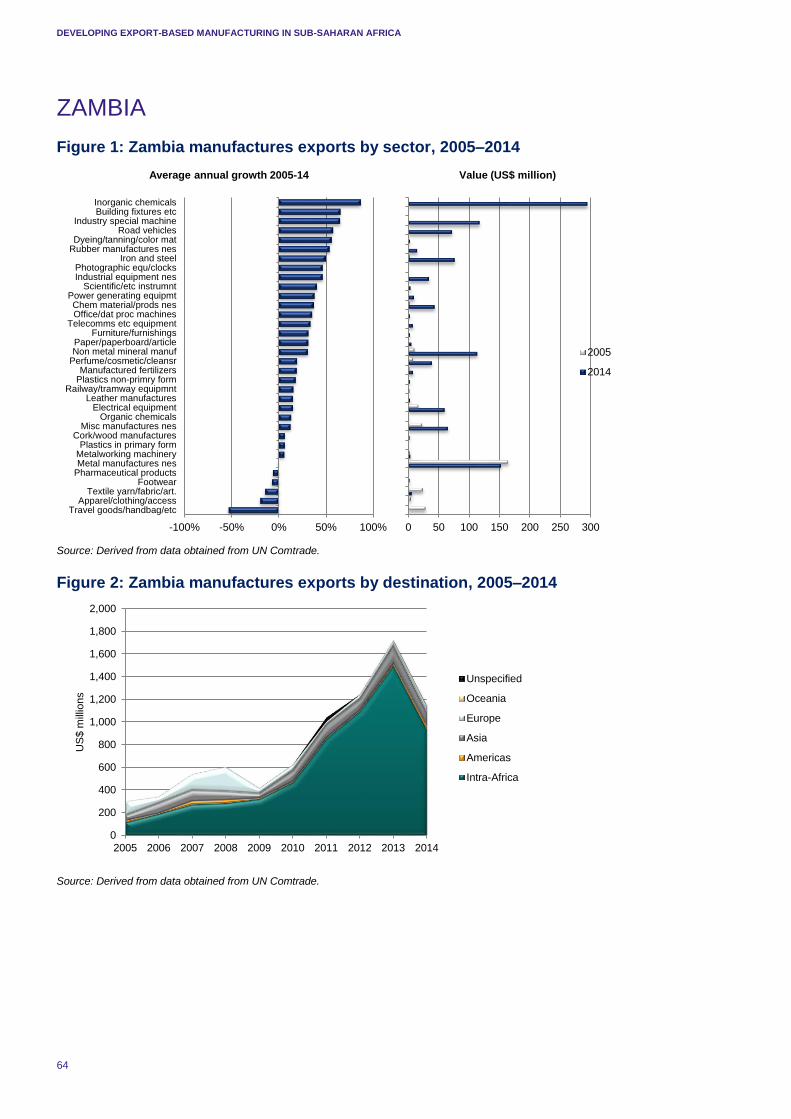
DEVELOPING EXPORT-BASED MANUFACTURING IN SUB-SAHARAN AFRICA
64
ZAMBIA
Figure 1: Zambia manufactures exports by sector, 2005–2014
Source: Derived from data obtained from UN Comtrade.
Figure 2: Zambia manufactures exports by destination, 2005–2014
Source: Derived from data obtained from UN Comtrade.
0
200
400
600
800
1,000
1,200
1,400
1,600
1,800
2,000
2005 2006 2007 2008 2009 2010 2011 2012 2013 2014
US
$ m
illio
ns
Unspecified
Oceania
Europe
Asia
Americas
Intra-Africa
0 50 100 150 200 250 300
Value (US$ million)
2005
2014
-100% -50% 0% 50% 100%
Travel goods/handbag/etcApparel/clothing/access
Textile yarn/fabric/art.Footwear
Pharmaceutical productsMetal manufactures nesMetalworking machineryPlastics in primary form
Cork/wood manufacturesMisc manufactures nes
Organic chemicalsElectrical equipment
Leather manufacturesRailway/tramway equipmnt
Plastics non-primry formManufactured fertilizers
Perfume/cosmetic/cleansrNon metal mineral manufPaper/paperboard/article
Furniture/furnishingsTelecomms etc equipment
Office/dat proc machinesChem material/prods nes
Power generating equipmtScientific/etc instrumnt
Industrial equipment nesPhotographic equ/clocks
Iron and steelRubber manufactures nesDyeing/tanning/color mat
Road vehiclesIndustry special machine
Building fixtures etcInorganic chemicals
Average annual growth 2005-14
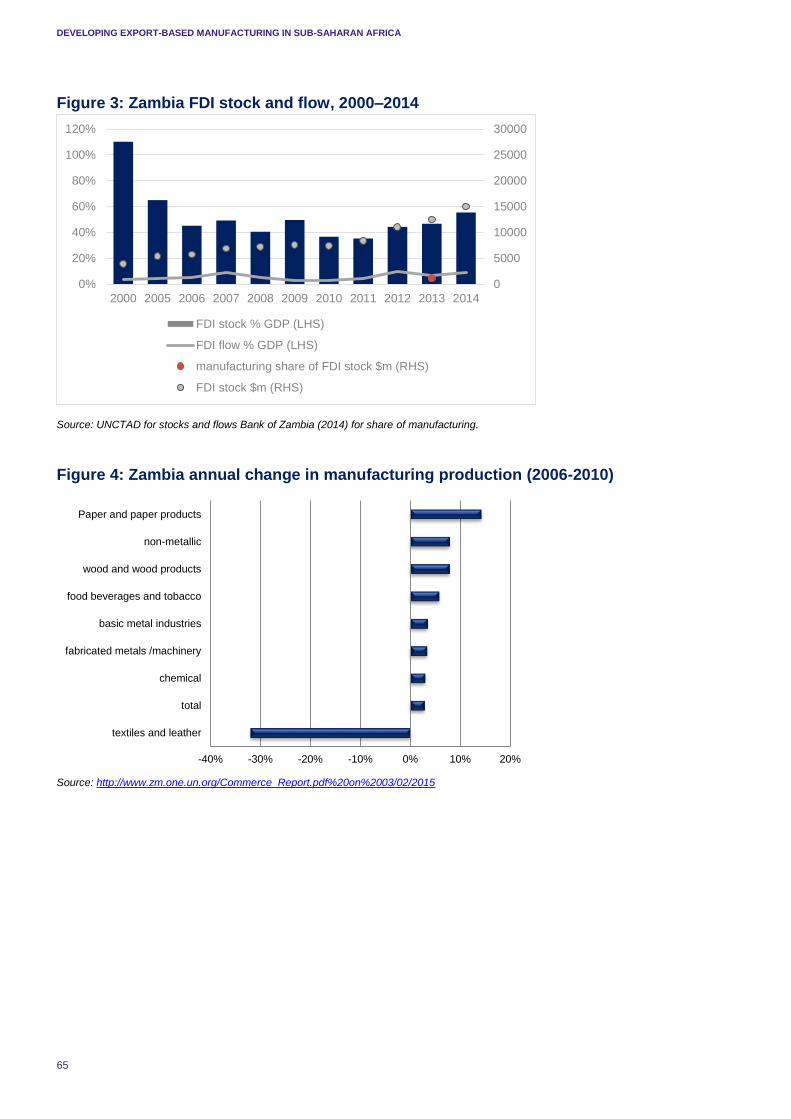
DEVELOPING EXPORT-BASED MANUFACTURING IN SUB-SAHARAN AFRICA
65
Figure 3: Zambia FDI stock and flow, 2000–2014
Source: UNCTAD for stocks and flows Bank of Zambia (2014) for share of manufacturing.
Figure 4: Zambia annual change in manufacturing production (2006-2010)
Source: http://www.zm.one.un.org/Commerce_Report.pdf%20on%2003/02/2015
0
5000
10000
15000
20000
25000
30000
0%
20%
40%
60%
80%
100%
120%
2000 2005 2006 2007 2008 2009 2010 2011 2012 2013 2014
FDI stock % GDP (LHS)
FDI flow % GDP (LHS)
manufacturing share of FDI stock $m (RHS)
FDI stock $m (RHS)
-40% -30% -20% -10% 0% 10% 20%
textiles and leather
total
chemical
fabricated metals /machinery
basic metal industries
food beverages and tobacco
wood and wood products
non-metallic
Paper and paper products
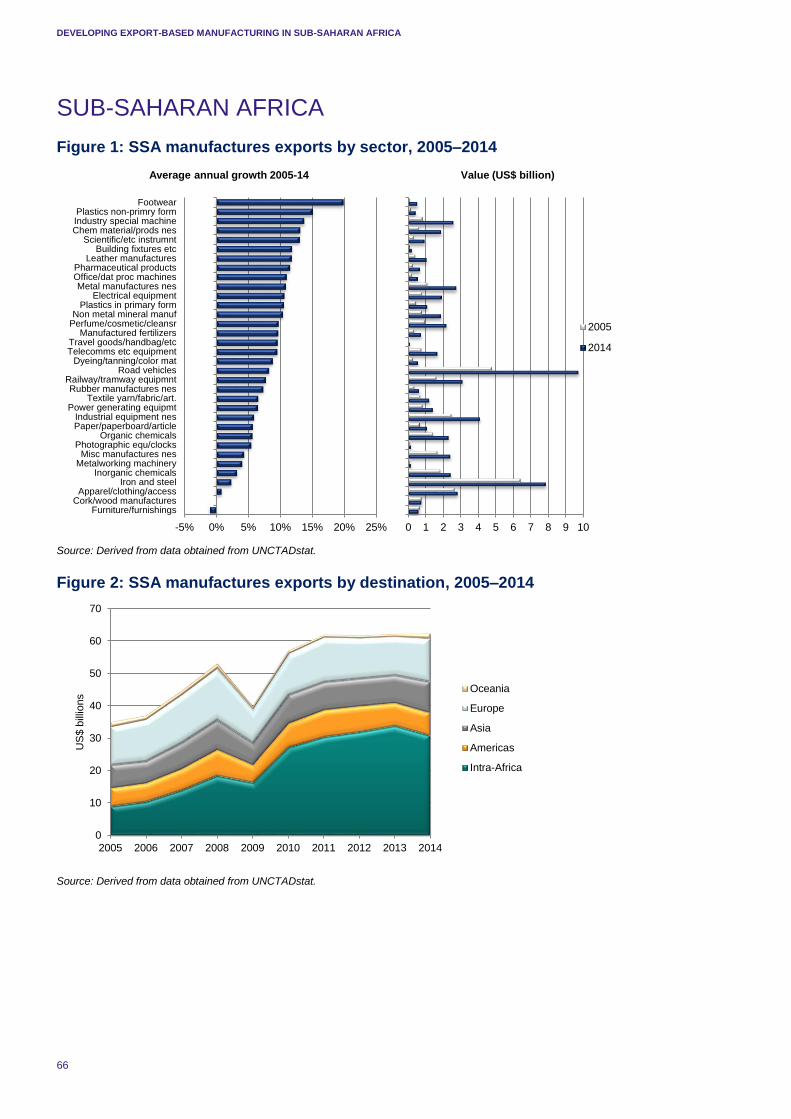
DEVELOPING EXPORT-BASED MANUFACTURING IN SUB-SAHARAN AFRICA
66
SUB-SAHARAN AFRICA
Figure 1: SSA manufactures exports by sector, 2005–2014
Source: Derived from data obtained from UNCTADstat.
Figure 2: SSA manufactures exports by destination, 2005–2014
Source: Derived from data obtained from UNCTADstat.
0
10
20
30
40
50
60
70
2005 2006 2007 2008 2009 2010 2011 2012 2013 2014
US
$ b
illio
ns
Oceania
Europe
Asia
Americas
Intra-Africa
0 1 2 3 4 5 6 7 8 9 10
Value (US$ billion)
2005
2014
-5% 0% 5% 10% 15% 20% 25%
Furniture/furnishingsCork/wood manufactures
Apparel/clothing/accessIron and steel
Inorganic chemicalsMetalworking machineryMisc manufactures nes
Photographic equ/clocksOrganic chemicals
Paper/paperboard/articleIndustrial equipment nes
Power generating equipmtTextile yarn/fabric/art.
Rubber manufactures nesRailway/tramway equipmnt
Road vehiclesDyeing/tanning/color mat
Telecomms etc equipmentTravel goods/handbag/etc
Manufactured fertilizersPerfume/cosmetic/cleansrNon metal mineral manuf
Plastics in primary formElectrical equipment
Metal manufactures nesOffice/dat proc machinesPharmaceutical products
Leather manufacturesBuilding fixtures etc
Scientific/etc instrumntChem material/prods nesIndustry special machinePlastics non-primry form
Footwear
Average annual growth 2005-14