Embed Size (px)
Citation preview
DIPARTIMENTO DI ECONOMIA _____________________________________________________________________________
Trade-imbalances networks and exchange
rate adjustments:
The paradox of a new Plaza
Andrea Fracasso
Stefano Schiavo
_________________________________________________________
Discussion Paper No. 24, 2008
The Discussion Paper series provides a means for circulating preliminary research results by staff of or
visitors to the Department. Its purpose is to stimulate discussion prior to the publication of papers.
Requests for copies of Discussion Papers and address changes should be sent to:
Dott. Luciano Andreozzi
E.mail [email protected]
Dipartimento di Economia
Università degli Studi di Trento
Via Inama 5
38100 TRENTO ITALIA
Trade-imbalances networks and exchange rate adjustments:
the paradox of a new Plaza
Andrea Fracasso∗† and Stefano Schiavo‡§
December 2008
Abstract
Global imbalances are not new as much as the effort to address them. In the
mid 1980s the phenomenon led the most industrialised countries to orchestrate a
devaluation of the US dollar so as to reduce the US trade deficit. Some economists
have called for a similar ”New Plaza” agreement to tackle the present situation. The
feasibility of such a plan has not been thoroughly assessed so far. In this paper we apply
complex network analysis to characterise the properties of the web of international
bilateral trade imbalances. We study its evolution over time and the position of
key players within it. We find that the complexity of the network has increased in
several dimensions, and this casts doubts on the usefulness of a coordinated solution
among industrialised countries only. In addition, we propose new effective exchange
rate measures based on bilateral trade imbalances, and study their dynamics in the
1980s and in the 2000s. By distinguishing exchange rate movements against debtor
and creditor countries we show that, so far, they have not been consistent with the
simultaneous reduction in all trade bilateral imbalances. A paradox therefore emerges:
the growing difficulty to orchestrate a plan involving a large number of partners is
matched by the inability of so far uncoordinated exchange rate adjustments to close
global imbalances.
JEL Codes: F31, F33, F42
Keywords: Plaza agreement, exchange rates, global imbalances, network analysis
†[email protected], Department of Economics and School of International Studies, Universita di
Trento, Via Inama 5, 38100 Trento, Italy. Corresponding author.§[email protected], Department of Economics and School of International Studies, Universita
di Trento, Via Inama 5, 38100 Trento, Italy, & OFCE, France
1 Introduction
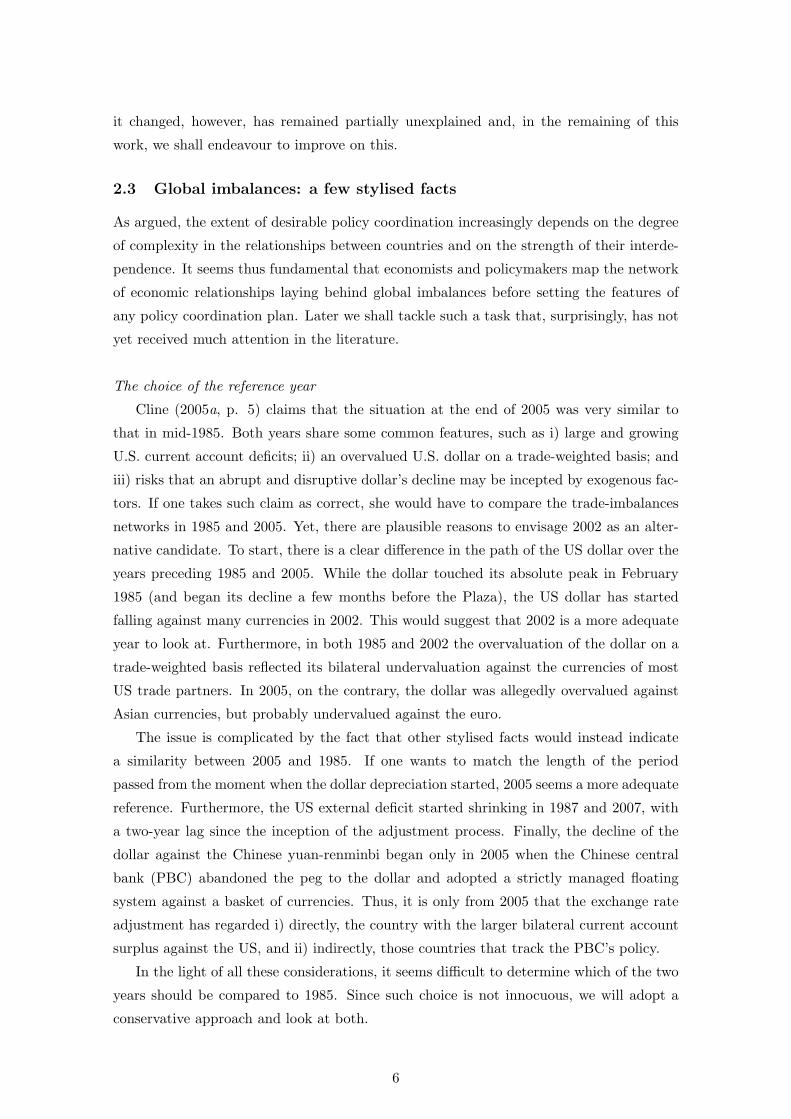
The Unites States has been running large trade and current account deficits since almost
two and a half decades. Their size has grown remarkably (both in absolute and in relative
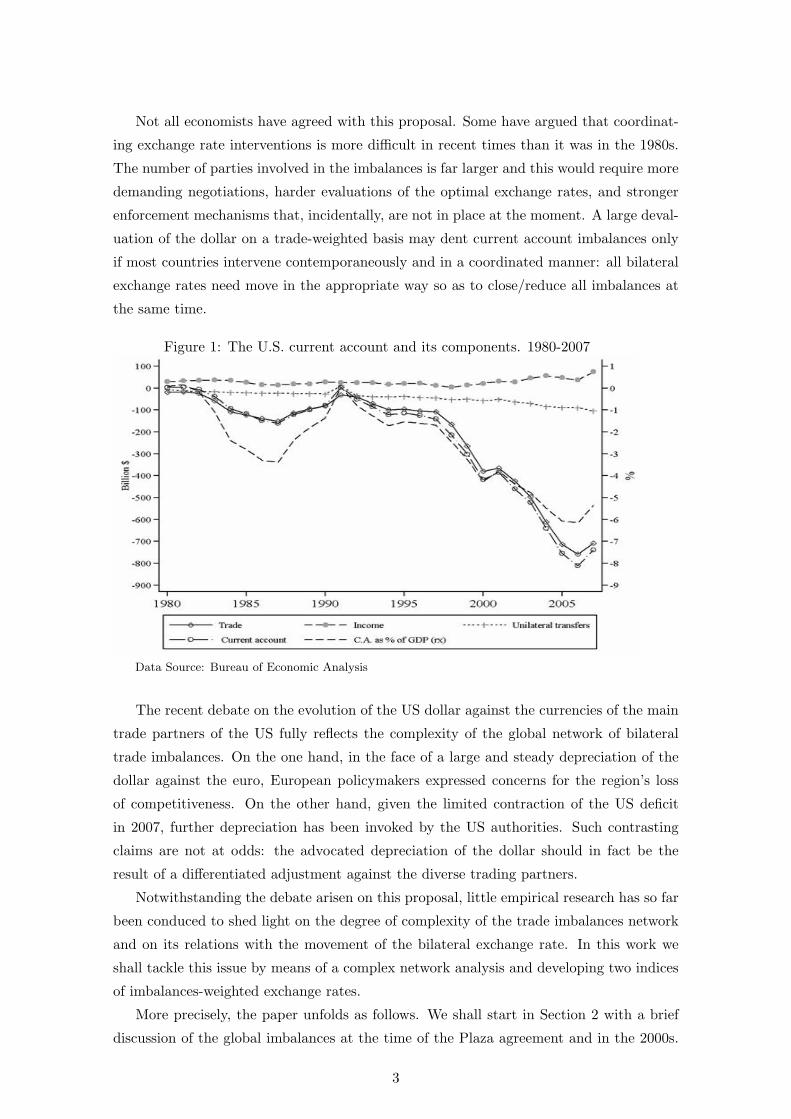
terms) since the early 2000s and peaked in 2006 at $ 811 billion, i.e. 6.15% of the US
GDP (see Figure 1).1 The debate regarding the causes of the evolution of the US current
account balance has been long and lively. Ultimately, a consensus has emerged on a few
key factors:2
• the overvaluation of the US dollar, in particular vis a vis the currencies of a number
of emerging market economies managing their bilateral exchange rates and accumu-
lating large foreign reserves;
• the expansionary economic policy measures undertook in the US after the year 2001;
• the reduction of global investments, which contributed to keep the world real interest
rates low;
• the financial underdevelopment of many emerging economies, which favoured the
flowing of capital from these countries towards the US;
• the extraordinary increase in the price of the commodities concentrated in few emerg-
ing markets.
Such an interpretation of the global imbalances is not much contested anymore, in par-
ticular after the emergence of the financial crisis in mid-2007. Nonetheless, disagreement
remains as to what measures policymakers should undertake both to support the much
needed process of adjustment and to prevent the latter from occurring in a disorderly
manner (see Rogoff, 2006; Obstfeld and Rogoff, 2007).
A number of economists, among whom Cline (2005a; 2005b) and Bergsten (2008),
have argued in favour of a new international exchange rate agreement among the major
countries, aiming to achieve the realignment of exchange rates at the worldwide level.3
Such advocated plan has been dubbed as “new Plaza” after the famous agreement reached
in 1985 by the representatives of the countries of the G-5. The global nature of the
imbalances, is argued, calls for international policy coordination.1The largest part of the annual deficits is due to trade imbalances, while unilateral transfers and income
payments tend to offset each other.2See Fracasso (2007) for a more detailed discussion.3Roughly speaking, two schools of thought have emerged. The first one maintains that exchange rate
misalignments are at the heart of the imbalances and ought be at the centre of a highly managed adjustment
process. The second one argues that global imbalances are mainly the result of different models of growth
(i.e. debt-financed consumption growth in the U.S., export and investment-driven growth in China and
in oil exporting countries), combined with some misalignment in the exchange rates. According to the
latter school, whose position has been endorsed also by the IMF, the adjustment need encompass fiscal,
monetary and exchange rate measures.
2
Not all economists have agreed with this proposal. Some have argued that coordinat-
ing exchange rate interventions is more difficult in recent times than it was in the 1980s.
The number of parties involved in the imbalances is far larger and this would require more
demanding negotiations, harder evaluations of the optimal exchange rates, and stronger
enforcement mechanisms that, incidentally, are not in place at the moment. A large deval-
uation of the dollar on a trade-weighted basis may dent current account imbalances only
if most countries intervene contemporaneously and in a coordinated manner: all bilateral
exchange rates need move in the appropriate way so as to close/reduce all imbalances at
the same time.
Figure 1: The U.S. current account and its components. 1980-2007
Data Source: Bureau of Economic Analysis
The recent debate on the evolution of the US dollar against the currencies of the main
trade partners of the US fully reflects the complexity of the global network of bilateral
trade imbalances. On the one hand, in the face of a large and steady depreciation of the
dollar against the euro, European policymakers expressed concerns for the region’s loss
of competitiveness. On the other hand, given the limited contraction of the US deficit
in 2007, further depreciation has been invoked by the US authorities. Such contrasting
claims are not at odds: the advocated depreciation of the dollar should in fact be the
result of a differentiated adjustment against the diverse trading partners.
Notwithstanding the debate arisen on this proposal, little empirical research has so far
been conduced to shed light on the degree of complexity of the trade imbalances network
and on its relations with the movement of the bilateral exchange rate. In this work we
shall tackle this issue by means of a complex network analysis and developing two indices
of imbalances-weighted exchange rates.
More precisely, the paper unfolds as follows. We shall start in Section 2 with a brief
discussion of the global imbalances at the time of the Plaza agreement and in the 2000s.
3
Section 3 will discuss how the network of trade imbalances has changed over time, both in
the number of its members and in their relationships. This will help in the appraisal of its
much discussed, yet little measured degree of complexity. In Section 4 we shall address the
evolution of the exchange rates in the periods 1985-1987 and 2002-2006. We shall develop
and examine two new trade-imbalances-weighted exchange rate indices. We shall then
compare them with the (more traditional) trade-weighted effective exchange rates of the
Bank of International Settlements (BIS). This tentative exercise, to our knowledge new,
will provide a summary metric of the movements of the bilateral exchange rates, which is
helpful in assessing their consistency with the goal of closing/reducing all bilateral trade
imbalances.
Our main conclusion, discussed in Section 5, is that, given the large differences in the
global economic environments in the two decades, the parallelism of the current situation
with the arrangements in the 1980s is somehow misleading. In the light of the fact that
the recent, uncoordinated exchange rate movements did not tackle trade imbalances in a
mutually consistent way, and given the high complexity of the current trade imbalances
network, we argue that a paradox emerges. On the one hand, coordination plans become
more complicated due to the growing number of potential partners. On the other hand, the
more important the goal of closing/reducing trade imbalances in a smooth and mutually
acceptable fashion becomes, the more essential coordination tends to be.
2 Global imbalances: from the mid 1980s to the early 2000s
2.1 The Plaza and the Louvre agreements
In early 80s, the US started running constantly growing current account and trade deficits.
These were in part due to the overvaluation of the dollar which, at the end of the summer
of 1985, had only partly declined from the peak reached in the February of the same year.
On September 22, the Finance Ministers of the five largest industrial countries (i.e. of
the G-5 forum) secretly met at the Plaza Hotel in New York to work out a package to
produce a gradual and steady adjustment of the dollar against the currencies of the US
major trade partners. Besides the immediate announcement effect (i.e. a 4.3% decline in
the dollar), the dollar constantly depreciated against the Japanese yen, the German mark,
the UK pound sterling and the French franc in the following months. By early 1987 the
depreciation of the dollar was sufficiently ample and G-5 officials decided to back out the
agreement. In February, the G-5 Finance Ministers met in Paris and agreed on designing
adjustments in their economic policies and interventions in the exchange rate markets so
as to stop the decline of the dollar. This plan took the name of Louvre Accord.
Because of the usual transmission lags between exchange rate and current account
variations, the US current account did not immediately shrink. In fact, it reached its peak
(i.e. 3.4% of the GDP) in very same 1987. As early as 1988, however, the deficit began to
4
narrow along a gradual but steady path that led the US to close its deficit in 1991.4
2.2 Global imbalances in the 2000s: the case for a new Plaza?
Already in 1992, the US started again to run large and growing trade and current account
deficits. Since the early 2000s, a large share of these deficits was the counterpart of the
surpluses run by Asian countries and those exporting primary commodities, energy and
food. Although the dollar declined against a number of currencies since 2002, the US
trade and current account at the end of 2005 were still badly unbalanced. For this reason,
the proposal of a new Plaza agreement re-emerged in 2005: such plan should consist in
coordinated exchange rate interventions aimed to achieve the exchange rate realignments
necessary for the adjustment of the international imbalances. One can find two main
rationales for the proposal: the dollar was considerably overvalued on a trade-weighted
basis, and the pattern of its “uncoordinated” devaluation against the foreign currencies
was inappropriate. Cline and other economists argued that markets should not be left
alone in setting the adjustment process because only coordination efforts may reduce the
spillovers on third parties of the bilateral exchange rate adjustments (Cline, 2005b, for
instance, focuses on the 26 most important US trading parties).
Even letting aside the political issues that may prevent such a large and variegated
number of countries from converging on a clear and uniquely identified exchange rates
realignment plan, two major objections to the new Plaza proposal have been raised (Cohen,
2008). The first one stresses that the number of countries involved in the building up and
in the maintenance of the global imbalances is much larger than that observed in 1985. The
plan would require the daunting identification of a matrix of optimal bilateral exchange
rates able to a) redress global imbalances (and in particular the US external deficits), and
b) produce fluctuations of the bilateral exchange rates smaller than the variations to the
overall trade-weighted rates. The second objection refers to the fact that while exchange
rates do influence current account and trade balances, they are not their unique or even
main determinants (McKinnon and Schnabl, 2006). Domestic macroeconomic policies are
as important as exchange rates, but much more difficult to coordinate, also because of the
increasing importance of a number of big emerging markets.5
Both the objections above revolve around the following observation: the world eco-
nomic environment has deeply changed since the 80s, thanks to the rapid growth of several
emerging markets and to the accelerated process of economic integration in Europe. How4One should notice that the trade balance has in fact never turned positive. The small current account
surplus in 1991 was mainly due to exceptionally large and positive unilateral transfers.5A tangible example is the Multilateral Consultation established in 2006 by the IMF in order to provide
a forum for the U.S., European Union, China, Saudi Arabia and Japan to discuss the problem of the
global imbalances and to agree upon policy actions to tackle the vulnerabilities concerning each individual
member. The Consultation has shown how reluctant to coordinate policy interventions sovereign countries
tend to be.
5
it changed, however, has remained partially unexplained and, in the remaining of this
work, we shall endeavour to improve on this.
2.3 Global imbalances: a few stylised facts
As argued, the extent of desirable policy coordination increasingly depends on the degree
of complexity in the relationships between countries and on the strength of their interde-
pendence. It seems thus fundamental that economists and policymakers map the network
of economic relationships laying behind global imbalances before setting the features of
any policy coordination plan. Later we shall tackle such a task that, surprisingly, has not
yet received much attention in the literature.
The choice of the reference year
Cline (2005a, p. 5) claims that the situation at the end of 2005 was very similar to
that in mid-1985. Both years share some common features, such as i) large and growing
U.S. current account deficits; ii) an overvalued U.S. dollar on a trade-weighted basis; and
iii) risks that an abrupt and disruptive dollar’s decline may be incepted by exogenous fac-
tors. If one takes such claim as correct, she would have to compare the trade-imbalances
networks in 1985 and 2005. Yet, there are plausible reasons to envisage 2002 as an alter-
native candidate. To start, there is a clear difference in the path of the US dollar over the
years preceding 1985 and 2005. While the dollar touched its absolute peak in February
1985 (and began its decline a few months before the Plaza), the US dollar has started
falling against many currencies in 2002. This would suggest that 2002 is a more adequate
year to look at. Furthermore, in both 1985 and 2002 the overvaluation of the dollar on a
trade-weighted basis reflected its bilateral undervaluation against the currencies of most
US trade partners. In 2005, on the contrary, the dollar was allegedly overvalued against
Asian currencies, but probably undervalued against the euro.
The issue is complicated by the fact that other stylised facts would instead indicate
a similarity between 2005 and 1985. If one wants to match the length of the period
passed from the moment when the dollar depreciation started, 2005 seems a more adequate
reference. Furthermore, the US external deficit started shrinking in 1987 and 2007, with
a two-year lag since the inception of the adjustment process. Finally, the decline of the
dollar against the Chinese yuan-renminbi began only in 2005 when the Chinese central
bank (PBC) abandoned the peg to the dollar and adopted a strictly managed floating
system against a basket of currencies. Thus, it is only from 2005 that the exchange rate
adjustment has regarded i) directly, the country with the larger bilateral current account
surplus against the US, and ii) indirectly, those countries that track the PBC’s policy.
In the light of all these considerations, it seems difficult to determine which of the two
years should be compared to 1985. Since such choice is not innocuous, we will adopt a
conservative approach and look at both.
6
An overview of global trade imbalances
Global imbalances have characterised both the late 1980s and the 2000s, but are phe-
nomena taking place in diverse environments. We start by looking at the overall net trade
imbalances in 1985, 2002 and 2005. To allow a comparison across countries and years,
we calculate their ratios over world GDP, both evaluated in US dollar at current market
exchange rates.6
As to the overall size of the imbalances, they amounted to 2.3% and 3% of world
GDP respectively in 2002 and 2005, whereas they were close to 1.5% in 1985: global
imbalances in recent years have outgrown those at the time of the Plaza agreement. The
number of countries showing significant net trade imbalances has grown too. In 1985
the countries having a surplus larger than 0.1% (0.05%) of world GDP were Japan and
Germany (Brazil, Canada, Mexico, Saudi Arabia, Venezuela, Netherlands) and those with
a deficit larger than 0.1% of world GDP were USA and China.7 In 2002, the countries with
a surplus larger than 0.1% (0.05%) of world GDP were Germany, Japan, Russia, China,
Saudi Arabia, Canada and Ireland (Norway, Indonesia, Singapore, Netherlands, Malaysia,
Argentina and Sweden) and those with a deficit larger than 0.1% (0.05%) of world GDP
were USA, United Kingdom and Spain (Greece). In 2005 Germany, China, Saudi Arabia,
Russia, Japan, Canada, Norway, Netherlands and Brazil (Singapore, Ireland, Malaysia,
Kuwait, Korea, Venezuela, Nigeria) had a surplus larger than 0.1% (0.05%) of world GDP.
Those with a deficit larger than 0.1% (0.05%) of world GDP were USA, United Kingdom
and Spain (Greece, Turkey, India, France). This shows that the number of countries with
large trade surpluses is bigger in the 2000s than in the 80s, while the number of countries
with large deficits remains small.8
These observations, although revealing, provide at most a prima facie evidence of the
growing complexity in the global trade-imbalances network. The problem is that so far we
have neglected all bilateral balances as much as the interdependence between countries. On
these grounds, we move to a complex network approach to shed light on the international
trade imbalances networks in both the 1980s and the 2000s.6The trade balance data come from the IMF IFS 2007, while the world GDP values from the WEO
April 2008.7India, Italy, Egypt, Greece, France and Spain deficits were between 0.045 and 0.035% of world GDP.8These conclusions remain valid if one were to look at cut-offs other than 0.1% and 0.05%. Interestingly,
results would not significantly differ if one were to look at the overall current account balances, but for
those few countries, such as Japan, Switzerland, Taiwan and Belgium, that typically benefit from large
positive income payments.
7
3 Network Analysis
3.1 A telegraphic introduction
Sociologists and psychologists have employed network analysis for the study of social in-
teractions among people and groups since the beginning of the last century. Pioneering
studies in this area include those by Milgram (1967) and Granovetter (1974), who studied
the networks of social acquaintances and job market interactions. A number of powerful
statistical tools for the analysis of network structures emerged outside the realm of social
sciences thanks to the contributions of physicists, mathematicians, and computer scien-
tists. Such methodological advances have then been applied to social analysis in recent
studies by Goyal and Van der Leij (2006); Battiston et al. (2007); Hidalgo et al. (2007); Kali
and Reyes (2007, 2008), where the interactions among academics through co-authorships,
trade linkages among countries, networks within the “product space”, credit chains, and
bankruptcy propagation are analysed using complex networks.
The use of network analysis to study international trade interactions was first intro-
duced by sociologists and political scientists. Snyder and Kick (1979) used international
trade data and network analysis to classify countries into a core-periphery structure. Other
studies that explored this “dependency theory” using aggregated data include Nemeth and
Smith (1985) and Smith and White (1992), while some other studies (Breiger, 1981; Kim
and Shin, 2002) employed disaggregated trade flows. More recently, in the area of econo-
physics, a number of papers have focused on the structural and topological properties of
the world trade network (WTN), with little or no emphasis on their economic implications
(Serrano and Boguna, 2003; Garlaschelli and Loffredo, 2004). These findings show that the
WTN is very symmetric, confirm the presence of a core-periphery structure, suggest the
emergence of a “rich club phenomenon” whereby countries that have higher trade intensi-
ties trade a lot among themselves. Also, Fagiolo et al. (2008) find, somehow surprisingly,
that the overall network structure is fairly stationary over time despite the recent wave
of globalisation. Serrano et al. (2007) look at bilateral trade imbalances and highlight
how a small number of connections carry a large part of the fluxes travelling through the
network.
Recently, some papers have exploited this kind of analysis to answer some more
economic-oriented research questions. For instance, Kali and Reyes (2007) and Kali and
Reyes (2008) have used a network approach to explain macroeconomic dynamics such as
economic growth and episodes of financial contagion. Finally, De Benedictis and Tajoli
(2008) apply it to investigate the pro-trade effects of WTO membership.
In the present context, the appeal for using complex network analysis comes from the
fact that a network approach is able to recover the whole structure of the web of trade
interactions and by doing so it allows us to look at the evolution of the web of bilateral
trade imbalances. In fact, by focusing on a small number of countries and only looking at
few bilateral relations (as customarily done in the literature) one misses the complexity of
8
the overall system.
3.2 Methodology and data
In setting up the trade imbalances network, we have chosen to describe the world net trade
relationship as a graph of N nodes, i.e. countries, connected by a set of bilateral links,
each representing a trade relationship.9 While many papers concerned with trade flows
have used undirected graphs because of the high symmetry of trade flows (see for instance
Fagiolo et al., 2008), here we need consider directed bilateral flows. A link connecting two
countries with a bilateral trade imbalance goes, in our representation, from a country in
deficit towards the country in surplus. Potentially, from any node there might be both
inward-oriented and outward-oriented links: country A may in fact run a deficit with
country B (which we call a creditor of A), while having a surplus vis-a-vis country C
(which we call a debtor of A).
In what follows we take into account the direction of the flows of goods by building
two distinct networks: one made of bilateral trade deficits, the other considering trade
surpluses. A first way to describe international economic integration is to count the number
of (in-coming or out-going) links maintained by each node: this measure is referred to as
node in-degree and out-degree in the network literature. If one is instead interested in
measuring the overall connectivity of the network, it is possible to look at the density of
the graph, which amounts to the number of actual links over the maximum number of
possible connections given the number of nodes.
Following Serrano and Boguna (2003) and Garlaschelli and Loffredo (2004) we also in-
vestigate whether low degree nodes have the tendency to establish relations with partners
characterised by high (or low) degree. The literature suggests that this feature is relevant
for the diffusion of information, diseases or whatever flows through the network. The
correlation between the degree of a node and the average degree of its partners (average
nearest neighbour degree, or ANND) delivers the statistical information on this charac-
teristic of the network. If the correlation is positive one is in presence of an assortative
graph, where nodes tend to establish links with partners with similar level of connectivity;
otherwise the network is said to be disassortative.
Trade links are characterized by strong heterogeneity in their intensity: to take this
into account we need to discriminate among strong and weak links: we do so by weighting
each connection by the value of the trade imbalance it represents. The relevant network
statistics can be extended and applied to a weighted version of the network. Node in-
and out-strength are the sum of weights associated with the links held by any node. The
larger the strength of a node, the stronger its participation in international markets. To
investigate the amount of heterogeneity in economic relationships we can associate with
each node a Herfindahl-Hirschman concentration index, which increases in the heterogene-9See Fagiolo et al. (2007) for a more detailed exposition of network concepts.
9
ity of link intensities. Furthermore, we study the degree of network assortativity from a
weighted perspective by looking at the correlation between strength and average nearest
neighbour strength (ANNS). This tells us whether high-strength countries tend to establish
links with partners that are also very active in international markets or not.
We exploit data from the COMTRADE database compiled by the World Bank. We
used both import and export flows to compute bilateral net trade positions, i.e. bilateral
surpluses or deficits. All data are expressed in million of USD. For each pair of countries
we have 4 potential trade flows, since each exchange is reported as in import by the
destination countries and as an export by the source country. In principle we can therefore
build two measures for each bilateral net position: as usual, the two measures never match.
Moreover, not all the countries appear in the database as both reporter and partner so
that not always all the information is actually available. To minimise measurement errors,
whenever possible we average across the two measures of trade imbalance.
We end up with a sample of 134 countries in 1985, which rises to 160 in 2002 and
2005. This change in sample size is due to three factors: i) the intensification and the
liberalisation of international trade; ii) the political fragmentation of several countries
during the 1990s, especially in Eastern Europe and in the former Soviet Union; iii) the
improvements in data availability in several developing countries.10
3.3 Network results
Node Degree
As said, the number of nodes/countries analysed in the network increases over time,
moving from 134 in 1985 to 160 in the 2000s. Nonetheless, the network density, i.e. the
number of active links over the maximum possible number of relations given the number
of players, has also risen. This means that trade relationships have grown faster than
trading countries so that in the last 20 years globalisation has not only implied that more
countries trade, but (and especially) that countries trade with a larger number of partners.
Table 1 reports summary statistics for node in- and out-degree. This is the simplest
network characteristic and it associates with each node (country) the number of partners
with which it runs a surplus or a deficit. Hence, to stick to our previous labels, in-degree
represents, for each country, the number of its debtors while out-degree the number of its
creditors. Results for density are confirmed by the larger mean and median values of node
in- and out-degree over time. This pattern holds both looking at absolute values and in
terms of the total number of potential partners in the sample (reported in parenthesis in
Table 1). In the 1985, the median country has a surplus against almost 22 partners and
a deficit with 29; in 2002 and 2005 the median country has a surplus with 45-48 countries10In what follows we will not investigate to what extent each of these reasons accounts for the enlargement
of the trade imbalances web. Even though it could be interesting to distinguish the relative contribution of
data availability from that of larger and more diversified exchanges of goods and services, data availability
and trade intensity are likely correlated.
10
and a deficit with 51-54. While the mean and median values of out-degree (i.e. number of
creditors) are close, the mean value of in-degree (i.e. number of debtors) remains higher
than the median one in all years. This implies that most countries have only few debtors,
but some have surpluses with a numerous set of partners. This is confirmed by the fact that
the maximum value of in-degree is larger than that of out-degree. These results represent
a prima facie evidence of the increasing complexity of the trade imbalances network over
time.
Table 1: Summary statistics on node degree1985 2002 2005
Nodes 134 160 160
Density 0.235 0.332 0.334
In-degree: mean 31.32 (23%) 52.86 (33%) 55.31 (35%)
In-degree: median 22.00 (17%) 45.00 (28%) 48.50 (30%)
In-degree: st. dev. 24.67 34.09 34.87
In-degree: max 101 (76%) 128 (80%) 131 (82%)
In-degree: min 1 4 5
Out-degree: mean 31.32 (23%) 52.86 (33%) 55.31 (35%)
Out-degree: median 29.00 (22%) 51.00 (32%) 54.00 (34%)
Out-degree: st. dev. 15.49 17.17 17.47
Out-degree: max 79 (60%) 100 (63%) 94 (59%)
Out-degree: min 5 10 14
Number in parentheses are relative to max number of possible links
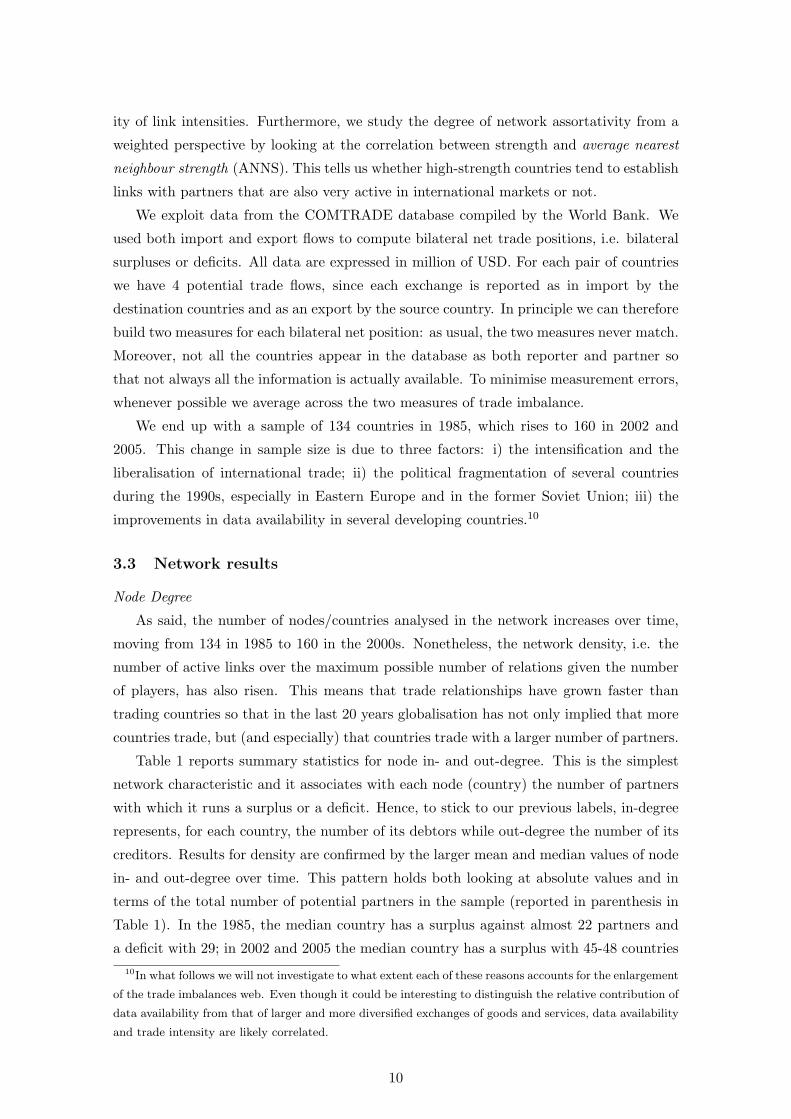
Figure 2 reports the distribution of normalised in- and out-degrees for 1985, 2002 and
2005.11 One can notice that the distribution of in-degree is relatively more skewed (to
the right) than the distribution of out-degree. Moreover, such asymmetry falls from 1985
to 2005 in both cases. Hence, consistently with the descriptive statistics discussed above,
Figure 2 shows that countries tend to run surpluses and deficits with an increasing number
of partners over time, thus corroborating the idea of increasing complexity. A formal test
for the equality of the distributions rejects the null hypothesis and supports the visual
intuition that the distributions of both in- and out-degree have changed from 1985 to
the 2000s. Interestingly, Figure 2 shows that the distribution of in-degrees spans a wider
support, something that one can appreciate also by looking at the ranges of in- and out-
degree in the descriptive statistics summarised in Table 1. There in fact it appears that
the difference between the maximum and minimum values taken by in-degree is larger
than in the case of out-degree. Similarly, while the average number of both incoming and
outgoing links has increased over time, the corresponding standard deviation has remained
stable in the case of the latter, while increasing markedly for the former. This result is
the likely outcome of the new and increased role played by a group of emerging countries11The normalisation is meant to offset the change in the number of countries analysed over the years.
11
(mainly exporting primary commodities) that in recent years display trade surpluses with
many partners.
Figure 2: Degree distribution
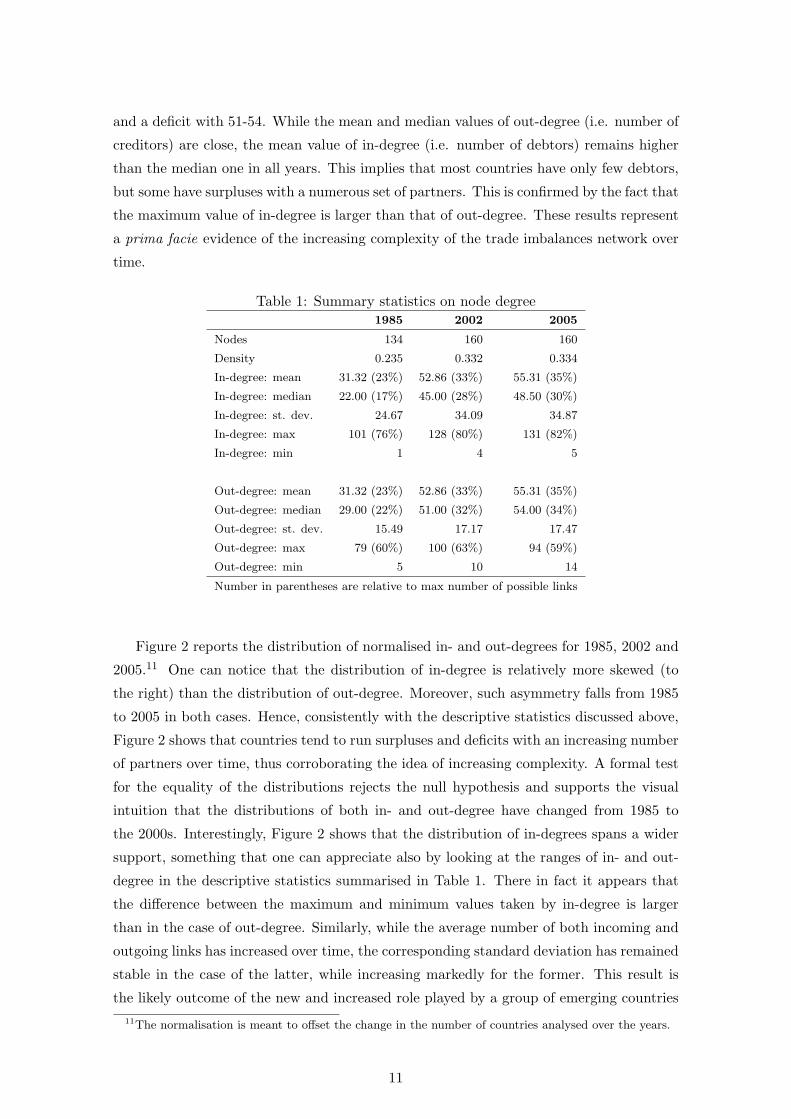
In Figure 3 we plot the distribution of the change in in- and out-degree between 1985
and 2002/2005. One can see that the mode of the distribution corresponds to higher
values in the case of out-degree: this suggests that —for the representative country— the
increase in the number of creditors is larger than the increase in the number debtors or,
to put it differently, that the number of partners with whom the representative country
runs a deficit has grown more than the number of countries with whom it runs a trade
surplus.
Figure 3: Difference in degrees
A further change in the topology of the network of trade imbalances is testified by the
correlation between in- and out-degree. Positive and significant in 1985 (equal to 0.45) the
correlation turns negative in 2002 and 2005, taking values of -0.13 and -0.24. Hence, while
12
in the mid 1980s countries with many debtors tended to have also many creditors, in more
recent years a large number of debtors is associated with a small number of creditors. This
is consistent with the previous findings suggesting that the number of bilateral deficits run
by each country has grown faster than the number of trade surpluses. Also, we find that
while there is not statistical relation between the overall net position of a country and the
number of its debtors, larger deficits are associated with many creditors, and that this
feature is strengthening over time.
Average Nearest Network Degree
The number of partners a country is related to is often a good signal of its importance in
the network. Nonetheless, the relevance of two countries exhibiting the same node-degree
statistics may differ according to the degree of connection of their respective partners.
In an undirected network a measure that is often employed to quantify how a country’s
partners are themselves connected is the average nearest-neighbour degree (ANND). For
each node, ANND measures the average number of links maintained by its partners and,
therefore, it deals with 2-step away relationships. In the present context this metrics does
not say much about the nature of the relationships between each pair of partners: in a
directed network, each country is, at the same time, potentially creditor to some partners
and debtor to others. Rather than grouping them all together, we would like to distinguish
between creditors of one’s creditors, creditors of one’s debtors, and so on. Accordingly,
there are four possible variants of the average nearest-neighbour degree that can be used
in a directed framework.12
For each country one can in fact look at a) the debtors of one’s debtors; b) the creditors
of one’s debtors; c) the debtors of one’s creditors; and d) the creditors of one’s creditors.
We label these four measures as ANNDinin , ANNDin
out , ANNDoutin , ANNDout
out , where
the superscript indicates the country of reference and the subscript the type of relation
maintained by its partners.13 Table 2 summarises some descriptive statistics for the 4
indices. One can see that mean and median values always increase over time, while the
standard deviation takes smaller values. This is consistent with a process of generalised
increased interconnectedness among countries.
The correlation coefficients between the incoming and outgoing links and ANND pro-
vide us with some additional insights. This information is summarised in Table 3: the
correlations are all negative and significant in 1985. Thus, for instance, we see that coun-
tries with many creditors (high out-degree) tend to run deficits with partners that, on
average, are characterised by few bilateral surpluses and deficits. The same applies to
countries running many trade surpluses (high in-degree) in 1985. In network analysis such12To the best of our knowledge, these four metrics have never been used in the literature so far.13Thus, ANNDin
in measures the number of debtors of one’s own debtors and ANNDoutin the number of
debtors of one’s own creditors (other than itself). It is worth noticing that the country of reference is
excluded from the count of its own debtors/creditors’ partners.
13
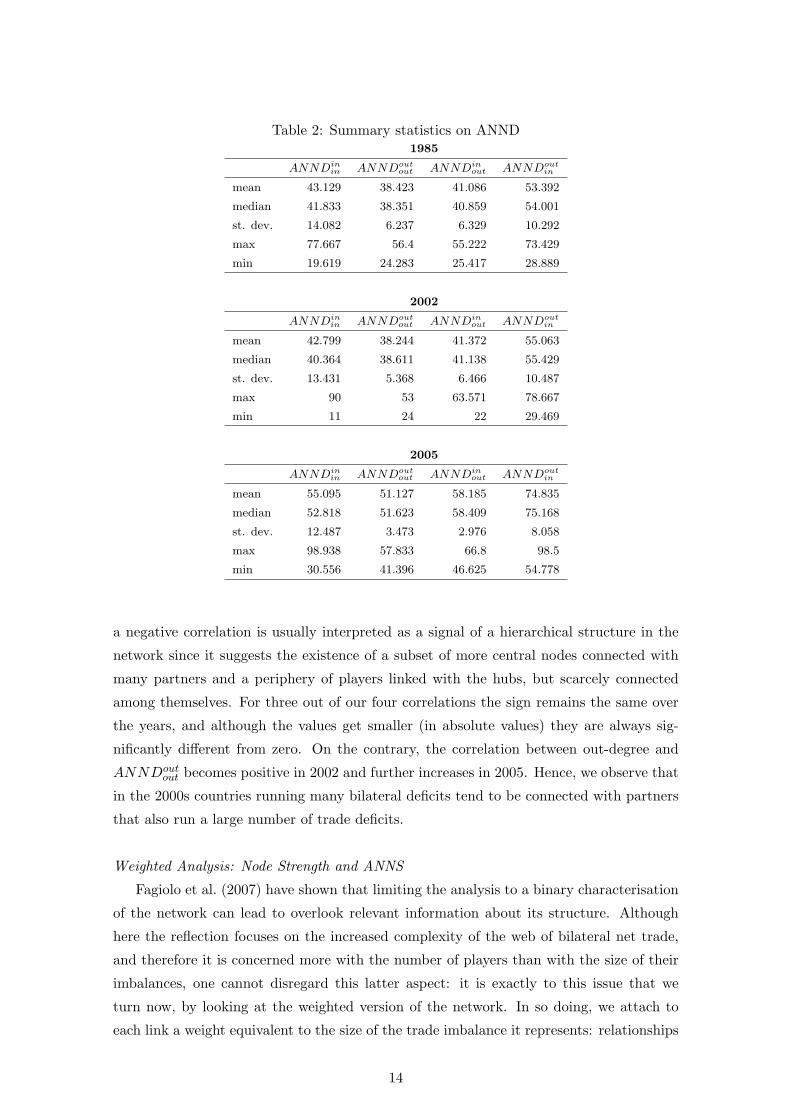
Table 2: Summary statistics on ANND1985
ANNDinin ANNDout
out ANNDinout ANNDout
in
mean 43.129 38.423 41.086 53.392
median 41.833 38.351 40.859 54.001
st. dev. 14.082 6.237 6.329 10.292
max 77.667 56.4 55.222 73.429
min 19.619 24.283 25.417 28.889
2002
ANNDinin ANNDout
out ANNDinout ANNDout
in
mean 42.799 38.244 41.372 55.063
median 40.364 38.611 41.138 55.429
st. dev. 13.431 5.368 6.466 10.487
max 90 53 63.571 78.667
min 11 24 22 29.469
2005
ANNDinin ANNDout
out ANNDinout ANNDout
in
mean 55.095 51.127 58.185 74.835
median 52.818 51.623 58.409 75.168
st. dev. 12.487 3.473 2.976 8.058
max 98.938 57.833 66.8 98.5
min 30.556 41.396 46.625 54.778
a negative correlation is usually interpreted as a signal of a hierarchical structure in the
network since it suggests the existence of a subset of more central nodes connected with
many partners and a periphery of players linked with the hubs, but scarcely connected
among themselves. For three out of our four correlations the sign remains the same over
the years, and although the values get smaller (in absolute values) they are always sig-
nificantly different from zero. On the contrary, the correlation between out-degree and
ANNDoutout becomes positive in 2002 and further increases in 2005. Hence, we observe that
in the 2000s countries running many bilateral deficits tend to be connected with partners
that also run a large number of trade deficits.
Weighted Analysis: Node Strength and ANNS
Fagiolo et al. (2007) have shown that limiting the analysis to a binary characterisation
of the network can lead to overlook relevant information about its structure. Although
here the reflection focuses on the increased complexity of the web of bilateral net trade,
and therefore it is concerned more with the number of players than with the size of their
imbalances, one cannot disregard this latter aspect: it is exactly to this issue that we
turn now, by looking at the weighted version of the network. In so doing, we attach to
each link a weight equivalent to the size of the trade imbalance it represents: relationships
14
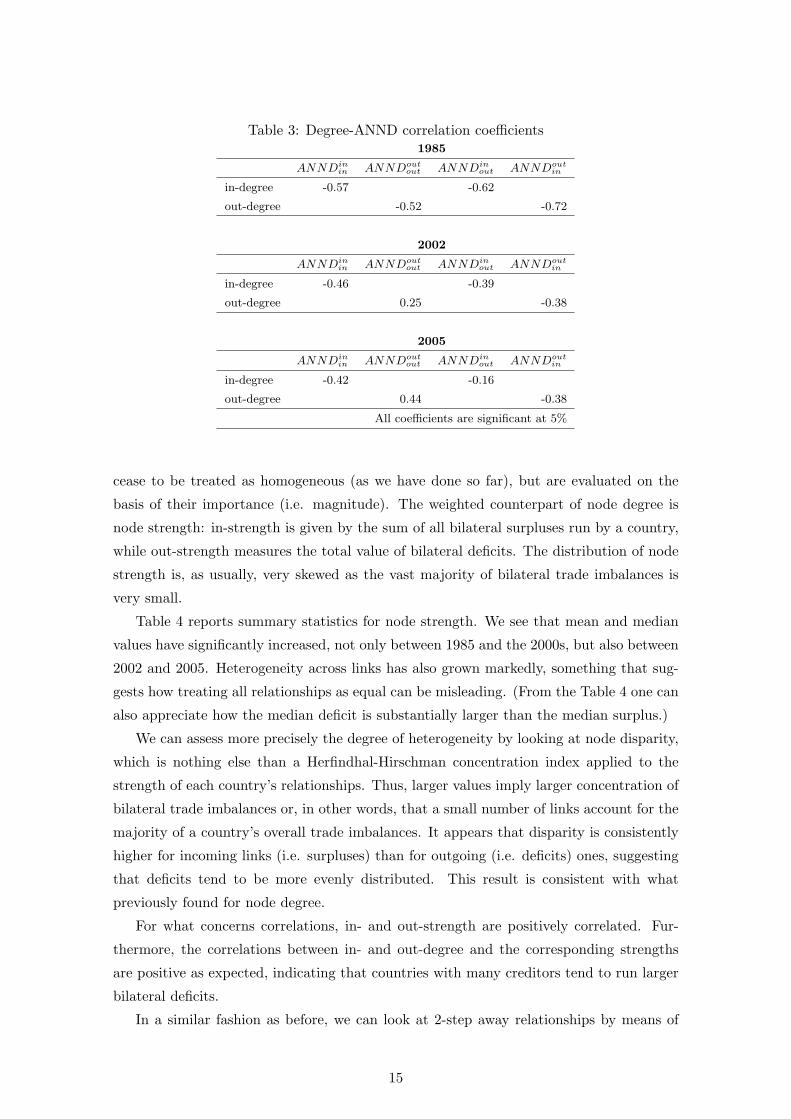
Table 3: Degree-ANND correlation coefficients1985
ANNDinin ANNDout
out ANNDinout ANNDout
in
in-degree -0.57 -0.62
out-degree -0.52 -0.72
2002
ANNDinin ANNDout
out ANNDinout ANNDout
in
in-degree -0.46 -0.39
out-degree 0.25 -0.38
2005
ANNDinin ANNDout
out ANNDinout ANNDout
in
in-degree -0.42 -0.16
out-degree 0.44 -0.38
All coefficients are significant at 5%
cease to be treated as homogeneous (as we have done so far), but are evaluated on the
basis of their importance (i.e. magnitude). The weighted counterpart of node degree is
node strength: in-strength is given by the sum of all bilateral surpluses run by a country,
while out-strength measures the total value of bilateral deficits. The distribution of node
strength is, as usually, very skewed as the vast majority of bilateral trade imbalances is
very small.
Table 4 reports summary statistics for node strength. We see that mean and median
values have significantly increased, not only between 1985 and the 2000s, but also between
2002 and 2005. Heterogeneity across links has also grown markedly, something that sug-
gests how treating all relationships as equal can be misleading. (From the Table 4 one can
also appreciate how the median deficit is substantially larger than the median surplus.)
We can assess more precisely the degree of heterogeneity by looking at node disparity,
which is nothing else than a Herfindhal-Hirschman concentration index applied to the
strength of each country’s relationships. Thus, larger values imply larger concentration of
bilateral trade imbalances or, in other words, that a small number of links account for the
majority of a country’s overall trade imbalances. It appears that disparity is consistently
higher for incoming links (i.e. surpluses) than for outgoing (i.e. deficits) ones, suggesting
that deficits tend to be more evenly distributed. This result is consistent with what
previously found for node degree.
For what concerns correlations, in- and out-strength are positively correlated. Fur-
thermore, the correlations between in- and out-degree and the corresponding strengths
are positive as expected, indicating that countries with many creditors tend to run larger
bilateral deficits.
In a similar fashion as before, we can look at 2-step away relationships by means of
15
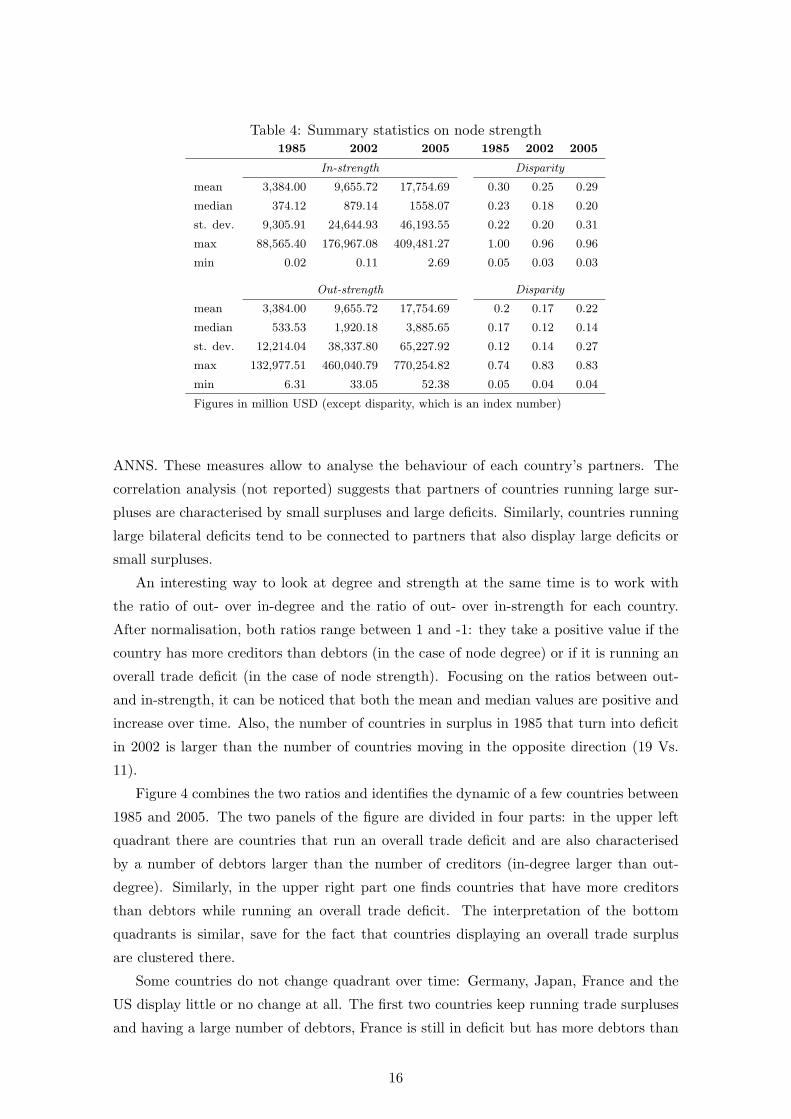
Table 4: Summary statistics on node strength1985 2002 2005 1985 2002 2005
In-strength Disparity
mean 3,384.00 9,655.72 17,754.69 0.30 0.25 0.29
median 374.12 879.14 1558.07 0.23 0.18 0.20
st. dev. 9,305.91 24,644.93 46,193.55 0.22 0.20 0.31
max 88,565.40 176,967.08 409,481.27 1.00 0.96 0.96
min 0.02 0.11 2.69 0.05 0.03 0.03
Out-strength Disparity
mean 3,384.00 9,655.72 17,754.69 0.2 0.17 0.22
median 533.53 1,920.18 3,885.65 0.17 0.12 0.14
st. dev. 12,214.04 38,337.80 65,227.92 0.12 0.14 0.27
max 132,977.51 460,040.79 770,254.82 0.74 0.83 0.83
min 6.31 33.05 52.38 0.05 0.04 0.04
Figures in million USD (except disparity, which is an index number)
ANNS. These measures allow to analyse the behaviour of each country’s partners. The
correlation analysis (not reported) suggests that partners of countries running large sur-
pluses are characterised by small surpluses and large deficits. Similarly, countries running
large bilateral deficits tend to be connected to partners that also display large deficits or
small surpluses.
An interesting way to look at degree and strength at the same time is to work with
the ratio of out- over in-degree and the ratio of out- over in-strength for each country.
After normalisation, both ratios range between 1 and -1: they take a positive value if the
country has more creditors than debtors (in the case of node degree) or if it is running an
overall trade deficit (in the case of node strength). Focusing on the ratios between out-
and in-strength, it can be noticed that both the mean and median values are positive and
increase over time. Also, the number of countries in surplus in 1985 that turn into deficit
in 2002 is larger than the number of countries moving in the opposite direction (19 Vs.
11).
Figure 4 combines the two ratios and identifies the dynamic of a few countries between
1985 and 2005. The two panels of the figure are divided in four parts: in the upper left
quadrant there are countries that run an overall trade deficit and are also characterised
by a number of debtors larger than the number of creditors (in-degree larger than out-
degree). Similarly, in the upper right part one finds countries that have more creditors
than debtors while running an overall trade deficit. The interpretation of the bottom
quadrants is similar, save for the fact that countries displaying an overall trade surplus
are clustered there.
Some countries do not change quadrant over time: Germany, Japan, France and the
US display little or no change at all. The first two countries keep running trade surpluses
and having a large number of debtors, France is still in deficit but has more debtors than
16
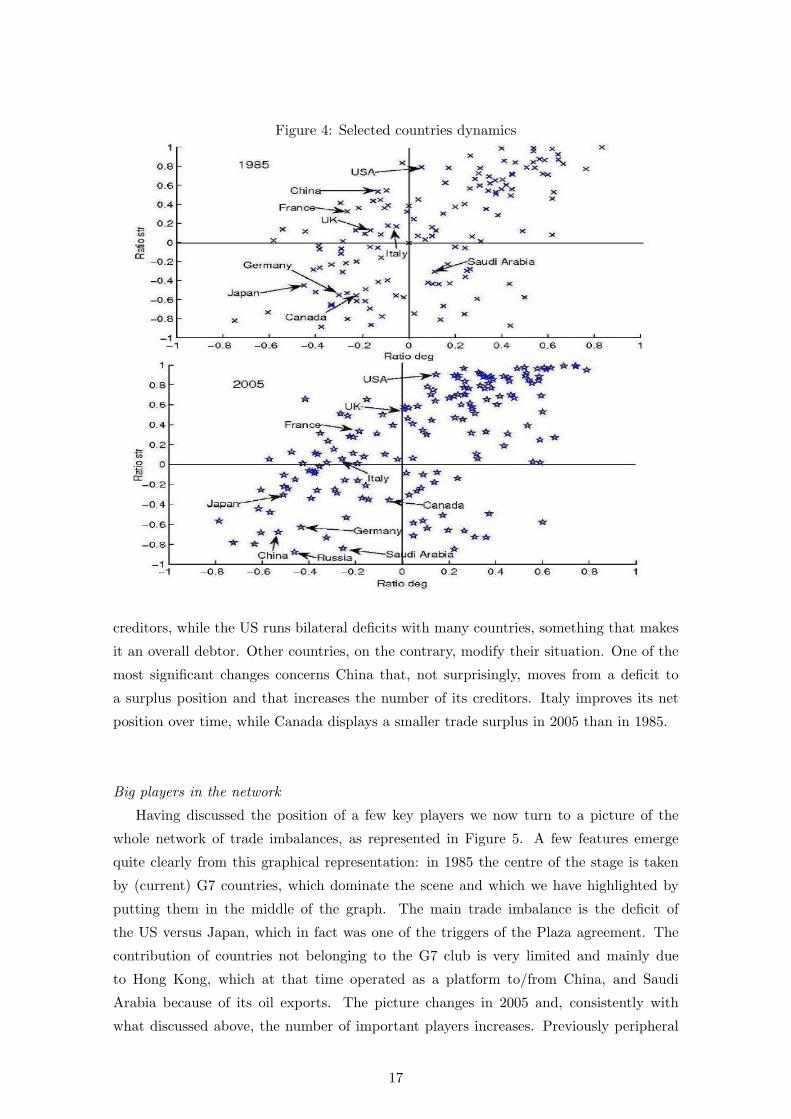
Figure 4: Selected countries dynamics
creditors, while the US runs bilateral deficits with many countries, something that makes
it an overall debtor. Other countries, on the contrary, modify their situation. One of the
most significant changes concerns China that, not surprisingly, moves from a deficit to
a surplus position and that increases the number of its creditors. Italy improves its net
position over time, while Canada displays a smaller trade surplus in 2005 than in 1985.
Big players in the network
Having discussed the position of a few key players we now turn to a picture of the
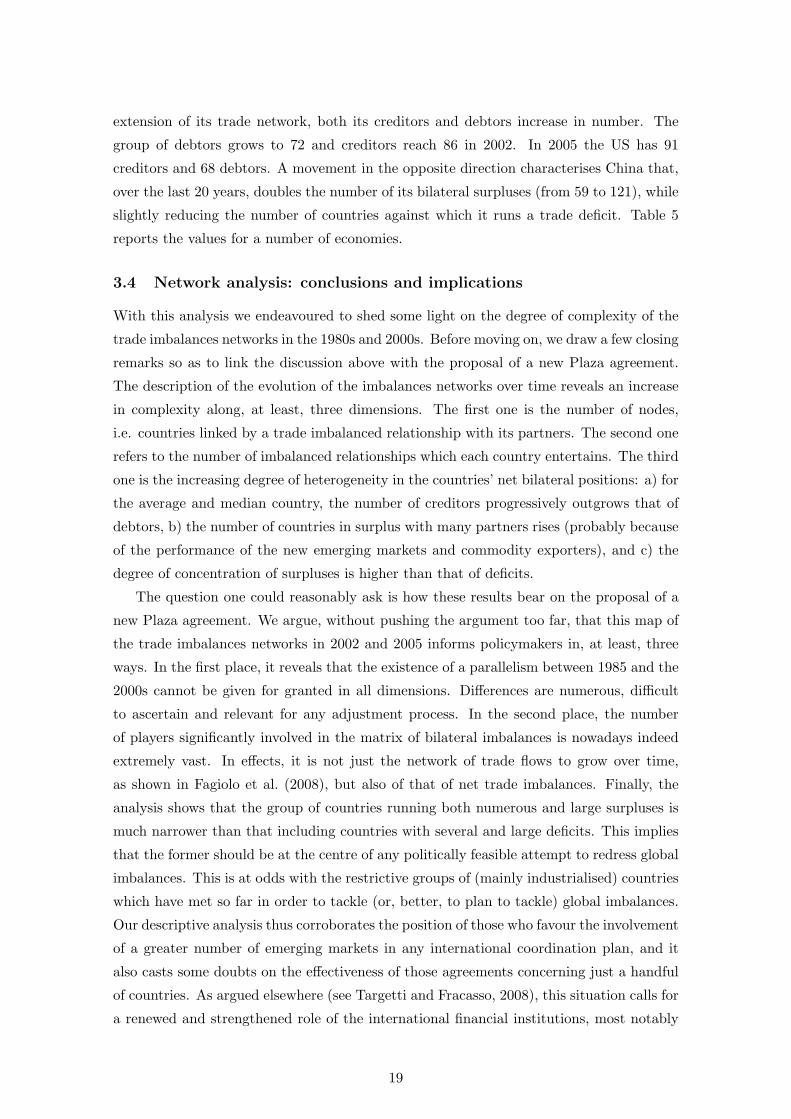
whole network of trade imbalances, as represented in Figure 5. A few features emerge
quite clearly from this graphical representation: in 1985 the centre of the stage is taken
by (current) G7 countries, which dominate the scene and which we have highlighted by
putting them in the middle of the graph. The main trade imbalance is the deficit of
the US versus Japan, which in fact was one of the triggers of the Plaza agreement. The
contribution of countries not belonging to the G7 club is very limited and mainly due
to Hong Kong, which at that time operated as a platform to/from China, and Saudi
Arabia because of its oil exports. The picture changes in 2005 and, consistently with
what discussed above, the number of important players increases. Previously peripheral
17
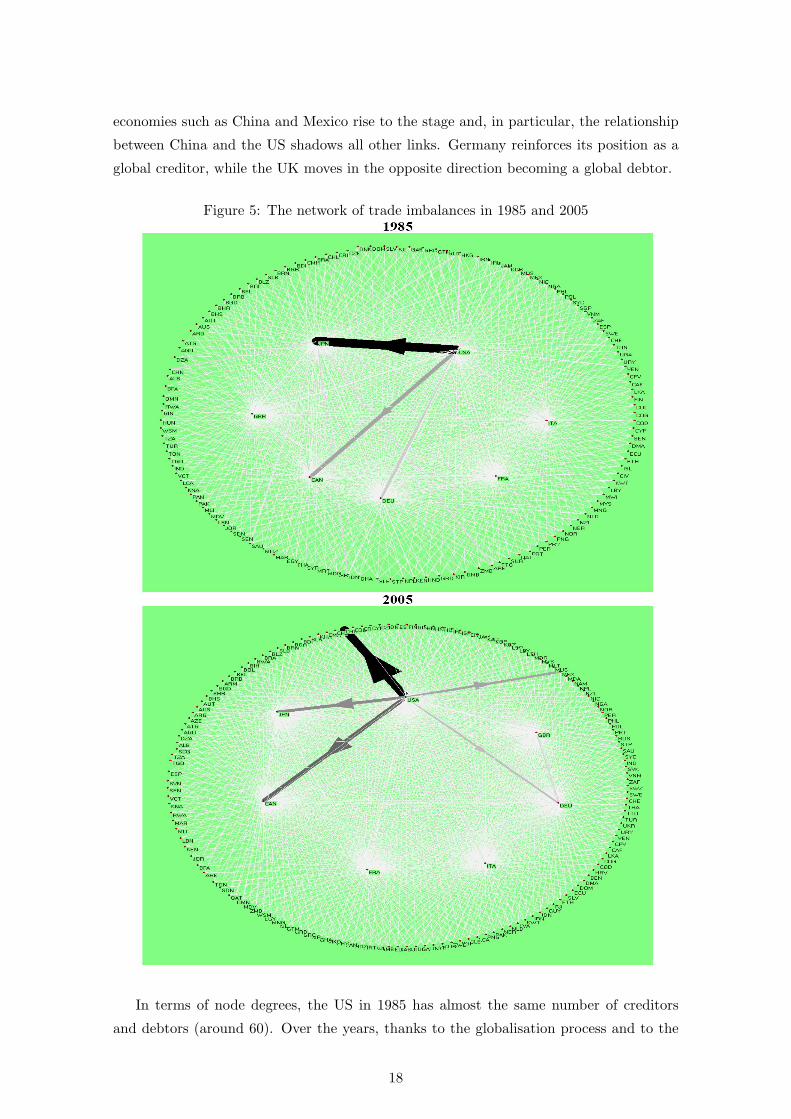
economies such as China and Mexico rise to the stage and, in particular, the relationship
between China and the US shadows all other links. Germany reinforces its position as a
global creditor, while the UK moves in the opposite direction becoming a global debtor.
Figure 5: The network of trade imbalances in 1985 and 2005
In terms of node degrees, the US in 1985 has almost the same number of creditors
and debtors (around 60). Over the years, thanks to the globalisation process and to the
18
extension of its trade network, both its creditors and debtors increase in number. The
group of debtors grows to 72 and creditors reach 86 in 2002. In 2005 the US has 91
creditors and 68 debtors. A movement in the opposite direction characterises China that,
over the last 20 years, doubles the number of its bilateral surpluses (from 59 to 121), while
slightly reducing the number of countries against which it runs a trade deficit. Table 5
reports the values for a number of economies.
3.4 Network analysis: conclusions and implications
With this analysis we endeavoured to shed some light on the degree of complexity of the
trade imbalances networks in the 1980s and 2000s. Before moving on, we draw a few closing
remarks so as to link the discussion above with the proposal of a new Plaza agreement.
The description of the evolution of the imbalances networks over time reveals an increase
in complexity along, at least, three dimensions. The first one is the number of nodes,
i.e. countries linked by a trade imbalanced relationship with its partners. The second one
refers to the number of imbalanced relationships which each country entertains. The third
one is the increasing degree of heterogeneity in the countries’ net bilateral positions: a) for
the average and median country, the number of creditors progressively outgrows that of
debtors, b) the number of countries in surplus with many partners rises (probably because
of the performance of the new emerging markets and commodity exporters), and c) the
degree of concentration of surpluses is higher than that of deficits.
The question one could reasonably ask is how these results bear on the proposal of a
new Plaza agreement. We argue, without pushing the argument too far, that this map of
the trade imbalances networks in 2002 and 2005 informs policymakers in, at least, three
ways. In the first place, it reveals that the existence of a parallelism between 1985 and the
2000s cannot be given for granted in all dimensions. Differences are numerous, difficult
to ascertain and relevant for any adjustment process. In the second place, the number
of players significantly involved in the matrix of bilateral imbalances is nowadays indeed
extremely vast. In effects, it is not just the network of trade flows to grow over time,
as shown in Fagiolo et al. (2008), but also of that of net trade imbalances. Finally, the
analysis shows that the group of countries running both numerous and large surpluses is
much narrower than that including countries with several and large deficits. This implies
that the former should be at the centre of any politically feasible attempt to redress global
imbalances. This is at odds with the restrictive groups of (mainly industrialised) countries
which have met so far in order to tackle (or, better, to plan to tackle) global imbalances.
Our descriptive analysis thus corroborates the position of those who favour the involvement
of a greater number of emerging markets in any international coordination plan, and it
also casts some doubts on the effectiveness of those agreements concerning just a handful
of countries. As argued elsewhere (see Targetti and Fracasso, 2008), this situation calls for
a renewed and strengthened role of the international financial institutions, most notably
19
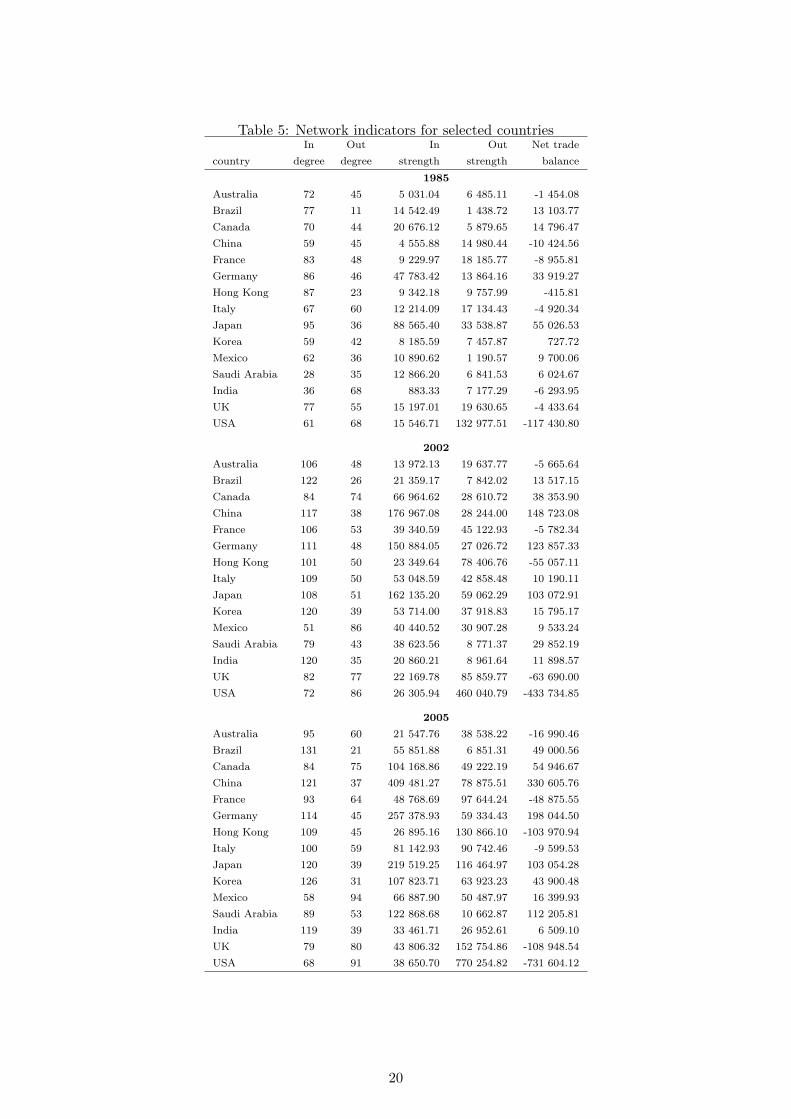
Table 5: Network indicators for selected countriesIn Out In Out Net trade
country degree degree strength strength balance
1985
Australia 72 45 5 031.04 6 485.11 -1 454.08
Brazil 77 11 14 542.49 1 438.72 13 103.77
Canada 70 44 20 676.12 5 879.65 14 796.47
China 59 45 4 555.88 14 980.44 -10 424.56
France 83 48 9 229.97 18 185.77 -8 955.81
Germany 86 46 47 783.42 13 864.16 33 919.27
Hong Kong 87 23 9 342.18 9 757.99 -415.81
Italy 67 60 12 214.09 17 134.43 -4 920.34
Japan 95 36 88 565.40 33 538.87 55 026.53
Korea 59 42 8 185.59 7 457.87 727.72
Mexico 62 36 10 890.62 1 190.57 9 700.06
Saudi Arabia 28 35 12 866.20 6 841.53 6 024.67
India 36 68 883.33 7 177.29 -6 293.95
UK 77 55 15 197.01 19 630.65 -4 433.64
USA 61 68 15 546.71 132 977.51 -117 430.80
2002
Australia 106 48 13 972.13 19 637.77 -5 665.64
Brazil 122 26 21 359.17 7 842.02 13 517.15
Canada 84 74 66 964.62 28 610.72 38 353.90
China 117 38 176 967.08 28 244.00 148 723.08
France 106 53 39 340.59 45 122.93 -5 782.34
Germany 111 48 150 884.05 27 026.72 123 857.33
Hong Kong 101 50 23 349.64 78 406.76 -55 057.11
Italy 109 50 53 048.59 42 858.48 10 190.11
Japan 108 51 162 135.20 59 062.29 103 072.91
Korea 120 39 53 714.00 37 918.83 15 795.17
Mexico 51 86 40 440.52 30 907.28 9 533.24
Saudi Arabia 79 43 38 623.56 8 771.37 29 852.19
India 120 35 20 860.21 8 961.64 11 898.57
UK 82 77 22 169.78 85 859.77 -63 690.00
USA 72 86 26 305.94 460 040.79 -433 734.85
2005
Australia 95 60 21 547.76 38 538.22 -16 990.46
Brazil 131 21 55 851.88 6 851.31 49 000.56
Canada 84 75 104 168.86 49 222.19 54 946.67
China 121 37 409 481.27 78 875.51 330 605.76
France 93 64 48 768.69 97 644.24 -48 875.55
Germany 114 45 257 378.93 59 334.43 198 044.50
Hong Kong 109 45 26 895.16 130 866.10 -103 970.94
Italy 100 59 81 142.93 90 742.46 -9 599.53
Japan 120 39 219 519.25 116 464.97 103 054.28
Korea 126 31 107 823.71 63 923.23 43 900.48
Mexico 58 94 66 887.90 50 487.97 16 399.93
Saudi Arabia 89 53 122 868.68 10 662.87 112 205.81
India 119 39 33 461.71 26 952.61 6 509.10
UK 79 80 43 806.32 152 754.86 -108 948.54
USA 68 91 38 650.70 770 254.82 -731 604.12
20
the IMF.
4 Trade imbalances-weighted effective exchange rates
4.1 Motivations and methodology
The complexity of the network of trade imbalances bears not only on the difficulty to
orchestrate a multilateral plan of interventions to redress such imbalances, but also on the
synthetic measures normally adopted to track the evolution of exchange rates over time.
In particular, in what follows, we shall focus on the nominal effective exchange rate (EER),
that is a synthetic way to seize the evolution of a currency vis-a-vis its bilateral exchange
rates (see MacDonald, 2007, for a discussion). In general, the EER is a weighted average
of a basket of bilateral exchange rates.14 The choices of the currency basket, the weighting
scheme, the base period and the updating method in case of time-varying weights touch on
the EERs: central banks and international institutions have developed various alternative
indices, which precisely differ in one or more of these dimensions.15
In most cases, researchers have developed EERs which serve as indicators of countries’
levels of competitiveness. In such a case, the ideal approach to build EERs would be to
use a global model-based weighting scheme of bilateral trade flows. The high degree of
complexity of such theoretical approach, however, has led researchers and policymakers
to rely on simpler indices (based on actual trade flows), that give a qualitative picture of
the movements in the level of countries’ competitiveness. Among these indices, the most
common schemes to weight bilateral exchange rates are the global, bilateral and double
weighting approaches. The latter is the most complete and considers the local competition
which domestic exporters face in the export markets, the foreign competition that domestic
exporters meet in third markets and the competition domestic producers face at home.16
The BIS trade-weighted effective exchange rate index (TWI hereafter) is built along this
method. The broader basket composition of the TWI currently encompasses 52 economies
(see Klau and Fung, 2006).
The variety of EER measures is not exclusively the product of competition among
research centres. In fact, the very concept of EER is not univocally defined and can be de-
clined according to the economic issue to analyse. In particular, the choice of the weighting14Among the first works endorsing EERs we recall Artus and Rhomberg (1973); Black (1976) and Hooper
and Morton (1978).15Several existing indices, for instance, differ in terms of the scope of their currency basket. This is due
to the fact that currency baskets are not based on a single theoretical foundation and are also influenced
by data availability and integrity.16Such scheme descends from Armington’s (1969) demand equations and requires a certain amount of
information on domestic and international market shares. The bilateral scheme, instead, ignores third-
market competition, whereas the global scheme overlooks both third-market competition and domestic
competition.
21
scheme and the basket of currencies hinges on the phenomenon under scrutiny.17 This is
clearly illustrated by the fact that, besides various trade-weighted EERs, researchers also
developed capital-weighted EERs (Makin and Robson, 1999).
Since country competitiveness is usually the issue addressed by EERs, the indices do
not take into account trade imbalances, but gross trade flows. It follows that such EER
measures, while usefully condensing in a unique figure the average evolution of various
bilateral exchange rates, do not help to discern whether exchange rates move so as to close
bilateral and overall trade imbalances. The question, then, is whether it would be possi-
ble to build alternative EER indices which take into account bilateral trade imbalances,
rather than competitiveness. These measures would be useful to interpret the evolution
of bilateral exchange rates while taking trade imbalances into account.
Positive and negative bilateral imbalances are to be treated separately if one wants
to build EER measures that convey information about both exchange rates and trade
imbalances. Accordingly, we build two imbalances-weighted indices. SWI is a surplus-
weighted EER index. In the SWI for country i, the basket includes all the currencies of
the countries which the country i has a trade surplus with. The currency of country j
enters in the SWI for i weighted by the ratio of country i ’s bilateral trade surplus with j
over country i ’s overall surpluses. DWI is a deficit-weighted EER index: the calculation
of such EER for country i is based on a basket including all the currencies of the countries
which country i has a deficit with. The weigh attached to the currency of country m is
proportional to ratio of the bilateral trade deficit of i with m relative to i ’s total deficits.
Having set the criteria to form the baskets of currencies entering into the SWIs and
the DWIs, a decision need be made in terms of i) the extension of the overall sample of
currencies, and ii) the year of reference for the weights. Starting with the latter, we decide
to use the bilateral trade imbalances in 1985 and 2002 to build the weighting schemes for
the two decades. To allow comparability, all indices are then normalised and set equal
to 100 in 1985 and 2002. As to the composition of the samples, we will adopt two: one
(which we call broad) consists in the entire set of countries considered in Section 3 above
(i.e. respectively 134 countries in the 1980s and 160 in the 2000s); the other (narrow) is
the BIS sample of countries for which we have trade and exchange rate data (that is 42
in 1980s and 49 in 2000s). The former measure will bring into the picture the complexity
of the network of imbalances, while the latter will be used to compare to which extent
SWIs and DWIs diverge from the TWIs calculated by the BIS, once an (almost) equivalent
sample is used to build the indices.18
17See Turn and Van’t dack (1993); Klau and Fung (2006) and Erlandsson and Markowski (2006) on this.18Admittedly, our restricted sample and that used by the BIS do not perfectly coincide. First, we
exclude Taiwan and Romania for the lack of trade data. Secondly, while the BIS treats the euro-area as
a single entity in computing the EER indices for the other economies and calculates a set of EER indices
for each euro-area country taking intra-euro area trade into account, we deal with euro-area countries as
independent ones. This complicates the interpretation of the indices for the countries of the area (since
there cannot be bilateral exchange rate changes between them in the 2000s, the variability of the indices is
22
Once endowed with these new synthetic indicators, we shall concentrate on the evo-
lution of the exchange rates during the 1985-1987 and 2002-2006. While our statistical
analysis will be based on the entire samples at hand, for the sake of keeping tables and
graphs readable, in what follows we shall discuss the indices for a limited number of coun-
tries. As explained above, however, they do not coincide with the baskets and the samples
used to calculate the indices.
4.2 The evolution of the exchange rates in the 80s
Table 6 reproduces 24 among the 134 SWIs and DWIs calculated for the period 1985-
1987. We report both broad DWIs and SWIs including 134 countries and narrow DWIs
and SWIs taking into account the 42 countries that belong to the BIS sample.19 The
comparison between our narrow and broad indices will allow to draw some insights on
the relative importance of the choice of the basket of currencies. We will start with a few
statistical findings and we shall then move to discuss the case of specific countries.
The correlation between the broad DWIs and SWIs amounts to 0.60 in 1986 and to
0.30 in 1987. The indices move in the same direction (with respect to 1985) in more than
70 of the countries both in 1986 and 1987.20 If we focus on the narrow indices (e.g. based
on the sample of the 42 BIS countries), the correlation is about 0.60 both in 1986 and
1987, and their changes have the same sign in more than 70% of the countries. These
findings show that SWIs and DWIs tend to move in the same direction most of the times,
but relatively less often in the developing countries excluded from the BIS sample.21 The
fact that SWIs and DWIs move in the same direction suggests that the nominal exchange
rates in the 80s did not change so as to close the bilateral imbalances. Over the period
1985-1987, we find no statistically significant association in the direction of change of
the (both narrow and broad) SWIs and DWIs, on the one hand, and, the overall trade
balances, on the other.22,23
This does not mean that exchange rates did not affect trade imbalances at all. Sev-
eral reasons may in fact account for the apparent independence in the data. The first
limited to the differences in their trade imbalances), but it avoids cancelling out the intra-European trade
imbalances.19In what follows, however, we will not compare our narrow indices with those calculated by the BIS
for the 80s because until 1994 the BIS produced an even narrower (and therefore not comparable) TWI
basket.20Looking at the broad and narrow indices for the common sample of 42 countries, the correlation
between the broad and narrow measures is high (i.e. 0.85 in 1986 and 0.93 in 1987 for DWIs, and 0.99 in
1986 and 0.98 in 1987 for SWIs).21For instance, this happens for Antigua, Belize, Cape Verde, Chile, Costa Rica, Dominican Republic,
El Salvador, Ethiopia, Kenya, Mauritius, Mongolia, Paraguay, Peru, Uruguay and others.22The Fisher exact test, the likelihood ratio G2 statistics and the Chi square Pearson statistics fail to
reject the null hypothesis that the changes in the indices and in the trade balance measures are independent.23This holds true both if we take either the change in the values of DWIs and SWIs between 1987 and
1985, or the change between the average values of DWIs and SWIs in 1986-1987 and those in 1985.
23
explanation is that changes in nominal exchange rate may not be as effective as those in
real exchange rates in affecting trade balances: this is most likely in the 80s when several
countries were facing relatively high inflation rates. The second explanation is that in that
decade several countries were pegging their currencies to baskets of foreign stable curren-
cies in the attempt to control domestic inflation. France and Italy, for instance, although
both recording an overall trade deficit, saw their currencies appreciate in nominal terms,
probably after the appreciation of the German mark (Germany, on the contrary, was run-
ning large surpluses). The third plausible explanation is that the impact of exchange rate
variations on the trade balances ultimately depends on the demand and supply elasticities,
which differ across countries and goods: there is therefore no theoretical reason to expect
the existence of a one-to-one relationship between the changes in the exchange rates and
those in the trade balances.
As to the indices for the various countries, the first observation to make is that the US
dollar, maybe thanks to the Plaza agreement, depreciated in nominal terms vis-a-vis the
currencies of both creditor and debtor countries. This is consistent with the evolution of
the US trade-weighted EERs as calculated by the Fed, which indicates a (modest) nominal
depreciation of the dollar. Our findings show that, on a trade-imbalances weighted basis,
the US dollar adjustment went into the direction of closing the overall trade deficit by
reducing the bilateral deficits and increasing the bilateral surpluses. Interestingly, our
broader indices signal a relatively smaller US dollar nominal depreciation in the period
1985-1987 than the narrow ones. Most likely, this is the by-product of the Plaza agreement,
which concentrated on coordinating the movements of only a very restricted number of
countries. This finding suggests that focusing on the movements of a narrow group of
currencies may lead to a misleading appraisal of the evolution of a currency against all its
trading partners.
The Japanese yen appreciated both against creditors and debtors. The reverse of what
argued for the US can be said for Japan, which is among the countries with the largest
overall trade surplus in the 80s: the narrow indices indicate a larger appreciation than
the narrow ones. This may contribute to account of what is perceived as an excessive
appreciation of the Japanese currency, an appreciation which contributed to incept the
dynamics which led to the crisis of the 90s. As the yen, also several European currencies
appreciated in the period, regardless their initial overall trade balances. Most likely, this is
due to the Plaza agreement since countries with relatively low inflation rates were forced to
pursue relatively larger nominal exchange rate movements. The fact that the appreciation
is most often larger against debtors than debtors supports such a claim. We plot the
patterns of the indices for the countries of the G7 and China in Figure 6 so as to facilitate
the comparison across the various indices.
24
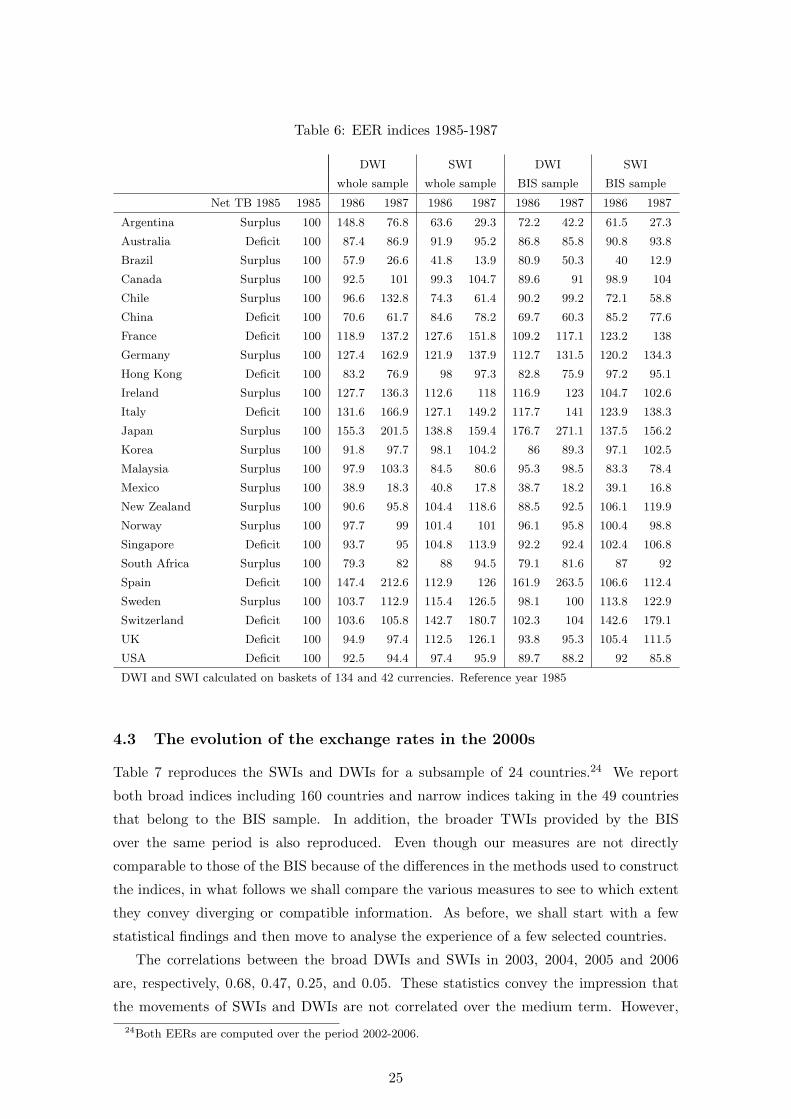
Table 6: EER indices 1985-1987
DWI SWI DWI SWI
whole sample whole sample BIS sample BIS sample
Net TB 1985 1985 1986 1987 1986 1987 1986 1987 1986 1987
Argentina Surplus 100 148.8 76.8 63.6 29.3 72.2 42.2 61.5 27.3
Australia Deficit 100 87.4 86.9 91.9 95.2 86.8 85.8 90.8 93.8
Brazil Surplus 100 57.9 26.6 41.8 13.9 80.9 50.3 40 12.9
Canada Surplus 100 92.5 101 99.3 104.7 89.6 91 98.9 104
Chile Surplus 100 96.6 132.8 74.3 61.4 90.2 99.2 72.1 58.8
China Deficit 100 70.6 61.7 84.6 78.2 69.7 60.3 85.2 77.6
France Deficit 100 118.9 137.2 127.6 151.8 109.2 117.1 123.2 138
Germany Surplus 100 127.4 162.9 121.9 137.9 112.7 131.5 120.2 134.3
Hong Kong Deficit 100 83.2 76.9 98 97.3 82.8 75.9 97.2 95.1
Ireland Surplus 100 127.7 136.3 112.6 118 116.9 123 104.7 102.6
Italy Deficit 100 131.6 166.9 127.1 149.2 117.7 141 123.9 138.3
Japan Surplus 100 155.3 201.5 138.8 159.4 176.7 271.1 137.5 156.2
Korea Surplus 100 91.8 97.7 98.1 104.2 86 89.3 97.1 102.5
Malaysia Surplus 100 97.9 103.3 84.5 80.6 95.3 98.5 83.3 78.4
Mexico Surplus 100 38.9 18.3 40.8 17.8 38.7 18.2 39.1 16.8
New Zealand Surplus 100 90.6 95.8 104.4 118.6 88.5 92.5 106.1 119.9
Norway Surplus 100 97.7 99 101.4 101 96.1 95.8 100.4 98.8
Singapore Deficit 100 93.7 95 104.8 113.9 92.2 92.4 102.4 106.8
South Africa Surplus 100 79.3 82 88 94.5 79.1 81.6 87 92
Spain Deficit 100 147.4 212.6 112.9 126 161.9 263.5 106.6 112.4
Sweden Surplus 100 103.7 112.9 115.4 126.5 98.1 100 113.8 122.9
Switzerland Deficit 100 103.6 105.8 142.7 180.7 102.3 104 142.6 179.1
UK Deficit 100 94.9 97.4 112.5 126.1 93.8 95.3 105.4 111.5
USA Deficit 100 92.5 94.4 97.4 95.9 89.7 88.2 92 85.8
DWI and SWI calculated on baskets of 134 and 42 currencies. Reference year 1985
4.3 The evolution of the exchange rates in the 2000s
Table 7 reproduces the SWIs and DWIs for a subsample of 24 countries.24 We report
both broad indices including 160 countries and narrow indices taking in the 49 countries
that belong to the BIS sample. In addition, the broader TWIs provided by the BIS
over the same period is also reproduced. Even though our measures are not directly
comparable to those of the BIS because of the differences in the methods used to construct
the indices, in what follows we shall compare the various measures to see to which extent
they convey diverging or compatible information. As before, we shall start with a few
statistical findings and then move to analyse the experience of a few selected countries.
The correlations between the broad DWIs and SWIs in 2003, 2004, 2005 and 2006
are, respectively, 0.68, 0.47, 0.25, and 0.05. These statistics convey the impression that
the movements of SWIs and DWIs are not correlated over the medium term. However,24Both EERs are computed over the period 2002-2006.
25
if we focus on the narrow indices, the correlation between DWIs and SWIs remains in
all years high and close to 0.75.25 Broad and narrow indices vary in the same direction
(with respect to 2002) in 80-85% of the countries in each year. As in the 80s, therefore,
the SWIs and DWIs of the largest trading countries move in the same direction, whereas
those of the remaining countries tend to diverge. Notably, this is particularly true for the
SWIs.26 Broad and narrow DWIs and SWIs are positively correlated with the TWI of
the BIS. The correlation does decline from about 0.8 in 2003 to circa 0.6 in 2006, but it
remains substantial. The pairwise comparison of the direction of change of the narrow
indices (with respect to 2002) reveals that in 80% of the cases TWI changes have the
same sign as, respectively, those of DWIs and SWIs. The three indices changein the same
direction in 60% of the countries in 2003, 70% in 2004 and 2005, and 80% in 2006. These
statistical findings suggest that our indices are not at odds with traditional trade weighted
EERs and allow to draw additional information. For instance, they reveal that from 2002
to 2006 the exchange rates tended to move not so as to close bilateral imbalances, but
rather the overall imbalances of the single countries.
It should be noted that this conclusion bears some implications for the issue we ad-
dressed in Section 3 of the paper. The very fact that bilateral exchange rates do not change
so as to close the bilateral imbalances means that the uncoordinated exchange rate move-
ments observed in recent years cannot be presumed to have worked for the simultaneous
adjustment of the imbalances of all countries.
Admittedly, as can be seen in Table 7, the patterns of DWIs and SWIs, on the one
hand, and the TWIs, on the other, sensibly diverge for three countries: Argentina, Japan
and Singapore. In the case of Japan, this is particularly significant for the DWI measures
and probably due to the limited number of creditors the country has. In the case Argentina
and Singapore, instead, no simple explanation can account for the divergence. However, we
argue, this might not be a real problem. Our indices, in fact, mirror the EERs calculated
by the central banks of those countries, i.e. the Multilateral Real Exchange Rate Index
calculated by the Central Bank of Argentina and the NEER of the Singaporean dollar
elaborated by the Monetary Authority of Singapore. This result is encouraging given that
the MAS monetary policy is an exchange rate-based policy, that is a managed float against
a basket of foreign currencies.
As over the period 1985-1987, also in the 2000s we find no statistically significant
association in the direction of change of the SWIs and DWIs, on the one hand, and, the
overall trade balances, on the other hand. The plausible reasons why this might be the
case have been discussed in the previous section.
We move now to consider the evolution of the indices for a few currencies and we plot25In addition, the correlation of the broad indices of only the 49 countries entering the BIS sample is
high and close to 0.7026The correlation between broad and narrow SWIs falls over time (from 0.77 to 0.54), whereas it remains
almost constant and close to 1 (i.e. 0.97) in the case of broad and narrow DWIs.
26
the DWIs and SWIs for China and the G7 countries in Figure 7. The US dollar, around
which any international adjustment process must revolve, did depreciate against foreign
currencies in the period 2002-2006. The depreciation was larger towards the currencies
of the debtors, rather than the creditors of the US. This finding, which maybe due to
the very limited appreciation of the Chinese renmimbi over this time period, confirms
that the depreciation of the dollar was not mainly directed towards the countries against
which the US was running its largest deficits. Thus, it is not a case that, notwithstanding
the overall depreciation of the dollar on a trade-weighted basis, neither the US gross
bilateral imbalances nor its overall deficit were reduced in the time span 2002-2005. The
appreciation of the euro and the Canadian dollar against the US dollar was not sufficiently
ample to outweigh the movements of the currencies of China, Hong Kong, Japan, Mexico
and Saudi Arabia.27
The Chinese renmimbi depreciated against both creditors and debtors, yet more largely
against the former. This finding goes along with the limited depreciation of the US dollar
against its creditors and shows that the Chinese authorities effectively prevented their
currency from gaining value against the dollar. According to our findings, the Swiss
franc appreciated against the currencies of the debtors and depreciated against those
of the creditors, in a way consistent with the reduction of both positive and negative
imbalances. This finding sheds light on why the Swiss overall surplus fell even though its
TWI depreciated over time. The UK pound sterling remained almost constant against the
creditors of the UK and appreciated against its debtors. It could be argued that this has
contributed to the enlargement of the net overall deficit of the country.
The DWIs and SWIs of France, Germany, Ireland, Italy and Spain went in the same
direction, most likely because of the appreciation of the euro against several non-European
currencies. By the same token, the patterns of the DWIs and the SWIs for these countries
mirror those of the TWIs. With respect to TWIs, our indices allow detecting a relatively
larger appreciation of the Italian EERs against the debtors of Italy than its creditors; this
is consistent with the overall net surplus that the country was running in 2002.
As in the case of Italy, the Canadian dollar, the Korean won, the New Zealand dollar
and the Swedish krone appreciated more against the debtors than the creditors of their
countries. Notably, notwithstanding the common appreciation of their currencies, Canada,
Sweden, Korea and Germany did not reduce their net surpluses by 2005, while Italy and
New Zealand did. This finding explains why, as we discussed, there seems not to be
any significant association between the variations in the exchange rates and the trade
imbalances in the 2000s.27This, in a way, corroborates the observation that the dollar has remained considerably overvalued on a
trade-weighted exchange rate basis also because the pattern of its devaluation has so far been inappropriate.
27
4.4 EERs: conclusions and implications
The measures we propose here are meant to help interpreting the evolution of the exchange
rates while taking trade imbalances into account. As said, they are not meant to predict
the prospective exchange rate adjustments that one would need to close bilateral and
overall imbalances. In fact, the descriptive analysis reported above indicates that there
is not a significant association between changes in the indices and in the trade positions
of the countries. This is not surprising. Exchange rate movements are not the only (and
probably not even the main) determinants of trade flows: international relative prices,
domestic public expenditures and, as many argue, transnational capital flows play a role
in the determination of trade imbalances as much as important as exchange rates. The
adoption of such measures in a multivariate study will certainly be the object of future
analysis. However, our indices do not aspire to represent a summary of all bilateral
exchange rates: given that we weight the bilateral rates by the bilateral imbalances, our
indices do not consider the currencies of the countries with balanced trade relationships.
Accordingly, the baskets of currencies on which the indices are calculated can be sometimes
broader and sometimes narrower than the basket used by the BIS for the TWIs.
This notwithstanding, we believe that our results improve the understanding of the
movements of exchange rates in a context of numerous bilateral trade imbalances. At
the general level, for instance, we show that i) traditional trade-weighted measures, by
not taking into account the trade balance position of the various trading partners, are of
limited help in interpreting exchange rate dynamics, and that ii) the currencies of most
countries tend to appreciate (or depreciate) against the majority of the trading partners,
independently from these latter being creditors or debtors.
This intriguing result can be interpreted in two contrasting ways. It could be argued,
on the one hand, that it is good that exchange rates move so as to close the overall net
trade imbalances, not the bilateral ones. In such a case, the currency of a country with an
overall deficit will depreciate against the currencies of all partners so as to boost surpluses
and reduce deficits at the very same time. On the other hand, it could be argued that this
solution is not compatible with a coordinated adjustment at a multilateral level in which
all countries run acceptable trade balances and enjoy sustainable bilateral exchange rates.
For instance, think of a country A which runs an overall trade deficit. The enlargement
of country A surpluses against its debtors B and C would entail the worsening of their
deficits and the adjustment of the imbalances of countries B and C would be factually
prevented by that of country A.
5 Closing Remarks
The analysis carried out in Sections 3 and 4 sheds some new light on the feasibility of a
new Plaza agreement. Our results suggest that uncoordinated adjustments may fail to
28
achieve adequately ample and fast exchange rate movements so as to tackle all bilateral
imbalances at the same time and in a mutually consistent way. In addition, given that
several macroeconomic determinants affect trade balances, exchange rate adjustments can
hardly work if other adequate economic policies are not jointly put in place by countries
equally committed to heal global imbalances. From this one could conclude, as the advo-
cates of the new Plaza do, that only a strong form of policy coordination has chances to
produce a balanced adjustment. However, network analysis indicates that, to be effective,
an agreement need encompass a very large number of countries and take into account the
whole web of bilateral positions. Such a kind of coordinated efforts is hardly conceivable
in the currently fragmented political environment.
Our findings, thus, strengthen an apparent paradox inherent in any plan aiming to
close global imbalances: the more complicated and far reaching the coordination plan is,
the more necessary it becomes to ensure that adjustment occurs in a smooth and mutually
consistent fashion.
Acknowledgments
The authors blame each other for any remaining mistakes. They nevertheless agree on the
need to thank Giorgio Fagiolo for sharing the codes used for network analysis, and partic-
ipants to the “Workshop International trade: a global perspective for the 21st century”
at Staffordshire University for insightful comments.
29
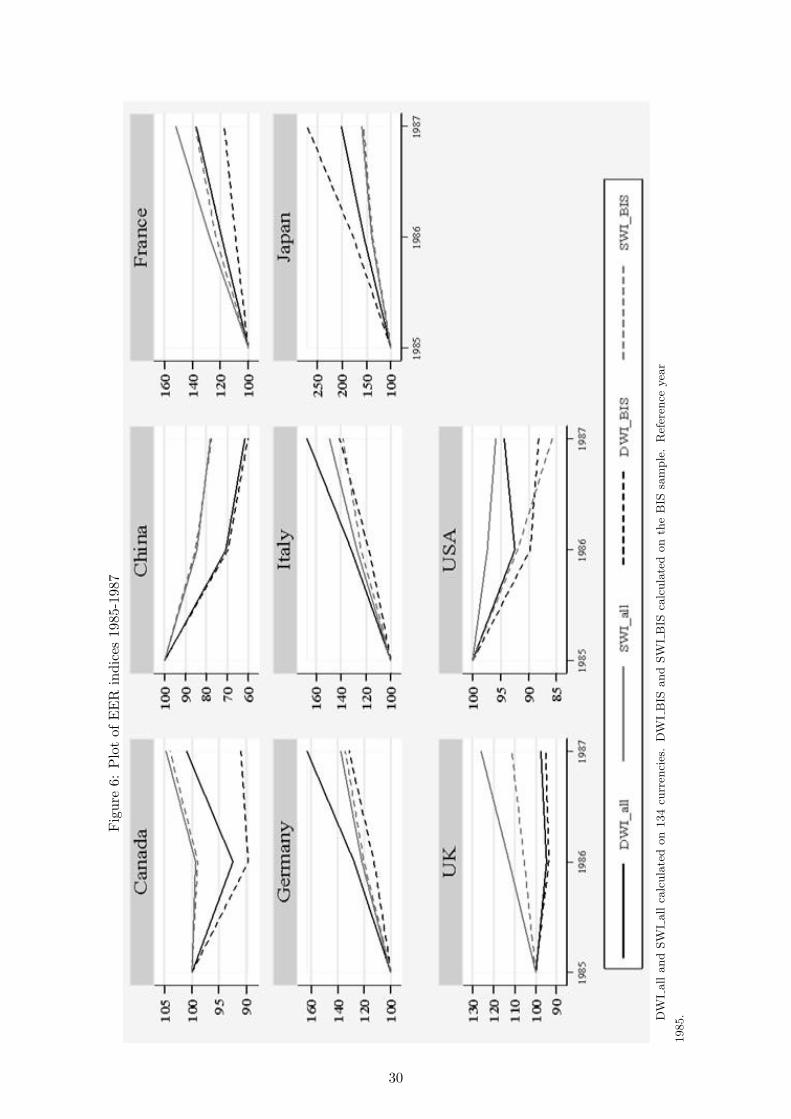
Fig
ure
6:P
lot
ofE
ER
indi
ces
1985
-198
7
DW
Iall
and
SW
Iall
calc
ula
ted
on
134
curr
enci
es.
DW
IB
ISand
SW
IB
ISca
lcula
ted
on
the
BIS
sam
ple
.R
efer
ence
yea
r
1985.
30
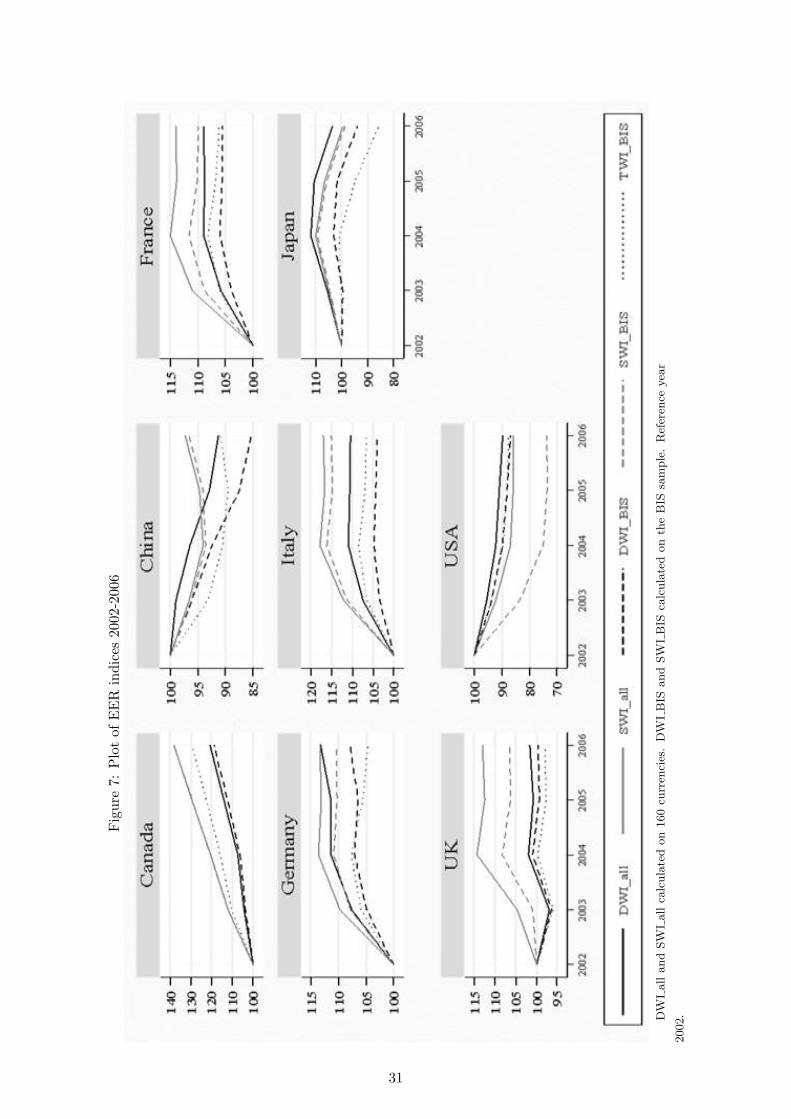
Fig
ure
7:P
lot
ofE
ER
indi
ces
2002
-200
6
DW
Iall
and
SW
Iall
calc
ula
ted
on
160
curr
enci
es.
DW
IB
ISand
SW
IB
ISca
lcula
ted
on
the
BIS
sam
ple
.R
efer
ence
yea
r
2002.
31
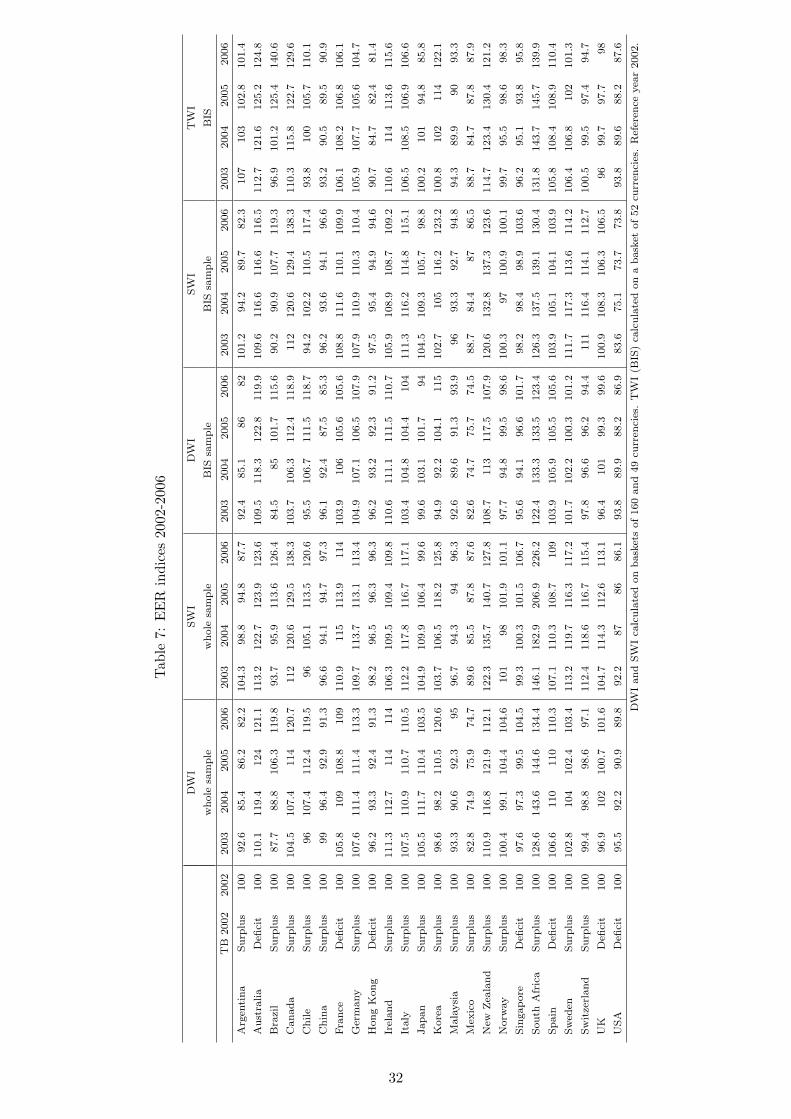
Tab
le7:
EE
Rin
dice
s20
02-2
006
DW
IS
WI
DW
IS
WI
TW
I
wh
ole
sam
ple
wh
ole
sam
ple
BIS
sam
ple
BIS
sam
ple
BIS
TB
2002
2002
2003
2004
2005
2006
2003
2004
2005
2006
2003
2004
2005
2006
2003
2004
2005
2006
2003
2004
2005
2006
Arg
enti
na
Su
rplu
s100
92.6
85.4
86.2
82.2
104.3
98.8
94.8
87.7
92.4
85.1
86
82
101.2
94.2
89.7
82.3
107
103
102.8
101.4
Au
stra
lia
Defi
cit
100
110.1
119.4
124
121.1
113.2
122.7
123.9
123.6
109.5
118.3
122.8
119.9
109.6
116.6
116.6
116.5
112.7
121.6
125.2
124.8
Bra
zil
Su
rplu
s100
87.7
88.8
106.3
119.8
93.7
95.9
113.6
126.4
84.5
85
101.7
115.6
90.2
90.9
107.7
119.3
96.9
101.2
125.4
140.6
Can
ad
aS
urp
lus
100
104.5
107.4
114
120.7
112
120.6
129.5
138.3
103.7
106.3
112.4
118.9
112
120.6
129.4
138.3
110.3
115.8
122.7
129.6
Ch
ile
Su
rplu
s100
96
107.4
112.4
119.5
96
105.1
113.5
120.6
95.5
106.7
111.5
118.7
94.2
102.2
110.5
117.4
93.8
100
105.7
110.1
Ch
ina
Su
rplu
s100
99
96.4
92.9
91.3
96.6
94.1
94.7
97.3
96.1
92.4
87.5
85.3
96.2
93.6
94.1
96.6
93.2
90.5
89.5
90.9
Fra
nce
Defi
cit
100
105.8
109
108.8
109
110.9
115
113.9
114
103.9
106
105.6
105.6
108.8
111.6
110.1
109.9
106.1
108.2
106.8
106.1
Ger
many
Su
rplu
s100
107.6
111.4
111.4
113.3
109.7
113.7
113.1
113.4
104.9
107.1
106.5
107.9
107.9
110.9
110.3
110.4
105.9
107.7
105.6
104.7
Hon
gK
on
gD
efici
t100
96.2
93.3
92.4
91.3
98.2
96.5
96.3
96.3
96.2
93.2
92.3
91.2
97.5
95.4
94.9
94.6
90.7
84.7
82.4
81.4
Irel
an
dS
urp
lus
100
111.3
112.7
114
114
106.3
109.5
109.4
109.8
110.6
111.1
111.5
110.7
105.9
108.9
108.7
109.2
110.6
114
113.6
115.6
Italy
Su
rplu
s100
107.5
110.9
110.7
110.5
112.2
117.8
116.7
117.1
103.4
104.8
104.4
104
111.3
116.2
114.8
115.1
106.5
108.5
106.9
106.6
Jap
an
Su
rplu
s100
105.5
111.7
110.4
103.5
104.9
109.9
106.4
99.6
99.6
103.1
101.7
94
104.5
109.3
105.7
98.8
100.2
101
94.8
85.8
Kore
aS
urp
lus
100
98.6
98.2
110.5
120.6
103.7
106.5
118.2
125.8
94.9
92.2
104.1
115
102.7
105
116.2
123.2
100.8
102
114
122.1
Mala
ysi
aS
urp
lus
100
93.3
90.6
92.3
95
96.7
94.3
94
96.3
92.6
89.6
91.3
93.9
96
93.3
92.7
94.8
94.3
89.9
90
93.3
Mex
ico
Su
rplu
s100
82.8
74.9
75.9
74.7
89.6
85.5
87.8
87.6
82.6
74.7
75.7
74.5
88.7
84.4
87
86.5
88.7
84.7
87.8
87.9
New
Zea
lan
dS
urp
lus
100
110.9
116.8
121.9
112.1
122.3
135.7
140.7
127.8
108.7
113
117.5
107.9
120.6
132.8
137.3
123.6
114.7
123.4
130.4
121.2
Norw
ay
Su
rplu
s100
100.4
99.1
104.4
104.6
101
98
101.9
101.1
97.7
94.8
99.5
98.6
100.3
97
100.9
100.1
99.7
95.5
98.6
98.3
Sin
gap
ore
Defi
cit
100
97.6
97.3
99.5
104.5
99.3
100.3
101.5
106.7
95.6
94.1
96.6
101.7
98.2
98.4
98.9
103.6
96.2
95.1
93.8
95.8
Sou
thA
fric
aS
urp
lus
100
128.6
143.6
144.6
134.4
146.1
182.9
206.9
226.2
122.4
133.3
133.5
123.4
126.3
137.5
139.1
130.4
131.8
143.7
145.7
139.9
Sp
ain
Defi
cit
100
106.6
110
110
110.3
107.1
110.3
108.7
109
103.9
105.9
105.5
105.6
103.9
105.1
104.1
103.9
105.8
108.4
108.9
110.4
Sw
eden
Su
rplu
s100
102.8
104
102.4
103.4
113.2
119.7
116.3
117.2
101.7
102.2
100.3
101.2
111.7
117.3
113.6
114.2
106.4
106.8
102
101.3
Sw
itze
rlan
dS
urp
lus
100
99.4
98.8
98.6
97.1
112.4
118.6
116.7
115.4
97.8
96.6
96.2
94.4
111
116.4
114.1
112.7
100.5
99.5
97.4
94.7
UK
Defi
cit
100
96.9
102
100.7
101.6
104.7
114.3
112.6
113.1
96.4
101
99.3
99.6
100.9
108.3
106.3
106.5
96
99.7
97.7
98
US
AD
efici
t100
95.5
92.2
90.9
89.8
92.2
87
86
86.1
93.8
89.9
88.2
86.9
83.6
75.1
73.7
73.8
93.8
89.6
88.2
87.6
DW
Ian
dS
WI
calc
ula
ted
on
bask
ets
of
160
an
d49
curr
enci
es.
TW
I(B
IS)
calc
ula
ted
on
ab
ask
etof
52
curr
enci
es.
Ref
eren
ceyea
r2002.
32
References
Armington, P. (1969), ‘A theory of demand for products distinguished by place of produc-
tion’, IMF Staff Papers 16, 159–78.
Artus, J. and Rhomberg, R. (1973), ‘A multilateral exchange rate model’, IMF Staff
Papers 20, 591–611.
Battiston, S., Delli Gatti, D., Greenwald, B. and Stiglitz, J. (2007), ‘Credit chains and
bankruptcy propagation in production networks’, Journal of Economic Dynamics and
Control 31(6), 2061–84.
Bergsten, F. C. (2008), ‘A call for an Asian plaza’, The International Economy.
Black, S. (1976), ‘Multilateral and bilateral measures of effective exchange rates in a world
model of traded goods’, Journal of Political Economy June, 615–21.
Breiger, R. (1981), Structure of economic interdependence among nations, in P. M. Blau
and R. K. Merton, eds, ‘Continuities in structural inquiry’, Sage, Newbury Park, CA,
pp. 353–80.
Cline, W. (2005a), The case for a new Plaza agreement, Policy Briefs in International
Economics PB05-4, Institute for International Economics., Washington.
Cline, W. (2005b), The United States as a Debtor Nation, Institute for International Eco-
nomics and Center for Global Development, Washington.
Cohen, B. (2008), ‘The international monetary system: diffusion and ambiguity’, Inter-
national Affairs 84(3), 455–70.
De Benedictis, L. and Tajoli, L. (2008), The world trade network, paper presented at the
10th ETSG Conference, Warsaw, Sept. 2008.
Erlandsson, M. and Markowski, A. (2006), The effective exchange rate index kix - theory
and practice, Working paper 95, The National Institute of Economic Research.
Fagiolo, G., Reyes, J. and Schiavo, S. (2007), The evolution of the world trade web,
Working Paper 2007/17, LEM.
Fagiolo, G., Schiavo, S. and Reyes, J. (2008), ‘On the topological properties of the world
trade web: A weighted network analysis’, Physica A.
Fracasso, A. (2007), Taking stock: global imbalances. where do we stand and where are
we aiming to?, Department of Economics Working Papers 0730, University of Trento.
Garlaschelli, D. and Loffredo, M. (2004), ‘Fitness-dependent topological properties of the
world trade web’, Physical Review Letters 93, 188701.
Goyal, S. and Van der Leij, M. (2006), Strong ties in a small world, Discussion Papers
06-008/1, Tinbergen Institute.
Granovetter, M. (1974), Getting a Job: A Study of Contracts and Careers, Cambridge,
MA, Harvard University Press.
Hidalgo, C., Klinger, B., Barabasi, A. and Hausmann, R. (2007), ‘The product space
conditions and the development of nations’, Science 317(5837), 482–7.
33
Hooper, P. and Morton, J. (1978), ‘Summary measures of the dollar’s foreign exchange
value’, Federal Reserve Bulletin October, 783–89.
Kali, R. and Reyes, J. (2007), ‘The architecture of globalization: A network approach to
international economic integration’, Journal of International Business Studies 38, 595–
620.
Kali, R. and Reyes, J. (2008), ‘Financial contagion on the international trade network’,
Economic Inquiry p. forthcoming. Unpublished Manuscript.
Kim, S. and Shin, E.-H. (2002), ‘A longitudinal analysis of globalization and regionaliza-
tion in international trade: A social network approach’, Social Forces 81, 445–71.
Klau, M. and Fung, S. (2006), ‘The new bis effective exchange rate indices’, BIS Quarterly
Review March, 51–65.
MacDonald, R. (2007), Exchange rate economics: theories and evidence, Routledge.
Makin, T. and Robson, A. (1999), ‘Comparing capital- and trade-weighted measures of
australia’s effective exchange rate’, Pacific Economic Review 4(2), 203–14.
McKinnon, R. and Schnabl, G. (2006), ‘Devaluing the dollar: A critical analysis of William
Cline’s case for a new Plaza agreement’, Journal of Policy Modeling 28, 683–94.
Milgram, S. (1967), ‘The small world problem’, Psychology Today 2, 60–67.
Nemeth, R. and Smith, D. (1985), ‘International trade and world-system structure: A
multiple network analysis’, Review: A Journal of the Fernand Braudel Center 8(4), 517–
60.
Obstfeld, M. and Rogoff, K. (2007), The unsustainable US current account position revis-
ited, in R. Clarida, ed., ‘G7 Current Account Imbalances: Sustainability and Adjust-
ment’, University of Chicago Press, Chicago.
Rogoff, K. (2006), ‘Global imbalances and exchange rate adjustment’, Journal of Policy
Modeling 28, 695–99.
Serrano, A. and Boguna, M. (2003), ‘Topology of the world trade web’, Physical Review
E 68, 015101(R).
Serrano, A., Boguna, M. and Vespignani, A. (2007), ‘Patterns of dominant flows in the
world trade web’, Journal of Economic Interaction and Coordination 2, 111–124.
Smith, D. and White, D. (1992), ‘Structure and dynamics of the global economy: Network
analysis of international trade, 1965-1980’, Social Forces 70, 857–93.
Snyder, D. and Kick, E. (1979), ‘Structural position in the world system and economic
growth 1955-70: A multiple network analysis of transnational interactions’, American
Journal of Sociology 84, 1096–126.
Targetti, F. and Fracasso, A. (2008), Le Sfide della Globalizzazione, Brioschi Editore,
Milano.
Turn, P. and Van’t dack, J. (1993), Measuring international price and cost competitiveness,
Economic Papers 39, BIS, Basel.
34
Elenco dei papers del Dipartimento di Economia
2000.1 A two-sector model of the effects of wage compression on unemployment and industry distribution of employment, by Luigi Bonatti 2000.2 From Kuwait to Kosovo: What have we learned? Reflections on globalization and peace, by Roberto Tamborini 2000.3 Metodo e valutazione in economia. Dall’apriorismo a Friedman , by Matteo Motterlini 2000.4 Under tertiarisation and unemployment. by Maurizio Pugno 2001.1 Growth and Monetary Rules in a Model with Competitive Labor Markets, by Luigi Bonatti. 2001.2 Profit Versus Non-Profit Firms in the Service Sector: an Analysis of the Employment and Welfare Implications, by Luigi Bonatti, Carlo Borzaga and Luigi Mittone. 2001.3 Statistical Economic Approach to Mixed Stock-Flows Dynamic Models in Macroeconomics, by Bernardo Maggi and Giuseppe Espa. 2001.4 The monetary transmission mechanism in Italy: The credit channel and a missing ring, by Riccardo Fiorentini and Roberto Tamborini. 2001.5 Vat evasion: an experimental approach, by Luigi Mittone 2001.6 Decomposability and Modularity of Economic Interactions, by Luigi Marengo, Corrado Pasquali and Marco Valente. 2001.7 Unbalanced Growth and Women’s Homework, by Maurizio Pugno 2002.1 The Underground Economy and the Underdevelopment Trap, by Maria Rosaria Carillo and Maurizio Pugno. 2002.2 Interregional Income Redistribution and Convergence in a Model with Perfect Capital Mobility and Unionized Labor Markets, by Luigi Bonatti. 2002.3 Firms’ bankruptcy and turnover in a macroeconomy, by Marco Bee, Giuseppe Espa and Roberto Tamborini. 2002.4 One “monetary giant” with many “fiscal dwarfs”: the efficiency of macroeconomic stabilization policies in the European Monetary Union, by Roberto Tamborini. 2002.5 The Boom that never was? Latin American Loans in London 1822-1825, by Giorgio Fodor.
2002.6 L’economia senza banditore di Axel Leijonhufvud: le ‘forze oscure del tempo e dell’ignoranza’ e la complessità del coordinamento, by Elisabetta De Antoni.
2002.7 Why is Trade between the European Union and the Transition Economies Vertical?, by Hubert Gabrisch and Maria Luigia Segnana.
2003.1 The service paradox and endogenous economic gorwth, by Maurizio Pugno. 2003.2 Mappe di probabilità di sito archeologico: un passo avanti, di Giuseppe Espa, Roberto Benedetti, Anna De Meo e Salvatore Espa. (Probability maps of archaeological site location: one step beyond, by Giuseppe Espa, Roberto Benedetti, Anna De Meo and Salvatore Espa). 2003.3 The Long Swings in Economic Understianding, by Axel Leijonhufvud. 2003.4 Dinamica strutturale e occupazione nei servizi, di Giulia Felice. 2003.5 The Desirable Organizational Structure for Evolutionary Firms in Static Landscapes, by Nicolás Garrido. 2003.6 The Financial Markets and Wealth Effects on Consumption An Experimental Analysis, by Matteo Ploner. 2003.7 Essays on Computable Economics, Methodology and the Philosophy of Science, by Kumaraswamy Velupillai. 2003.8 Economics and the Complexity Vision: Chimerical Partners or Elysian Adventurers?, by Kumaraswamy Velupillai. 2003.9 Contratto d’area cooperativo contro il rischio sistemico di produzione in agricoltura, di Luciano Pilati e Vasco Boatto. 2003.10 Il contratto della docenza universitaria. Un problema multi-tasking, di Roberto Tamborini. 2004.1 Razionalità e motivazioni affettive: nuove idee dalla neurobiologia e psichiatria per la teoria economica? di Maurizio Pugno. (Rationality and affective motivations: new ideas from neurobiology and psychiatry for economic theory? by Maurizio Pugno. 2004.2 The economic consequences of Mr. G. W. Bush’s foreign policy. Can th US afford it? by Roberto Tamborini 2004.3 Fighting Poverty as a Worldwide Goal by Rubens Ricupero 2004.4 Commodity Prices and Debt Sustainability by Christopher L. Gilbert and Alexandra Tabova
2004.5 A Primer on the Tools and Concepts of Computable Economics by K. Vela Velupillai 2004.6 The Unreasonable Ineffectiveness of Mathematics in Economics by Vela K. Velupillai 2004.7 Hicksian Visions and Vignettes on (Non-Linear) Trade Cycle Theories by Vela K. Velupillai 2004.8 Trade, inequality and pro-poor growth: Two perspectives, one message? By Gabriella Berloffa and Maria Luigia Segnana 2004.9 Worker involvement in entrepreneurial nonprofit organizations. Toward a new assessment of workers? Perceived satisfaction and fairness by Carlo Borzaga and Ermanno Tortia. 2004.10 A Social Contract Account for CSR as Extended Model of Corporate Governance (Part I): Rational Bargaining and Justification by Lorenzo Sacconi 2004.11 A Social Contract Account for CSR as Extended Model of Corporate Governance (Part II): Compliance, Reputation and Reciprocity by Lorenzo Sacconi 2004.12 A Fuzzy Logic and Default Reasoning Model of Social Norm and Equilibrium Selection in Games under Unforeseen Contingencies by Lorenzo Sacconi and Stefano Moretti 2004.13 The Constitution of the Not-For-Profit Organisation: Reciprocal Conformity to Morality by Gianluca Grimalda and Lorenzo Sacconi 2005.1 The happiness paradox: a formal explanation from psycho-economics by Maurizio Pugno 2005.2 Euro Bonds: in Search of Financial Spillovers by Stefano Schiavo 2005.3 On Maximum Likelihood Estimation of Operational Loss Distributions by Marco Bee 2005.4 An enclave-led model growth: the structural problem of informality persistence in Latin America by Mario Cimoli, Annalisa Primi and Maurizio Pugno 2005.5 A tree-based approach to forming strata in multipurpose business surveys, Roberto Benedetti, Giuseppe Espa and Giovanni Lafratta. 2005.6 Price Discovery in the Aluminium Market by Isabel Figuerola-Ferretti and Christopher L. Gilbert. 2005.7 How is Futures Trading Affected by the Move to a Computerized Trading System? Lessons from the LIFFE FTSE 100 Contract by Christopher L. Gilbert and Herbert A. Rijken.
2005.8 Can We Link Concessional Debt Service to Commodity Prices? By Christopher L. Gilbert and Alexandra Tabova 2005.9 On the feasibility and desirability of GDP-indexed concessional lending by Alexandra Tabova. 2005.10 Un modello finanziario di breve periodo per il settore statale italiano: l’analisi relativa al contesto pre-unione monetaria by Bernardo Maggi e Giuseppe Espa. 2005.11 Why does money matter? A structural analysis of monetary policy, credit and aggregate supply effects in Italy, Giuliana Passamani and Roberto Tamborini. 2005.12 Conformity and Reciprocity in the “Exclusion Game”: an Experimental Investigation by Lorenzo Sacconi and Marco Faillo. 2005.13 The Foundations of Computable General Equilibrium Theory, by K. Vela Velupillai. 2005.14 The Impossibility of an Effective Theory of Policy in a Complex Economy, by K. Vela Velupillai. 2005.15 Morishima’s Nonlinear Model of the Cycle: Simplifications and Generalizations, by K. Vela Velupillai. 2005.16 Using and Producing Ideas in Computable Endogenous Growth, by K. Vela Velupillai. 2005.17 From Planning to Mature: on the Determinants of Open Source Take Off by Stefano Comino, Fabio M. Manenti and Maria Laura Parisi. 2005.18 Capabilities, the self, and well-being: a research in psycho-economics, by Maurizio Pugno. 2005.19 Fiscal and monetary policy, unfortunate events, and the SGP arithmetics. Evidence from a growth-gap model, by Edoardo Gaffeo, Giuliana Passamani and Roberto Tamborini 2005.20 Semiparametric Evidence on the Long-Run Effects of Inflation on Growth, by Andrea Vaona and Stefano Schiavo. 2006.1 On the role of public policies supporting Free/Open Source Software. An European perspective, by Stefano Comino, Fabio M. Manenti and Alessandro Rossi. 2006.2 Back to Wicksell? In search of the foundations of practical monetary policy, by Roberto Tamborini 2006.3 The uses of the past, by Axel Leijonhufvud
2006.4 Worker Satisfaction and Perceived Fairness: Result of a Survey in Public, and Non-profit Organizations, by Ermanno Tortia 2006.5 Value Chain Analysis and Market Power in Commodity Processing with Application to the Cocoa and Coffee Sectors, by Christopher L. Gilbert 2006.6 Macroeconomic Fluctuations and the Firms’ Rate of Growth Distribution: Evidence from UK and US Quoted Companies, by Emiliano Santoro 2006.7 Heterogeneity and Learning in Inflation Expectation Formation: An Empirical Assessment, by Damjan Pfajfar and Emiliano Santoro 2006.8 Good Law & Economics needs suitable microeconomic models: the case against the application of standard agency models: the case against the application of standard agency models to the professions, by Lorenzo Sacconi 2006.9 Monetary policy through the “credit-cost channel”. Italy and Germany, by Giuliana Passamani and Roberto Tamborini
2007.1 The Asymptotic Loss Distribution in a Fat-Tailed Factor Model of Portfolio Credit Risk, by Marco Bee 2007.2 Sraffa?s Mathematical Economics – A Constructive Interpretation, by Kumaraswamy Velupillai 2007.3 Variations on the Theme of Conning in Mathematical Economics, by Kumaraswamy Velupillai 2007.4 Norm Compliance: the Contribution of Behavioral Economics Models, by Marco Faillo and Lorenzo Sacconi 2007.5 A class of spatial econometric methods in the empirical analysis of clusters of firms in the space, by Giuseppe Arbia, Giuseppe Espa e Danny Quah. 2007.6 Rescuing the LM (and the money market) in a modern Macro course, by Roberto Tamborini. 2007.7 Family, Partnerships, and Network: Reflections on the Strategies of the Salvadori Firm of Trento, by Cinzia Lorandini. 2007.8 I Verleger serici trentino-tirolesi nei rapporti tra Nord e Sud: un approccio prosopografico, by Cinzia Lorandini. 2007.9 A Framework for Cut-off Sampling in Business Survey Design, by Marco Bee, Roberto Benedetti e Giuseppe Espa 2007.10 Spatial Models for Flood Risk Assessment, by Marco Bee, Roberto Benedetti e Giuseppe Espa
2007.11 Inequality across cohorts of households:evidence from Italy, by Gabriella Berloffa and Paola Villa 2007.12 Cultural Relativism and Ideological Policy Makers in a Dynamic Model with Endogenous Preferences, by Luigi Bonatti 2007.13 Optimal Public Policy and Endogenous Preferences: an Application to an Economy with For-Profit and Non-Profit, by Luigi Bonatti 2007.14 Breaking the Stability Pact: Was it Predictable?, by Luigi Bonatti and Annalisa Cristini. 2007.15 Home Production, Labor Taxation and Trade Account, by Luigi Bonatti. 2007.16 The Interaction Between the Central Bank and a Monopoly Union Revisited: Does Greater Uncertainty about Monetary Policy Reduce Average Inflation?, by Luigi Bonatti. 2007.17 Complementary Research Strategies, First-Mover Advantage and the Inefficiency of Patents, by Luigi Bonatti. 2007.18 DualLicensing in Open Source Markets, by Stefano Comino and Fabio M. Manenti. 2007.19 Evolution of Preferences and Cross-Country Differences in Time Devoted to Market Work, by Luigi Bonatti. 2007.20 Aggregation of Regional Economic Time Series with Different Spatial Correlation Structures, by Giuseppe Arbia, Marco Bee and Giuseppe Espa.
2007.21 The Sustainable Enterprise. The multi-fiduciary perspective to the EU Sustainability Strategy, by Giuseppe Danese.
2007.22 Taming the Incomputable, Reconstructing the Nonconstructive and Deciding the Undecidable in Mathematical Economics, by K. Vela Velupillai.
2007.23 A Computable Economist’s Perspective on Computational Complexity, by K. Vela Velupillai. 2007.24 Models for Non-Exclusive Multinomial Choice, with Application to Indonesian Rural Households, by Christopher L. Gilbert and Francesca Modena. 2007.25 Have we been Mugged? Market Power in the World Coffee Industry, by Christopher L. Gilbert.
2007.26 A Stochastic Complexity Perspective of Induction in Economics and Inference in Dynamics, by K. Vela Velupillai. 2007.27 Local Credit ad Territorial Development: General Aspects and the Italian Experience, by Silvio Goglio. 2007.28 Importance Sampling for Sums of Lognormal Distributions, with Applications to Operational Risk, by Marco Bee. 2007.29 Re-reading Jevons’s Principles of Science. Induction Redux, by K. Vela Velupillai. 2007.30 Taking stock: global imbalances. Where do we stand and where are we aiming to? by Andrea Fracasso. 2007.31 Rediscovering Fiscal Policy Through Minskyan Eyes, by Philip Arestis and Elisabetta De Antoni. 2008.1 A Monte Carlo EM Algorithm for the Estimation of a Logistic Auto-logistic Model with Missing Data, by Marco Bee and Giuseppe Espa. 2008.2 Adaptive microfoundations for emergent macroeconomics, Edoardo
Gaffeo, Domenico Delli Gatti, Saul Desiderio, Mauro Gallegati. 2008.3 A look at the relationship between industrial dynamics and aggregate fluctuations, Domenico Delli Gatti, Edoardo Gaffeo, Mauro Gallegati.
2008.4 Demand Distribution Dynamics in Creative Industries: the Market for Books in Italy, Edoardo Gaffeo, Antonello E. Scorcu, Laura Vici. 2008.5 On the mean/variance relationship of the firm size distribution: evidence and some theory, Edoardo Gaffeo, Corrado di Guilmi, Mauro Gallegati, Alberto Russo. 2008.6 Uncomputability and Undecidability in Economic Theory, K. Vela Velupillai. 2008.7 The Mathematization of Macroeconomics: A Recursive Revolution, K. Vela Velupillai. 2008.8 Natural disturbances and natural hazards in mountain forests: a framework for the economic valuation, Sandra Notaro, Alessandro Paletto 2008.9 Does forest damage have an economic impact? A case study from the Italian Alps, Sandra Notaro, Alessandro Paletto, Roberta Raffaelli. 2008.10 Compliance by believing: an experimental exploration on social norms and impartial agreements, Marco Faillo, Stefania Ottone, Lorenzo Sacconi.
2008.11 You Won the Battle. What about the War? A Model of Competition between Proprietary and Open Source Software, Riccardo Leoncini, Francesco Rentocchini, Giuseppe Vittucci Marzetti. 2008.12 Minsky’s Upward Instability: the Not-Too-Keynesian Optimism of a Financial Cassandra, Elisabetta De Antoni. 2008.13 A theoretical analysis of the relationship between social capital and corporate social responsibility: concepts and definitions, Lorenzo Sacconi, Giacomo Degli Antoni. 2008.14 Conformity, Reciprocity and the Sense of Justice. How Social Contract-based Preferences and Beliefs Explain Norm Compliance: the Experimental Evidence, Lorenzo Sacconi, Marco Faillo. 2008.15 The macroeconomics of imperfect capital markets. Whither saving-investment imbalances? Roberto Tamborini 2008.16 Financial Constraints and Firm Export Behavior, Flora Bellone, Patrick Musso, Lionel Nesta and Stefano Schiavo 2008.17 Why do frms invest abroad? An analysis of the motives underlying Foreign Direct Investments Financial Constraints and Firm Export Behavior, Chiara Franco, Francesco Rentocchini and Giuseppe Vittucci Marzetti 2008.18 CSR as Contractarian Model of Multi-Stakeholder Corporate Governance and the Game-Theory of its Implementation, Lorenzo Sacconi 2008.19 Managing Agricultural Price Risk in Developing Countries, Julie Dana and Christopher L. Gilbert 2008.20 Commodity Speculation and Commodity Investment, Christopher L. Gilbert 2008.21 Inspection games with long-run inspectors, Luciano Andreozzi 2008.22 Property Rights and Investments: An Evolutionary Approach, Luciano Andreozzi 2008.23 How to Understand High Food Price, Christopher L. Gilbert 2008.24 Trade-imbalances networks and exchange rate adjustments: The paradox of a new Plaza, Andrea Fracasso and Stefano Schiavo

PUBBLICAZIONE REGISTRATA PRESSO IL TRIBUNALE DI TRENTO