Embed Size (px)
Citation preview
THE ENERGY PROGRESS REPORT
2021
TRACKING SDG7
A joint report of the custodian agencies
United NationsStatistics Division
THE ENERGY PROGRESS REPORT
© 2021 International Bank for Reconstruction and Development / The World Bank 1818 H Street NW Washington DC 20433 Telephone: 202-473 1000 Internet: www.worldbank.org
This work is a product of the sta! of the five collaborating organizations, namely The World Bank, the International Energy Agency, the International Renewable Energy Agency, the United Nations, and the World Health Organization, with external contributions. The findings, interpretations, and conclusions expressed in this work do not necessarily reflect the views of these organizations, their governing bodies, members, or the governments they represent.
The collaborating organizations do not guarantee the accuracy, completeness, or currency of the data included in this work and does not assume responsibility for any errors, omissions, or discrepancies in the information, or liability with respect to the use of or failure to use the information, methods, processes, or conclusions set forth. The boundaries, colors, denominations, and other information shown on any map in this work do not imply any judgment on the part of the custodian agencies concerning the legal status of or sovereignty over any territory or the endorsement or acceptance of such boundaries.
Nothing herein shall constitute or be construed or considered to be a limitation upon or waiver of the privileges and immunities of the collaborating organizations, all of which are specifically reserved.
Rights and Permissions
This work is available under the Creative Commons Attribution--NonCommercial 3.0 IGO license (CC BY-NC 3.0 IGO) https://creativecommons.org/licenses/by-nc/3.0/igo/. Under the Creative Commons--NonCommercial license, you are free to copy, distribute, and adapt this work, for noncommercial purposes only, under the following conditions:
Attribution—Please cite the work as follows: IEA, IRENA, UNSD, World Bank, WHO. 2021. Tracking SDG 7: The Energy Progress Report. World Bank, Washington DC. © World Bank. License: Creative Commons Attribution—NonCommercial 3.0 IGO (CC BY-NC 3.0 IGO).
Noncommercial—You may not use this work for commercial purposes.
Translations—If you create a translation of this work, please add the following disclaimer along with the attribution: This is an uno!cial translation of the work from the English language. The translation was not created by IEA, IRENA, UNSD, World Bank or WHO shall not be liable for any content or error in this translation.
Adaptations—If you create an adaptation of this work, please add the following disclaimer along with the attribution: This is an adaptation of an original work by IEA, IRENA, UNSD, World Bank and WHO. Views and opinions expressed in the adaptation are the sole responsibility of the author or authors of the adaptation and are not endorsed by IEA, IRENA, UNSD, World Bank and WHO.
Third-party content—The World Bank does not necessarily own each component of the content contained within the work. The World Bank therefore does not warrant that the use of any third party-owned individual component or part contained in the work will not infringe on the rights of those third parties. The risk of claims resulting from such infringement rests solely with you. If you wish to re-use a component of the work, it is your responsibility to determine whether permission is needed for that re-use and to obtain permission from the copyright owner. Examples of components can include, but are not limited to, chapters, tables, figures, or images.
Any queries on rights and licenses, including subsidiary rights, except as indicated below, should be addressed to World Bank Publications, The World Bank Group, 1818 H Street NW, Washington, DC 20433, USA; fax: 202-522-2625; e-mail: [email protected].
Use of the following chapters in the report other than as permitted under the CC BY-NC 3.0 IGO license requires permission from each of the relevant copyright owners other than the World Bank:
Executive Summary – © IEA, IRENA, UN, World Bank and WHO, 2021. Contact [email protected] for permission to use it.
Access to electricity – © World Bank, 2021. Contact [email protected] for permission to use it.
Access to clean fuels and technologies for cooking – © WHO, 2021. Contact [email protected] for permission to use it.
Renewable Energy – © IEA, IRENA and UN, 2021. Contact [email protected]; [email protected] and [email protected] for permission to use it.
Energy E"ciency – © IEA and UN, 2021. Contact [email protected] and [email protected] for permission to use it.
International Public Financial Flows - © IRENA, 2021. Contact [email protected] for permission to use it.
Outlook for SDG 7 – © IEA and IRENA, 2021. Contact [email protected] and [email protected] for permission to use it.
Tracking SDG7 progress across targets: indicators and data. ©IEA, IRENA, UN, World Bank and WHO. Contact [email protected] for permission to use it.
Report designed by: Duina Reyes Cover photo: © Shutterstock/Jenson/Engineers inspecting photovoltaic area
CHAPTER 3: RENEWABLE ENERGY
RENEWABLE ENERGY
CHAPTER 3
81
MAIN MESSAGES
� Global trend: Overall, renewable energy has seen unprecedented development over the past decade, with growth outpacing projections on a yearly basis. Despite great progress, however, the share of renewables in total final energy consumption (TFEC) has remained steady over the period. In 2018, the share of renewable energy sources (including biomass) in TFEC was 17.1 percent, very close to its share in the preceding year. This is due to the fact that TFEC increased at the same rate as renewable energy consumption (+2.1 percent). The share of renewable sources in TFEC, excluding traditional uses of biomass, increased by 2.5 percentage points over the past decade. The global picture points to the importance of further scaling up renewable energy while containing energy consumption through energy e"ciency and su"ciency. Across end uses, electricity continued to see the greatest increase in its share of renewables, while transport and heat saw much slower or no progress.
� Target for 2030: Ensuring access to a!ordable, reliable, sustainable, and modern energy for all implies an accelerated deployment of renewable energy sources across three main end uses: electricity, heat and transport. Thus, the main indicator used to assess progress toward Sustainable Development Goal (SDG) target 7.2—to “increase substantially the share of renewable energy in the global energy mix by 2030”—is renewable energy’s share of total final energy consumption (TFEC). While there is no quantitative milestone set for 7.2, custodian agencies of this target have indicated that current e!orts need to accelerate significantly to scale uptake in line with SDG 7.
� Electricity: Renewable electricity use grew 7 percent year-on-year in 2018, bringing the share of renewables in global electricity consumption to 25.4 percent, up from 24.7 percent in 2017. This is the highest renewable share of all end-use categories. To meet the growing global electricity demand (+4 percent in 2018), nonrenewable electricity consumption continues to grow as well (+3 percent in 2018), although at a lower growth rate than renewables. Hydropower remains by far the largest source of renewable electricity globally, followed by wind and solar PV which are recording the fastest growth rates. Together, wind and solar PV are responsible for more than half of the increase in renewable electricity consumption observed over the past 10 years.
� Heat: Renewable heat consumption increased 1.2 percent to 16.2 EJ in 2018, excluding traditional uses of biomass. It should be noted that this calculation does not account for electricity used for heating, including via heat pumps. Traditional uses of biomass in 2018 declined 2 percent globally, still accounting for 14 percent (24 EJ) of global heat consumption. Overall, as global heat demand continued to increase (+1.1 percent year-on-year) the share of modern renewables in global heat consumption remained at 9.2 percent, as two years prior and only 1 percentage point higher than a decade earlier.
� Transport: In 2018, renewable energy used in transport grew by 7 percent, the fifth largest increase on record since 1990, and the largest since 2012. This brings the total share of renewable energy to 3.4 percent, up from 3.3 percent in 2017. Biofuels, primarily crop-based ethanol and biodiesel, supplied 91 percent of renewable energy. Nevertheless, renewable electricity expansion and electric vehicle sales are leading to record increases in renewable electricity use in transport, which grew by 0.03 EJ in 2018, the largest increase in a single year.
� Regional highlights: Sub-Saharan Africa has the largest share of renewable sources in its energy supply, and traditional uses of biomass represent more than 85 percent of this. Excluding traditional uses of biomass, Latin America and the Caribbean have the largest share of modern renewable energy uses in TFEC, owing to significant hydropower generation, and to the consumption of bioenergy in industrial processes and biofuels for transport. In 2018, more than a third of the global year-on-year increase in modern renewable energy consumption took place in Eastern Asia—essentially in China—where wind and solar photovoltaic (PV) dominate the growth.
� Top 20 countries: The share of renewable energy in TFEC varies widely across countries. Between 2000 and 2018, the share of modern renewables in TFEC declined in six of the top 20 energy consumer countries, despite the expansion of modern renewable energy use in each. This was mostly due to simultaneous increases in nonrenewable energy use. In 2018, the largest progression in the share of modern renewables was observed for Spain (+1.7 percentage points), due to higher hydropower generation, followed by Indonesia (+1.4 percentage points), where a rapid uptake of bioenergy for power generation played a leading role.
82 Tracking SDG 7: The Energy Progress Report 2021
� Installed renewable electricity-generating capacity in developing countries: Beyond SDG target 7.2, this report for the first time tracks progress toward SDG indicator 7.B.1. It thus considers installed renewable electricity-generating capacity per capita in developing countries, using the most recent available data, from 2019 (see box 3.3). In 2019, developing countries had 219 watts per capita of renewable energy installed capacity. That year’s 7 percent year-on-year growth rate signals a slight slowdown from 2018, driven primarily by decreased uptake of hydropower and solar PV per capita, while wind remained stable. Although the majority of new capacity installations in 2018–19 were made in developing countries, in 2019 developed countries still had around four times more capacity per capita.
� Recent trends: Beyond the immediate impact on health, the COVID-19 pandemic has major implications for economic activity and therefore energy consumption. To slow the spread of the virus, governments across the world have imposed restrictions on most social and economic activities, curtailing transport, industrial production and services, and causing a major energy demand shock. While this demand shock resulted in declining renewable energy use for transport and heat in 2020, renewable electricity generation expanded at an estimated 7 percent year-on-year, supported by long-term contracts, low marginal costs, priority access to grids, and installation of new renewable capacity. According to early estimates, in 2020, the share of renewables in final energy consumption increased significantly for electricity and minimally for transport and heat.
CHAPTER 3 • Renewable Energy 83
ARE WE ON TRACK?
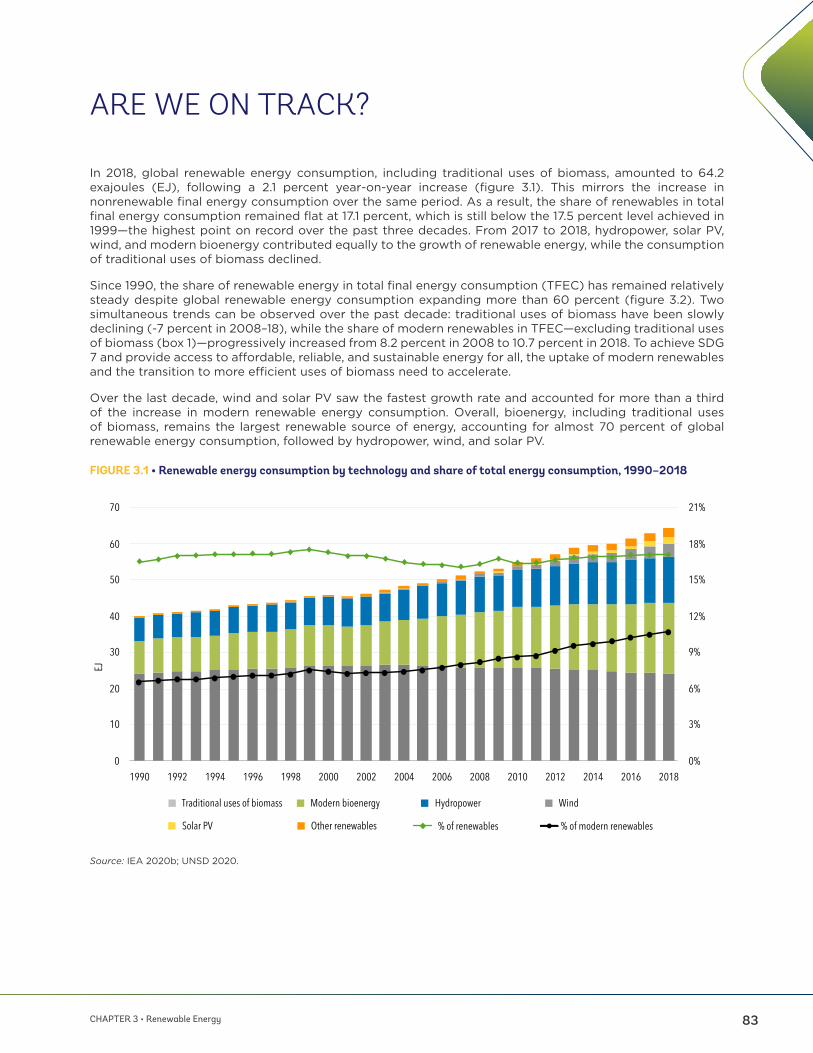
In 2018, global renewable energy consumption, including traditional uses of biomass, amounted to 64.2 exajoules (EJ), following a 2.1 percent year-on-year increase (figure 3.1). This mirrors the increase in nonrenewable final energy consumption over the same period. As a result, the share of renewables in total final energy consumption remained flat at 17.1 percent, which is still below the 17.5 percent level achieved in 1999—the highest point on record over the past three decades. From 2017 to 2018, hydropower, solar PV, wind, and modern bioenergy contributed equally to the growth of renewable energy, while the consumption of traditional uses of biomass declined.
Since 1990, the share of renewable energy in total final energy consumption (TFEC) has remained relatively steady despite global renewable energy consumption expanding more than 60 percent (figure 3.2). Two simultaneous trends can be observed over the past decade: traditional uses of biomass have been slowly declining (-7 percent in 2008–18), while the share of modern renewables in TFEC—excluding traditional uses of biomass (box 1)—progressively increased from 8.2 percent in 2008 to 10.7 percent in 2018. To achieve SDG 7 and provide access to a!ordable, reliable, and sustainable energy for all, the uptake of modern renewables and the transition to more e"cient uses of biomass need to accelerate.
Over the last decade, wind and solar PV saw the fastest growth rate and accounted for more than a third of the increase in modern renewable energy consumption. Overall, bioenergy, including traditional uses of biomass, remains the largest renewable source of energy, accounting for almost 70 percent of global renewable energy consumption, followed by hydropower, wind, and solar PV.
FIGURE 3.1 • Renewable energy consumption by technology and share of total energy consumption, 1990–2018
8.7% 10.7%
19.7%
25.4%
8.2% 9.2%
2.3% 3.1%
7.7%6.4%
15.1% 13.6%
0%
5%
10%
15%
20%
25%
30%
2010 2018 2010 2018 2010 2018 2010 2018
7RWDO�ƓQDO�HQHUJ\�FRQVXPSWLRQ Electricity Heat Transport
Modern renewables Traditional uses of biomass
0%
3%
6%
9%
12%
15%
18%
21%
0
10
20
30
40
50
60
70
1990 1992 1994 1996 1998 2000 2002 2004 2006 2008 2010 2012 2014 2016 2018
EJ
% of renewables % of modern renewables
HydropowerModern bioenergy Wind
Solar PV Other renewables
Traditional uses of biomass
Source: IEA 2020b; UNSD 2020.

84 Tracking SDG 7: The Energy Progress Report 2021
BOX 3.1 • DEFINITIONS OF TRADITIONAL USES OF BIOMASS AND MODERN RENEWABLES
Traditional uses of biomass refer to local solid biofuels (wood, charcoal, agricultural residues, and animal dung) being burned via basic techniques using, for example, traditional open cookstoves and fireplaces. Owing to their informal and non-commercial nature, it is di"cult to estimate the energy consumed by such practices, which remain widespread in households in the developing world. For purposes of this report, the phrase “traditional uses of biomass” refers to the residential consumption of primary solid biofuels and charcoal in countries outside the Organisation for Economic Co-operation and Development (OECD) excluding Eurasia. Although biomass is used with low e"ciency in OECD countries as well—for example, in fireplaces burning split logs—such use is not included in the traditional uses of biomass cited in this report.
Traditional uses of biomass tend to have very low conversion e"ciency (5–15 percent). This can result in high local demand, potentially exceeding sustainable supply, and leading to negative environmental impacts, notably deforestation. In addition, emissions of particulate matter and other air pollutants are produced. When combined with poor ventilation, such pollutants create indoor air pollution in households, which is responsible for a range of severe health conditions and a leading cause of premature death. Even though biomass as it is traditionally used is, in principle, renewable, policy attention should focus on encouraging the adoption of more e"cient renewable heating and cooking technologies (see chapter 2).
“Modern bioenergy” can be used e"ciently for electricity generation, industrial applications, cooking in e"cient wood and pellet stoves and boilers, and the production of biofuels for transport. Modern bioenergy—along with solar PV, solar thermal, geothermal, wind, hydropower and tidal energy—is one of the modern renewable sources analyzed in this report.
FIGURE 3.2 • Share of modern renewable energy and traditional uses of biomass in total final energy consumption (left) and renewable energy consumption growth by technology (right), 2010–18
HydropowerModern bioenergyWind
Solar PV Other renewables
Traditional uses of biomass
-0.6%
-0.4%
-0.2%
0.0%
0.2%
0.4%
0.6%
0%
2%
4%
6%
8%
10%
12%
2010 2011 2012 2013 2014 2015 2016 2017 2018
Change in the share of total renewable sources (right axis)Share of modern renewablesShare of traditional use of biomass
-1.0
-0.5
0.0
0.5
1.0
1.5
2.0
2010 2011 2012 2013 2014 2015 2016 2017 2018
EJ
0%
5%
10%
15%
20%
25%
30%
1990
1992
1994
1996
1998
2000
2002
2004
2006
2008
2010
2012
2014
2016
2018
EJ
Share TUoB in heatShare renewables in heat (excluding TUoB)Share renewables in transportShare renewables in electricity
0
10
20
30
40
50
60
70
1990
1992
1994
1996
1998
2000
2002
2004
2006
2008
2010
2012
2014
2016
2018
Heat - Industry Heat - Buildings & otherHeat- Traditional uses of biomass Electricity (excl. for transport)Transport
Source: IEA 2020b; UNSD 2020.
This report includes minor revisions to the data presented in last year’s edition. In particular, traditional uses of bioenergy for heat have been revised down by 0.7 EJ (-3 percent) for the year 2017, mostly due to changes in data from the Eastern Asia and South-eastern Asia regions. Modern uses of biomass have also been revised down by 0.2 EJ (-1 percent), with the largest changes in Sub-Saharan Africa, Northern America and Europe, and Western Asia and Northern Africa.
CHAPTER 3 • Renewable Energy 85
LOOKING BEYOND THE MAIN INDICATORS
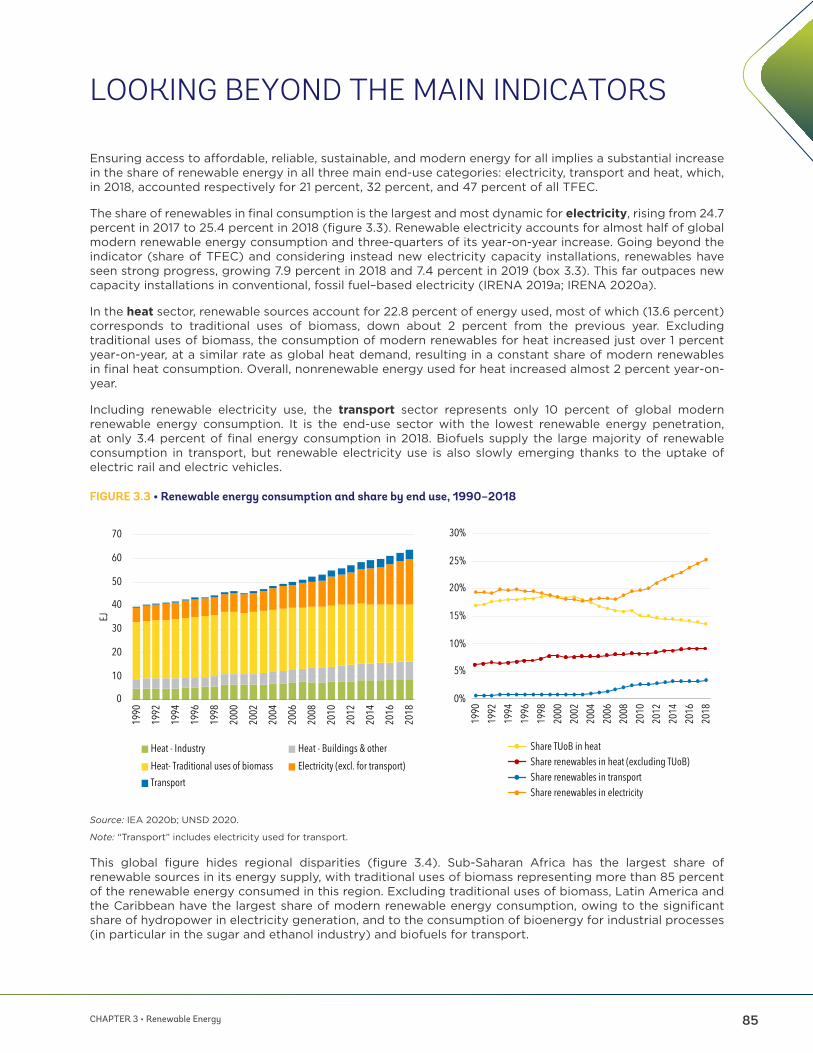
Ensuring access to a!ordable, reliable, sustainable, and modern energy for all implies a substantial increase in the share of renewable energy in all three main end-use categories: electricity, transport and heat, which, in 2018, accounted respectively for 21 percent, 32 percent, and 47 percent of all TFEC.
The share of renewables in final consumption is the largest and most dynamic for electricity, rising from 24.7 percent in 2017 to 25.4 percent in 2018 (figure 3.3). Renewable electricity accounts for almost half of global modern renewable energy consumption and three-quarters of its year-on-year increase. Going beyond the indicator (share of TFEC) and considering instead new electricity capacity installations, renewables have seen strong progress, growing 7.9 percent in 2018 and 7.4 percent in 2019 (box 3.3). This far outpaces new capacity installations in conventional, fossil fuel–based electricity (IRENA 2019a; IRENA 2020a).
In the heat sector, renewable sources account for 22.8 percent of energy used, most of which (13.6 percent) corresponds to traditional uses of biomass, down about 2 percent from the previous year. Excluding traditional uses of biomass, the consumption of modern renewables for heat increased just over 1 percent year-on-year, at a similar rate as global heat demand, resulting in a constant share of modern renewables in final heat consumption. Overall, nonrenewable energy used for heat increased almost 2 percent year-on-year.
Including renewable electricity use, the transport sector represents only 10 percent of global modern renewable energy consumption. It is the end-use sector with the lowest renewable energy penetration, at only 3.4 percent of final energy consumption in 2018. Biofuels supply the large majority of renewable consumption in transport, but renewable electricity use is also slowly emerging thanks to the uptake of electric rail and electric vehicles.
FIGURE 3.3 • Renewable energy consumption and share by end use, 1990 –2018
HydropowerModern bioenergyWind
Solar PV Other renewables
Traditional uses of biomass
-0.6%
-0.4%
-0.2%
0.0%
0.2%
0.4%
0.6%
0%
2%
4%
6%
8%
10%
12%
2010 2011 2012 2013 2014 2015 2016 2017 2018
Change in the share of total renewable sources (right axis)Share of modern renewablesShare of traditional use of biomass
-1.0
-0.5
0.0
0.5
1.0
1.5
2.0
2010 2011 2012 2013 2014 2015 2016 2017 2018
EJ
0%
5%
10%
15%
20%
25%
30%
1990
1992
1994
1996
1998
2000
2002
2004
2006
2008
2010
2012
2014
2016
2018
EJ
Share TUoB in heatShare renewables in heat (excluding TUoB)Share renewables in transportShare renewables in electricity
0
10
20
30
40
50
60
70
1990
1992
1994
1996
1998
2000
2002
2004
2006
2008
2010
2012
2014
2016
2018
Heat - Industry Heat - Buildings & otherHeat- Traditional uses of biomass Electricity (excl. for transport)Transport
Source: IEA 2020b; UNSD 2020.
Note: “Transport” includes electricity used for transport.
This global figure hides regional disparities (figure 3.4). Sub-Saharan Africa has the largest share of renewable sources in its energy supply, with traditional uses of biomass representing more than 85 percent of the renewable energy consumed in this region. Excluding traditional uses of biomass, Latin America and the Caribbean have the largest share of modern renewable energy consumption, owing to the significant share of hydropower in electricity generation, and to the consumption of bioenergy for industrial processes (in particular in the sugar and ethanol industry) and biofuels for transport.
86 Tracking SDG 7: The Energy Progress Report 2021
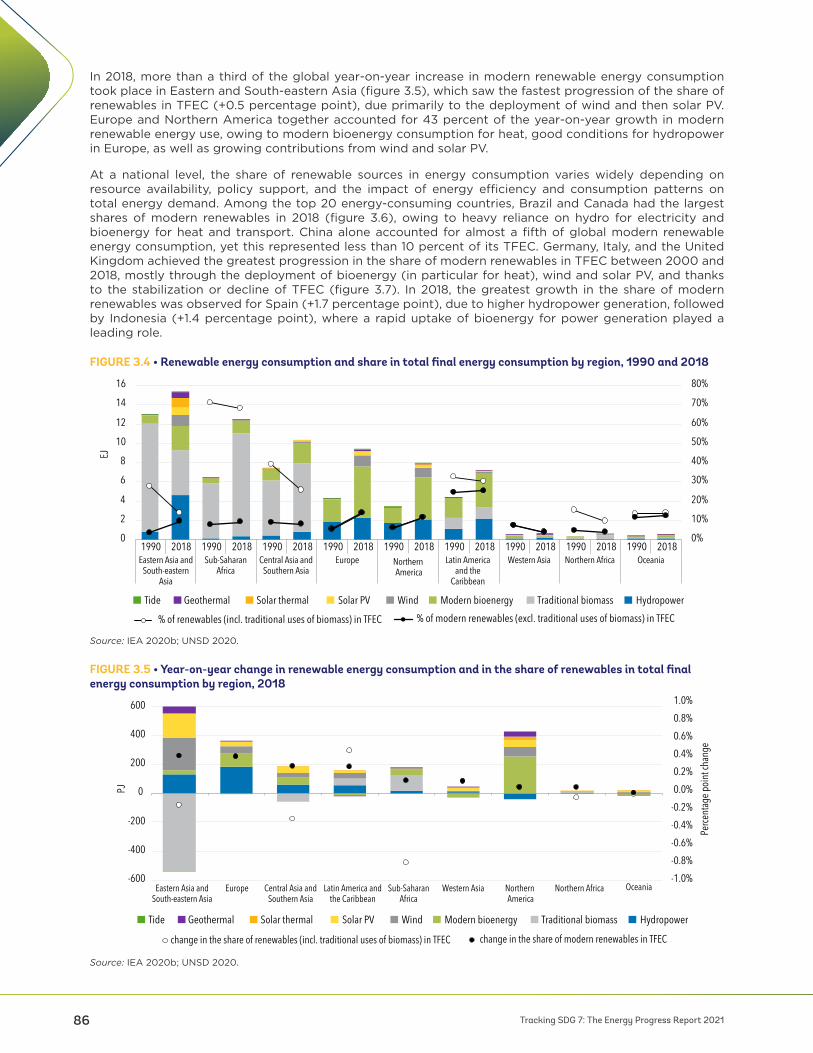
In 2018, more than a third of the global year-on-year increase in modern renewable energy consumption took place in Eastern and South-eastern Asia (figure 3.5), which saw the fastest progression of the share of renewables in TFEC (+0.5 percentage point), due primarily to the deployment of wind and then solar PV. Europe and Northern America together accounted for 43 percent of the year-on-year growth in modern renewable energy use, owing to modern bioenergy consumption for heat, good conditions for hydropower in Europe, as well as growing contributions from wind and solar PV.
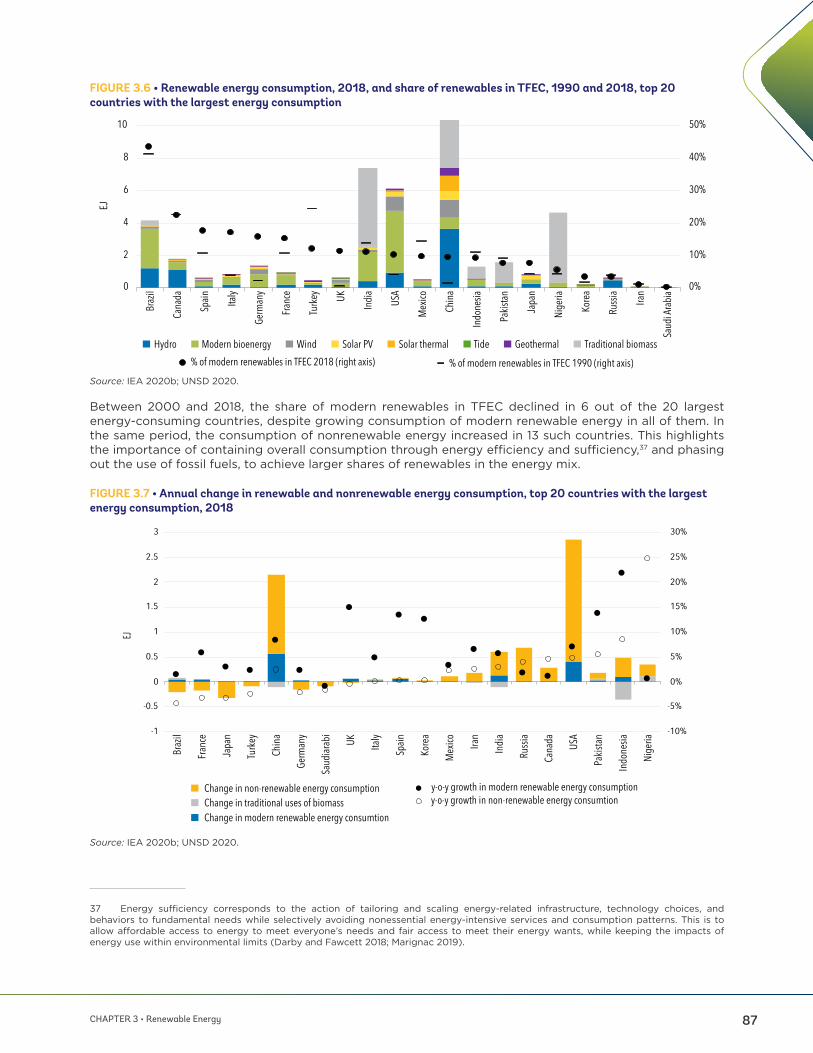
At a national level, the share of renewable sources in energy consumption varies widely depending on resource availability, policy support, and the impact of energy e"ciency and consumption patterns on total energy demand. Among the top 20 energy-consuming countries, Brazil and Canada had the largest shares of modern renewables in 2018 (figure 3.6), owing to heavy reliance on hydro for electricity and bioenergy for heat and transport. China alone accounted for almost a fifth of global modern renewable energy consumption, yet this represented less than 10 percent of its TFEC. Germany, Italy, and the United Kingdom achieved the greatest progression in the share of modern renewables in TFEC between 2000 and 2018, mostly through the deployment of bioenergy (in particular for heat), wind and solar PV, and thanks to the stabilization or decline of TFEC (figure 3.7). In 2018, the greatest growth in the share of modern renewables was observed for Spain (+1.7 percentage point), due to higher hydropower generation, followed by Indonesia (+1.4 percentage point), where a rapid uptake of bioenergy for power generation played a leading role.
FIGURE 3.4 • Renewable energy consumption and share in total final energy consumption by region, 1990 and 2018
0%
10%
20%
30%
40%
50%
60%
70%
80%
0
2
4
6
8
10
12
14
16
1990 2018 1990 2018 1990 2018 1990 2018 1990 2018 1990 2018 1990 2018 1990 2018 1990 2018Eastern Asia and
South-easternAsia
Sub-SaharanAfrica
Central Asia andSouthern Asia
Europe Northern America
Latin Americaand the
Caribbean
Western Asia Northern Africa Oceania
EJ
Tide Solar thermal Wind Traditional biomass
% of renewables (incl. traditional uses of biomass) in TFEC % of modern renewables (excl. traditional uses of biomass) in TFECGeothermal HydropowerModern bioenergySolar PV
Tide Solar thermal Wind Traditional biomassGeothermal HydropowerModern bioenergySolar PV
-1.0%-0.8%-0.6%-0.4%-0.2%0.0%0.2%0.4%0.6%0.8%1.0%
-600
-400
-200
0
200
400
600
Eastern Asia andSouth-eastern Asia
Europe Central Asia andSouthern Asia
Latin America andthe Caribbean
Sub-SaharanAfrica
Western Asia Northern America
Northern Africa Oceania
Perce
ntag
e poin
t cha
nge
PJ
change in the share of renewables (incl. traditional uses of biomass) in TFEC change in the share of modern renewables in TFEC
Source: IEA 2020b; UNSD 2020.
FIGURE 3.5 • Year-on-year change in renewable energy consumption and in the share of renewables in total final energy consumption by region, 2018
0%
10%
20%
30%
40%
50%
60%
70%
80%
0
2
4
6
8
10
12
14
16
1990 2018 1990 2018 1990 2018 1990 2018 1990 2018 1990 2018 1990 2018 1990 2018 1990 2018Eastern Asia and
South-easternAsia
Sub-SaharanAfrica
Central Asia andSouthern Asia
Europe Northern America
Latin Americaand the
Caribbean
Western Asia Northern Africa Oceania
EJ
Tide Solar thermal Wind Traditional biomass
% of renewables (incl. traditional uses of biomass) in TFEC % of modern renewables (excl. traditional uses of biomass) in TFECGeothermal HydropowerModern bioenergySolar PV
Tide Solar thermal Wind Traditional biomassGeothermal HydropowerModern bioenergySolar PV
-1.0%-0.8%-0.6%-0.4%-0.2%0.0%0.2%0.4%0.6%0.8%1.0%
-600
-400
-200
0
200
400
600
Eastern Asia andSouth-eastern Asia
Europe Central Asia andSouthern Asia
Latin America andthe Caribbean
Sub-SaharanAfrica
Western Asia Northern America
Northern Africa Oceania
Perce
ntag
e poin
t cha
nge
PJ
change in the share of renewables (incl. traditional uses of biomass) in TFEC change in the share of modern renewables in TFEC
Source: IEA 2020b; UNSD 2020.
CHAPTER 3 • Renewable Energy 87
FIGURE 3.6 • Renewable energy consumption, 2018, and share of renewables in TFEC, 1990 and 2018, top 20 countries with the largest energy consumption
0%
10%
20%
30%
40%
50%
0
2
4
6
8
10
Braz
il
Cana
da
Spain Ita
ly
Germ
any
Franc
e
Turke
y UK
India
USA
Mex
ico
China
Indon
esia
Pakis
tan
Japa
n
Nige
ria
Korea
Russi
a
Iran
Saud
i Arab
ia
EJ
% of modern renewables in TFEC 2018 (right axis) % of modern renewables in TFEC 1990 (right axis)
Solar thermal GeothermalTideHydro Modern bioenergy Wind Solar PV Traditional biomass
-10%
-5%
0%
5%
10%
15%
20%
25%
30%
-1
-0.5
0
0.5
1
1.5
2
2.5
3
Braz
il
Franc
e
Japa
n
Turke
y
China
Germ
any
Saud
iarab
i
UK Italy
Spain
Korea
Mex
ico Iran
India
Russi
a
Cana
da USA
Pakis
tan
Indon
esia
Nige
ria
EJ
Change in modern renewable energy consumtionChange in traditional uses of biomassChange in non-renewable energy consumption y-o-y growth in modern renewable energy consumption
y-o-y growth in non-renewable energy consumtion
37 Energy su"ciency corresponds to the action of tailoring and scaling energy-related infrastructure, technology choices, and behaviors to fundamental needs while selectively avoiding nonessential energy-intensive services and consumption patterns. This is to allow a!ordable access to energy to meet everyone’s needs and fair access to meet their energy wants, while keeping the impacts of energy use within environmental limits (Darby and Fawcett 2018; Marignac 2019).
Source: IEA 2020b; UNSD 2020.
Between 2000 and 2018, the share of modern renewables in TFEC declined in 6 out of the 20 largest energy-consuming countries, despite growing consumption of modern renewable energy in all of them. In the same period, the consumption of nonrenewable energy increased in 13 such countries. This highlights the importance of containing overall consumption through energy e"ciency and su"ciency,37 and phasing out the use of fossil fuels, to achieve larger shares of renewables in the energy mix.
FIGURE 3.7 • Annual change in renewable and nonrenewable energy consumption, top 20 countries with the largest energy consumption, 2018
0%
10%
20%
30%
40%
50%
0
2
4
6
8
10Br
azil
Cana
da
Spain Ita
ly
Germ
any
Franc
e
Turke
y UK
India
USA
Mex
ico
China
Indon
esia
Pakis
tan
Japa
n
Nige
ria
Korea
Russi
a
Iran
Saud
i Arab
ia
EJ
% of modern renewables in TFEC 2018 (right axis) % of modern renewables in TFEC 1990 (right axis)
Solar thermal GeothermalTideHydro Modern bioenergy Wind Solar PV Traditional biomass
-10%
-5%
0%
5%
10%
15%
20%
25%
30%
-1
-0.5
0
0.5
1
1.5
2
2.5
3
Braz
il
Franc
e
Japa
n
Turke
y
China
Germ
any
Saud
iarab
i
UK Italy
Spain
Korea
Mex
ico Iran
India
Russi
a
Cana
da USA
Pakis
tan
Indon
esia
Nige
ria
EJ
Change in modern renewable energy consumtionChange in traditional uses of biomassChange in non-renewable energy consumption y-o-y growth in modern renewable energy consumption
y-o-y growth in non-renewable energy consumtion
Source: IEA 2020b; UNSD 2020.
88 Tracking SDG 7: The Energy Progress Report 2021
BOX 3.2 • RENEWABLE ENERGY IN A PANDEMIC: HOW THE COVID-19 CRISIS IS AFFECTING RENEWABLE ENERGY DEVELOPMENT
Beyond the immediate impact on health, the COVID-19 pandemic has had major implications for economic activity and therefore energy consumption. To slow the spread of the virus, governments across the world imposed restrictions on most social and economic activities, curtailing transport, industrial production, and services, causing a major energy demand shock.
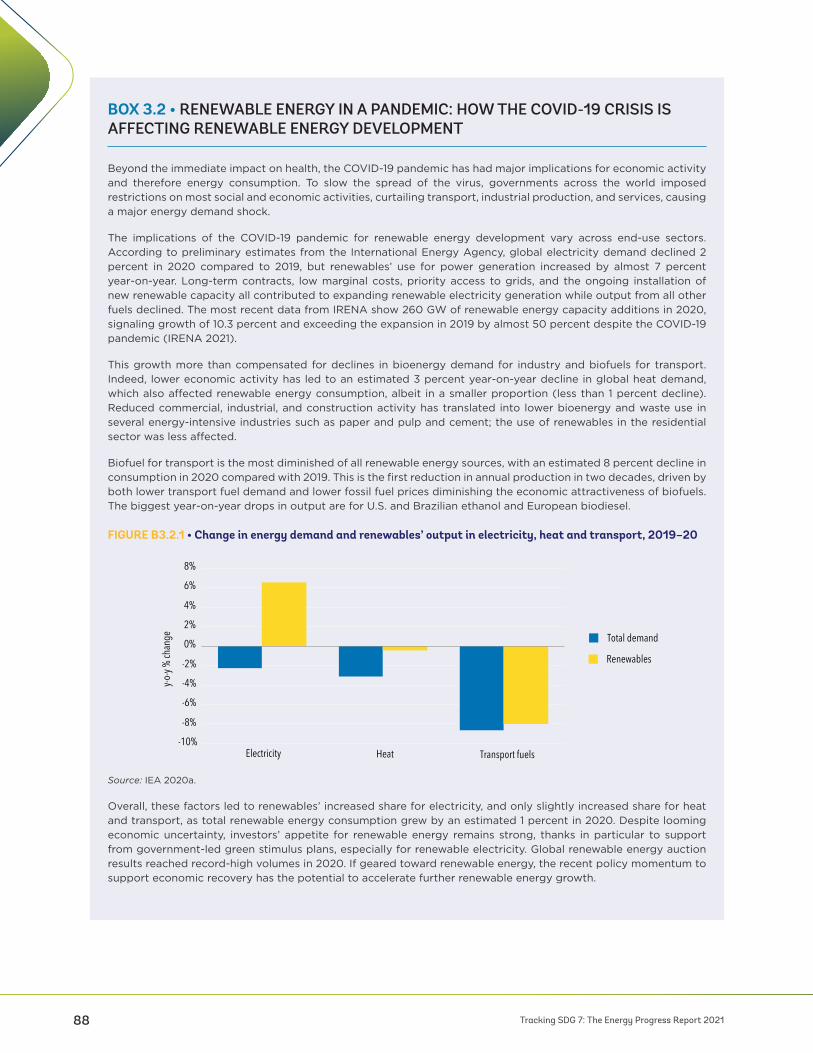
The implications of the COVID-19 pandemic for renewable energy development vary across end-use sectors. According to preliminary estimates from the International Energy Agency, global electricity demand declined 2 percent in 2020 compared to 2019, but renewables’ use for power generation increased by almost 7 percent year-on-year. Long-term contracts, low marginal costs, priority access to grids, and the ongoing installation of new renewable capacity all contributed to expanding renewable electricity generation while output from all other fuels declined. The most recent data from IRENA show 260 GW of renewable energy capacity additions in 2020, signaling growth of 10.3 percent and exceeding the expansion in 2019 by almost 50 percent despite the COVID-19 pandemic (IRENA 2021).
This growth more than compensated for declines in bioenergy demand for industry and biofuels for transport. Indeed, lower economic activity has led to an estimated 3 percent year-on-year decline in global heat demand, which also a!ected renewable energy consumption, albeit in a smaller proportion (less than 1 percent decline). Reduced commercial, industrial, and construction activity has translated into lower bioenergy and waste use in several energy-intensive industries such as paper and pulp and cement; the use of renewables in the residential sector was less a!ected.
Biofuel for transport is the most diminished of all renewable energy sources, with an estimated 8 percent decline in consumption in 2020 compared with 2019. This is the first reduction in annual production in two decades, driven by both lower transport fuel demand and lower fossil fuel prices diminishing the economic attractiveness of biofuels. The biggest year-on-year drops in output are for U.S. and Brazilian ethanol and European biodiesel.
FIGURE B3.2.1 • Change in energy demand and renewables’ output in electricity, heat and transport, 2019–20
-10%
-8%
-6%
-4%
-2%
0%
2%
4%
6%
8%
Electricity Heat Transport fuels
y-o-y
% ch
ange Total demand
Renewables
64 65 66 69 72 75 79 83 88 95 102 110 117129
142156
171188
205219
0
50
100
150
200
250
2000
2001
2002
2003
2004
2005
2006
2007
2008
2009
2010
2011
2012
2013
2014
2015
2016
2017
2018
2019
Watt
s per
capit
a
Hydropower Wind Solar PV Bioenergy Geothermal Marine
Source: IEA 2020a.
Overall, these factors led to renewables’ increased share for electricity, and only slightly increased share for heat and transport, as total renewable energy consumption grew by an estimated 1 percent in 2020. Despite looming economic uncertainty, investors’ appetite for renewable energy remains strong, thanks in particular to support from government-led green stimulus plans, especially for renewable electricity. Global renewable energy auction results reached record-high volumes in 2020. If geared toward renewable energy, the recent policy momentum to support economic recovery has the potential to accelerate further renewable energy growth.
CHAPTER 3 • Renewable Energy 89
ELECTRICITY
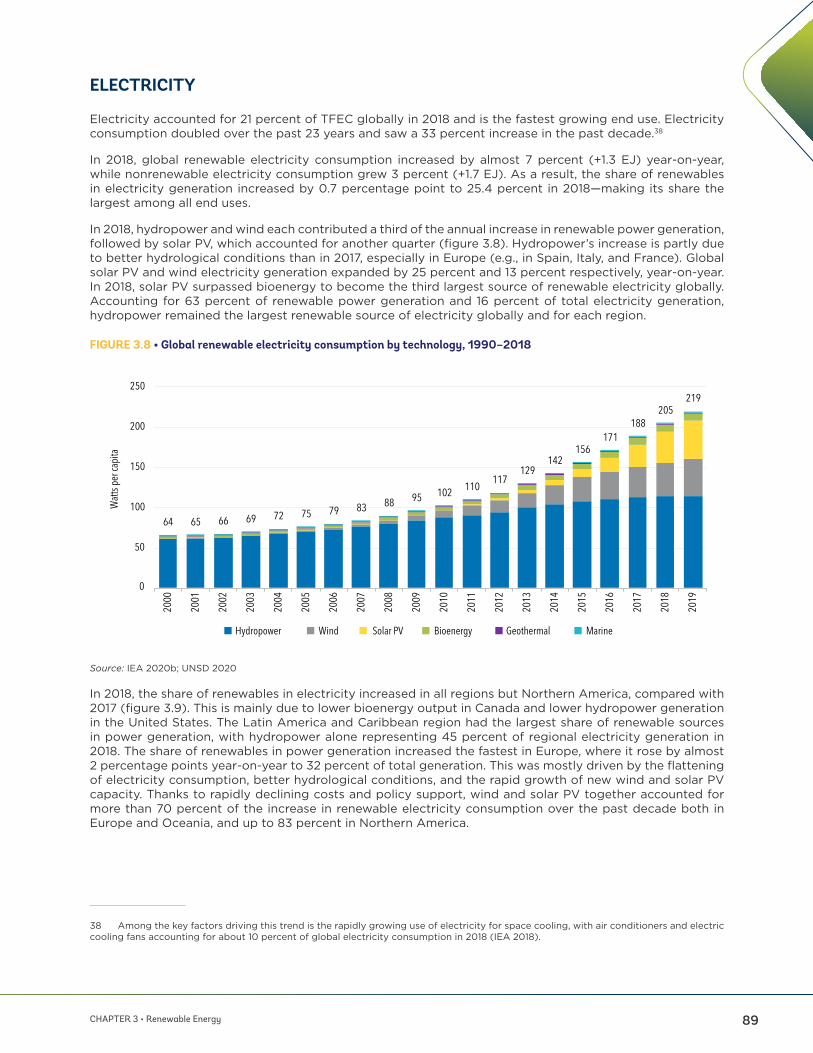
Electricity accounted for 21 percent of TFEC globally in 2018 and is the fastest growing end use. Electricity consumption doubled over the past 23 years and saw a 33 percent increase in the past decade.38
In 2018, global renewable electricity consumption increased by almost 7 percent (+1.3 EJ) year-on-year, while nonrenewable electricity consumption grew 3 percent (+1.7 EJ). As a result, the share of renewables in electricity generation increased by 0.7 percentage point to 25.4 percent in 2018—making its share the largest among all end uses.
In 2018, hydropower and wind each contributed a third of the annual increase in renewable power generation, followed by solar PV, which accounted for another quarter (figure 3.8). Hydropower’s increase is partly due to better hydrological conditions than in 2017, especially in Europe (e.g., in Spain, Italy, and France). Global solar PV and wind electricity generation expanded by 25 percent and 13 percent respectively, year-on-year. In 2018, solar PV surpassed bioenergy to become the third largest source of renewable electricity globally. Accounting for 63 percent of renewable power generation and 16 percent of total electricity generation, hydropower remained the largest renewable source of electricity globally and for each region.
FIGURE 3.8 • Global renewable electricity consumption by technology, 1990–2018
-10%
-8%
-6%
-4%
-2%
0%
2%
4%
6%
8%
Electricity Heat Transport fuels
y-o-y
% ch
ange Total demand
Renewables
64 65 66 69 72 75 79 83 88 95 102 110 117129
142156
171188
205219
0
50
100
150
200
250
2000
2001
2002
2003
2004
2005
2006
2007
2008
2009
2010
2011
2012
2013
2014
2015
2016
2017
2018
2019
Watt
s per
capit
a
Hydropower Wind Solar PV Bioenergy Geothermal Marine
38 Among the key factors driving this trend is the rapidly growing use of electricity for space cooling, with air conditioners and electric cooling fans accounting for about 10 percent of global electricity consumption in 2018 (IEA 2018).
Source: IEA 2020b; UNSD 2020
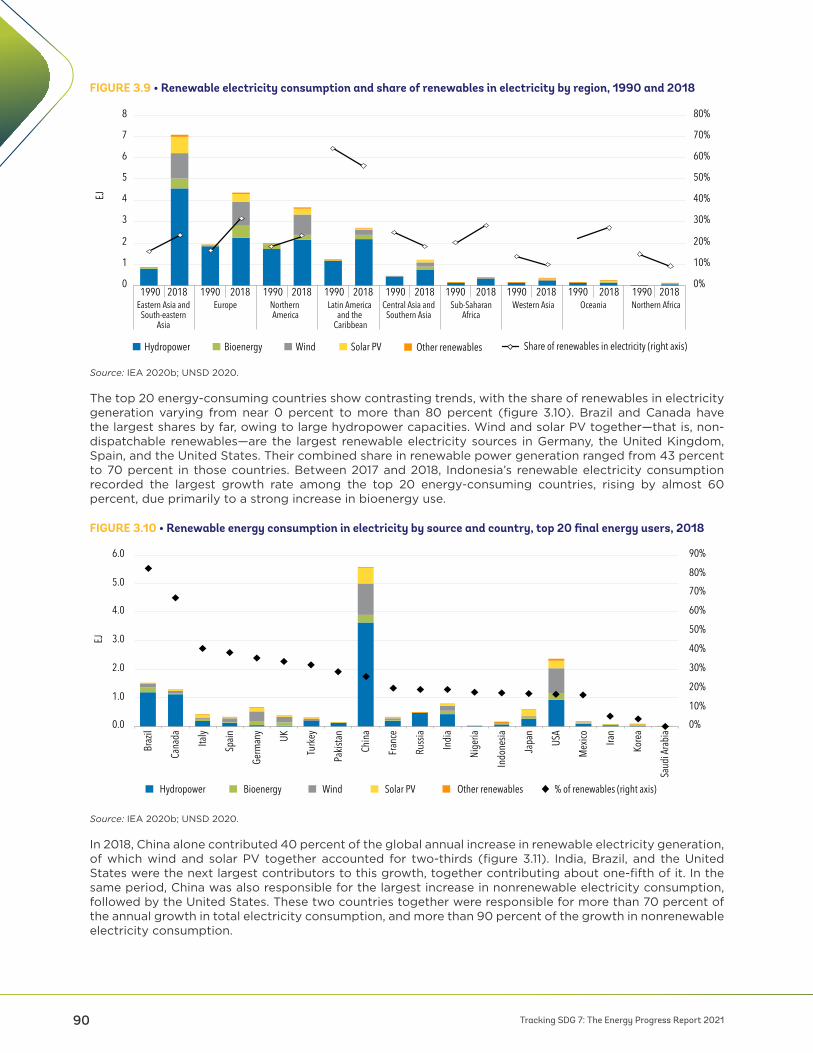
In 2018, the share of renewables in electricity increased in all regions but Northern America, compared with 2017 (figure 3.9). This is mainly due to lower bioenergy output in Canada and lower hydropower generation in the United States. The Latin America and Caribbean region had the largest share of renewable sources in power generation, with hydropower alone representing 45 percent of regional electricity generation in 2018. The share of renewables in power generation increased the fastest in Europe, where it rose by almost 2 percentage points year-on-year to 32 percent of total generation. This was mostly driven by the flattening of electricity consumption, better hydrological conditions, and the rapid growth of new wind and solar PV capacity. Thanks to rapidly declining costs and policy support, wind and solar PV together accounted for more than 70 percent of the increase in renewable electricity consumption over the past decade both in Europe and Oceania, and up to 83 percent in Northern America.
90 Tracking SDG 7: The Energy Progress Report 2021
FIGURE 3.9 • Renewable electricity consumption and share of renewables in electricity by region, 1990 and 2018
0%
10%
20%
30%
40%
50%
60%
70%
80%
0
1
2
3
4
5
6
7
8
1990 2018 2018 2018 2018 2018 2018 2018 2018 20181990 1990 1990 1990 1990 1990 1990 1990
EJ
Share of renewables in electricity (right axis)
Eastern Asia andSouth-eastern
Asia
Sub-SaharanAfrica
Central Asia andSouthern Asia
Europe Northern America
Latin America and the
Caribbean
Western Asia Northern AfricaOceania
Hydropower Bioenergy Wind Solar PV Other renewables
0%
10%
20%
30%
40%
50%
60%
70%
80%
90%
0.0
1.0
2.0
3.0
4.0
5.0
6.0
Braz
il
Cana
da
Italy
Spai
n
Germ
any
UK
Turk
ey
Paki
stan
Chin
a
Fran
ce
Russ
ia
Indi
a
Nige
ria
Indo
nesia
Japa
n
USA
Mex
ico Iran
Kore
a
Saud
i Ara
bia
EJ
% of renewables (right axis)Other renewablesWindHydropower Bioenergy Solar PV
Source: IEA 2020b; UNSD 2020.
The top 20 energy-consuming countries show contrasting trends, with the share of renewables in electricity generation varying from near 0 percent to more than 80 percent (figure 3.10). Brazil and Canada have the largest shares by far, owing to large hydropower capacities. Wind and solar PV together—that is, non-dispatchable renewables—are the largest renewable electricity sources in Germany, the United Kingdom, Spain, and the United States. Their combined share in renewable power generation ranged from 43 percent to 70 percent in those countries. Between 2017 and 2018, Indonesia’s renewable electricity consumption recorded the largest growth rate among the top 20 energy-consuming countries, rising by almost 60 percent, due primarily to a strong increase in bioenergy use.
FIGURE 3.10 • Renewable energy consumption in electricity by source and country, top 20 final energy users, 2018
0%
10%
20%
30%
40%
50%
60%
70%
80%
0
1
2
3
4
5
6
7
8
1990 2018 2018 2018 2018 2018 2018 2018 2018 20181990 1990 1990 1990 1990 1990 1990 1990
EJ
Share of renewables in electricity (right axis)
Eastern Asia andSouth-eastern
Asia
Sub-SaharanAfrica
Central Asia andSouthern Asia
Europe Northern America
Latin America and the
Caribbean
Western Asia Northern AfricaOceania
Hydropower Bioenergy Wind Solar PV Other renewables
0%
10%
20%
30%
40%
50%
60%
70%
80%
90%
0.0
1.0
2.0
3.0
4.0
5.0
6.0
Braz
il
Cana
da
Italy
Spai
n
Germ
any
UK
Turk
ey
Paki
stan
Chin
a
Fran
ce
Russ
ia
Indi
a
Nige
ria
Indo
nesia
Japa
n
USA
Mex
ico Iran
Kore
a
Saud
i Ara
bia
EJ
% of renewables (right axis)Other renewablesWindHydropower Bioenergy Solar PV
Source: IEA 2020b; UNSD 2020.
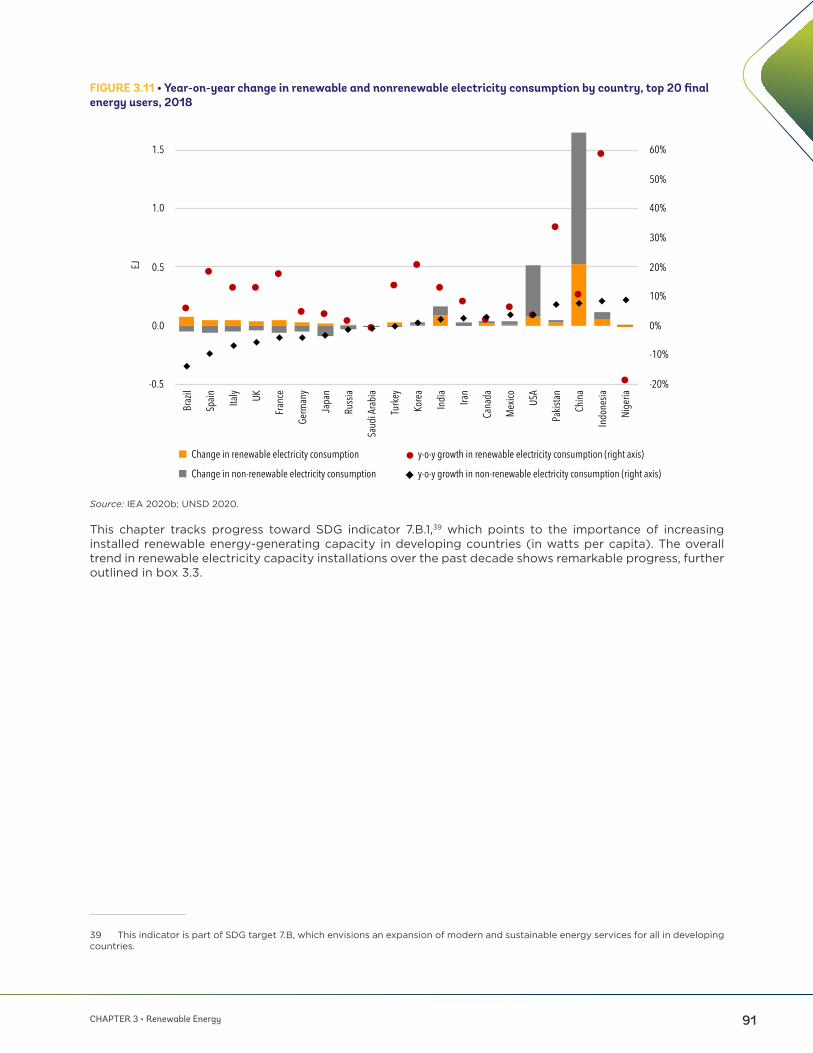
In 2018, China alone contributed 40 percent of the global annual increase in renewable electricity generation, of which wind and solar PV together accounted for two-thirds (figure 3.11). India, Brazil, and the United States were the next largest contributors to this growth, together contributing about one-fifth of it. In the same period, China was also responsible for the largest increase in nonrenewable electricity consumption, followed by the United States. These two countries together were responsible for more than 70 percent of the annual growth in total electricity consumption, and more than 90 percent of the growth in nonrenewable electricity consumption.
CHAPTER 3 • Renewable Energy 91
FIGURE 3.11 • Year-on-year change in renewable and nonrenewable electricity consumption by country, top 20 final energy users, 2018
-20%
-10%
0%
10%
20%
30%
40%
50%
60%
-0.5
0.0
0.5
1.0
1.5
Braz
il
Spai
n
Italy UK
Fran
ce
Ger
man
y
Japa
n
Russ
ia
Saud
i Ara
bia
Turk
ey
Kore
a
Indi
a
Iran
Cana
da
Mex
ico
USA
Paki
stan
Chin
a
Indo
nesi
a
Nig
eria
EJ
Change in renewable electricity consumption
Change in non-renewable electricity consumption
y-o-y growth in renewable electricity consumption (right axis)
y-o-y growth in non-renewable electricity consumption (right axis)
0%
2%
4%
6%
8%
10%
12%
14%
16%
18%
20%
0
5
10
15
20
25
30
35
40
45
1990
1994
1998
2002
2006
2010
2014
2018
EJ EJ
0
5
10
15
20
25
30
35
1998
2008
2018
1998
2008
2018
1998
2008
2018
Industry Buildings Other
Modern bioenergyTraditional uses of biomass
Geothermal
Solar thermal
% of traditional uses of biomass in heat % of direct use of modern renewables in heat (right axis)
8QVSHFLƓHG
39 This indicator is part of SDG target 7.B, which envisions an expansion of modern and sustainable energy services for all in developing countries.
Source: IEA 2020b; UNSD 2020.
This chapter tracks progress toward SDG indicator 7.B.1,39 which points to the importance of increasing installed renewable energy-generating capacity in developing countries (in watts per capita). The overall trend in renewable electricity capacity installations over the past decade shows remarkable progress, further outlined in box 3.3.
92 Tracking SDG 7: The Energy Progress Report 2021
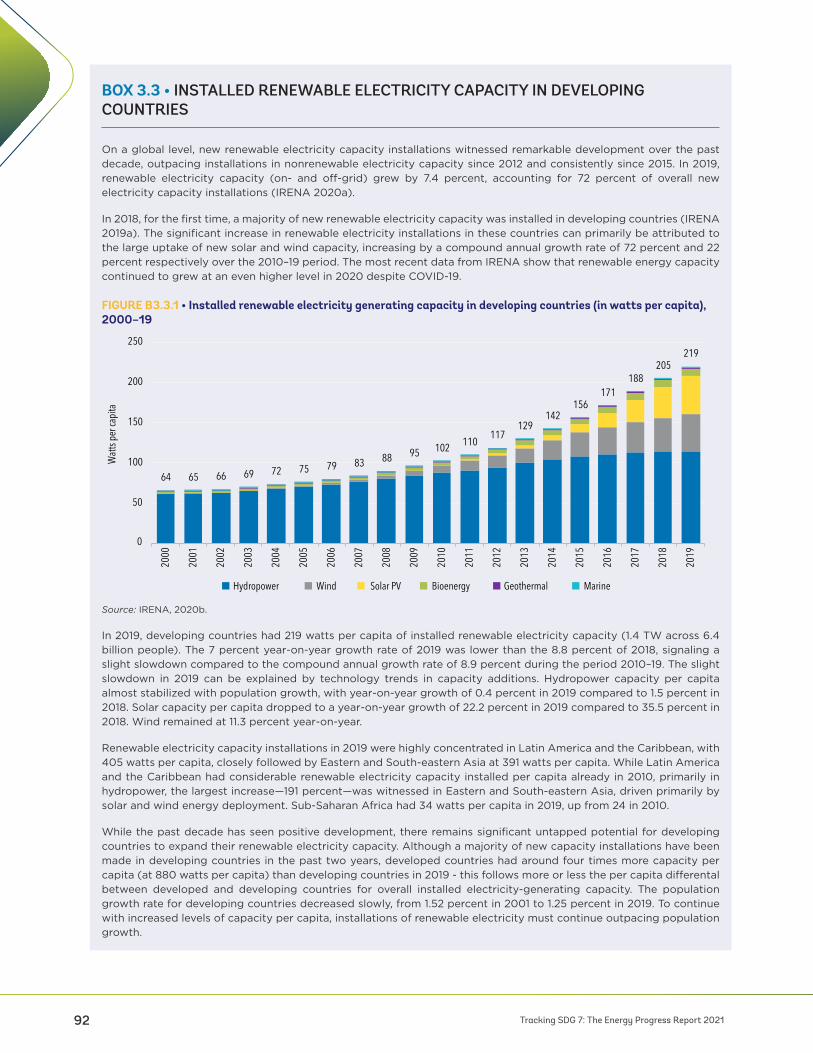
BOX 3.3 • INSTALLED RENEWABLE ELECTRICITY CAPACITY IN DEVELOPING COUNTRIES
On a global level, new renewable electricity capacity installations witnessed remarkable development over the past decade, outpacing installations in nonrenewable electricity capacity since 2012 and consistently since 2015. In 2019, renewable electricity capacity (on- and o!-grid) grew by 7.4 percent, accounting for 72 percent of overall new electricity capacity installations (IRENA 2020a).
In 2018, for the first time, a majority of new renewable electricity capacity was installed in developing countries (IRENA 2019a). The significant increase in renewable electricity installations in these countries can primarily be attributed to the large uptake of new solar and wind capacity, increasing by a compound annual growth rate of 72 percent and 22 percent respectively over the 2010–19 period. The most recent data from IRENA show that renewable energy capacity continued to grew at an even higher level in 2020 despite COVID-19.
FIGURE B3.3.1 • Installed renewable electricity generating capacity in developing countries (in watts per capita), 2000–19
-10%
-8%
-6%
-4%
-2%
0%
2%
4%
6%
8%
Electricity Heat Transport fuels
y-o-y
% ch
ange Total demand
Renewables
64 65 66 69 72 75 79 83 88 95 102 110 117129
142156
171188
205219
0
50
100
150
200
250
2000
2001
2002
2003
2004
2005
2006
2007
2008
2009
2010
2011
2012
2013
2014
2015
2016
2017
2018
2019
Watt
s per
capit
a
Hydropower Wind Solar PV Bioenergy Geothermal Marine
Source: IRENA, 2020b.
In 2019, developing countries had 219 watts per capita of installed renewable electricity capacity (1.4 TW across 6.4 billion people). The 7 percent year-on-year growth rate of 2019 was lower than the 8.8 percent of 2018, signaling a slight slowdown compared to the compound annual growth rate of 8.9 percent during the period 2010–19. The slight slowdown in 2019 can be explained by technology trends in capacity additions. Hydropower capacity per capita almost stabilized with population growth, with year-on-year growth of 0.4 percent in 2019 compared to 1.5 percent in 2018. Solar capacity per capita dropped to a year-on-year growth of 22.2 percent in 2019 compared to 35.5 percent in 2018. Wind remained at 11.3 percent year-on-year.
Renewable electricity capacity installations in 2019 were highly concentrated in Latin America and the Caribbean, with 405 watts per capita, closely followed by Eastern and South-eastern Asia at 391 watts per capita. While Latin America and the Caribbean had considerable renewable electricity capacity installed per capita already in 2010, primarily in hydropower, the largest increase—191 percent—was witnessed in Eastern and South-eastern Asia, driven primarily by solar and wind energy deployment. Sub-Saharan Africa had 34 watts per capita in 2019, up from 24 in 2010.
While the past decade has seen positive development, there remains significant untapped potential for developing countries to expand their renewable electricity capacity. Although a majority of new capacity installations have been made in developing countries in the past two years, developed countries had around four times more capacity per capita (at 880 watts per capita) than developing countries in 2019 - this follows more or less the per capita di!erental between developed and developing countries for overall installed electricity-generating capacity. The population growth rate for developing countries decreased slowly, from 1.52 percent in 2001 to 1.25 percent in 2019. To continue with increased levels of capacity per capita, installations of renewable electricity must continue outpacing population growth.

CHAPTER 3 • Renewable Energy 93
HEAT
Heat is the largest energy end use worldwide, accounting for half of global TFEC (177 EJ). Total heat consumption grew by an estimated 1.1 percent in 2018 compared with 2017. With coal, gas, and oil meeting more than three-quarters of global heat demand, the sector remains heavily fossil-fuel dependent. The traditional uses of biomass slightly decreased (-1.8 percent) in 2018 compared to 2017, while still accounting for almost 14 percent (24 EJ) of global heat consumption (figure 3.12). Excluding these traditional uses of biomass, as well as ambient heat harnessed by heat pumps40 (for which available data are limited), renewable heat consumption increased 1.2 percent year-on-year to 16.2 EJ in 2018. This represented only 9.2 percent of total heat consumption, same as the two years before, and only one percentage point higher than ten years earlier.
Despite its dominant share in final energy consumption, the heat sector receives limited policy attention and support. Greater ambition and stronger policy support are needed to progress toward SDG 7.1 and SDG 7.2 targets (See policy insights below). Doing so requires combining strong improvements in energy e"ciency with fast deployment of renewable heat technologies in order to transition away from fossil fuels and ine"cient and unsustainable uses of biomass.
FIGURE 3.12 • Renewable heat consumption by source and sector, 1990-2018
-20%
-10%
0%
10%
20%
30%
40%
50%
60%
-0.5
0.0
0.5
1.0
1.5
Braz
il
Spai
n
Italy UK
Fran
ce
Ger
man
y
Japa
n
Russ
ia
Saud
i Ara
bia
Turk
ey
Kore
a
Indi
a
Iran
Cana
da
Mex
ico
USA
Paki
stan
Chin
a
Indo
nesi
a
Nig
eria
EJ
Change in renewable electricity consumption
Change in non-renewable electricity consumption
y-o-y growth in renewable electricity consumption (right axis)
y-o-y growth in non-renewable electricity consumption (right axis)
0%
2%
4%
6%
8%
10%
12%
14%
16%
18%
20%
0
5
10
15
20
25
30
35
40
45
1990
1994
1998
2002
2006
2010
2014
2018
EJ EJ
0
5
10
15
20
25
30
35
1998
2008
2018
1998
2008
2018
1998
2008
2018
Industry Buildings Other
Modern bioenergyTraditional uses of biomass
Geothermal
Solar thermal
% of traditional uses of biomass in heat % of direct use of modern renewables in heat (right axis)
8QVSHFLƓHG
40 The rapid spread of heat pumps over the past decade is making ambient heat an increasingly important heat source, although its importance globally is di"cult to estimate because data are unavailable for some markets. Because of this dearth of data, this report does not account for it, although ambient heat can be credited as a renewable source.
41 Renewables also contribute to heat supply indirectly through renewable electricity used for heating and district heat networks. Accounting for these indirect uses, and excluding ambient heat, renewable electricity is actually the second largest modern renewable heat source after bioenergy, and the fastest growing one. It accounted for almost half of the increase in total (direct and indirect) modern renewable heat consumption in 2018, owing to the combination of increasing penetration of renewables in the power sector and heat electrification through the use of electric heat pumps and boilers. The buildings sector is responsible for the majority of electricity consumed for heat.
Source: IEA 2020b; UNSD 2020.
Note: Indirect consumption of renewable heat through renewable electricity is not represented on this figure.
Bioenergy accounts for about 87 percent (14.1 EJ) of direct modern uses of renewables for heat41 globally, following a year-on-year 0.5 percent increase in 2018, mostly in the buildings sector. Industry is responsible for a little less than two-thirds of modern bioenergy use, most of it concentrated in subsectors producing biomass residues on site, such as wood, pulp, and paper industries, as well as the sugar and ethanol industries.
Global solar thermal consumption increased by 3.7 percent in 2018, accounting for 8.5 percent (1.4 EJ) of modern uses of renewables for heat; yet it still met less than 1 percent of total final heat demand. The large majority of solar thermal consumption corresponds to small domestic solar water heaters, although significant untapped potential remains for large-scale systems for district heating and industrial applications,
94 Tracking SDG 7: The Energy Progress Report 2021
which continue to develop as a niche market. China continued to lead solar thermal developments by far, accounting for 70 percent of global cumulative solar thermal capacity and 74 percent of newly installed capacity in 2018. However, China’s market for solar thermal has been continuously declining since 2014, due to reduced construction activities, the phasing out of incentives, and market competition with other technologies such as heat pumps, as well as solar PV for rooftop space. Solar thermal cooling o!ers great potential to decarbonize space cooling, especially since the greatest demand coincides with the highest solar potential, reducing the load of electric air conditioners at peak times during summer months. However, it is still a niche technology.
Geothermal heat consumption grew almost 14 percent in 2018, representing 4.2 percent (0.7 EJ) of modern uses of renewables for heat. Almost 60 percent of geothermal heat is harnessed by ground-source heat pumps worldwide (Lund and Toth 2020). The large majority of applications concern the buildings sector, with bathing, swimming, and space heating (primarily via district heating) being the most prevalent end uses globally. China is responsible for two-thirds of global geothermal heat consumption, followed by Turkey and the United States, which together account for another 18 percent. China and the United States together represented almost 90 percent of the growth in geothermal heat consumption in 2018.
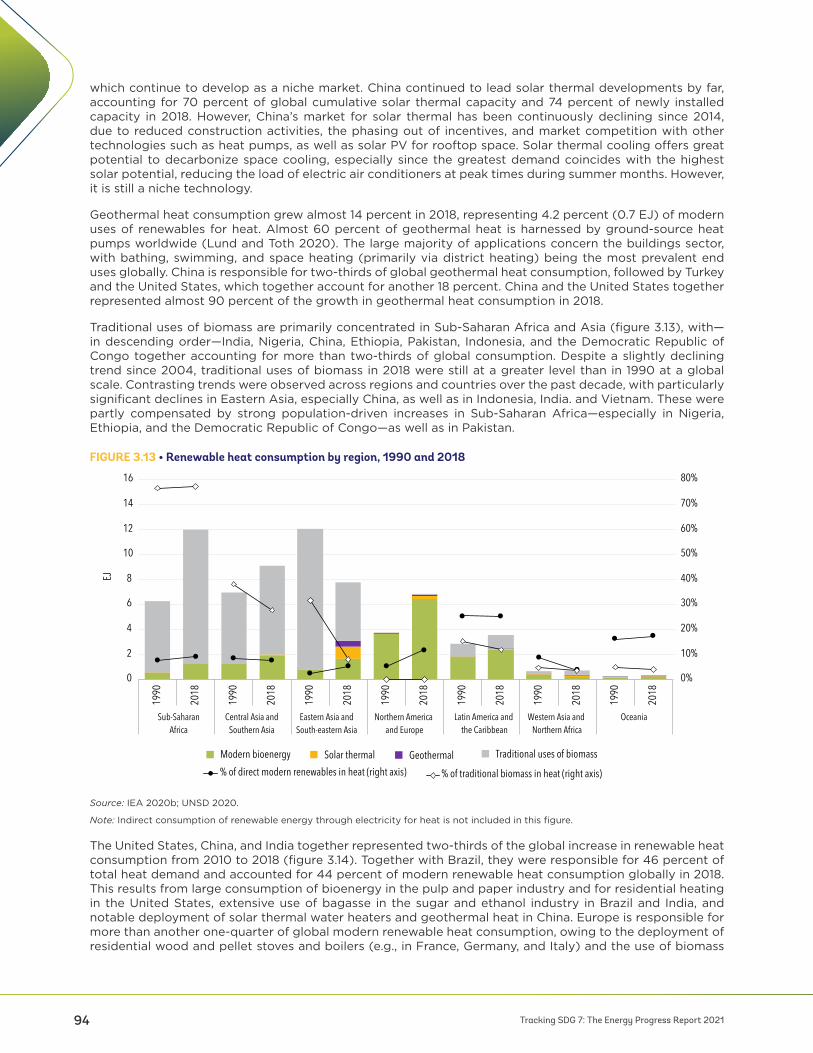
Traditional uses of biomass are primarily concentrated in Sub-Saharan Africa and Asia (figure 3.13), with—in descending order—India, Nigeria, China, Ethiopia, Pakistan, Indonesia, and the Democratic Republic of Congo together accounting for more than two-thirds of global consumption. Despite a slightly declining trend since 2004, traditional uses of biomass in 2018 were still at a greater level than in 1990 at a global scale. Contrasting trends were observed across regions and countries over the past decade, with particularly significant declines in Eastern Asia, especially China, as well as in Indonesia, India. and Vietnam. These were partly compensated by strong population-driven increases in Sub-Saharan Africa—especially in Nigeria, Ethiopia, and the Democratic Republic of Congo—as well as in Pakistan.
FIGURE 3.13 • Renewable heat consumption by region, 1990 and 2018
0%
10%
20%
30%
40%
50%
60%
70%
80%
0
2
4
6
8
10
12
14
16
1990
2018
1990
2018
1990
2018
1990
2018
1990
2018
1990
2018
1990
2018
EJ
% of direct modern renewables in heat (right axis) % of traditional biomass in heat (right axis)
Eastern Asia andSouth-eastern Asia
Sub-SaharanAfrica
Central Asia andSouthern Asia
Northern America and Europe
Latin America and the Caribbean
Western Asia and Northern Africa
Oceania
Modern bioenergy Traditional uses of biomassGeothermalSolar thermal
0%
20%
40%
60%
80%
100%
10%
30%
50%
70%
90%
0
1
2
3
4
5
6
7
Braz
il
Franc
e
Mex
ico
Spain Ita
ly
Germ
any
Cana
da
India
USA
Turke
y
Indon
esia UK
Pakis
tan
Nige
ria
Japa
n
China
Korea
Russi
a
Iran
Saud
i Arab
ia
EJ
% of renewables in heat (right axis) % of modern renewables in heat (right axis)
Modern bioenergy Traditional uses of biomassGeothermalSolar thermal
Source: IEA 2020b; UNSD 2020.
Note: Indirect consumption of renewable energy through electricity for heat is not included in this figure.
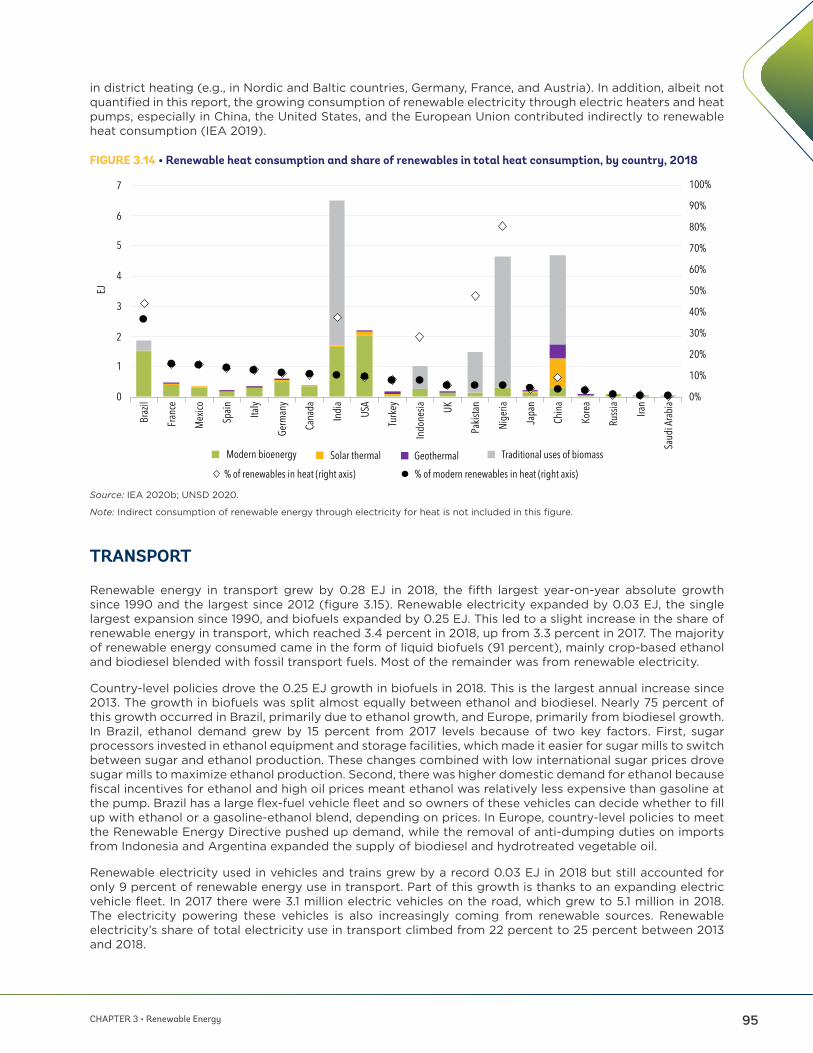
The United States, China, and India together represented two-thirds of the global increase in renewable heat consumption from 2010 to 2018 (figure 3.14). Together with Brazil, they were responsible for 46 percent of total heat demand and accounted for 44 percent of modern renewable heat consumption globally in 2018. This results from large consumption of bioenergy in the pulp and paper industry and for residential heating in the United States, extensive use of bagasse in the sugar and ethanol industry in Brazil and India, and notable deployment of solar thermal water heaters and geothermal heat in China. Europe is responsible for more than another one-quarter of global modern renewable heat consumption, owing to the deployment of residential wood and pellet stoves and boilers (e.g., in France, Germany, and Italy) and the use of biomass
CHAPTER 3 • Renewable Energy 95
in district heating (e.g., in Nordic and Baltic countries, Germany, France, and Austria). In addition, albeit not quantified in this report, the growing consumption of renewable electricity through electric heaters and heat pumps, especially in China, the United States, and the European Union contributed indirectly to renewable heat consumption (IEA 2019).
FIGURE 3.14 • Renewable heat consumption and share of renewables in total heat consumption, by country, 2018
0%
10%
20%
30%
40%
50%
60%
70%
80%
0
2
4
6
8
10
12
14
16
1990
2018
1990
2018
1990
2018
1990
2018
1990
2018
1990
2018
1990
2018
EJ
% of direct modern renewables in heat (right axis) % of traditional biomass in heat (right axis)
Eastern Asia andSouth-eastern Asia
Sub-SaharanAfrica
Central Asia andSouthern Asia
Northern America and Europe
Latin America and the Caribbean
Western Asia and Northern Africa
Oceania
Modern bioenergy Traditional uses of biomassGeothermalSolar thermal
0%
20%
40%
60%
80%
100%
10%
30%
50%
70%
90%
0
1
2
3
4
5
6
7
Braz
il
Franc
e
Mex
ico
Spain Ita
ly
Germ
any
Cana
da
India
USA
Turke
y
Indon
esia UK
Pakis
tan
Nige
ria
Japa
n
China
Korea
Russi
a
Iran
Saud
i Arab
ia
EJ
% of renewables in heat (right axis) % of modern renewables in heat (right axis)
Modern bioenergy Traditional uses of biomassGeothermalSolar thermal
Source: IEA 2020b; UNSD 2020.
Note: Indirect consumption of renewable energy through electricity for heat is not included in this figure.
TRANSPORT
Renewable energy in transport grew by 0.28 EJ in 2018, the fifth largest year-on-year absolute growth since 1990 and the largest since 2012 (figure 3.15). Renewable electricity expanded by 0.03 EJ, the single largest expansion since 1990, and biofuels expanded by 0.25 EJ. This led to a slight increase in the share of renewable energy in transport, which reached 3.4 percent in 2018, up from 3.3 percent in 2017. The majority of renewable energy consumed came in the form of liquid biofuels (91 percent), mainly crop-based ethanol and biodiesel blended with fossil transport fuels. Most of the remainder was from renewable electricity.
Country-level policies drove the 0.25 EJ growth in biofuels in 2018. This is the largest annual increase since 2013. The growth in biofuels was split almost equally between ethanol and biodiesel. Nearly 75 percent of this growth occurred in Brazil, primarily due to ethanol growth, and Europe, primarily from biodiesel growth. In Brazil, ethanol demand grew by 15 percent from 2017 levels because of two key factors. First, sugar processors invested in ethanol equipment and storage facilities, which made it easier for sugar mills to switch between sugar and ethanol production. These changes combined with low international sugar prices drove sugar mills to maximize ethanol production. Second, there was higher domestic demand for ethanol because fiscal incentives for ethanol and high oil prices meant ethanol was relatively less expensive than gasoline at the pump. Brazil has a large flex-fuel vehicle fleet and so owners of these vehicles can decide whether to fill up with ethanol or a gasoline-ethanol blend, depending on prices. In Europe, country-level policies to meet the Renewable Energy Directive pushed up demand, while the removal of anti-dumping duties on imports from Indonesia and Argentina expanded the supply of biodiesel and hydrotreated vegetable oil.
Renewable electricity used in vehicles and trains grew by a record 0.03 EJ in 2018 but still accounted for only 9 percent of renewable energy use in transport. Part of this growth is thanks to an expanding electric vehicle fleet. In 2017 there were 3.1 million electric vehicles on the road, which grew to 5.1 million in 2018. The electricity powering these vehicles is also increasingly coming from renewable sources. Renewable electricity’s share of total electricity use in transport climbed from 22 percent to 25 percent between 2013 and 2018.
96 Tracking SDG 7: The Energy Progress Report 2021
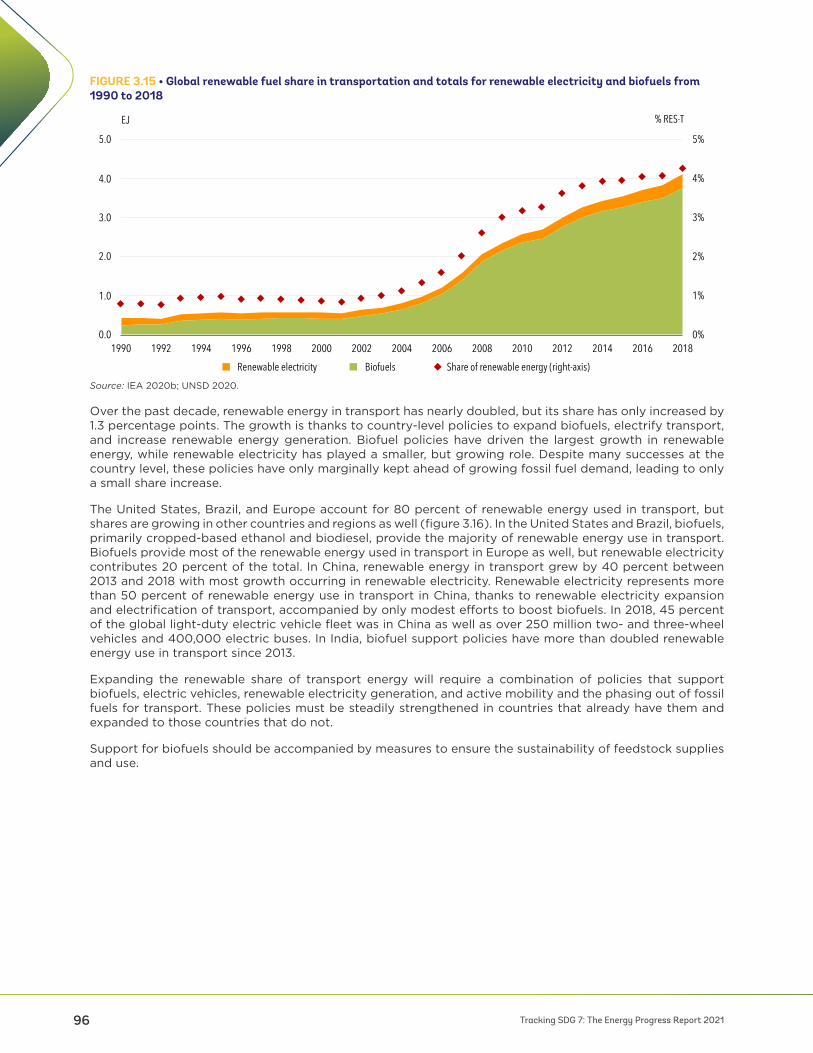
FIGURE 3.15 • Global renewable fuel share in transportation and totals for renewable electricity and biofuels from 1990 to 2018
0%
1%
2%
3%
4%
5%
0.0
1.0
2.0
3.0
4.0
5.0
1990 1992 1994 1996 1998 2000 2002 2004 2006 2008 2010 2012 2014 2016 2018
% RES-TEJ
Renewable electricity Biofuels Share of renewable energy (right-axis)
0%
5%
10%
15%
20%
25%
0
20
40
60
80
100
120
140
160
Sweden Albania Norway Finland Argentina Iceland France Austria Colombia
Renewable share (right-axis)
0%
5%
10%
15%
20%
25%
0
100
200
300
400
500
600
700
800
900
Brazil
PJ PJ
Renewable electricity Biofuels
Source: IEA 2020b; UNSD 2020.
Over the past decade, renewable energy in transport has nearly doubled, but its share has only increased by 1.3 percentage points. The growth is thanks to country-level policies to expand biofuels, electrify transport, and increase renewable energy generation. Biofuel policies have driven the largest growth in renewable energy, while renewable electricity has played a smaller, but growing role. Despite many successes at the country level, these policies have only marginally kept ahead of growing fossil fuel demand, leading to only a small share increase.
The United States, Brazil, and Europe account for 80 percent of renewable energy used in transport, but shares are growing in other countries and regions as well (figure 3.16). In the United States and Brazil, biofuels, primarily cropped-based ethanol and biodiesel, provide the majority of renewable energy use in transport. Biofuels provide most of the renewable energy used in transport in Europe as well, but renewable electricity contributes 20 percent of the total. In China, renewable energy in transport grew by 40 percent between 2013 and 2018 with most growth occurring in renewable electricity. Renewable electricity represents more than 50 percent of renewable energy use in transport in China, thanks to renewable electricity expansion and electrification of transport, accompanied by only modest e!orts to boost biofuels. In 2018, 45 percent of the global light-duty electric vehicle fleet was in China as well as over 250 million two- and three-wheel vehicles and 400,000 electric buses. In India, biofuel support policies have more than doubled renewable energy use in transport since 2013.
Expanding the renewable share of transport energy will require a combination of policies that support biofuels, electric vehicles, renewable electricity generation, and active mobility and the phasing out of fossil fuels for transport. These policies must be steadily strengthened in countries that already have them and expanded to those countries that do not.
Support for biofuels should be accompanied by measures to ensure the sustainability of feedstock supplies and use.

CHAPTER 3 • Renewable Energy 97
FIGURE 3.16 • Selected countries’ renewable energy share in transportation and total renewable energy for 2008, 2013, and 2018
0%
5%
10%
15%
20%
25%
0
200
400
600
800
1000
1200
1400
1600
1800
2008 2013 2018 2008 2013 2018 2008 2013 2018 2008 2013 2018 2008 2013 2018 2008 2013 2018USA Brazil Europe China India Rest of the World
PJ
Renewable share (right-axis)Renewable electricity Biofuels
Source: IEA 2020b; UNSD 2020.
More than 70 countries have biofuel support policies in place, and most large markets support electric vehicle adoption and renewable energy generation that have driven growth in renewable energy shares. Brazil, Sweden, Norway, Finland and Albania all achieved renewable energy shares above 10 percent in 2018 (figure 3.17). Share increases in other jurisdictions were more modest. Policies in the United States drove renewable shares up from 3.3 percent in 2008 to 6 percent in 2018 and policies in Europe drove shares up from 2.7 percent to 4.7 percent. Another 130 countries have no policies to drive renewable energy use in transport and had no measurable increase in the renewable energy used for transport in 2018.
FIGURE 3.17 • Top ten countries by renewable energy share in transport, 2018
0%
1%
2%
3%
4%
5%
0.0
1.0
2.0
3.0
4.0
5.0
1990 1992 1994 1996 1998 2000 2002 2004 2006 2008 2010 2012 2014 2016 2018
% RES-TEJ
Renewable electricity Biofuels Share of renewable energy (right-axis)
0%
5%
10%
15%
20%
25%
0
20
40
60
80
100
120
140
160
Sweden Albania Norway Finland Argentina Iceland France Austria Colombia
Renewable share (right-axis)
0%
5%
10%
15%
20%
25%
0
100
200
300
400
500
600
700
800
900
Brazil
PJ PJ
Renewable electricity Biofuels
Source: IEA 2020b; UNSD 2020.
98 Tracking SDG 7: The Energy Progress Report 2021
POLICY INSIGHTS: A FOCUS ON HEATING AND COOLING
As demonstrated in this chapter, the adoption of renewable energy in the power sector has seen significant progress in the last decade, while much more e!ort is needed in other end uses.
Heating and cooling accounts for almost half of global energy consumption, of which industrial processes account for close to 50 percent and another 46 percent is used in residential and commercial buildings—predominantly for space and water heating and, to a lesser extent, for cooking. The remainder of heating is used in agricultural activities, such as heating greenhouses, soil, and farm buildings; drying harvested products; and maintaining temperatures for aquaculture. As developing countries continue to develop their industries and as climate change increases the frequency and severity of heat waves and other weather events, the demand for heating and cooling will grow (IEA 2019).
POLICY ATTENTION GIVEN TO HEATING AND COOLING TO DATE
Despite the urgency of decarbonizing heating and cooling, some barriers persist. Chief among them are high up-front costs, regulatory and institutional frameworks based on fossil fuels, consumer inertia, and technical hurdles.
These barriers can be overcome with support policies. But so far, policy makers have given scant attention to transitioning heating and cooling to renewables. At the end of 2019, only 49 countries had national targets for renewable heating and cooling (compared with 166 countries having goals for renewable power generation). This number has been almost steady since 2016, when 47 countries had renewable heating and cooling targets (REN21 2020; REN21 2018). Decarbonizing and modernizing the energy used for heating and cooling requires that governments implement comprehensive policy packages that combine e"ciency and renewables while phasing out the use of fossil fuels. Such policies can span the range of decarbonization options including electrification, renewable gases, sustainable biomass, and the direct use of geothermal and solar thermal energy.
POLICIES FOR RENEWABLE HEATING AND COOLING IN THE KEY TRANSFORMATIVE PATHWAYS
Five pathways are possible to decarbonize heating and cooling with renewables. Policies to support them are presented below.
Renewables-based electrification
Greenhouse gas emissions can be reduced by switching to e"cient renewable-energy-powered electric technologies, such as heat pumps and electric appliances for buildings, electrified heating and cooling for industry, and decentralized technologies for productive uses in areas that lack access to clean and reliable energy. Such a transition must be coordinated with the deployment of renewables in the power sector.
Renewables-based electrification is particularly important for cooling needs, not least in developing countries and low-income communities, many of which are in areas at risk of increased average temperatures and heat waves due to climate change. Policies that can e!ectively accelerate uptake of new equipment include fiscal and financial measures such as loans, grants, and subsidies. In China, government subsidies supported the switch from coal-fired boilers in buildings, resulting in the purchase of more than half a million heat pumps in 2018 (CHPA 2019; Zhao, Gao, and Song 2017). Industrial facilities also present large opportunities for electrification, with competitive applications already available in the food and beverage and textile industries. Heat pumps can also be combined with solar thermal preheating or waste-heat recovery to further raise e"ciency and cut operating costs (IRENA Coalition for Action 2021). Additional reductions could come from homes and businesses switching to e"cient appliances, notably cookstoves.

CHAPTER 3 • Renewable Energy 99
Although widespread electrification of heating and cooling will significantly increase overall demand for electricity, it also holds out the promise of adding flexibility to the electricity system through improvements in demand response, thereby facilitating the integration of higher shares of variable renewable energy into the power generation mix. Thermal storage can also enhance system flexibility (IRENA 2020b).
Exploiting this potential requires proactive policies favoring demand response, including measures to upgrade power networks through the deployment of remote monitoring and control technologies and to establish aggregators and dedicated flexibility products in the power market. Time-of-use tari!s can incentivize users match their demand to system needs (IRENA 2019b).
In o!-grid and weak-grid contexts, there is a need to coordinate planning for decentralized heating and cooling with planning for rural electrification. Above all, coordination measures must ensure that the deployment of technologies supports broad socioeconomic development goals. Among possible measures are regulations, fiscal incentives, donor-sponsored research and development, roll-out programs to increase economies of scale, energy performance standards, appliance labels, public awareness campaigns, user education, and financing models for manufacturers, installers, and consumers (IRENA, IEA, and REN21 2020).
Renewable gases
Not all heating and cooling systems can be electrified at a competitive cost, so there is a role for renewable gases such as green hydrogen, biogas, and biomethane to replace fossil gases. Renewable gases can often use networks and infrastructure built for fossil gas, reducing the costs of the transition. With due attention to safety and feasibility, many countries are already injecting biomethane into their gas grids.
Renewable gases o!er advantages beyond reducing carbon emissions from fossil fuel use and methane emissions from the decomposition of organic waste. Ambitious, long-term frameworks for the development of a renewable gas industry and related markets will depend on roadmaps, industrial strategies, and specific targets. France, for example, has set a target of 10 percent of the gas consumed in the country being renewable by 2030 (IRENA, IEA, and REN21 2020).
Other policies to help create markets for renewable gas products include: low-carbon fuel standards; direct investment support and subsidies to lower high production costs; assessments of gas transmission pipelines to confirm they can be safely used; new regulatory frameworks; and mechanisms for certifying emissions reductions from renewable gas.
Sustainable use of biomass
Bioenergy is presently the largest renewable source of energy for heating, with the majority being in the form of ine"cient uses of biomass (e.g., wood, crop residues, and animal dung) for cooking and heating as outlined above.
The transition to a more e"cient use of biomass would include the adoption of improved cookstoves and modern biofuels. Many countries already implement policies to this end, including in Sub-Saharan Africa through national cookstove programs supported by development finance. Data collection and analysis to understand local cooking needs, cultural cooking preferences, and local fuel supply are important first steps toward e!ective policy making. Standards, certification, and testing play a key role in ensuring that clean cooking solutions satisfy users’ needs, meet air quality standards, and are backed by sustainable fuel supply chains (see chapter 2).
Certification schemes are also important where bioenergy can be used for heat in buildings, district heating systems, and for industrial processes. Such supportive policy and regulatory regimes are essential to ensure reliable and consistent supplies of biomass feedstock and avoid possible negative environmental consequences from increasing biomass exploitation.
Financial incentives can help builders and property owners overcome the higher capital costs of e"cient biomass boilers compared with gas or oil boilers. The scaling up of financing solutions is also needed to support greater deployment of clean cooking solutions in developing countries (SEforAll and CPI 2020).
100 Tracking SDG 7: The Energy Progress Report 2021
Direct use of solar thermal heat
Energy from the sun can be used directly for space and water heating, industrial processes, food drying, and wastewater treatment, among other uses. When solar collectors are paired with absorption or adsorption chillers, solar energy also can be used for cooling.
Solar water heating systems in single-family houses and multifamily dwellings represent the largest use of solar thermal heat—almost 90 percent of installed capacity in 2018—whereas district heating networks, industrial processes, and space heating and cooling represent only 4 percent (Weiss and Spörk-Dür 2020). Solar water heaters can substantially reduce energy bills while creating local jobs and industries (IRENA, IEA, and REN21 2020). Solar thermal also has vast potential for air conditioning, since the greatest demand for cooling coincides with the highest solar potential. But the use of solar thermal for such purposes requires support for research and demonstration projects to overcome technical barriers.
While highly cost-competitive on a life-cycle basis, depending on the region and application, most solar thermal systems come with high up-front costs. E!ective supporting policies include fiscal and financial incentives such as loans, grants, tax credits, or subsidies, combined with targets, mandates, and building codes to increase the size of the market, as well as public awareness e!orts to increase interest and demand. Denmark, for example, has used tax incentives to help build large-scale solar thermal district heating plants (Perlin 2017). In Rwanda, grants and loans provided by the SolaRwanda program led to more than 3,000 solar water heaters being installed in homes by 2018 (Solar Thermal World 2018).
Direct use of geothermal heat
The thermal energy stored in rocks and in water trapped under the surface of the earth can be tapped for a wide range of uses, from space heating and cooling to aquaculture, agriculture (e.g., grain drying), and other commercial and industrial processes. Much of the potential of thermal energy has yet to be tapped, however. It is currently the smallest renewable heat source.
Among obstacles to expanding geothermal heat are high up-front investment costs, uncertainties about finding and capturing the energy, and inadequate policy and regulatory frameworks.
Government initiatives and plans to encourage the collection, updating, and sharing of data on geothermal resources’ mapping could help attract investors, as could loan guarantees, grants, and direct support for demonstration projects (IRENA, IEA, and REN21 2020). Use of geothermal energy in agriculture can bring important socioeconomic benefits. Some European countries, including France, Germany, Iceland, the Netherlands, and Switzerland, have set up risk insurance funds to ease the drilling risk of geothermal projects (Dumas and Angelino 2015).
Policies that cut across all pathways
Cross-cutting policies are needed to address long-standing barriers and speed up decarbonization in all contexts. Nationally determined contributions that are aligned with renewable heating and cooling targets can improve policy certainty and guide investment. Only 25 of nearly 200 countries have formulated commitments on renewable heating and cooling in their nationally determined contributions (REN21 2020). The e!ectiveness of targets relies on comprehensive long-term planning for decarbonization.
Integrated long-term plans, including energy e"ciency plans and the development of needed infrastructure (e.g., district heating and cooling networks), can avoid conflicts among pathways and stranded assets. District heating and cooling networks, for example, can enable the large-scale penetration of renewables and be more e"cient than decentralized systems, especially in densely populated areas. This makes them an essential component of the wider energy transition. While most district heating networks still run on fossil fuels (often linked to power plants), a growing number are integrating some renewable energy such as biomass, especially in Northern Europe. Policies to promote the deployment of new district infrastructure and the greater use of renewable energy in existing networks include resource mapping, mandated connections, city-level targets, as well as mechanisms to o!set high capital costs and reduce risks. Amsterdam (the Netherlands) requires all new developments to connect to district heating systems (C40 and UNEP 2016). Helsingborg (Sweden) and Munich (Germany) have both set targets for 100 percent renewable district heating by 2034 and 2040, respectively (IRENA, IEA, and REN21 2020).
The energy transition also requires leveling the playing field with fossil fuels, for which phasing out fossil fuel subsidies and redirecting resources toward the energy transition are key. Where possible, policy makers can
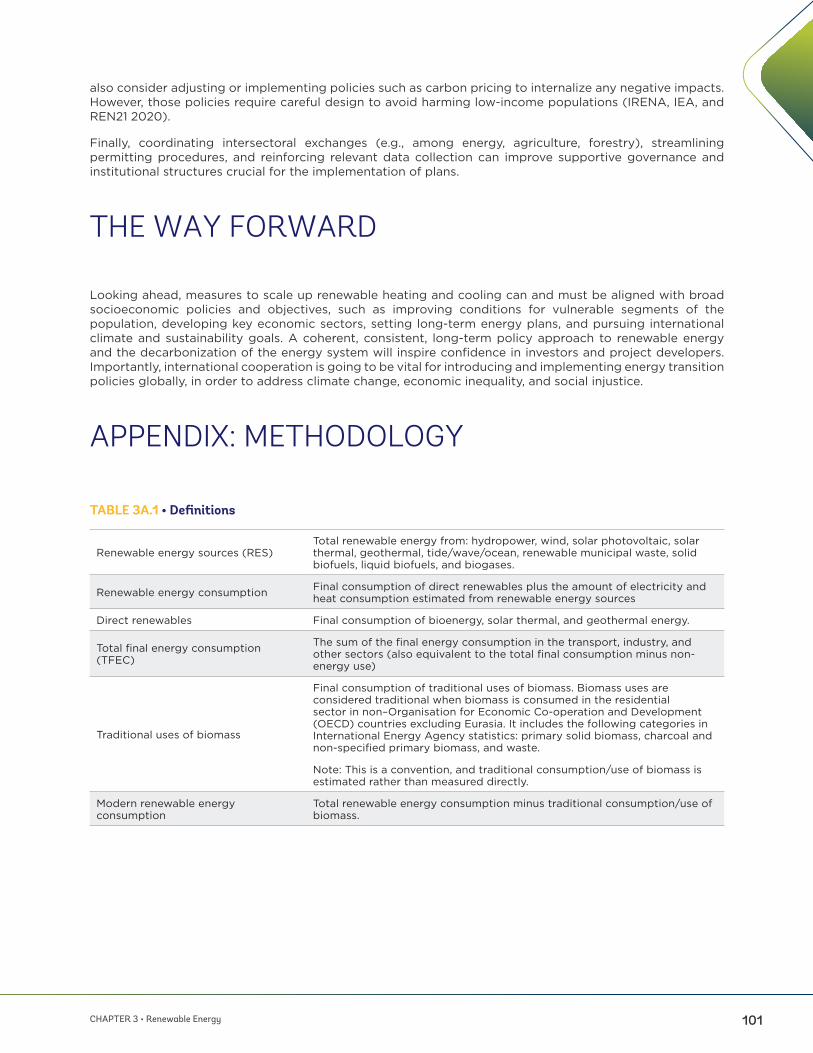
CHAPTER 3 • Renewable Energy 101
also consider adjusting or implementing policies such as carbon pricing to internalize any negative impacts. However, those policies require careful design to avoid harming low-income populations (IRENA, IEA, and REN21 2020).
Finally, coordinating intersectoral exchanges (e.g., among energy, agriculture, forestry), streamlining permitting procedures, and reinforcing relevant data collection can improve supportive governance and institutional structures crucial for the implementation of plans.
THE WAY FORWARD
Looking ahead, measures to scale up renewable heating and cooling can and must be aligned with broad socioeconomic policies and objectives, such as improving conditions for vulnerable segments of the population, developing key economic sectors, setting long-term energy plans, and pursuing international climate and sustainability goals. A coherent, consistent, long-term policy approach to renewable energy and the decarbonization of the energy system will inspire confidence in investors and project developers. Importantly, international cooperation is going to be vital for introducing and implementing energy transition policies globally, in order to address climate change, economic inequality, and social injustice.
APPENDIX: METHODOLOGY
TABLE 3A.1 • Definitions
Renewable energy sources (RES)Total renewable energy from: hydropower, wind, solar photovoltaic, solar thermal, geothermal, tide/wave/ocean, renewable municipal waste, solid biofuels, liquid biofuels, and biogases.
Renewable energy consumption Final consumption of direct renewables plus the amount of electricity and heat consumption estimated from renewable energy sources
Direct renewables Final consumption of bioenergy, solar thermal, and geothermal energy.
Total final energy consumption (TFEC)
The sum of the final energy consumption in the transport, industry, and other sectors (also equivalent to the total final consumption minus non-energy use)
Traditional uses of biomass
Final consumption of traditional uses of biomass. Biomass uses are considered traditional when biomass is consumed in the residential sector in non–Organisation for Economic Co-operation and Development (OECD) countries excluding Eurasia. It includes the following categories in International Energy Agency statistics: primary solid biomass, charcoal and non-specified primary biomass, and waste.
Note: This is a convention, and traditional consumption/use of biomass is estimated rather than measured directly.
Modern renewable energy consumption
Total renewable energy consumption minus traditional consumption/use of biomass.
102 Tracking SDG 7: The Energy Progress Report 2021
METHODOLOGY FOR MAIN INDICATOR
The indicator used in this report to track progress toward SDG target 7.2 is the share of renewable energy in total final energy consumption. Data from the International Energy Agency and United Nations Statistics Division energy balances are used to calculate the indicator according to the formula:
������� �������� ������ � ������
��������� ������� ����������������
���������
The variables are derived from the energy balance flows (TFEC = total final energy consumption as defined in table 3A.1, ELE = gross electricity production, HEAT = gross heat production) and their subscripts correspond to the energy balance products.
The denominator is the total final energy consumption of all energy products (as defined in table 3A.1) while the numerator, renewable energy consumption, is a series of calculations defined as: the direct consumption of renewable energy sources plus the final consumption of gross electricity and heat that is estimated to have come from renewable sources. This estimation allocates the amount of electricity and heat consumption to renewable sources based on the share of renewables in gross production in order to perform the calculation at the final energy level.
METHODOLOGY FOR ADDITIONAL METRICS BEYOND THE MAIN INDICATOR
The amount of renewable energy consumption can be divided into three end uses to refer to the energy service for which the energy is consumed: electricity, heat, and transport. They are calculated from the energy balance and are defined as follows.
Electricity refers to the amounts of electricity consumed in the industry and other sectors. Electricity used in the transport sector is excluded from this aggregation. Electricity used for heat-raising purposes is included because o"cial data on final energy service are unavailable.
Heat refers to the amount of energy consumed for heat-raising purposes in industry and other sectors. It is not equivalent to the final energy end use service. It is also important to note that when used in the context of an end use, it does not refer to the same quantity as the energy product “Heat” in the energy balance, as used in the formula above.
Transport refers to the amounts of energy consumed in the transport sector. Most of this is used by railways and roads (and in some cases, pipeline transport). The amount of renewable electricity consumed in the transport sector is estimated based on the national annual shares of renewable electricity in gross production.
Methodology for indicator 7.b.1
Indicator 7.b.1 measures the installed renewable energy generating capacity in developing countries (in watts per capita) by dividing the maximum installed capacity of power plants that generate electricity from renewable energy sources at the year-end by the total population of a country at the mid-year. Data from IRENA are used to calculate the indicator.
IRENA’s electricity capacity database contains information about the electricity generating capacity installed at year-end, measured in MW. The data set covers all countries and areas from the year 2000 onwards. The data set also records whether the capacity is on-grid or o!-grid and is split into 36 di!erent renewable energy types that can be aggregated into the six main sources of renewable energy. For the population part of this indicator, IRENA uses population data from the United Nations World Population Prospects.
More detail on the methodology can be found in the SDG indicators metadata repository: https://unstats.un.org/sdgs/metadata/files/Metadata-07-0b-01.pdf
CHAPTER 3 • Renewable Energy 103
REFERENCES
C40 and UNEP (United Nations Environment Programme). 2016. Good Practice Guide: District Energy. C40, UNEP: London.
CHPA (China Heat Pump Association). 2019. Report on Development of Air Source Heat Pump Industry of China (2019). Beijing.
Cyprus, Republic of. 2015. Scheme for Promoting Saving and Upgrading of Households. Ministry of Energy, Commerce and Industry, Nicosia.
Darby, S., and T. Fawcett. 2018. “Energy Su!ciency: An Introduction.” EnergySu"ciency.org, https://www.energysu"ciency.org/static/media/uploads/site-8/library/papers/su"ciency-introduction-final-oct2018.pdf
Dumas, P., and L. Angelino. 2015. “GeoDH: Promote Geothermal District Heating Systems in Europe,” Proceedings of the World Geothermal Congress, April 19–25, 2015, Melbourne, Australia.
Energy and Water Agency (Malta). 2018, “Interaction between Photovoltaics and Solar Water Heaters in the Residential Sector.” https://www.odyssee-mure.eu/publications/policy-brief/pv-swh-interactions-residential-sector.pdf
EurObserv’ER. 2020. Policy and Statistic Reports. EurObserv’ER. https://www.eurobserv-er.org/eurobserver-policy-files-for-all-eu-28-member-states/
Hosier. R., J. Kappen, B. Hyseni, N. Tao, and K. Usui. 2017. “Scalable Business Model for Alternative Biomass Cooking Fuels and their Potential in Sub-Saharan Africa.” World Bank, Washington, DC.
IEA (International Energy Agency). 2018. “The Future of Cooling: Opportunities for Energy-E"cient Air Conditioning.” Technology report, Paris. https://www.iea.org/reports/the-future-of-cooling
IEA. 2019. Renewables 2019. Paris.
IEA. 2020a. Renewable Market Report—Analysis and Forecast to 2025. Paris. https://www.iea.org/reports/renewables-2020
IEA. 2020b. World Energy Statistics and Balances 2020 (database). Paris
IRENA. 2019a. Renewable Capacity Statistics 2019. Abu Dhabi
IRENA. 2019b. Innovation Landscape Brief: Time-of-Use Tari"s. Abu Dhabi.
IRENA. 2020a. Renewable Capacity Statistics 2020. Abu Dhabi.
IRENA. 2020b. Renewable Energy Statistics 2020. Abu Dhabi.
IRENA. 2021. Renewable Capacity Statistics 2021. Abu Dhabi.
IRENA Coalition for Action. 2021. Companies in Transition Towards 100 Percent Renewables: Focus on Heating And Cooling. Abu Dhabi.
IRENA, IEA, and REN21 (Renewable Energy Policy Network for the 21st Century). 2020. “Renewable Energy Policies in a Time of Transition: Heating and Cooling,” www.irena.org/-/media/Files/IRENA/Agency/Publication/2020/Nov/IRENA_IEA_REN21_Policies_Heating_Cooling_2020.pdf.
Lund, J. W., and A. N. Toth. 2020. “Direct Utilization of Geothermal Energy 2020 Worldwide Review,” Proceedings of the World Geothermal Congress 2020. https://www.geothermal-energy.org/pdf/IGAstandard/WGC/2020/01018.pdf
104 Tracking SDG 7: The Energy Progress Report 2021
Marignac, Y. 2019. Energy Su!ciency as Part of Climate Action. Climate Recon 2050: Dialogues on Pathways and Policy. https://climatedialogue.eu/sites/default/files/2019-12/CR2050_TD3_Technical_note_Su"ciency_20191218.pdf
Perlin, J. 2017. The Largest Solar Water Heater Plant Is in ... Denmark? Pacific Standard. https://psmag.com/environment/the-largest-solar-water-heater-plant-is-in-denmark-3516.
REN21 (Renewable Energy Policy Network for the 21st Century). 2018. Renewables 2018 Global Status Report. REN21 Secretariat, Paris.
REN21. 2020. Renewables 2020 Global Status Report. REN21 Secretariat, Paris.
Solar Thermal World. 2018. Rwanda Looks Forward to Second Phase of SolaRwanda. Solar Thermal World. https://www.solarthermalworld.org/news/rwanda-looks-forward-second-phase-solarwanda
UNSD (United Nations Statistics Division). 2020. Energy Balances 2018. New York.
Weiss, W., and M. Spörk-Dür. 2020. Solar Heat Worldwide: Global Market Development and Trends in 2019. IEA Solar Heating and Cooling Programme, Paris, and AEE–Institute for Sustainable Technologies, Gleisdorf, Austria.
Zhao, H., Y. Gao, and Z. Song. 2017. “Strategic Outlook of Heat Pump Development in China.” Presented at 12th IEA Heat Pump Conference, Rotterdam.