Embed Size (px)
Citation preview

8/3/2019 TPS Overview History
http://slidepdf.com/reader/full/tps-overview-history 1/58
2.810 T.G.Gutowski 10/29/01 1
The Toyota Production System
High Quality and Low Cost
Readings;
James Womack, Daniel T. Jones and Daniel Roos,The Machine that Changed the World, 1990, Ch 3 and 4
Kenneth N. McKay, “The Evolution of Manufacturing Control-
What Has Been, What Will Be” Working Paper 03 – 2001
Michael McCoby, “Is There a Best Way to Build a Car?” HBR Nov-Dec 1997
COST VSDEFECTS

8/3/2019 TPS Overview History
http://slidepdf.com/reader/full/tps-overview-history 2/58
2.810 T.G.Gutowski 10/29/01 2
Consumer Reports

8/3/2019 TPS Overview History
http://slidepdf.com/reader/full/tps-overview-history 3/58
2.810 T.G.Gutowski 10/29/01 3
September January - September
Units % Share DSR Vol
Current Year -Ago Current Year -Ago % Chg. Current Year -Ago % Chg.
Domestic Cars 431,496 481,318 35.3 37.3 -2.6 4,594,203 4 ,865,569 -5.6Import Cars 170,554 158,897 13.9 12.3 16.7 1,708,780 1,566,286 9.1
Total Cars 602,050 640,215 49.2 49.7 2.2 6,302,983 6 ,431,855 -2.0
Domestic Light Trucks 545,865 573,329 44.6 44.5 3.5 5,769,260 5,621,805 2.6
Import Light Trucks 75,999 75,575 6.2 5.9 9.3 798,656 711,178 12.3
Total Light Trucks 621,864 648,904 50.8 50.3 4.2 6,567,916 6,332,983 3.7
Domestic Light Vehicles 977,361 1,054,647 79.9 81.8 0.7 10,363,463 10,487,374 -1.2
Import Light Vehicles 246,553 234,472 20.1 18.2 14.3 2,507,436 2,277,464 10.1
Total Light Vehicles 1,223,914 1,289,119 100.0 100.0 3.2 12,870,899 12,764,838 0.8
Ward's U.S. Light Vehicle Sales Summary
Toyota vehicle sales
2002
8/3/2019 TPS Overview History
http://slidepdf.com/reader/full/tps-overview-history 4/58
2.810 T.G.Gutowski 10/29/01 4
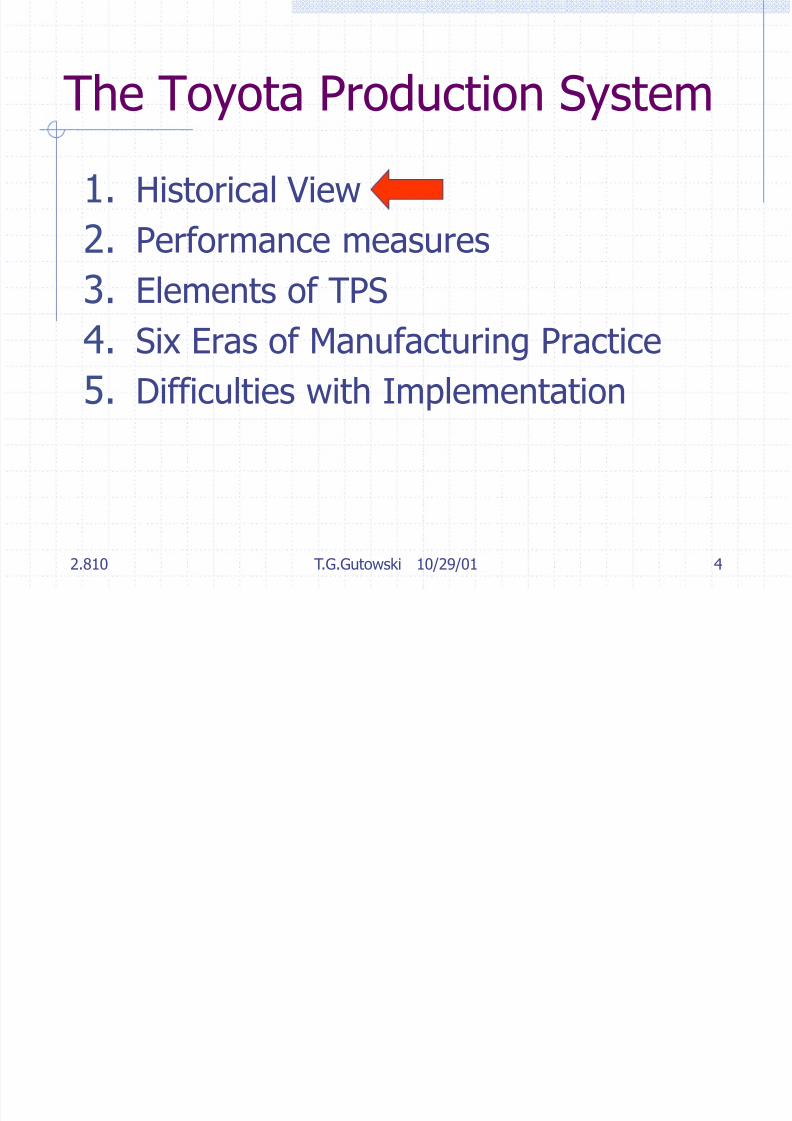
The Toyota Production System
1. Historical View
2. Performance measures
3. Elements of TPS
4. Six Eras of Manufacturing Practice
5. Difficulties with Implementation

8/3/2019 TPS Overview History
http://slidepdf.com/reader/full/tps-overview-history 5/58
2.810 T.G.Gutowski 10/29/01 5
Three Major Mfg Systemsfrom 1800 to 2000
1800 1900 2000
Machine tools, specialized machine tools, Taylorism, SPC, CNC, CAD/CAM
InterchangeableParts at U.S. Armories
MassProductionat Ford
ToyotaProductionSystem
8/3/2019 TPS Overview History
http://slidepdf.com/reader/full/tps-overview-history 6/58
2.810 T.G.Gutowski 10/29/01 6
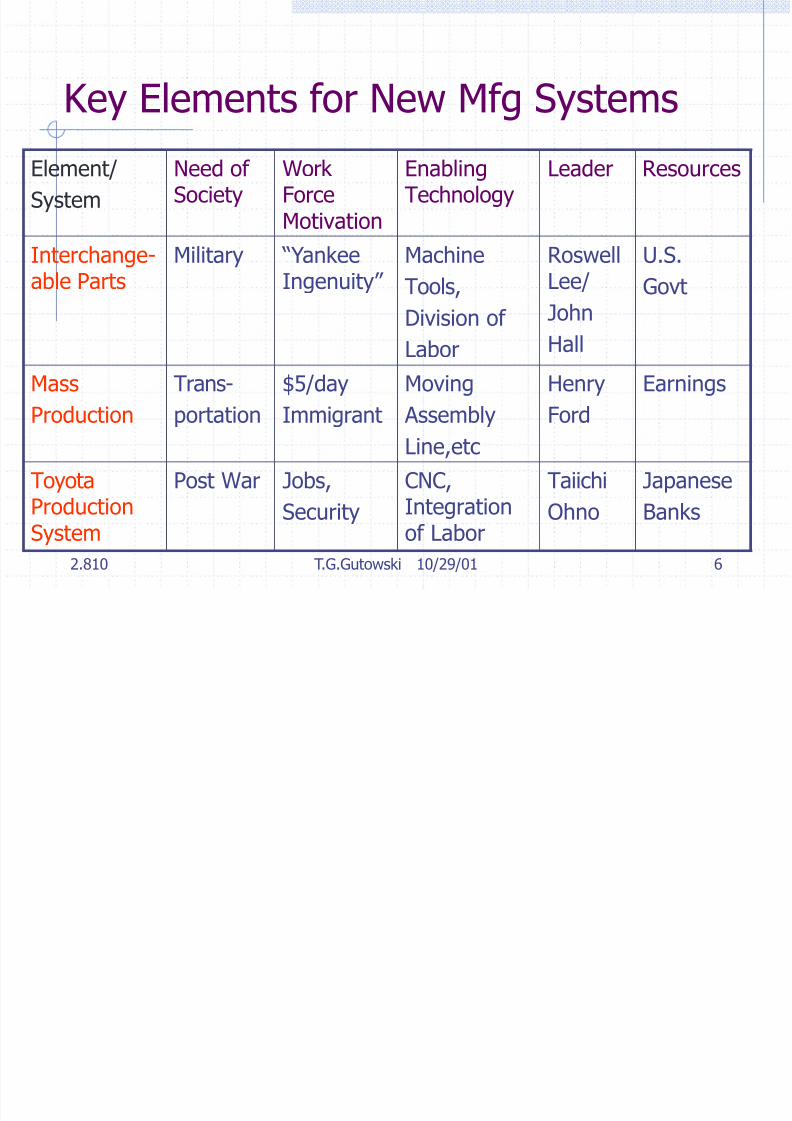
Key Elements for New Mfg Systems
Element/
System
Need of Society
Work ForceMotivation
EnablingTechnology
Leader Resources
Interchange-
able Parts
Military “Yankee
Ingenuity”
Machine
Tools,
Division of
Labor
Roswell
Lee/
John
Hall
U.S.
Govt
Mass
Production
Trans-
portation
$5/day
Immigrant
Moving
AssemblyLine,etc
Henry
Ford
Earnings
ToyotaProductionSystem
Post War Jobs,
Security
CNC,Integrationof Labor
Taiichi
Ohno
Japanese
Banks
8/3/2019 TPS Overview History
http://slidepdf.com/reader/full/tps-overview-history 7/58
2.810 T.G.Gutowski 10/29/01 7
Q. By what method did thesenew systems come about?
A. Trail and Error
8/3/2019 TPS Overview History
http://slidepdf.com/reader/full/tps-overview-history 8/58
2.810 T.G.Gutowski 10/29/01 8
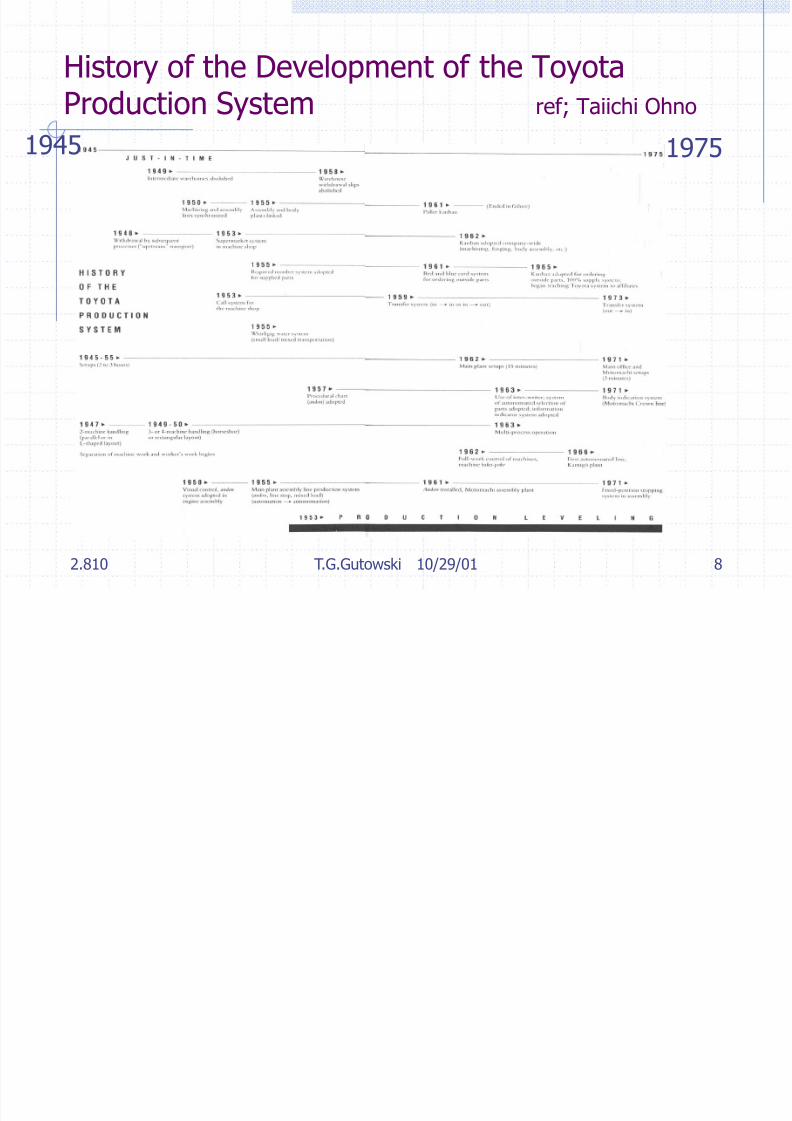
History of the Development of the ToyotaProduction System ref; Taiichi Ohno
1945 1975

8/3/2019 TPS Overview History
http://slidepdf.com/reader/full/tps-overview-history 9/58
2.810 T.G.Gutowski 10/29/01 9
The Toyota Production System
1. Historical View
2. Performance measures
3. Elements of TPS
4. Six Eras of Manufacturing Practice
5. Difficulties with Implementation
8/3/2019 TPS Overview History
http://slidepdf.com/reader/full/tps-overview-history 10/58
2.810 T.G.Gutowski 10/29/01 10
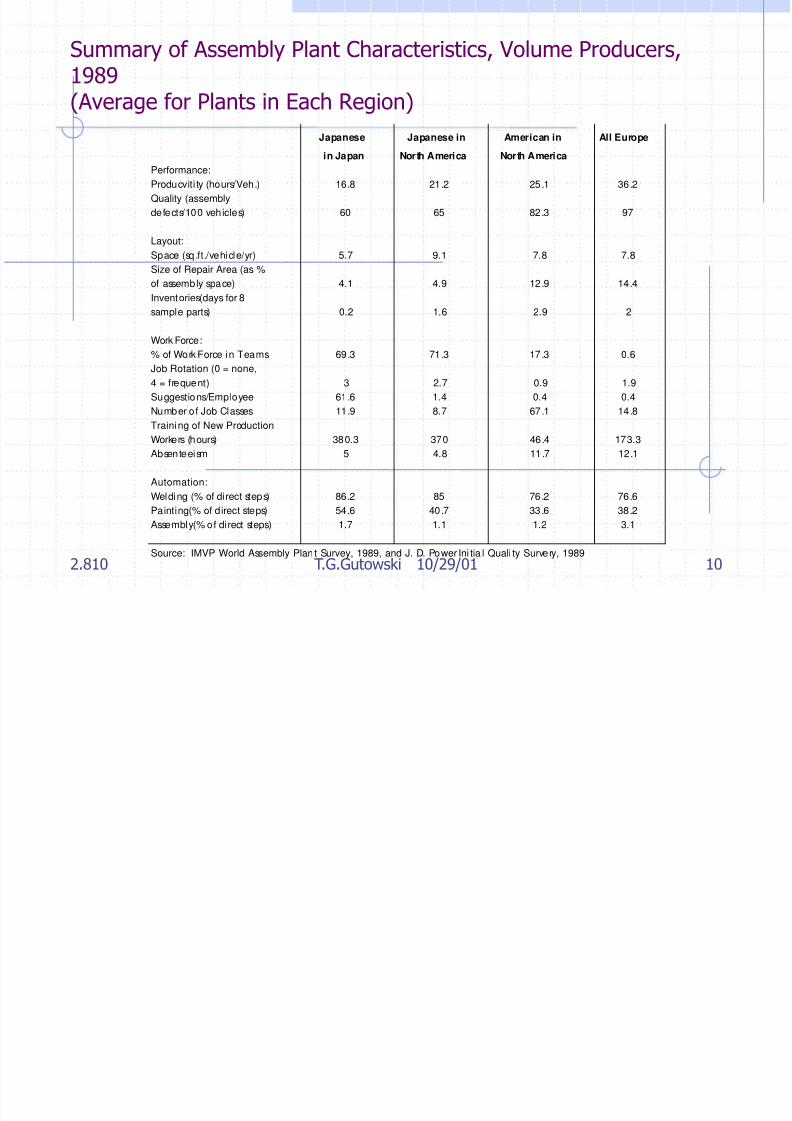
Japanese Japanese in American in All Europe
in Japan North America North America
Performance:
Producviti ty (hours/Veh.) 16.8 21.2 25.1 36.2
Quality (assembly
defects/100 vehicles) 60 65 82.3 97
Layout:
Space (sq.ft./vehicle/yr) 5.7 9.1 7.8 7.8
Size of Repair Area (as %
of assembly space) 4.1 4.9 12.9 14.4
Inventories(days for 8
sample parts) 0.2 1.6 2.9 2
Work Force:
% of Work Force in Teams 69.3 71.3 17.3 0.6
Job Rotation (0 = none,
4 = frequent) 3 2.7 0.9 1.9
Suggestions/Employee 61.6 1.4 0.4 0.4
Number of Job Classes 11.9 8.7 67.1 14.8Training of New Production
Workers (hours) 380.3 370 46.4 173.3
Absenteeism 5 4.8 11.7 12.1
Automation:
Welding (% of direct steps) 86.2 85 76.2 76.6
Painting(% of direct steps) 54.6 40.7 33.6 38.2
Assembly(% of di rect steps) 1.7 1.1 1.2 3.1
Source: IMVP World Assembly Plan t Survey, 1989, and J. D. Power Ini tia l Quali ty Survery, 1989
Summary of Assembly Plant Characteristics, Volume Producers,1989(Average for Plants in Each Region)
8/3/2019 TPS Overview History
http://slidepdf.com/reader/full/tps-overview-history 11/58
2.810 T.G.Gutowski 10/29/01 11
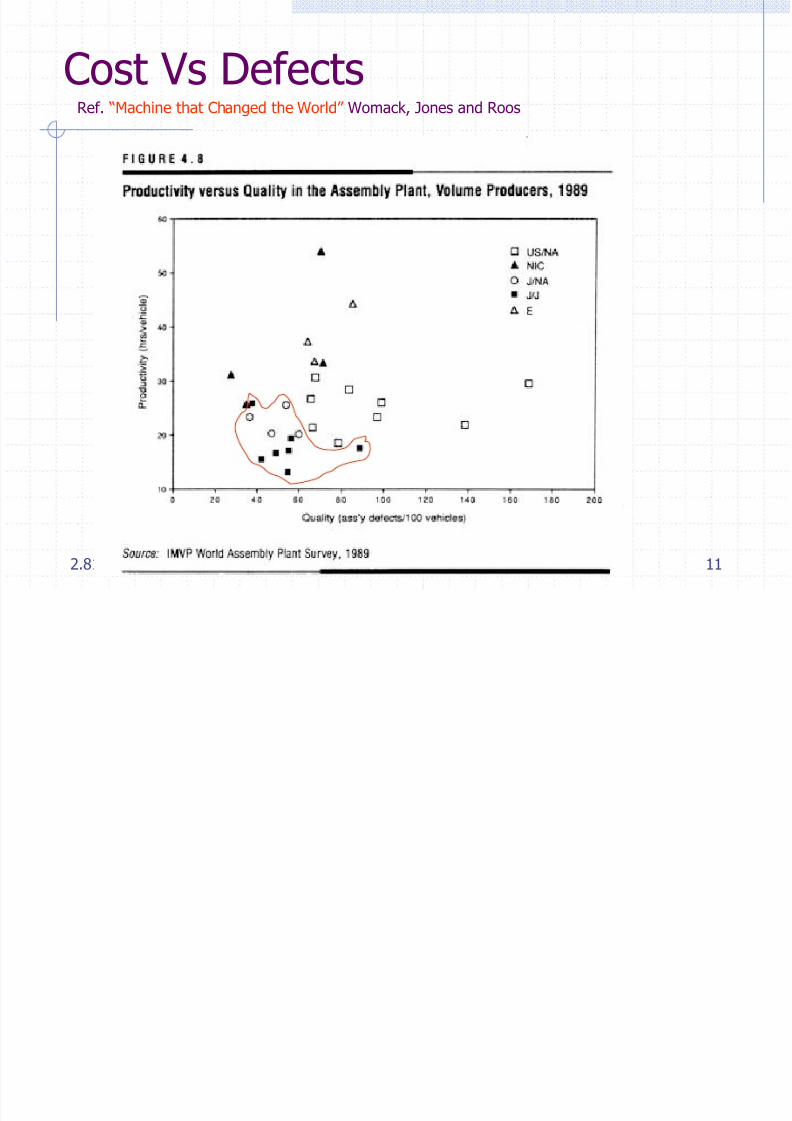
Cost Vs DefectsRef. “Machine that Changed the World” Womack, Jones and Roos
8/3/2019 TPS Overview History
http://slidepdf.com/reader/full/tps-overview-history 12/58
2.810 T.G.Gutowski 10/29/01 12
The Toyota Production System
1. Historical View
2. Performance measures
3. Elements of TPS
4. Six Eras of Manufacturing Practice
5. Difficulties with Implementation

8/3/2019 TPS Overview History
http://slidepdf.com/reader/full/tps-overview-history 13/58
2.810 T.G.Gutowski 10/29/01 13
How do you get this kind of performance?
1. Womack, Jones and Roos
2. J T. Black’s 10 Steps
3. Demand Flow Technology’s 9 Points
4. MSDD, D. Cochran and Students

8/3/2019 TPS Overview History
http://slidepdf.com/reader/full/tps-overview-history 14/58
2.810 T.G.Gutowski 10/29/01 14
Womack Jones and Roos
Automation? Yes, but….
DFM? Probably
Standardized Production? No!
Lean Characteristics? Integration of Tasks
Identification and removal of defects
8/3/2019 TPS Overview History
http://slidepdf.com/reader/full/tps-overview-history 15/58
2.810 T.G.Gutowski 10/29/01 15
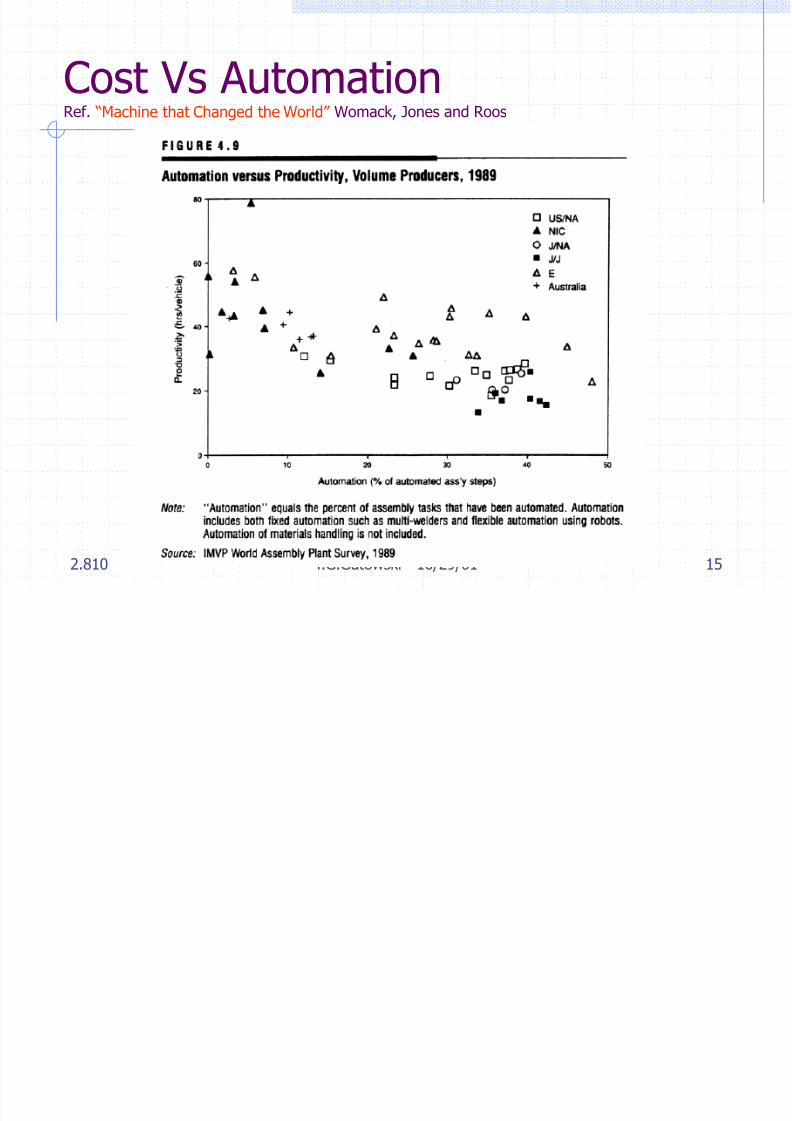
Cost Vs AutomationRef. “Machine that Changed the World” Womack, Jones and Roos

8/3/2019 TPS Overview History
http://slidepdf.com/reader/full/tps-overview-history 16/58
2.810 T.G.Gutowski 10/29/01 16
J T. Black’s 10 Steps Ref; JT. Black “Factory with a Future” 1991
1. Form cells
2. Reduce setup
3. Integrate quality control
4. Integrate preventive maintenance5. Level and balance
6. Link cells – KANBAN
7. Reduce WIP
8. Build vendor programs9. Automate
10. Computerize

8/3/2019 TPS Overview History
http://slidepdf.com/reader/full/tps-overview-history 17/58
2.810 T.G.Gutowski 10/29/01 17
Demand Flow Technology’s9 Points
1. Product Synchronization
2. Mixed Model Process Maps
3. Sequence of Events
4. Demand at Capacity
5. Operational Cycle Time
6. Total Product Cycle Time
7. Line Balancing8. Kanbans
9. Operational Method Sheets
8/3/2019 TPS Overview History
http://slidepdf.com/reader/full/tps-overview-history 18/58
2.810 T.G.Gutowski 10/29/01 18
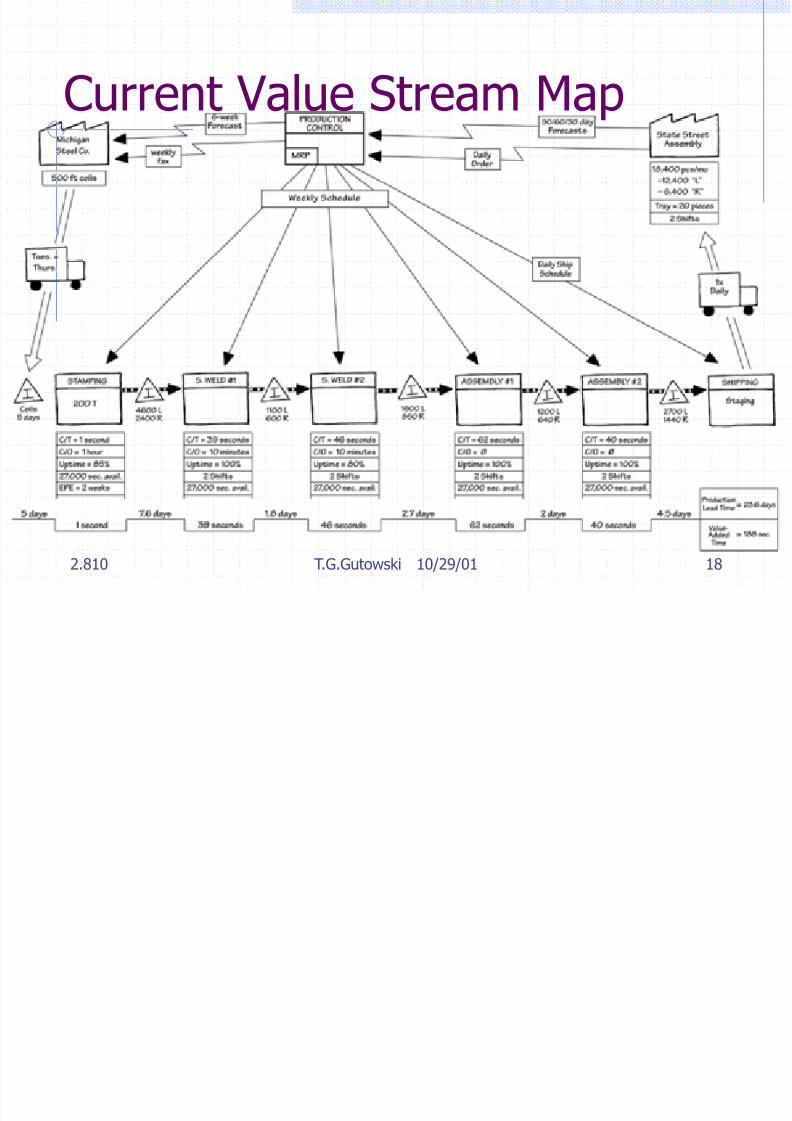
Current Value Stream Map
8/3/2019 TPS Overview History
http://slidepdf.com/reader/full/tps-overview-history 19/58
2.810 T.G.Gutowski 10/29/01 19
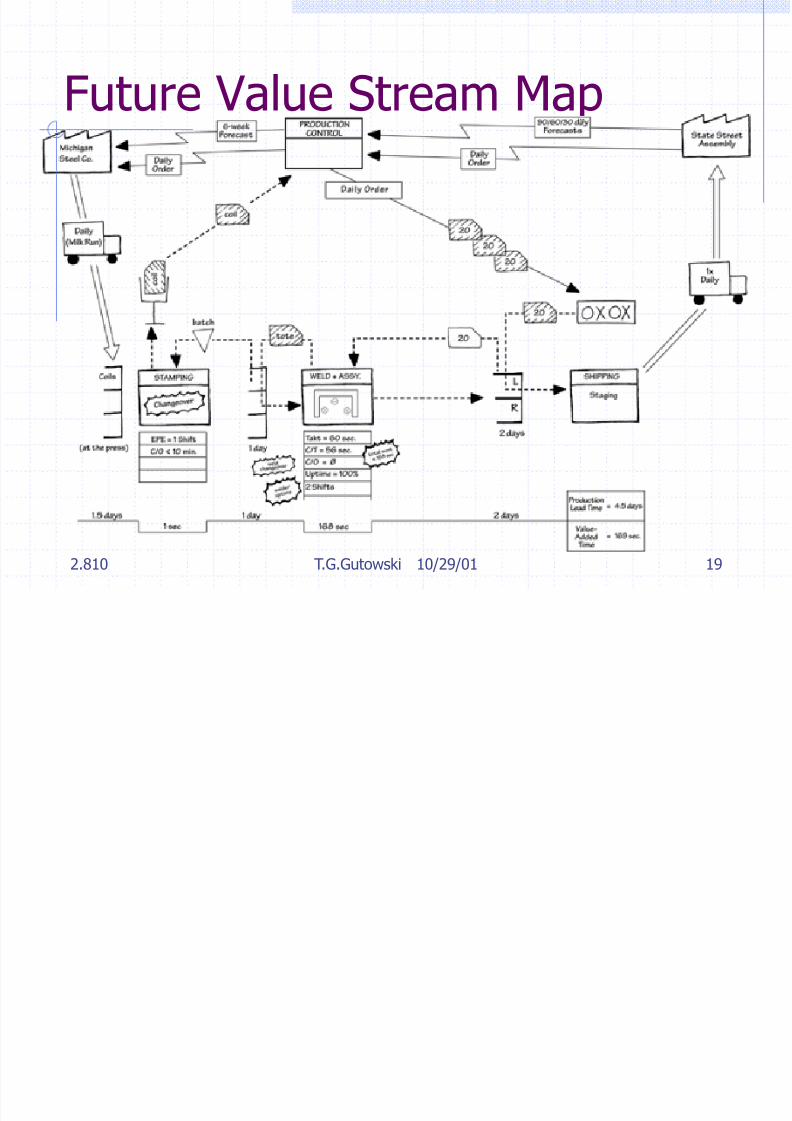
Future Value Stream Map

8/3/2019 TPS Overview History
http://slidepdf.com/reader/full/tps-overview-history 20/58
2.810 T.G.Gutowski 10/29/01 20
Manufacturing System DesignDecomposition (MSDD)
ROI
Sales Costs Investments
Lower level actions
quality predictable output delay reduction
- s resolving problems s m
8/3/2019 TPS Overview History
http://slidepdf.com/reader/full/tps-overview-history 21/58
2.810 T.G.Gutowski 10/29/01 21
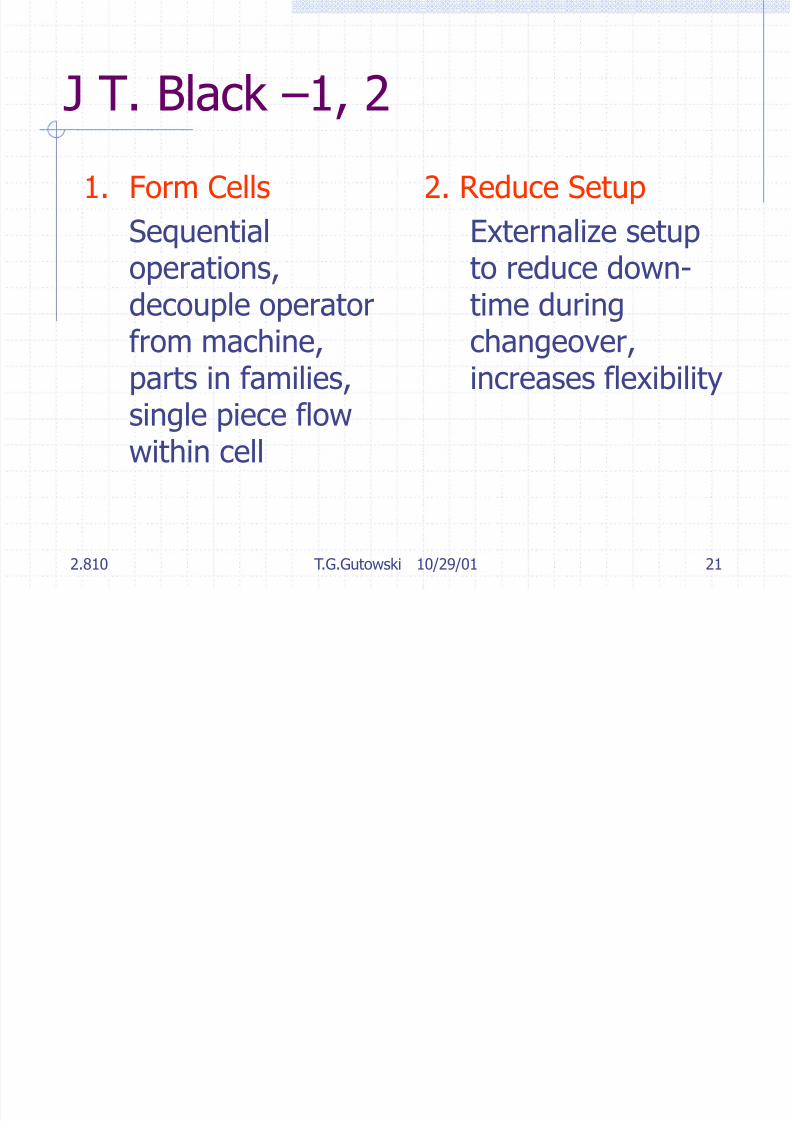
J T. Black –1, 2
1. Form Cells
Sequential
operations,decouple operatorfrom machine,parts in families,
single piece flowwithin cell
2. Reduce Setup
Externalize setup
to reduce down-time duringchangeover,increases flexibility
8/3/2019 TPS Overview History
http://slidepdf.com/reader/full/tps-overview-history 22/58
2.810 T.G.Gutowski 10/29/01 22
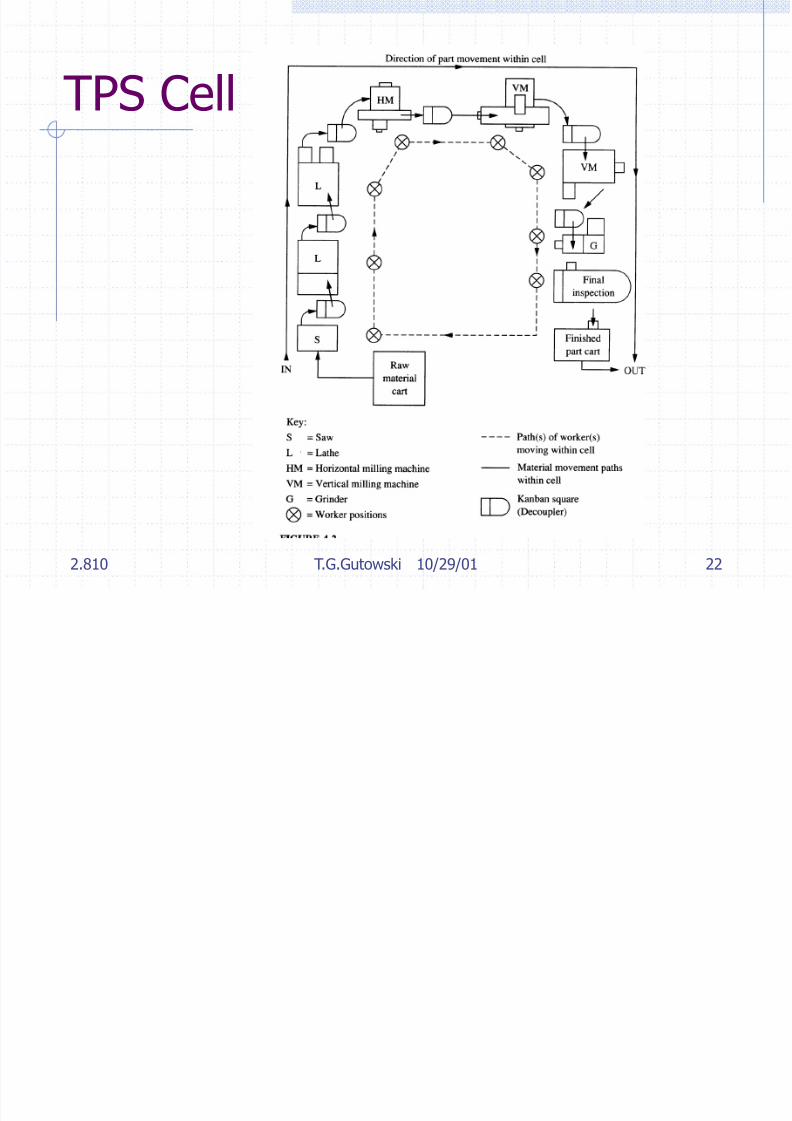
TPS Cell
8/3/2019 TPS Overview History
http://slidepdf.com/reader/full/tps-overview-history 23/58
2.810 T.G.Gutowski 10/29/01 23
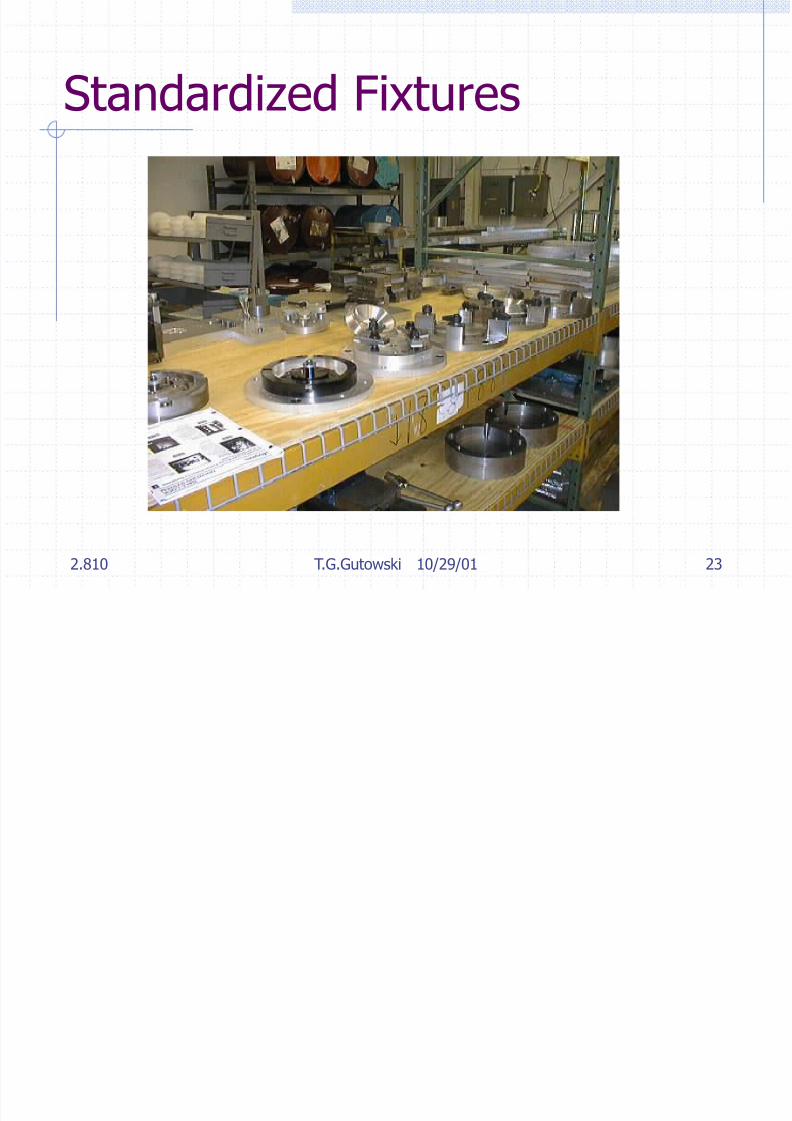
Standardized Fixtures
8/3/2019 TPS Overview History
http://slidepdf.com/reader/full/tps-overview-history 24/58
2.810 T.G.Gutowski 10/29/01 24
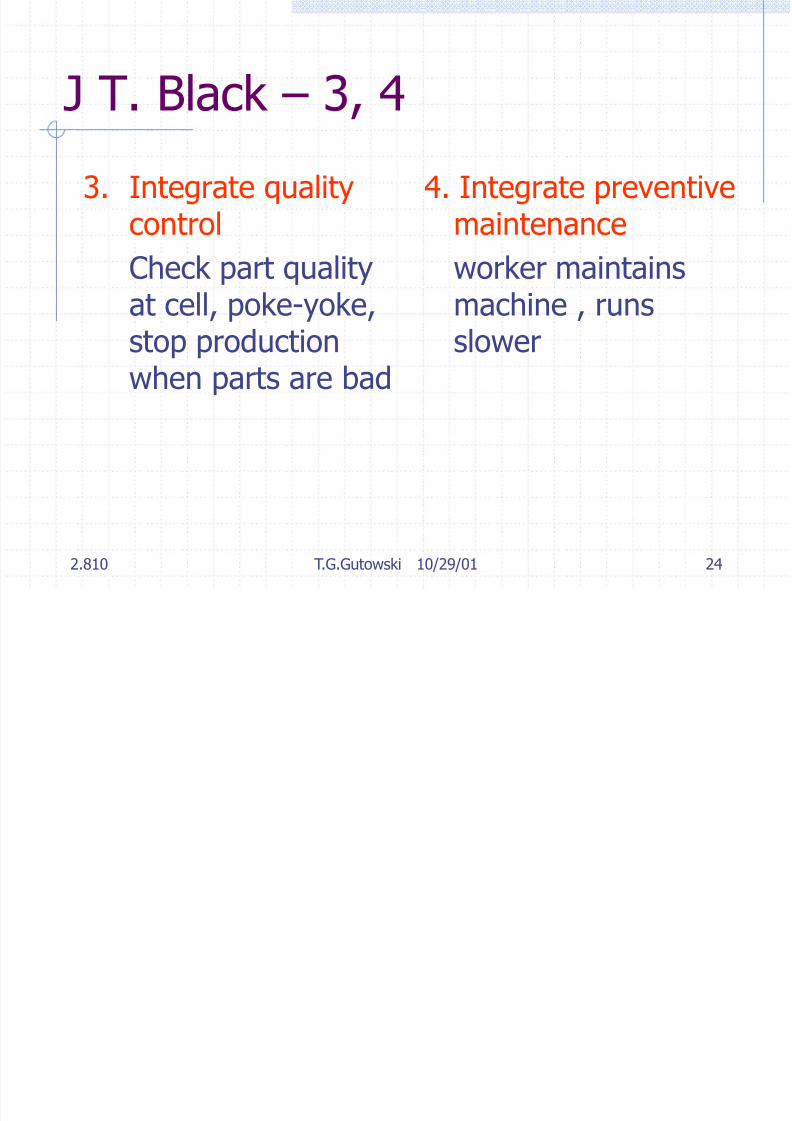
J T. Black – 3, 4
3. Integrate qualitycontrol
Check part qualityat cell, poke-yoke,stop productionwhen parts are bad
4. Integrate preventivemaintenance
worker maintainsmachine , runsslower

8/3/2019 TPS Overview History
http://slidepdf.com/reader/full/tps-overview-history 25/58
2.810 T.G.Gutowski 10/29/01 25
J T. Black – 5, 6
5. Level and balance
Produce to Takt
time, reduce batchsizes, smoothproduction flow
6. Link cells- Kanban
Create “pull”
system – “Supermarket” System
8/3/2019 TPS Overview History
http://slidepdf.com/reader/full/tps-overview-history 26/58
2.810 T.G.Gutowski 10/29/01 26
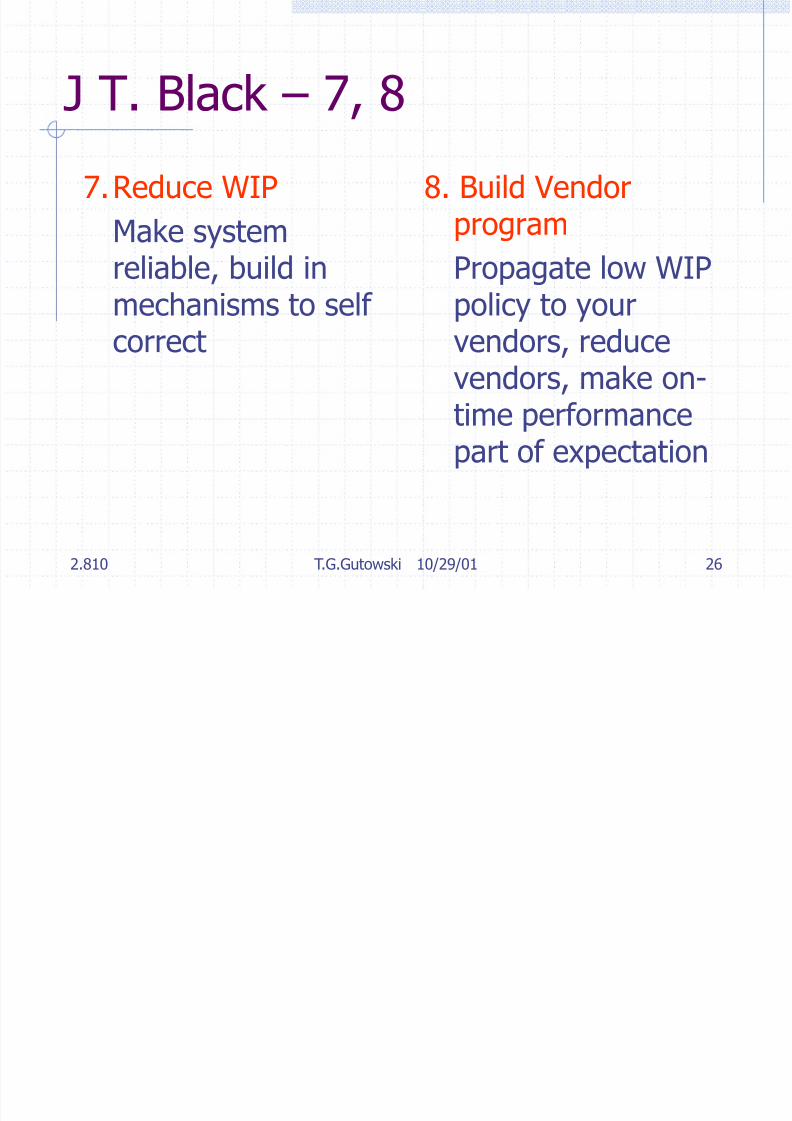
J T. Black – 7, 8
7. Reduce WIP
Make system
reliable, build inmechanisms to self correct
8. Build Vendorprogram
Propagate low WIPpolicy to yourvendors, reducevendors, make on-
time performancepart of expectation

8/3/2019 TPS Overview History
http://slidepdf.com/reader/full/tps-overview-history 27/58
2.810 T.G.Gutowski 10/29/01 27
Manufacturing System DesignDecomposition (MSDD)
ROI
Sales Costs Investments
Lower level actions
quality predictable output delay reduction
- s resolving problems s m

8/3/2019 TPS Overview History
http://slidepdf.com/reader/full/tps-overview-history 28/58
2.810 T.G.Gutowski 10/29/01 28
Example from Cochran – Minimize production disruptions
DP - P1 Predictable production resources (people, equipment, info) FR - P1 Minimize production disruptions
FR - P12 Ensure
predictable
equipment
output FR - P11 Ensure
availability of
relevant
production
information
FR - P14 Ensure
material
availability FR - P13 Ensure
predictable
worker output
DP - P12 Maintenance of
equipment
reliability DP - P11 Capable and
reliable
information system
DP - P14 Standard
material
replenishment
system DP - P13 Motivated
work - force
performing
standardized
work FR - P133 Do not interrupt
production for
worker
allowances FR - P131 Reduce
variability of
task completion
time DP - P133 Mutual Relief
System with
cross - trained
workers DP - P131 Standard work
methods to
provide
repeatableprocessing time
FR - P132 Ensure
availability of
workers DP - P132 Perfect
Attendance
Program DP - P142 Parts moved to
downstream
operations
according to
pitch
FR - P142 Ensure proper
timing of part
arrivals DP - P141 Standard work
in process
between sub - systems
FR - P141 Ensure that
parts are
available to the
material
handlers FR - P121 Ensure that
equipment is
easily
serviceable DP - P121 Machines
designed for
serviceability
FR - P122 Service
equipment
regularly DP - P122 Regular
preventative
maintenance
program
8/3/2019 TPS Overview History
http://slidepdf.com/reader/full/tps-overview-history 29/58
2.810 T.G.Gutowski 10/29/01 29
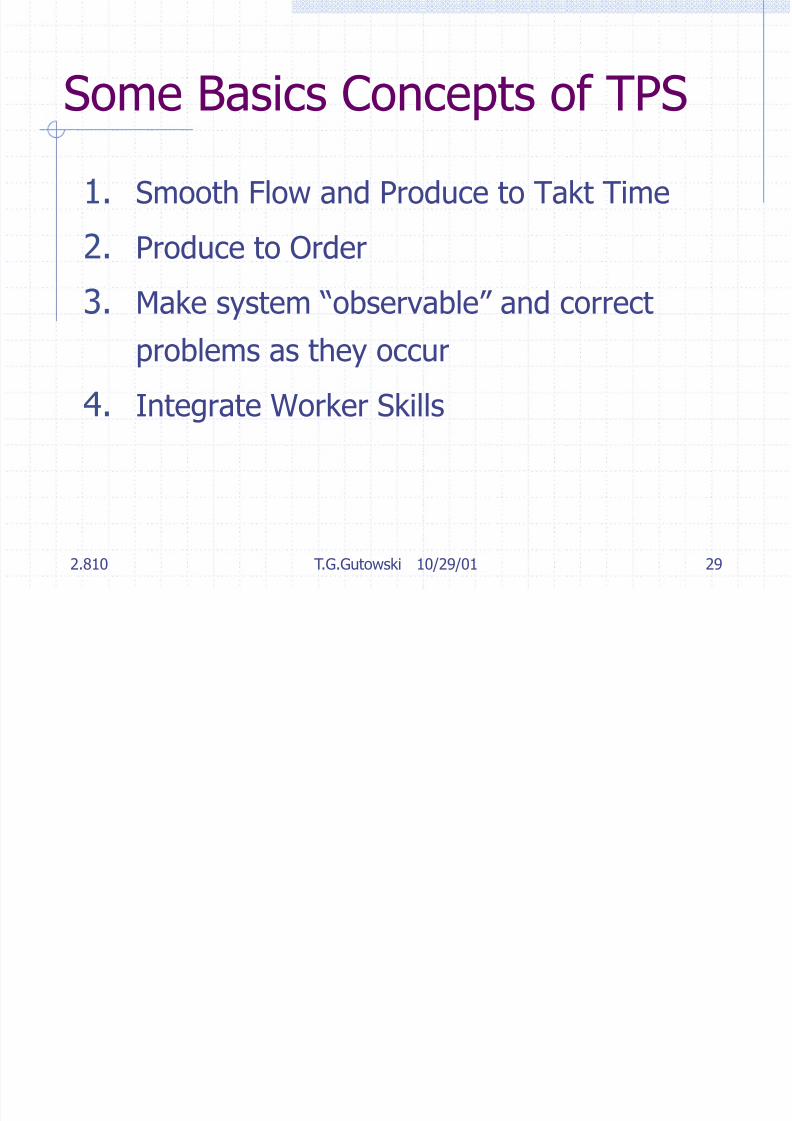
Some Basics Concepts of TPS
1. Smooth Flow and Produce to Takt Time
2. Produce to Order
3. Make system “observable” and correct
problems as they occur
4. Integrate Worker Skills

8/3/2019 TPS Overview History
http://slidepdf.com/reader/full/tps-overview-history 30/58
2.810 T.G.Gutowski 10/29/01 30
Two Examples;
1.Takt Time
2.Pull Systems
T kt Ti

8/3/2019 TPS Overview History
http://slidepdf.com/reader/full/tps-overview-history 31/58
2.810 T.G.Gutowski 10/29/01 31
Takt Time – to pace production
DemandProduct
TimeAvailableTimeTakt
Calculate Takt Time per month, day,
year etc. Available time includes allshifts, and excludes all non-productive time (e.g. lunch, clean-upetc). Product demand includes over-
production for low yields etc.

8/3/2019 TPS Overview History
http://slidepdf.com/reader/full/tps-overview-history 32/58
2.810 T.G.Gutowski 10/29/01 32
Takt Time
Automobile Assembly Line; Available time = 7.5 hr
X 3 shifts = 22.5 hrs or 1350 minutes per day.
Demand = 1600 cars per day. Takt Time = 51 sec
Aircraft Engine Assembly Line; 500 engines per
year. 2 shifts X 7 hrs => 14 hrs/day X 250 day/year
= 3500hrs.Takt time = 7 hrs.

8/3/2019 TPS Overview History
http://slidepdf.com/reader/full/tps-overview-history 33/58
2.810 T.G.Gutowski 10/29/01 33
Engines shipped over a 3 monthperiod at aircraft engine factory “B”
0
2
4
6
8
10
12
7-Jun 15-J un 23-J un 30- Jun 7-J ul 15- Jul 24-J ul 31-J ul 7-A ug 15-A ug 24- Aug 31-A ug
Weeks
month 1 month 2 month 3

8/3/2019 TPS Overview History
http://slidepdf.com/reader/full/tps-overview-history 34/58
2.810 T.G.Gutowski 10/29/01 34
Engines shipped over a 3 monthperiod at aircraft engine factory “C”
0
1
2
3
4
5
6
7
may june july august
weeks
O ti f f
8/3/2019 TPS Overview History
http://slidepdf.com/reader/full/tps-overview-history 35/58
2.810 T.G.Gutowski 10/29/01 35
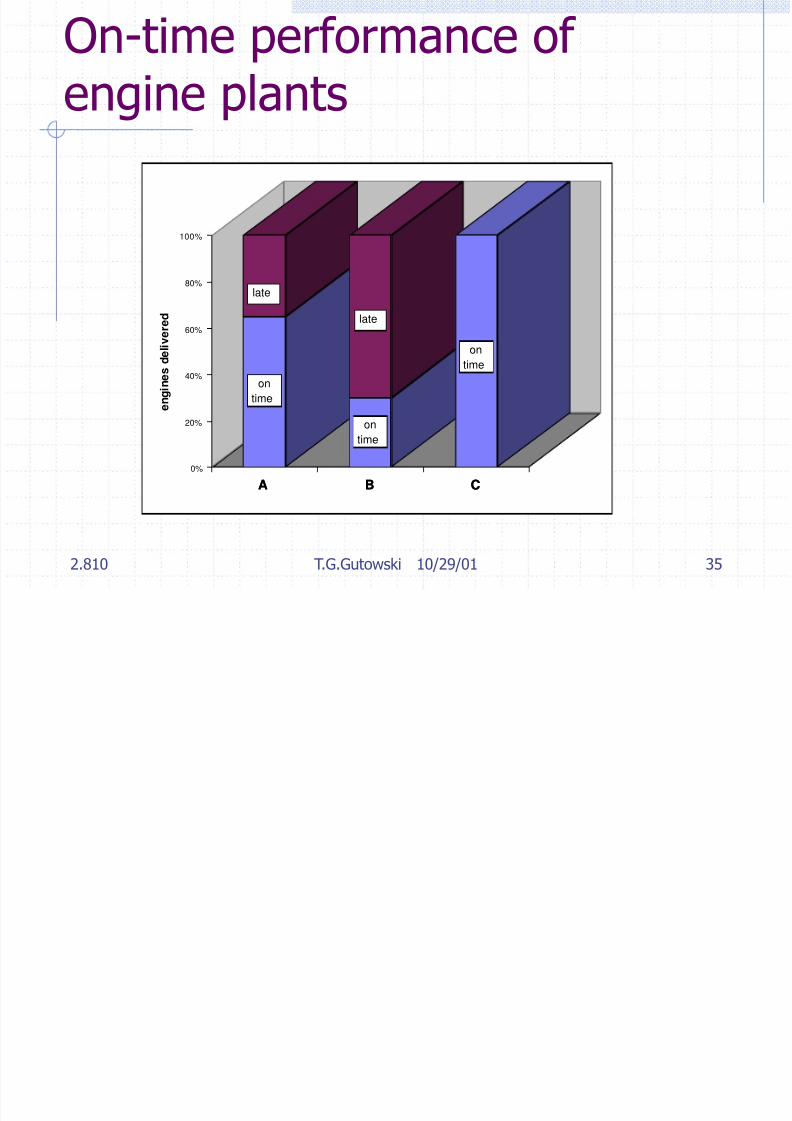
On-time performance of engine plants
A B C
0%
20%
40%
60%
80%
100%
e n g i n e s
d e l i v e r e d
A B C
on
time
late
on
time
on
time
late
8/3/2019 TPS Overview History
http://slidepdf.com/reader/full/tps-overview-history 36/58
2.810 T.G.Gutowski 10/29/01 36
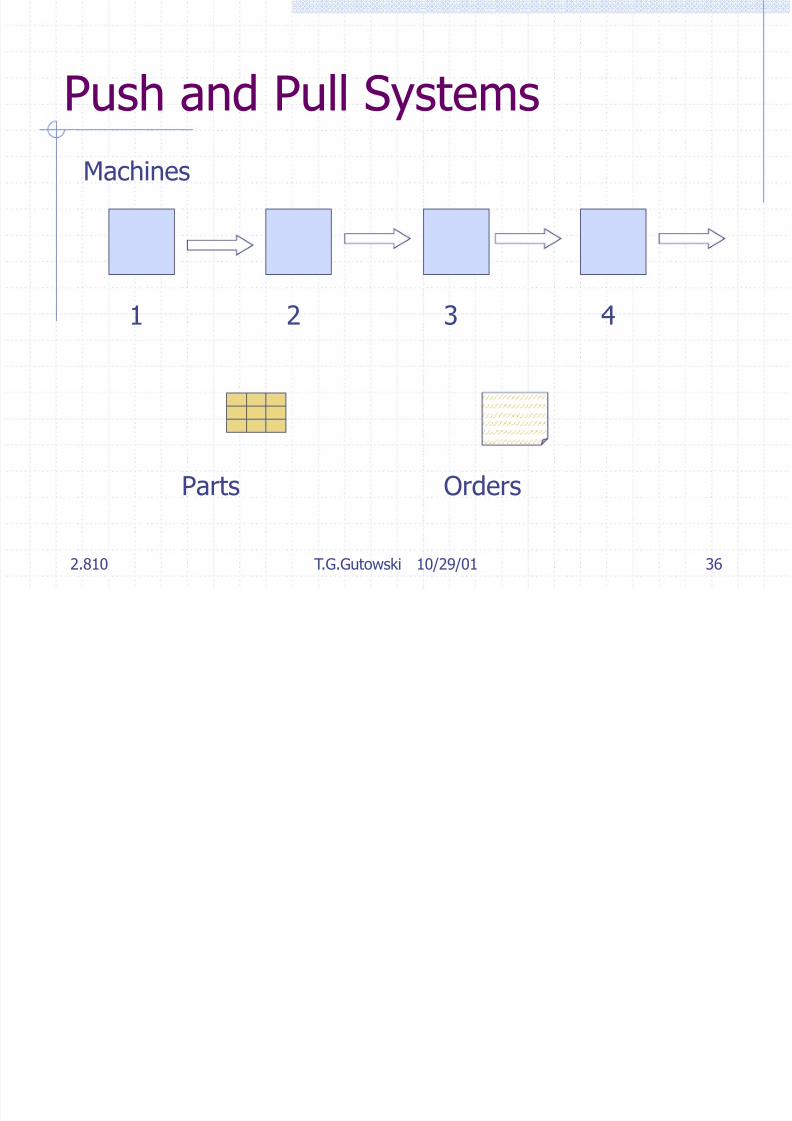
Push and Pull Systems
Machines
Parts Orders
1 2 3 4
P sh S stems
8/3/2019 TPS Overview History
http://slidepdf.com/reader/full/tps-overview-history 37/58
2.810 T.G.Gutowski 10/29/01 37
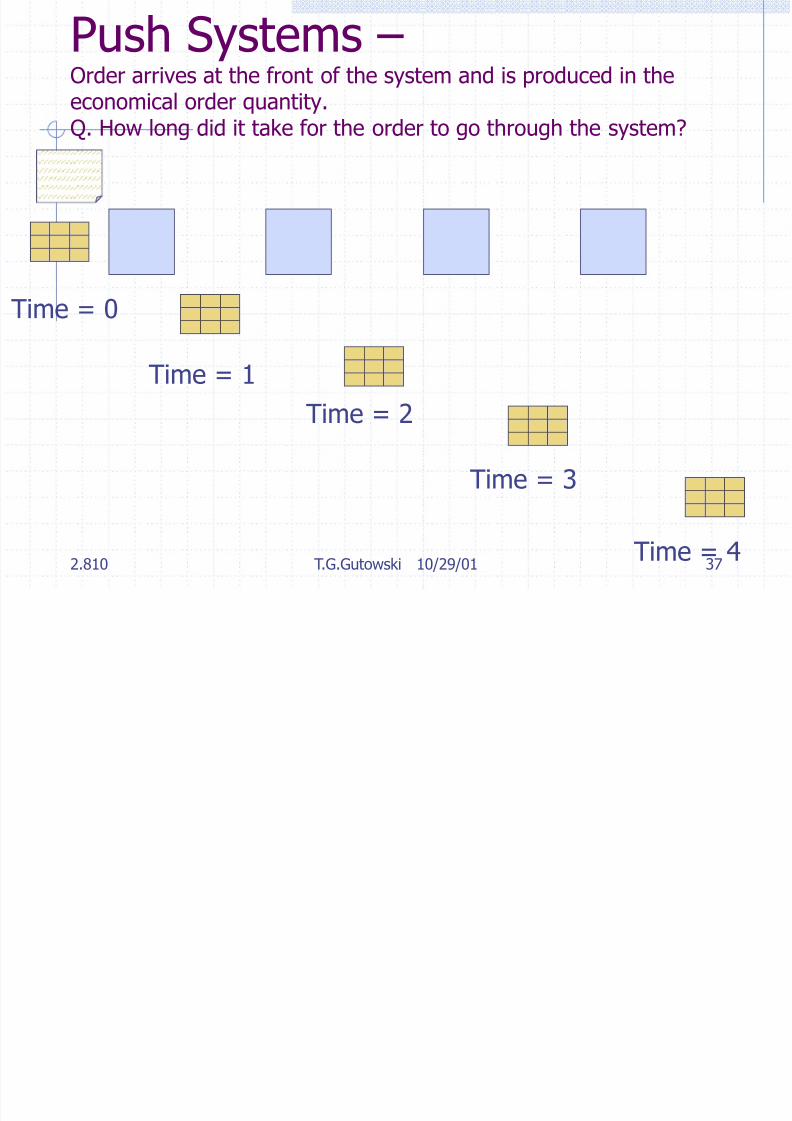
Push Systems – Order arrives at the front of the system and is produced in theeconomical order quantity.Q. How long did it take for the order to go through the system?
Time = 3
Time = 2
Time = 4
Time = 1
Time = 0
P ll S t
8/3/2019 TPS Overview History
http://slidepdf.com/reader/full/tps-overview-history 38/58
2.810 T.G.Gutowski 10/29/01 38
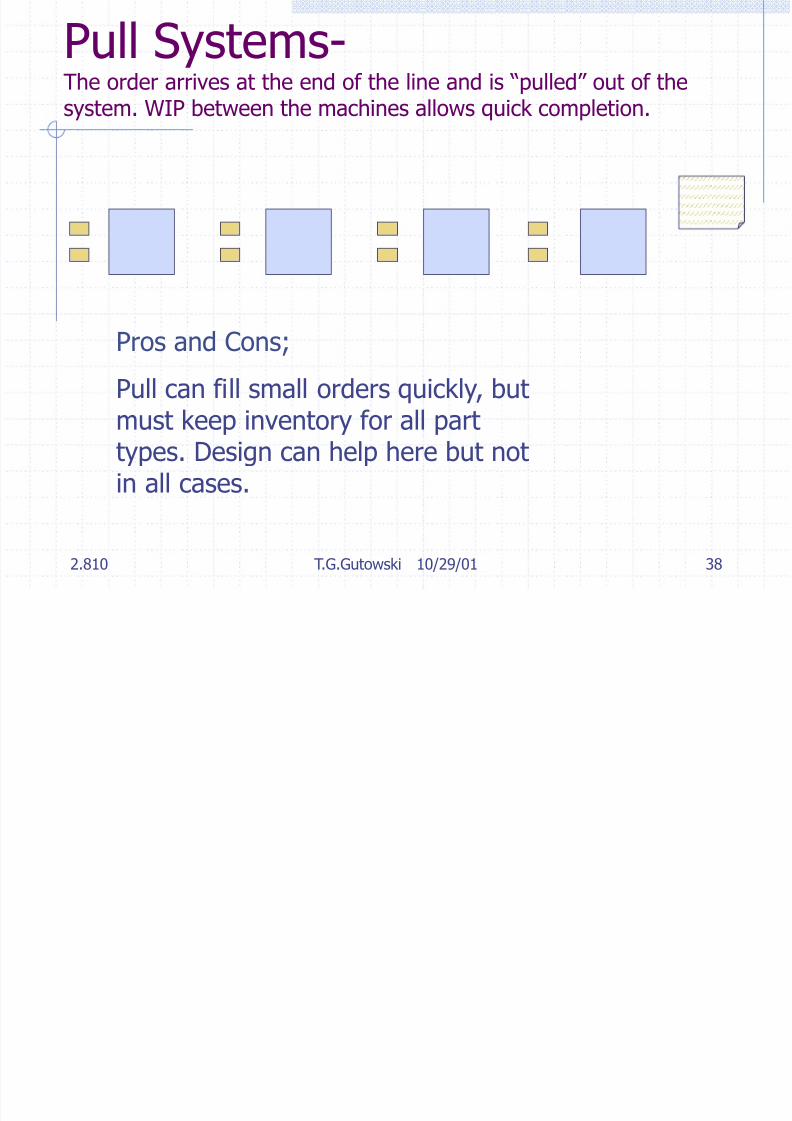
Pull Systems-The order arrives at the end of the line and is “pulled” out of thesystem. WIP between the machines allows quick completion.
Pros and Cons;
Pull can fill small orders quickly, but
must keep inventory for all parttypes. Design can help here but notin all cases.
8/3/2019 TPS Overview History
http://slidepdf.com/reader/full/tps-overview-history 39/58
2.810 T.G.Gutowski 10/29/01 39
Comparison in delivery times
If the process time per part is “t”, and thebatch size is “n”, it takes “Nnt” time to
process a batch through “N” steps. Todeliver one part it takes;
“Nnt” time from a push system plus
setup and transportation delays, and “t” for a pull system.
See HP Video

8/3/2019 TPS Overview History
http://slidepdf.com/reader/full/tps-overview-history 40/58
2.810 T.G.Gutowski 10/29/01 40
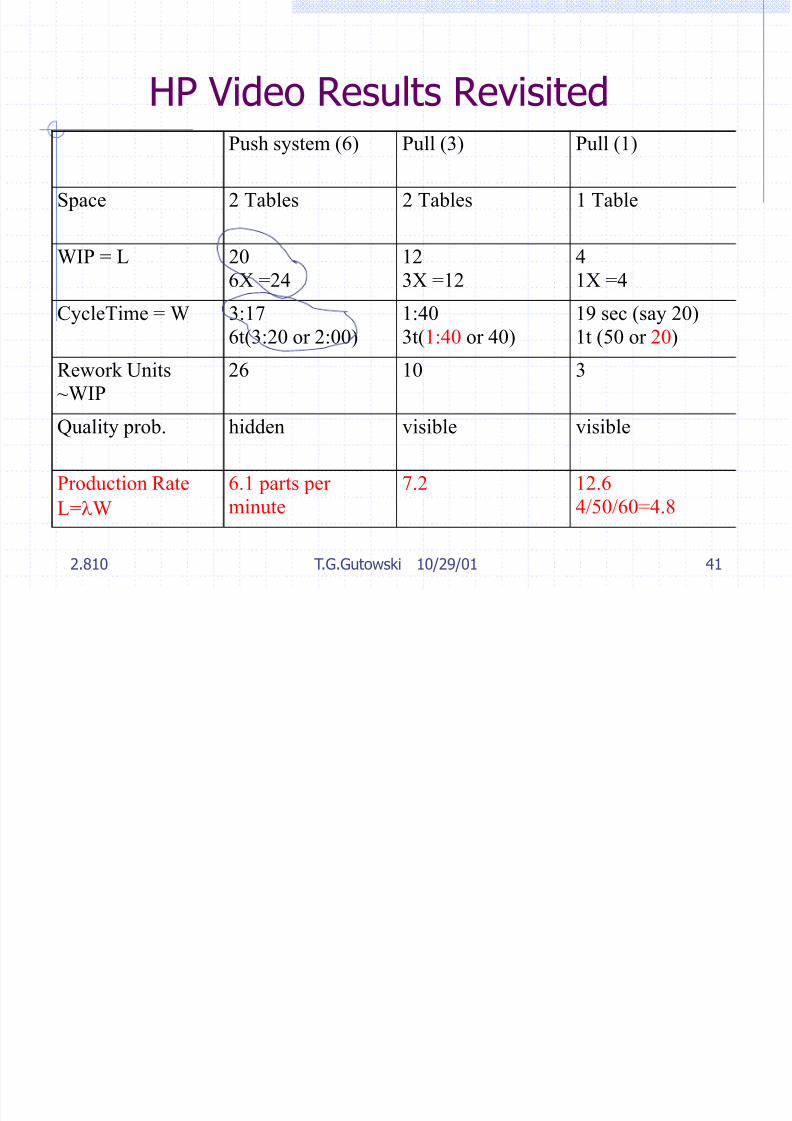
HP Video Results
Push system (6) Pull (3) Pull (1)
Space 2 Tables 2 Tables 1 Table
WIP 20 12 4
CycleTime 3:17 1:40 19 sec
Rework Units 26 10 3
Quality prob. hidden visible visible
Production Rate
L=W
6.1 parts per
minute
7.2 12.6
8/3/2019 TPS Overview History
http://slidepdf.com/reader/full/tps-overview-history 41/58
2.810 T.G.Gutowski 10/29/01 41
HP Video Results Revisited
Push system (6) Pull (3) Pull (1)
Space 2 Tables 2 Tables 1 Table
WIP = L 20
6X =24
12
3X =12
4
1X =4CycleTime = W 3:17
6t(3:20 or 2:00)
1:40
3t(1:40 or 40)
19 sec (say 20)
1t (50 or 20)
Rework Units
~WIP
26 10 3
Quality prob. hidden visible visible
Production Rate
L=W
6.1 parts per
minute
7.2 12.6
4/50/60=4.8
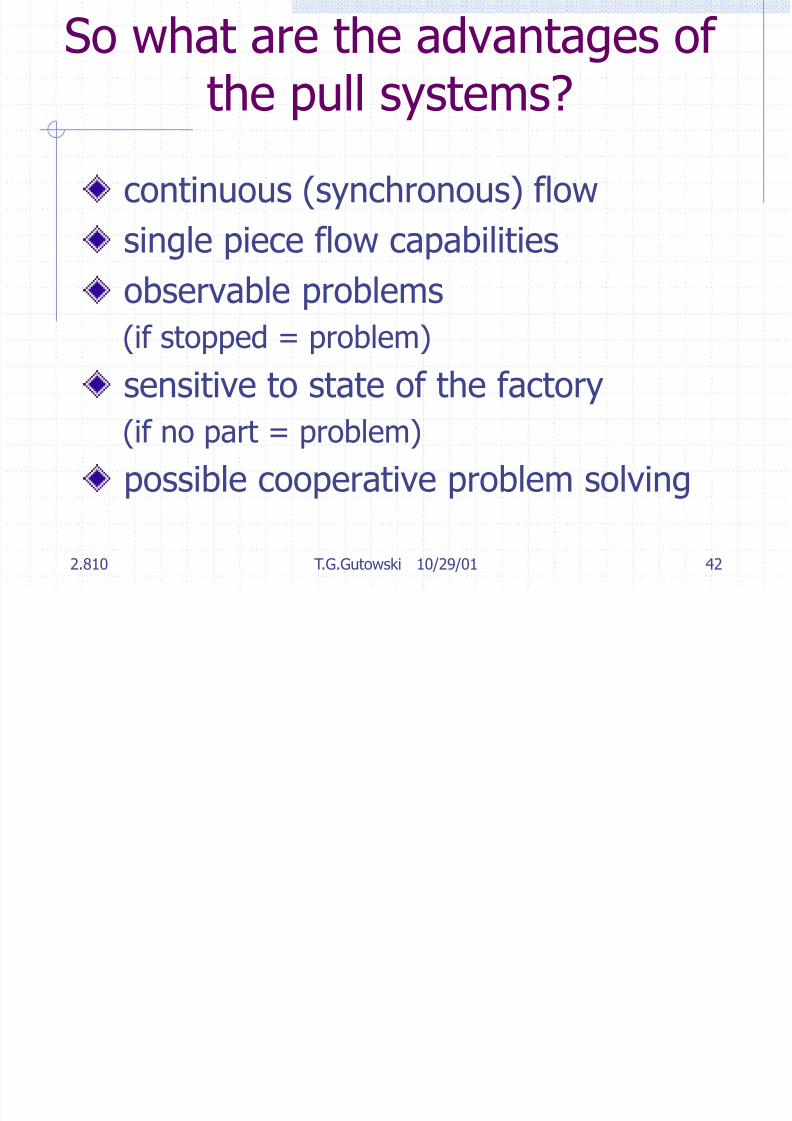
So what are the advantages of
8/3/2019 TPS Overview History
http://slidepdf.com/reader/full/tps-overview-history 42/58
2.810 T.G.Gutowski 10/29/01 42
So what are the advantages of the pull systems?
continuous (synchronous) flow
single piece flow capabilities
observable problems(if stopped = problem)
sensitive to state of the factory
(if no part = problem)
possible cooperative problem solving

8/3/2019 TPS Overview History
http://slidepdf.com/reader/full/tps-overview-history 43/58
2.810 T.G.Gutowski 10/29/01 43
The Toyota Production System
1. Historical View
2. Performance measures
3. Elements of TPS
4. Six Eras of Manufacturing Practice
5. Difficulties with Implementation
Six Eras of Manufacturing
8/3/2019 TPS Overview History
http://slidepdf.com/reader/full/tps-overview-history 44/58
2.810 T.G.Gutowski 10/29/01 44
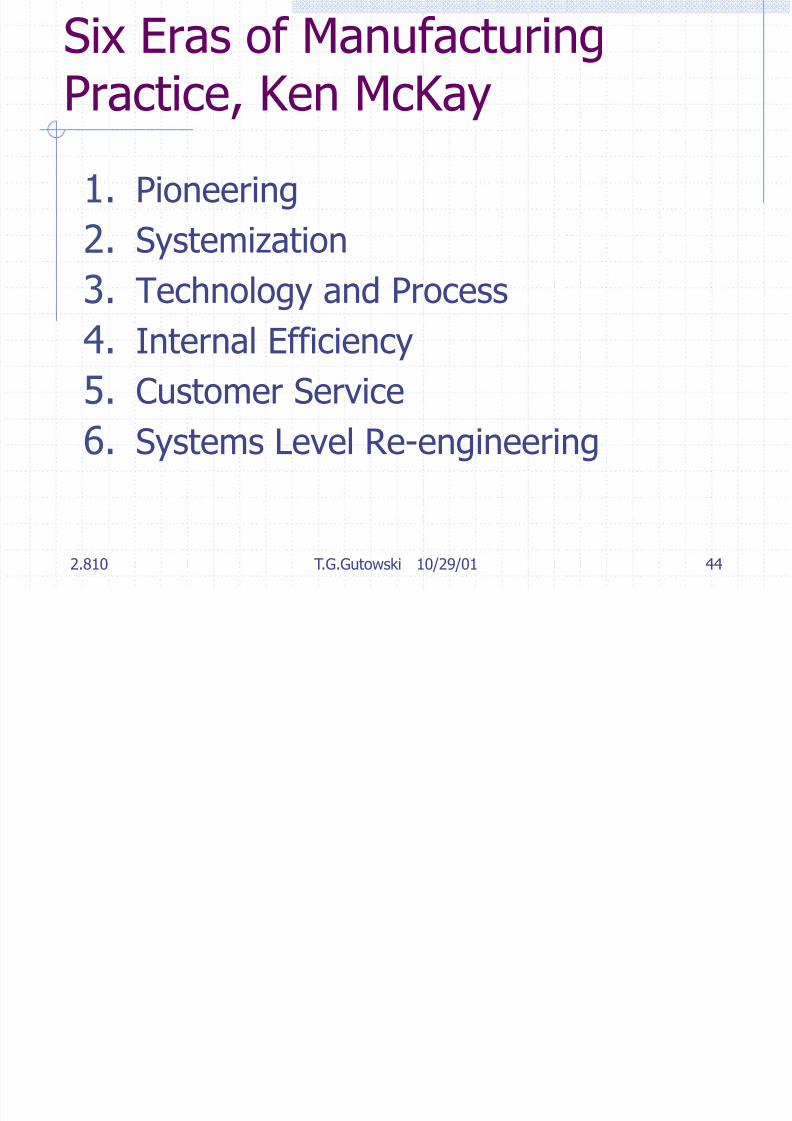
Six Eras of ManufacturingPractice, Ken McKay
1. Pioneering
2. Systemization
3. Technology and Process
4. Internal Efficiency
5. Customer Service
6. Systems Level Re-engineering
8/3/2019 TPS Overview History
http://slidepdf.com/reader/full/tps-overview-history 45/58
2.810 T.G.Gutowski 10/29/01 45
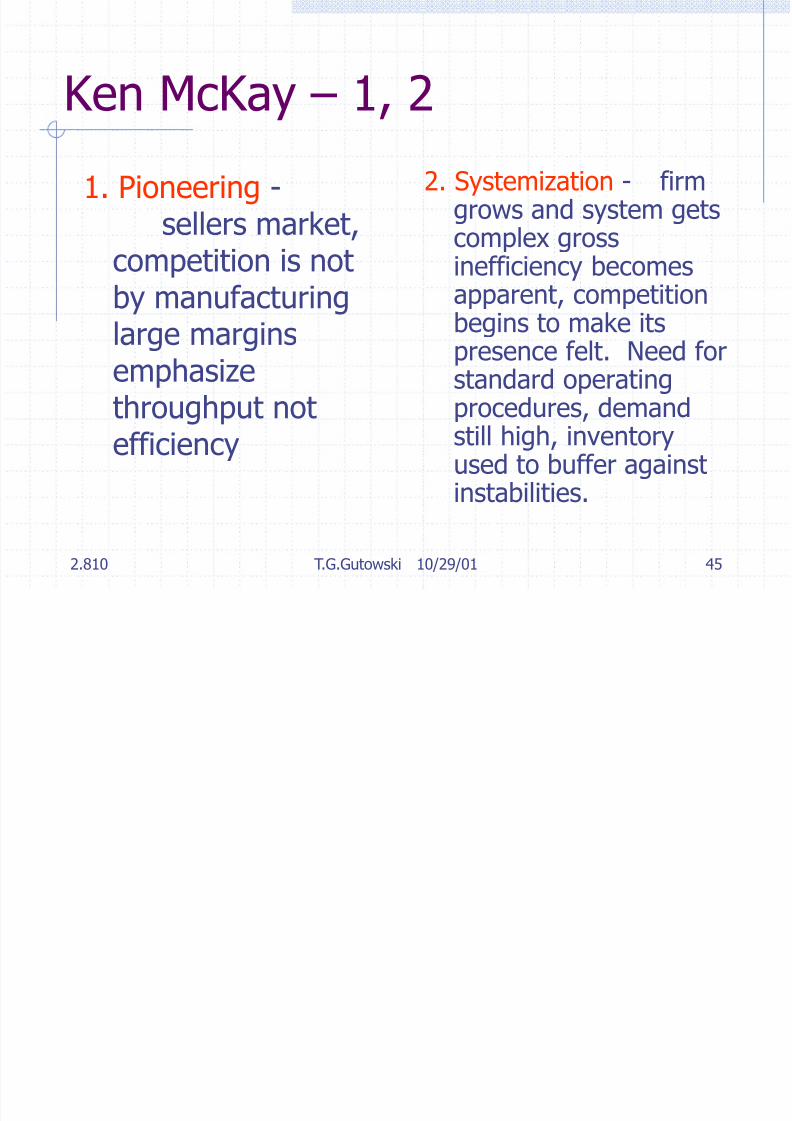
Ken McKay – 1, 2
1. Pioneering -sellers market,
competition is notby manufacturinglarge marginsemphasize
throughput notefficiency
2. Systemization - firmgrows and system getscomplex grossinefficiency becomesapparent, competitionbegins to make itspresence felt. Need forstandard operating
procedures, demandstill high, inventoryused to buffer againstinstabilities.
8/3/2019 TPS Overview History
http://slidepdf.com/reader/full/tps-overview-history 46/58
2.810 T.G.Gutowski 10/29/01 46
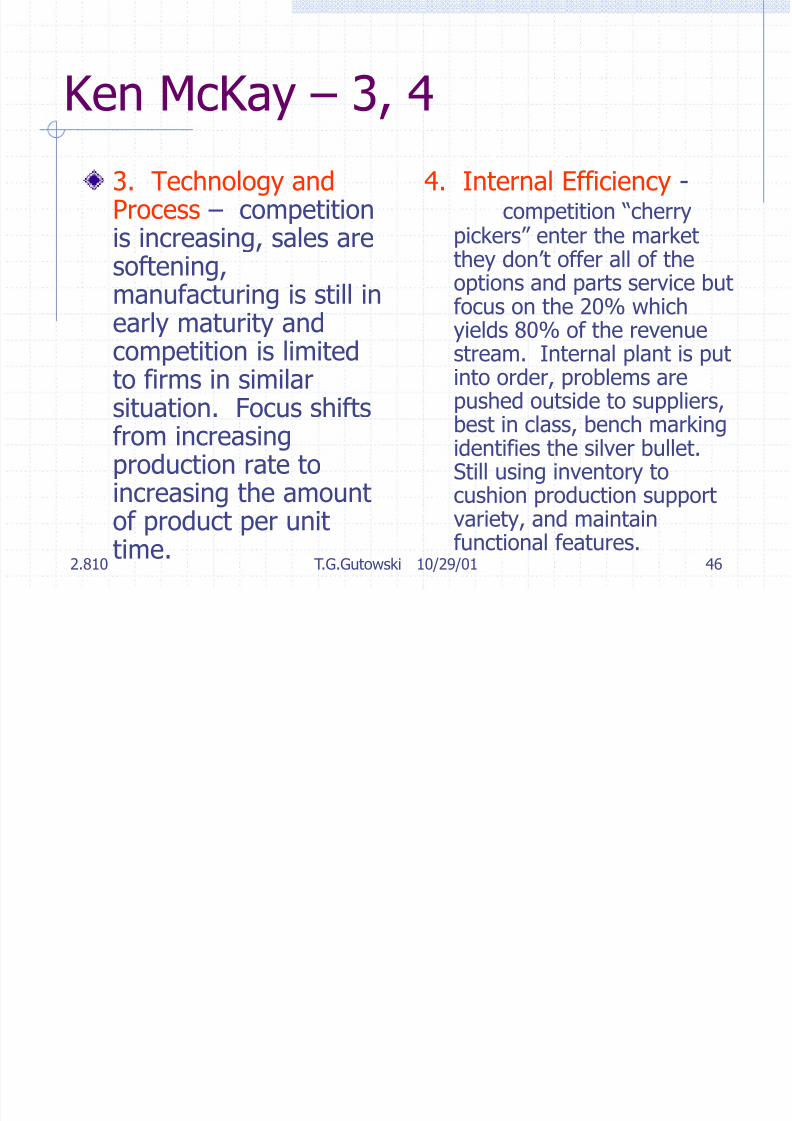
Ken McKay – 3, 4
3. Technology andProcess – competitionis increasing, sales aresoftening,manufacturing is still inearly maturity andcompetition is limitedto firms in similar
situation. Focus shiftsfrom increasingproduction rate toincreasing the amountof product per unit
time.
4. Internal Efficiency - competition “cherrypickers” enter the marketthey don’t offer all of the
options and parts service butfocus on the 20% whichyields 80% of the revenuestream. Internal plant is putinto order, problems arepushed outside to suppliers,
best in class, bench markingidentifies the silver bullet.Still using inventory tocushion production supportvariety, and maintainfunctional features.
8/3/2019 TPS Overview History
http://slidepdf.com/reader/full/tps-overview-history 47/58
2.810 T.G.Gutowski 10/29/01 47
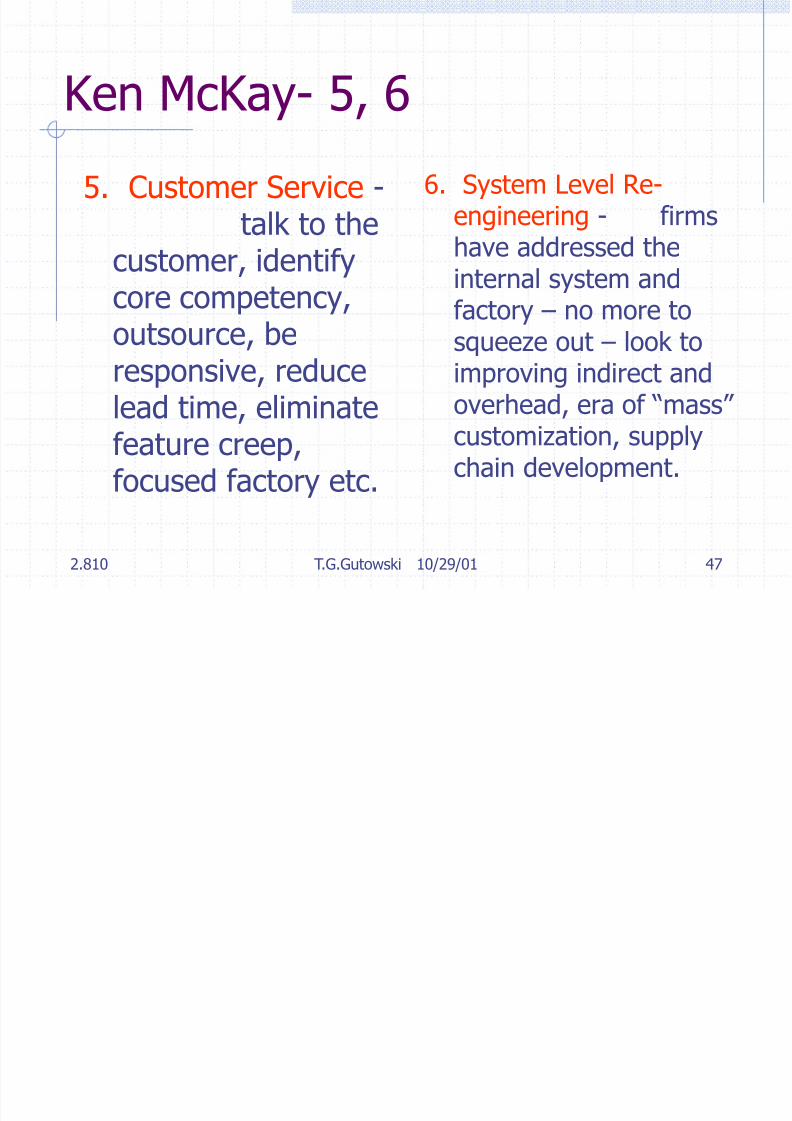
Ken McKay- 5, 6
5. Customer Service -talk to the
customer, identifycore competency,outsource, beresponsive, reduce
lead time, eliminatefeature creep,focused factory etc.
6. System Level Re-engineering - firmshave addressed the
internal system andfactory – no more tosqueeze out – look toimproving indirect andoverhead, era of “mass” customization, supplychain development.
8/3/2019 TPS Overview History
http://slidepdf.com/reader/full/tps-overview-history 48/58
2.810 T.G.Gutowski 10/29/01 48
The Toyota Production System
1. Historical View
2. Performance measures
3. Elements of TPS4. Six Eras of Manufacturing Practice
5. Difficulties with Implementation
8/3/2019 TPS Overview History
http://slidepdf.com/reader/full/tps-overview-history 49/58
2.810 T.G.Gutowski 10/29/01 49
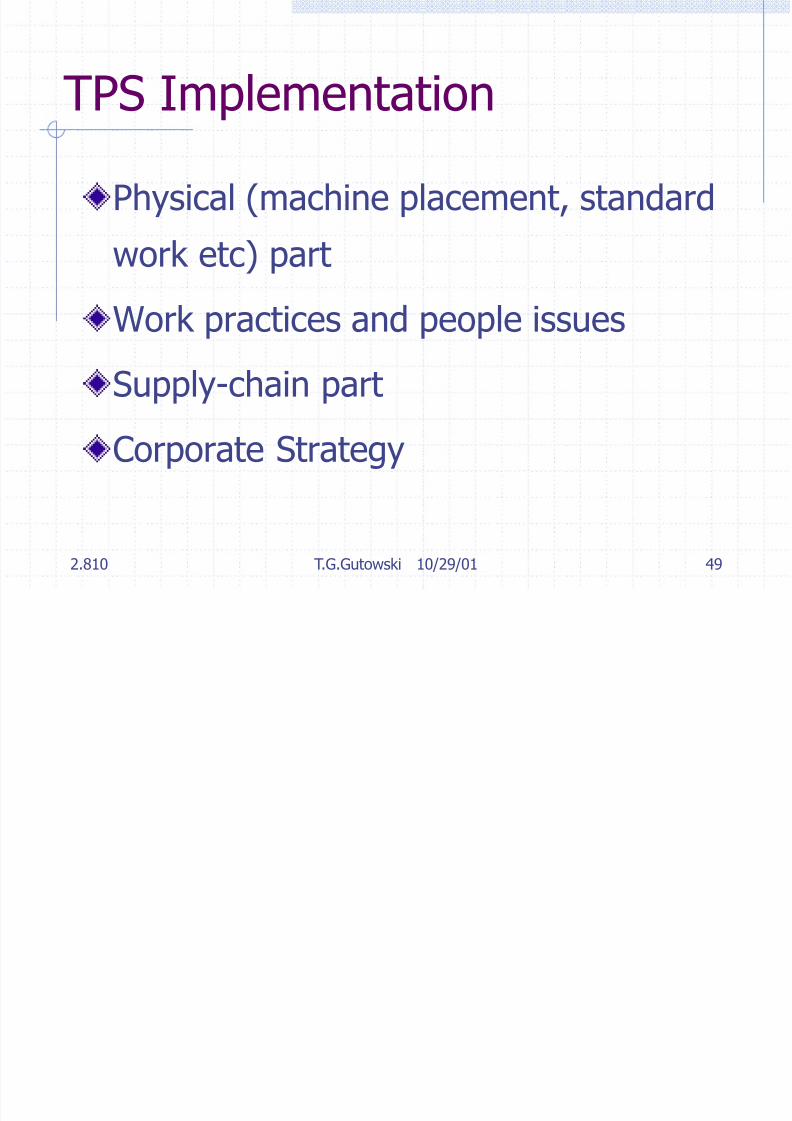
TPS Implementation
Physical (machine placement, standard
work etc) part
Work practices and people issues
Supply-chain part
Corporate Strategy
Work practices and people
8/3/2019 TPS Overview History
http://slidepdf.com/reader/full/tps-overview-history 50/58
2.810 T.G.Gutowski 10/29/01 50
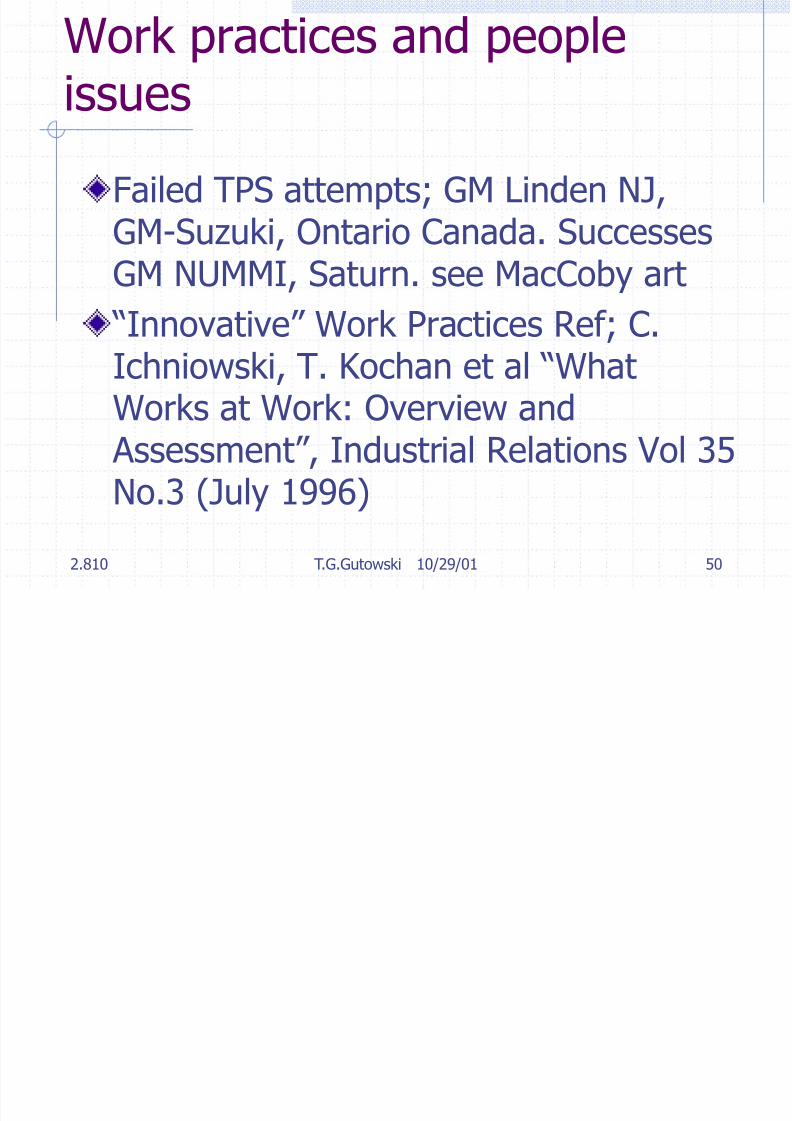
Work practices and peopleissues
Failed TPS attempts; GM Linden NJ,GM-Suzuki, Ontario Canada. Successes
GM NUMMI, Saturn. see MacCoby art “Innovative” Work Practices Ref; C.Ichniowski, T. Kochan et al “What
Works at Work: Overview and Assessment”, Industrial Relations Vol 35No.3 (July 1996)
Examples of “Innovative”
8/3/2019 TPS Overview History
http://slidepdf.com/reader/full/tps-overview-history 51/58
2.810 T.G.Gutowski 10/29/01 51
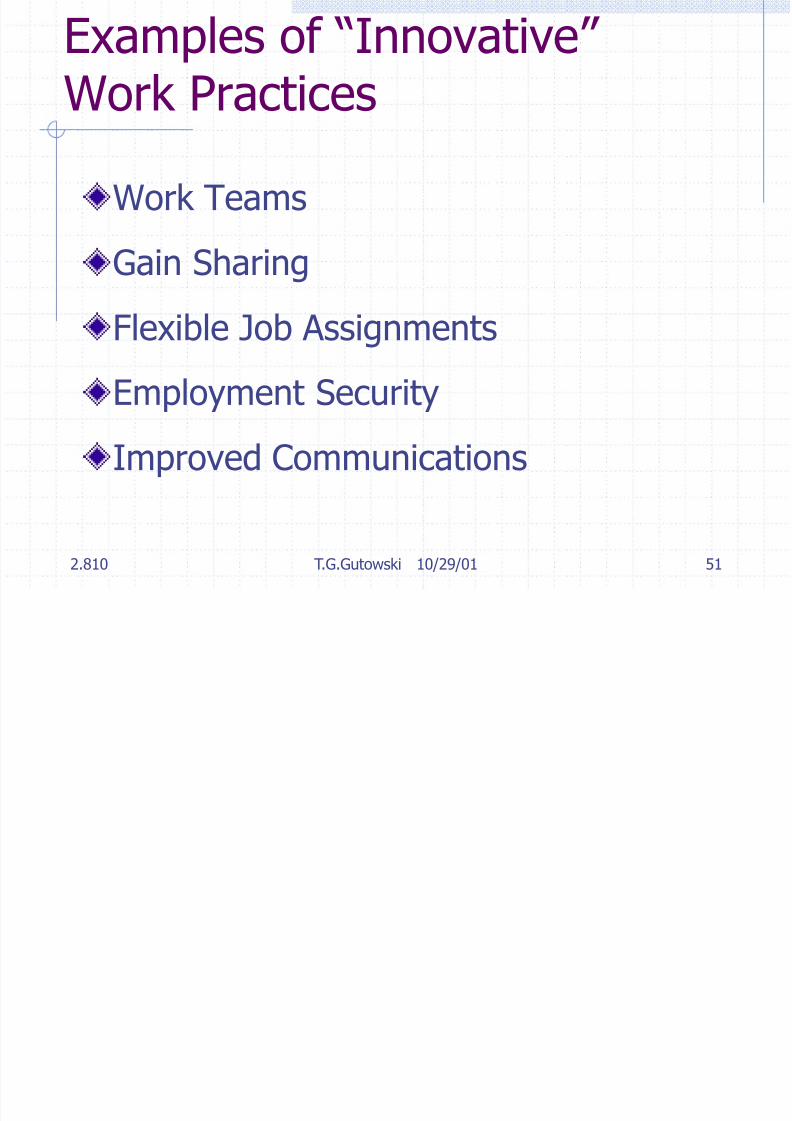
Examples of Innovative Work Practices
Work Teams
Gain Sharing
Flexible Job Assignments
Employment Security
Improved Communications
“What Works at Work:

8/3/2019 TPS Overview History
http://slidepdf.com/reader/full/tps-overview-history 52/58
2.810 T.G.Gutowski 10/29/01 52
What Works at Work:Overview and Assessment”,
Conclusion 1; “Bundling”
Innovative human resource management
practices can improve business productivity,primarily through the use of systems of related work practices designed to enhanceworker participation and flexibility in the
design of work and decentralization of managerial tasks and responsibilities.
“What Works at Work:
8/3/2019 TPS Overview History
http://slidepdf.com/reader/full/tps-overview-history 53/58
2.810 T.G.Gutowski 10/29/01 53
What Works at Work:Overview and Assessment”,
Conclusion 2; “Impact”
New Systems of participatory work
practices have large economicallyimportant effects on the performance of the businesses that adopt the new
practices.
“What Works at Work:

8/3/2019 TPS Overview History
http://slidepdf.com/reader/full/tps-overview-history 54/58
2.810 T.G.Gutowski 10/29/01 54
What Works at Work:Overview and Assessment”,
Conclusion 3; “Partial Implementation”
A majority of contemporary U.S. businesses now
have adopted some forms of innovative work practices aimed at enhancing employee participationsuch as work teams, contingent pay-for-performancecompensation, or flexible assignment of multiskilledemployees. Only a small percentage of businesses,
however, have adopted a full system of innovativework practices composed of an extensive set of thesework practice innovations.
“What Works at Work:
8/3/2019 TPS Overview History
http://slidepdf.com/reader/full/tps-overview-history 55/58
2.810 T.G.Gutowski 10/29/01 55
What Works at Work:Overview and Assessment”,
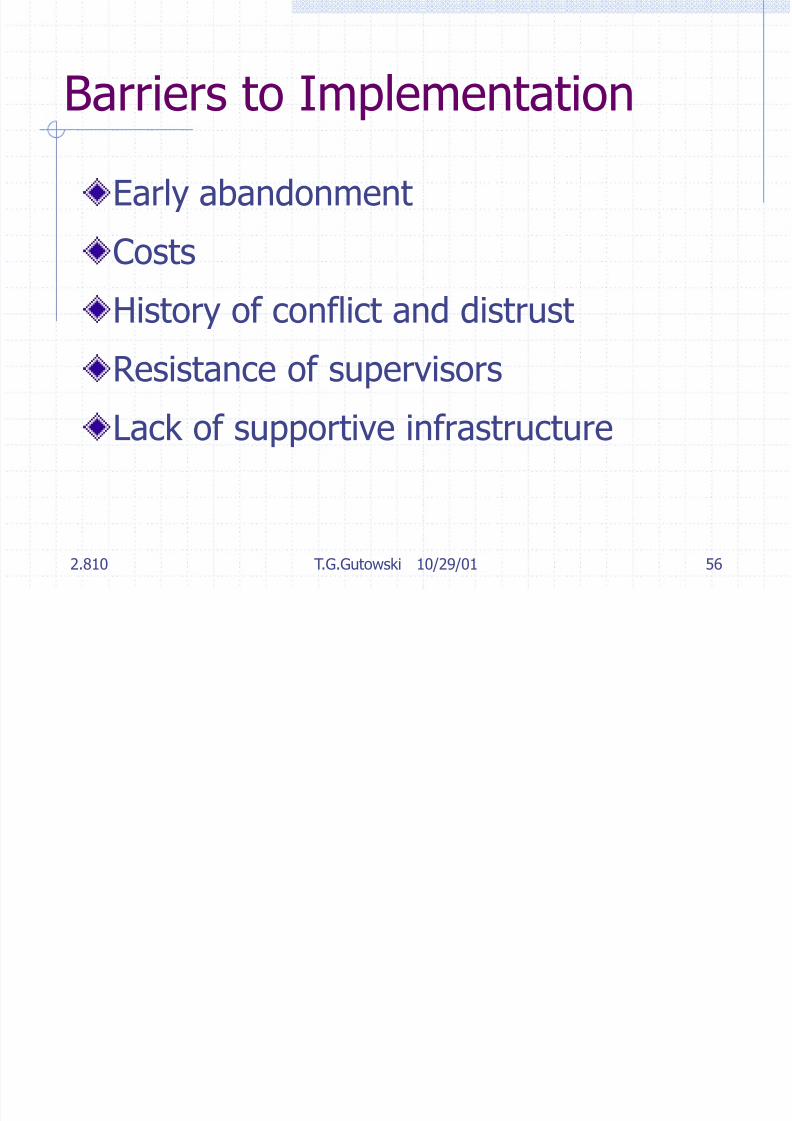
Conclusion 4; “Barriers to Implementation”
The diffusion of new workplace innovations is limited,especially among older U.S. businesses. Firms face a number of
obstacles when changing from a system of traditional work practices to a system of innovative practices, including: theabandonment of organization change initiatives after limitedpolicy changes have little effect on performance, the costs of other organizational practices that are needed to make newwork practices effective, long histories of labor-management
conflict and mistrust, resistance of supervisors and otherworkers who might not fare as well under the newer practices,and the lack of a supportive institutional and public policyenvironment.
8/3/2019 TPS Overview History
http://slidepdf.com/reader/full/tps-overview-history 56/58
2.810 T.G.Gutowski 10/29/01 56
Barriers to Implementation
Early abandonment
Costs
History of conflict and distrust
Resistance of supervisors
Lack of supportive infrastructure
8/3/2019 TPS Overview History
http://slidepdf.com/reader/full/tps-overview-history 57/58
2.810 T.G.Gutowski 10/29/01 57
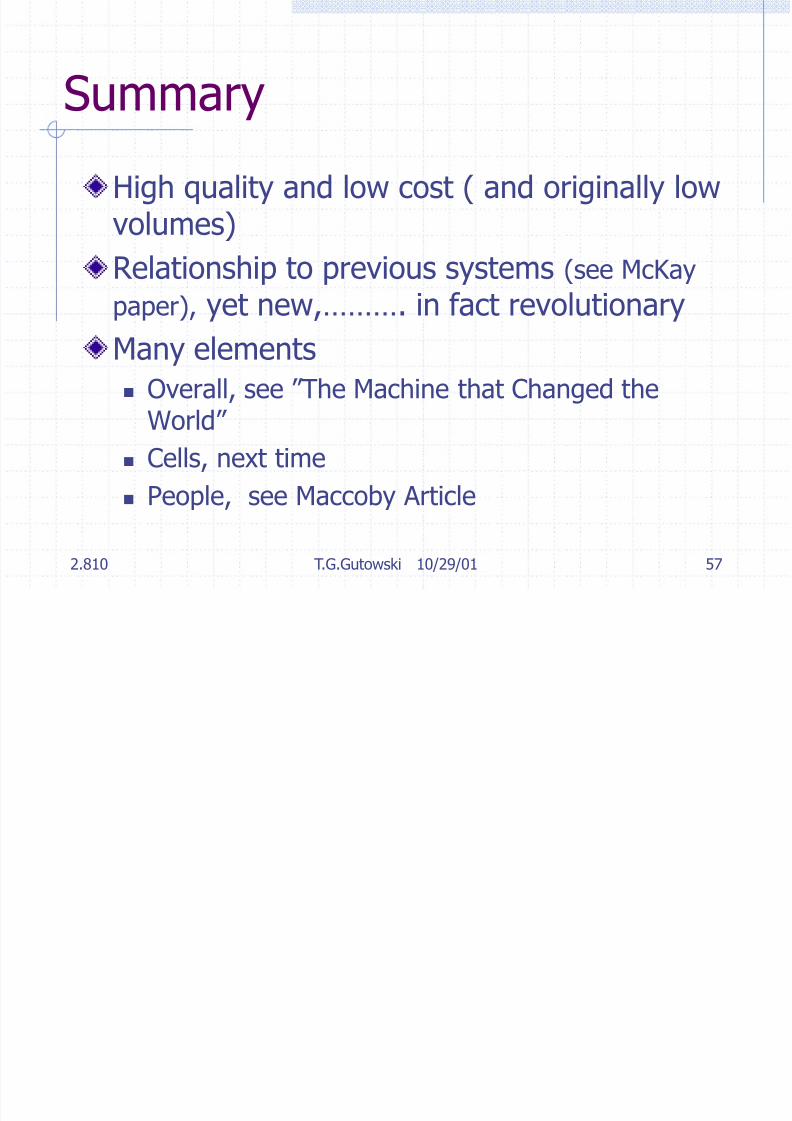
Summary
High quality and low cost ( and originally lowvolumes)
Relationship to previous systems (see McKay
paper), yet new,………. in fact revolutionary
Many elements
Overall, see ”The Machine that Changed the
World” Cells, next time
People, see Maccoby Article

8/3/2019 TPS Overview History
http://slidepdf.com/reader/full/tps-overview-history 58/58
Summary …….. continued
“Autonomation” automation with a
human touch
Worker as problem solver
TRUST