Embed Size (px)
Citation preview

This publication was supported by the National Sea Grant College Program of the U.S. Departmentof Commerce’s National Oceanic and Atmospheric Administration (NOAA) under NOAA Grant No. 16RG-2195; and by the U.S. Department of Agriculture’s Risk Management Agency through its Tar-geted Commodity Partnerships for Risk Management Education Program, USDA Agreement Number02-1E0831-0105, with assistance from the Institute of Food and Agricultural Sciences at the Univer-sity of Florida. The views expressed are those of the authors and do not necessarily reflect theviews of these organizations.
Additional copies are available by contacting:Florida Sea GrantUniversity of FloridaPO Box 110409Gainesville, FL, 32611-0409(352) 392-2801www.flseagrant.org
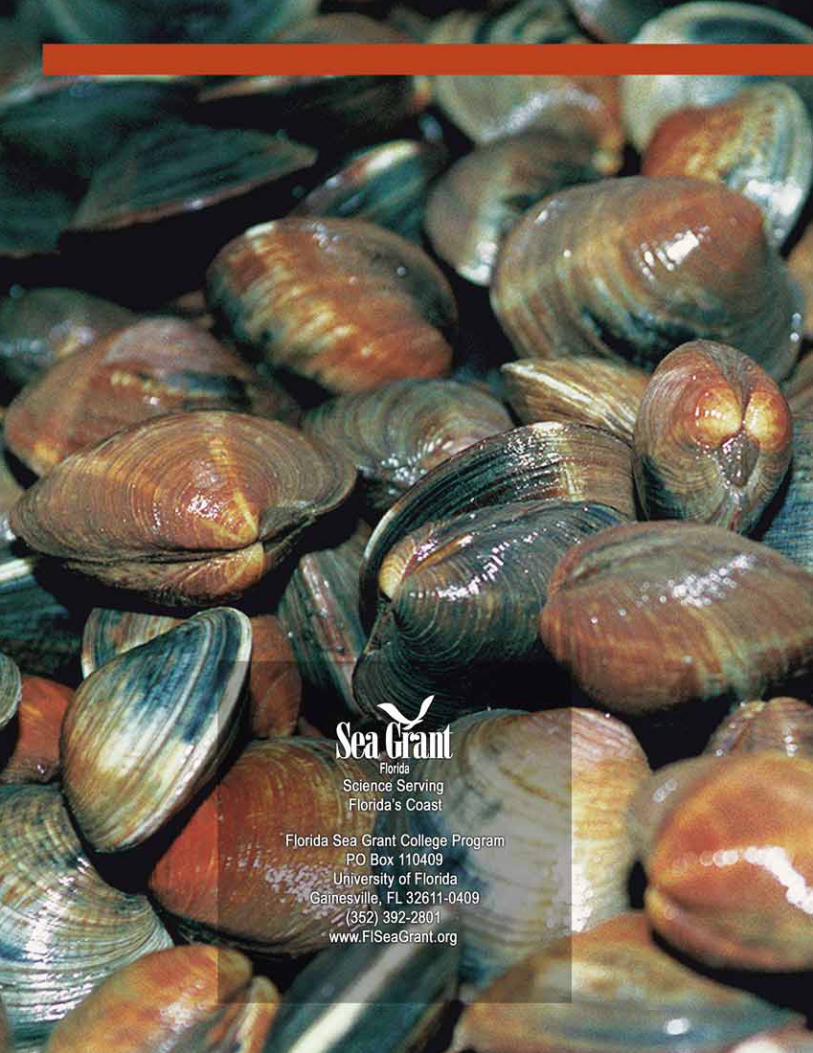
Cover photo: Eric Zamora, UF/IFAS
TP 141January 2005
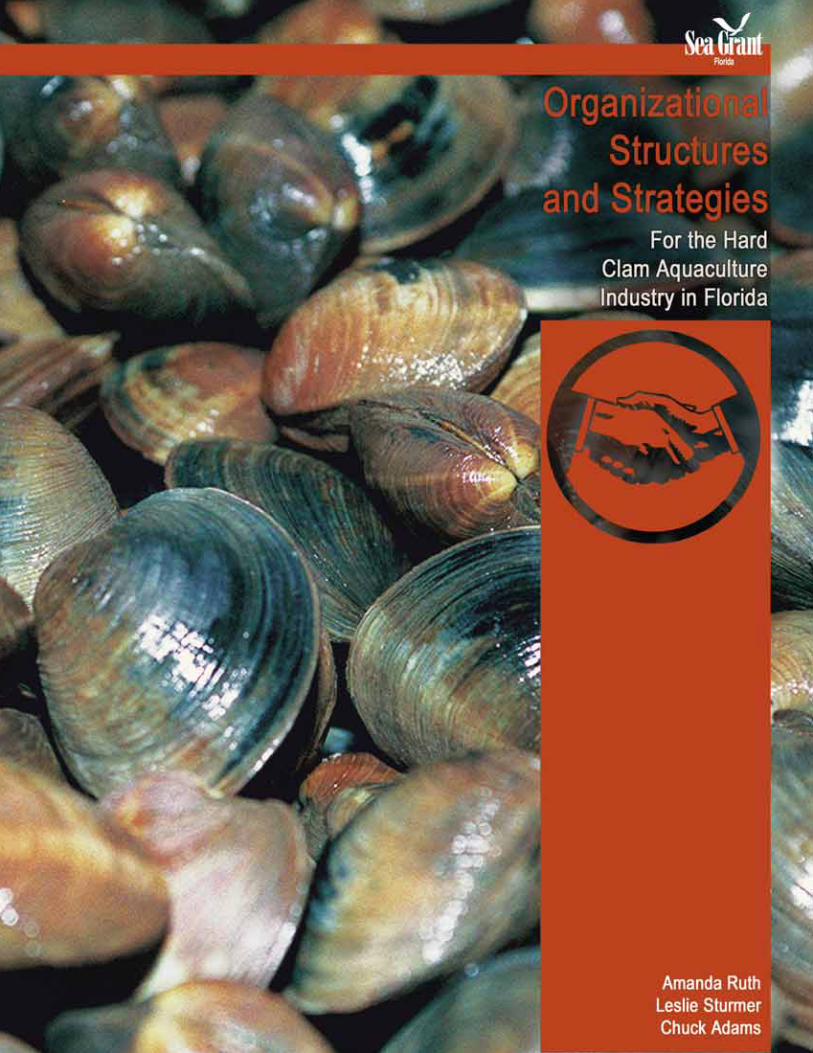
Organizational Structures and Strategies For the Hard C lam Aquacu l tu re Indust ry in F lo r ida
Amanda M. Ruth Agricultural Education and Communication Department
University of Florida Gainesville
Leslie N. Sturmer Shellfish Aquaculture Extension Program
Cooperative Extension Service University of Florida
Cedar Key
Charles M. Adams Florida Sea Grant Program
Food and Resource Economics Department University of Florida
Gainesville
Submitted to U.S. Department of Agriculture Risk Management Agency
Targeted Commodity Partnerships for Risk Management Education Program Report on Project 02-1E0831-0105
ii
Contents Executive Summary ................................................................................................... 1 Introduction................................................................................................................ 2 Purpose....................................................................................................................... 3 Methodology.............................................................................................................. 4 Results........................................................................................................................ 4 Suggestions ................................................................................................................ 16 References.................................................................................................................. 22 Appendices................................................................................................................. 23
Appendix A: Survey Instrument .......................................................................... 24 Appendix B: Survey Responses........................................................................... 27 Appendix C: Phone Interviews ............................................................................ 43 Appendix D: Additional Information................................................................... 46
Nonprofit organization................................................................................... 46 Business cooperative...................................................................................... 49 Marketing order ............................................................................................. 51 Checkoff program .......................................................................................... 54
Executive Summary The commercial hard clam culture industry in Florida is an unqualified success story. There are currently more than 400 shellfish growers who farm high-density, submerged leases totaling over 1,700 acres. More than 140 million clams were produced in Florida during 2001. This production had a farm-gate value in excess of $15 million, which represents a 34-fold increase in farm-gate sales in 14 years. There are also 14 hatcheries and 90 land-based nurseries and other businesses that provide input to the growout sector of the industry. As a result, the industry represents an important source of economic activity, jobs, and tax revenue to several coastal communities in Florida. To continue this growth, the industry may have a need for better organization on a statewide basis. Such statewide organization can be beneficial in regards to regional and national marketing and promotion, research and education on industry-wide problems, and more comprehensive political visibility and lobbying efforts. This study provides guidance on statewide organization for the commercial hard clam culture industry in Florida. The study characterizes the structure of and identifies strategies for successful agricultural and aquacultural organizations designed to provide the resources needed to solve current and projected industry problems. Objectives were to 1) characterize the structure of successful and relevant organizations, 2) identify successful revenue generating strategies, 3) provide the hard clam culture industry with options to help facilitate their organizational decisions, and 4) assist clam growers in Florida in developing an umbrella organizational strategy that will meet their future industry needs. A mail survey of 23 questions was sent to directors and presidents of 85 agricultural and aquacultural organizations in Florida and across the US. The Dillman tailored design method was used. Follow-up phone interviews were conducted to gather more detailed information from selected survey respondents. The response rate was 35.2 percent. Of the respondents, 89.3 percent were nonprofit trade, 7.1 percent were a cooperative, and 4.6 percent were a state agency. Most respondents used a voluntary method of generating revenue. Approximately half used a fixed dues rate, while 39.3 percent used a production assessment. About 11 percent used a mandatory program, with 7.1 and 3.5 percent using a checkoff and marketing order, respectively. With regard to internal organizational structure, the majority (66.7 percent) used an elected board of directors, 10 percent used an appointed board, and 10 percent used elected/appointed boards. The average board size was 14 members, with the size ranging from 5 to 38 members. Eighty percent of the respondents used paid administrative staff. Most respondents used open membership, 57 percent having membership from other states and other commodities. Membership sizes ranged from 17 to 9,000 members, with membership rosters representing from 10 to 93 percent of the industry volume/value. The study also identified numerous other successful organizational strategies for services offered, recruitment techniques, considerations for initial organization, success measurement, organizational roadblocks, and recommendations.
1
Introduction The culture of the hard clams, Mercenaria mercenaria, represents a relatively new
agricultural commodity in Florida and the fastest growing segment of the aquaculture industry in the state. The hard clam culture industry has a short history extending back just 20 years in Florida. Attempts to culture hard clams originated in the Indian River along the east central coast during the late 1970s as a means to create an alternative supply source to fluctuating wild stocks. The development of the industry on the Gulf coast of Florida began in the early 1990s, primarily through job retraining program efforts designed for displaced workers in the commercial fishing industry. Over 300 underemployed oyster harvesters and net fishermen were trained and placed into small-scale business enterprises. These technology transfer programs were comprehensive enough in scope to have launched a new industry for Florida’s Gulf coast.
Currently in the state, about 400 shellfish growers farm over 1,700 acres of state-
owned submerged lands in near-shore coastal waters. There are three regions in the state where clam farming prevails – Indian River and Mosquito Lagoons (Indian River, Brevard and Volusia Counties), southwest Florida (Charlotte and Lee Counties), and the Cedar Key area (Levy and Dixie Counties). Production of hard clams has fast become established in areas where neither aquaculture nor a traditional fishery existed. This is reflected in the aquaculture surveys conducted biannually by the Florida Agricultural Statistics Service. The first survey report in 1987 identified 13 growers and sales of 2.3 million clams valued at $431,000 (USDA, 1988). Over 140 million clams were produced statewide in 2001 (USDA, 2002). Farm gate sales rose to $15 million that year, representing a 34-fold increase over prior survey results 14 years ago. This phenomenal production of clams is attributed not only to the success of retraining programs but also to the high natural productivity of subtropical waters allowing for almost year-round growth.
In addition to the number of growout businesses supported by this industry, there are
now over 14 hatcheries and 90 land-based nurseries located throughout the state. These operations provide “seed” clams for growers. In 2001, 30 producers sold 478 million clam seed with total sales of $3.3 million (USDA, 2002). Other spin-off businesses include seamstresses making clam bags, boat builders specializing in clam work skiffs, and manufacturers producing harvesting and processing equipment. About 55 certified shellfish wholesalers in the state purchase clams from growers, add value, and distribute product to markets throughout the nation. The industry also provides local employment. For example, seafood retail and restaurant establishments are supported through sales of clams to customers. Thus, this industry represents a sizable contribution to the economy of Florida. A recent analysis assessed the economic impact to be $34 million (Philippakos et al., 2001). Not only has clam farming provided an important source of income to former Florida fisherman, it has also provided a major economic boost to rural coastal communities in the state.
The emergent hard clam aquaculture industry in Florida is a dramatic success story. However, to continue its growth, the industry must increase yield and profitability while producing a safe, consistent, and high quality crop. Like land-based agriculture, the clam
2
industry faces challenges and threats that limit yield, efficiency, and profitability. These cannot be met successfully on an individual basis, but must be faced through a unified industry approach. Purpose Currently, the hard clam aquaculture industry in Florida is not a unified industry in terms of having an organization to represent the entire industry at the state and federal levels. Many commodity groups in the state, for example the strawberry growers and the tropical fish farmers, have effective organizations that provide support to their industry through marketing and promotion, research and education, and lobbying. In Florida, where clam farming has become a multi-million dollar industry, an infrastructure is being sought to support the number of growout and ancillary businesses. An appropriate organizational structure would allow growers to become supportive of each other and help to ensure a greater chance of success in the sustainability of the Florida hard clam aquaculture industry. Within the agricultural community, safety in numbers has become truth. Many agricultural industries have established trade or marketing associations to promote their interests and provide a unified voice to consumers, legislators, and the general public. As mentioned, there are various types of organizational structures that represent the individual commodities in Florida. Nonprofit versus for-profit, trade versus marketing, association versus cooperative, and marketing order versus a checkoff program are just a few of the alternatives an organization must choose from when establishing a unified voice to represent the hard clam aquaculture industry in Florida. The purpose of this study was to characterize the structure and identify strategies of successful agricultural and aquaculture organizations that provide the resources needed to solve industry problems. The information gathered from this study provides suggestions and options for organizational development within the hard clam aquaculture industry.
The study objectives were:
1. To characterize the structures of successful and relevant agricultural and aquaculture organizations in both Florida and the United States.
2. To identify the revenue generating strategies that provide the resources necessary
for the organization to succeed in meeting industry needs.
3. To provide the clam farming community with options to facilitate their decision-making process for establishing an organization that would represent their industry.
4. To provide insight for clam growers in Florida in developing an umbrella
organization and adopting an effective organizational strategy that will meet their industry needs.
3
Methodology Mail survey research techniques were utilized in this study. The researchers chose a purposive sample of agricultural and aquaculture commodity organizations from lists of existing organizations, both in Florida and across the nation. These lists were published by the Florida Department of Agriculture and Consumer Services Website (www.fl-ag.com/AgGroups/index/htm) and the Aquaculture Magazine Buyer’s Guide and Industry Directory (2002). The sample consisted of 85 organizations on both state and national levels. The response rate was 35.2 percent (N=30). A 23-item descriptive survey (Appendix A) was utilized to gather essential information from organizational representatives ranging from executive directors to presidents. The survey instrument was reviewed by a panel of experts, which consisted of university faculty, agricultural practitioners, and Florida clam farmers, to establish face and content validity. The mailed survey was conducted using components from Dillman’s tailored design method (Dillman, 2000). The survey primarily consisted of open-ended questions to gather qualitative information, which were analyzed for common themes. There were also seven quantitative questions included in the survey, which were analyzed for percentages and means. The responses (Appendix B) to the open-ended questions were analyzed using Glaser’s constant comparative technique and the quantitative questions using SPSS (Glaser, 1978). After responses were analyzed, a follow-up phone interview was conducted to gather in-depth information from those organizations that provided extremely valuable information. Upon completion of the data collection phase, the researchers chose to focus upon several organizations that provided data most relevant to the current situation of the Florida hard clam farmers. The information provided by these organizations is highlighted throughout this report. Results Respondents
The responses presented in this section were gathered from 30 commodity organizations, located primarily in the state of Florida. However, some of the responding organizations were from other states, with two of the respondents representing the aquaculture industry in Canada. Over 53 percent (n=16) of the responding organizations represent the aquaculture industry. The remaining 46.6 percent (n=14) of the responding organizations represent other agricultural commodities like tropical fruits, dairy, vegetables, citrus, fruits, and poultry. The respondents were either members from the board of directors or executive directors of the organizations. Structures Various organizational structures were represented by the responding organizations. Nonprofit trade organizations were the common organizational structures that represented a
4
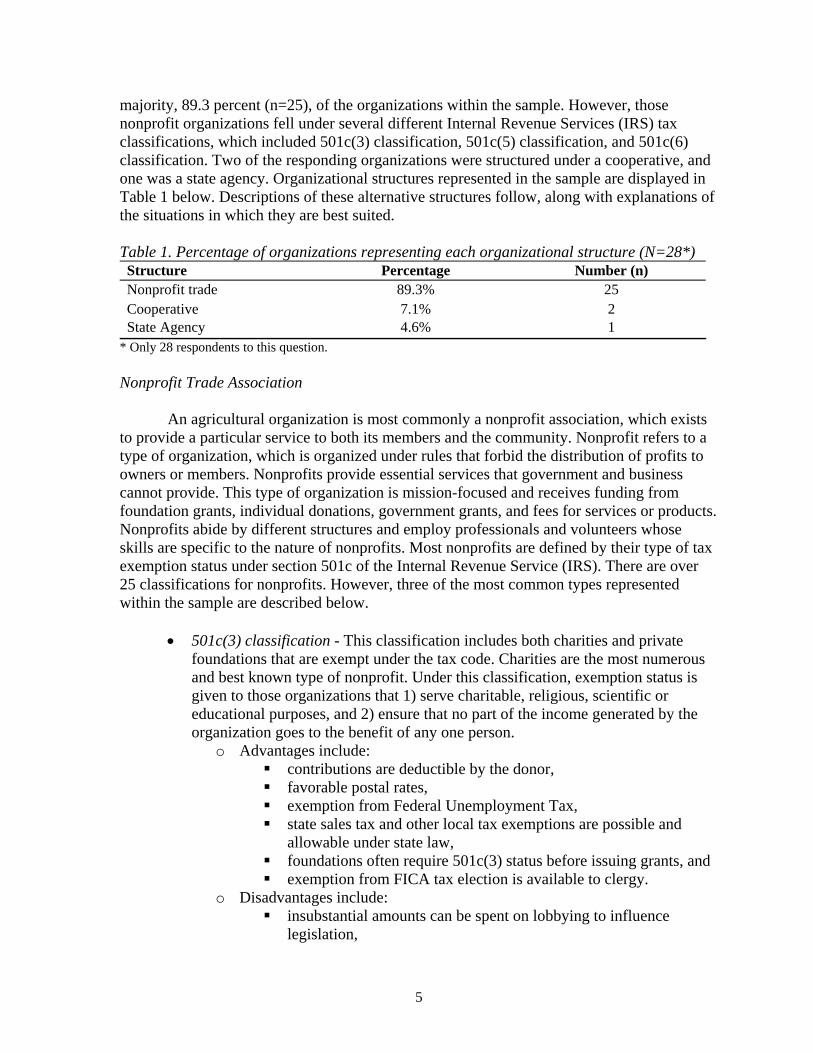
5
majority, 89.3 percent (n=25), of the organizations within the sample. However, those nonprofit organizations fell under several different Internal Revenue Services (IRS) tax classifications, which included 501c(3) classification, 501c(5) classification, and 501c(6) classification. Two of the responding organizations were structured under a cooperative, and one was a state agency. Organizational structures represented in the sample are displayed in Table 1 below. Descriptions of these alternative structures follow, along with explanations of the situations in which they are best suited. Table 1. Percentage of organizations representing each organizational structure (N=28*) Structure Percentage Number (n) Nonprofit trade 89.3% 25 Cooperative 7.1% 2 State Agency 4.6% 1
* Only 28 respondents to this question. Nonprofit Trade Association
An agricultural organization is most commonly a nonprofit association, which exists to provide a particular service to both its members and the community. Nonprofit refers to a type of organization, which is organized under rules that forbid the distribution of profits to owners or members. Nonprofits provide essential services that government and business cannot provide. This type of organization is mission-focused and receives funding from foundation grants, individual donations, government grants, and fees for services or products. Nonprofits abide by different structures and employ professionals and volunteers whose skills are specific to the nature of nonprofits. Most nonprofits are defined by their type of tax exemption status under section 501c of the Internal Revenue Service (IRS). There are over 25 classifications for nonprofits. However, three of the most common types represented within the sample are described below.
• 501c(3) classification - This classification includes both charities and private
foundations that are exempt under the tax code. Charities are the most numerous and best known type of nonprofit. Under this classification, exemption status is given to those organizations that 1) serve charitable, religious, scientific or educational purposes, and 2) ensure that no part of the income generated by the organization goes to the benefit of any one person.
o Advantages include: contributions are deductible by the donor, favorable postal rates, exemption from Federal Unemployment Tax, state sales tax and other local tax exemptions are possible and
allowable under state law, foundations often require 501c(3) status before issuing grants, and exemption from FICA tax election is available to clergy.
o Disadvantages include: insubstantial amounts can be spent on lobbying to influence
legislation,
prohibition from lobbying in election campaigns, and earnings cannot accrue to individuals.
For private foundations under this classification, a single source of funding is used and commonly comes from individuals, families or businesses that want to make investments or award grants to nonprofits. Foundations must pay a one to two percent exercise tax on interest and dividends on investments. Other disadvantages of the private foundation include: more reporting requirements on Form 990PF, limits on deductions for charitable contributor, and IRS-imposed operating restrictions.
• 501c(5) classification - Usually labor, agricultural, horticultural, and union
organizations fall under this classification. o Advantages include:
no restrictions on lobbying activities, and participation in political activities, which is not available to
501c(3) organizations. o Disadvantages include:
charitable contributions are not deductible by donors, no exemptions are available for FUTA, FICA, or state and local
taxes, earnings cannot accrue to individuals, and postal rates are less favorable.
• 501c(6) classification - Organizations that fall under this classification are trade
associations, professional associations, chambers of commerce, boards of trade, and real estate boards.
o Advantages include: no restrictions in lobbying or political activities, and contributions may be tax deductible as business expense.
o Disadvantages include: charitable contributions are not deductible by the donors, no exemptions for FUTA, FICA, or state/local taxes, and less favorable postal rates.
Respondents indicated choosing these organizational alternatives for reasons such as
being best suited to handle the organization’s objectives and the IRS tax code regulations. There are several other classifications that include organizations like social clubs, veterans clubs, social welfare organizations, and associations of employees for charitable purposes. However, organizations under these classifications were not included in the sample and are not likely to be an option for clam farmers.
Cooperative
This type of organizational structure is an enterprise or organization that is owned and operated for the benefit of those using the services. Most commonly in agriculture, a cooperative is owned and used by farmers mainly to handle the off-farm part of their
6
businesses…buying farm supplies, marketing their products, furnishing utilities, and providing business services…at cost. This type of organization is utilized when producers are trying to create their own value-added business enterprises. Characterizing features of a cooperative include:
• democratic control, • limited return on capital, and • operation at cost, with distribution of financial benefits to individuals in
proportion to their use of the services made available by the cooperative. State Agency A state agency is an executive agency of state government. This type of organization is most commonly established under an act of legislation as a result of an industry or public request. The agency in each state or territory designated under state law is responsible for the fair and equitable distribution within the state of all donations of surplus property to public agencies to be used for one or more public purposes, such as conservation, economic development, education, parks and recreation, public health, public safety, and programs for older individuals. State agencies also carryout nonprofit tax-exempt activities for education and public health purposes, including research for any such purposes. Revenue Generating Strategies
One of the motivations behind this research was a need to identify different strategies
that organizations may use to generate revenues. Commonly, successful revenue strategies determine the difference between success and failure in nonprofit organizations. Thus, responding organizations were asked to identify any revenue generating activities used to financially support their organizations. The majority of the organizations implement a voluntary dues structure. However, there were also organizations that used a mandatory structure. The following information on membership dues is presented within these two categories.
7
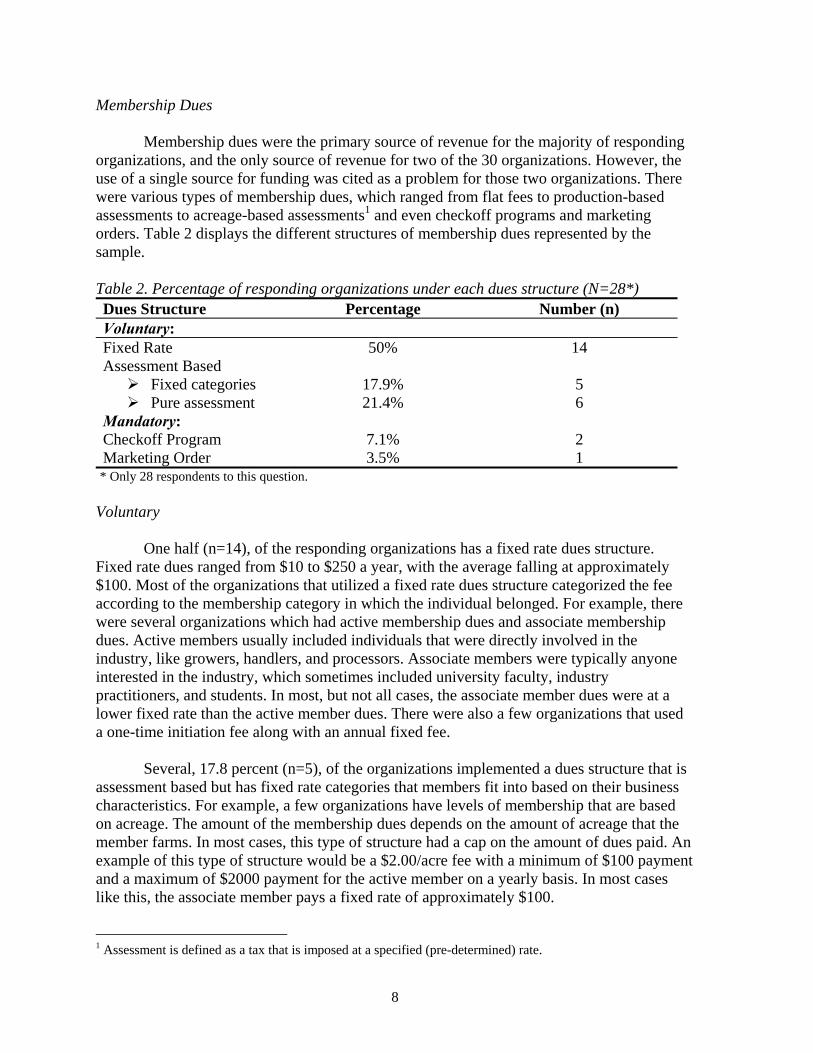
Membership Dues
Membership dues were the primary source of revenue for the majority of responding organizations, and the only source of revenue for two of the 30 organizations. However, the use of a single source for funding was cited as a problem for those two organizations. There were various types of membership dues, which ranged from flat fees to production-based assessments to acreage-based assessments1 and even checkoff programs and marketing orders. Table 2 displays the different structures of membership dues represented by the sample. Table 2. Percentage of responding organizations under each dues structure (N=28*) Dues Structure Percentage Number (n) Voluntary: Fixed Rate 50% 14 Assessment Based
Fixed categories Pure assessment
17.9% 21.4%
5 6
Mandatory: Checkoff Program 7.1% 2 Marketing Order 3.5% 1
* Only 28 respondents to this question. Voluntary
One half (n=14), of the responding organizations has a fixed rate dues structure.
Fixed rate dues ranged from $10 to $250 a year, with the average falling at approximately $100. Most of the organizations that utilized a fixed rate dues structure categorized the fee according to the membership category in which the individual belonged. For example, there were several organizations which had active membership dues and associate membership dues. Active members usually included individuals that were directly involved in the industry, like growers, handlers, and processors. Associate members were typically anyone interested in the industry, which sometimes included university faculty, industry practitioners, and students. In most, but not all cases, the associate member dues were at a lower fixed rate than the active member dues. There were also a few organizations that used a one-time initiation fee along with an annual fixed fee.
Several, 17.8 percent (n=5), of the organizations implemented a dues structure that is assessment based but has fixed rate categories that members fit into based on their business characteristics. For example, a few organizations have levels of membership that are based on acreage. The amount of the membership dues depends on the amount of acreage that the member farms. In most cases, this type of structure had a cap on the amount of dues paid. An example of this type of structure would be a $2.00/acre fee with a minimum of $100 payment and a maximum of $2000 payment for the active member on a yearly basis. In most cases like this, the associate member pays a fixed rate of approximately $100.
1 Assessment is defined as a tax that is imposed at a specified (pre-determined) rate.
8
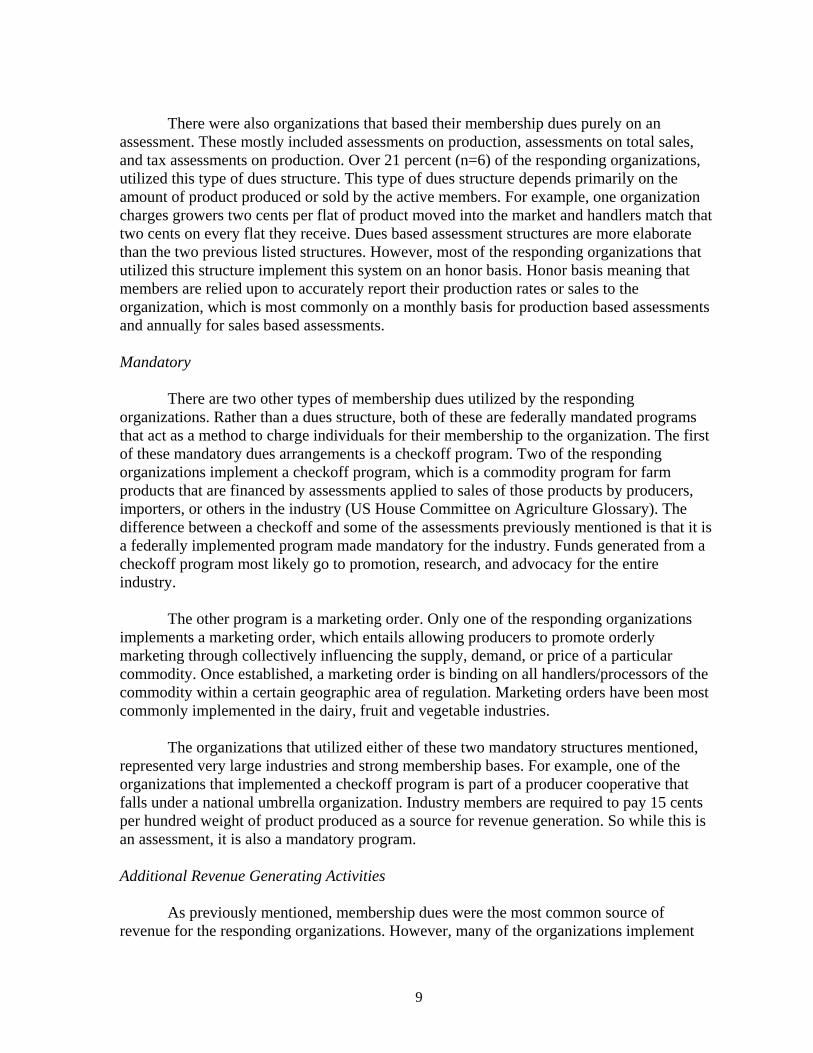
There were also organizations that based their membership dues purely on an assessment. These mostly included assessments on production, assessments on total sales, and tax assessments on production. Over 21 percent (n=6) of the responding organizations, utilized this type of dues structure. This type of dues structure depends primarily on the amount of product produced or sold by the active members. For example, one organization charges growers two cents per flat of product moved into the market and handlers match that two cents on every flat they receive. Dues based assessment structures are more elaborate than the two previous listed structures. However, most of the responding organizations that utilized this structure implement this system on an honor basis. Honor basis meaning that members are relied upon to accurately report their production rates or sales to the organization, which is most commonly on a monthly basis for production based assessments and annually for sales based assessments. Mandatory
There are two other types of membership dues utilized by the responding organizations. Rather than a dues structure, both of these are federally mandated programs that act as a method to charge individuals for their membership to the organization. The first of these mandatory dues arrangements is a checkoff program. Two of the responding organizations implement a checkoff program, which is a commodity program for farm products that are financed by assessments applied to sales of those products by producers, importers, or others in the industry (US House Committee on Agriculture Glossary). The difference between a checkoff and some of the assessments previously mentioned is that it is a federally implemented program made mandatory for the industry. Funds generated from a checkoff program most likely go to promotion, research, and advocacy for the entire industry.
The other program is a marketing order. Only one of the responding organizations implements a marketing order, which entails allowing producers to promote orderly marketing through collectively influencing the supply, demand, or price of a particular commodity. Once established, a marketing order is binding on all handlers/processors of the commodity within a certain geographic area of regulation. Marketing orders have been most commonly implemented in the dairy, fruit and vegetable industries. The organizations that utilized either of these two mandatory structures mentioned, represented very large industries and strong membership bases. For example, one of the organizations that implemented a checkoff program is part of a producer cooperative that falls under a national umbrella organization. Industry members are required to pay 15 cents per hundred weight of product produced as a source for revenue generation. So while this is an assessment, it is also a mandatory program. Additional Revenue Generating Activities As previously mentioned, membership dues were the most common source of revenue for the responding organizations. However, many of the organizations implement
9
10
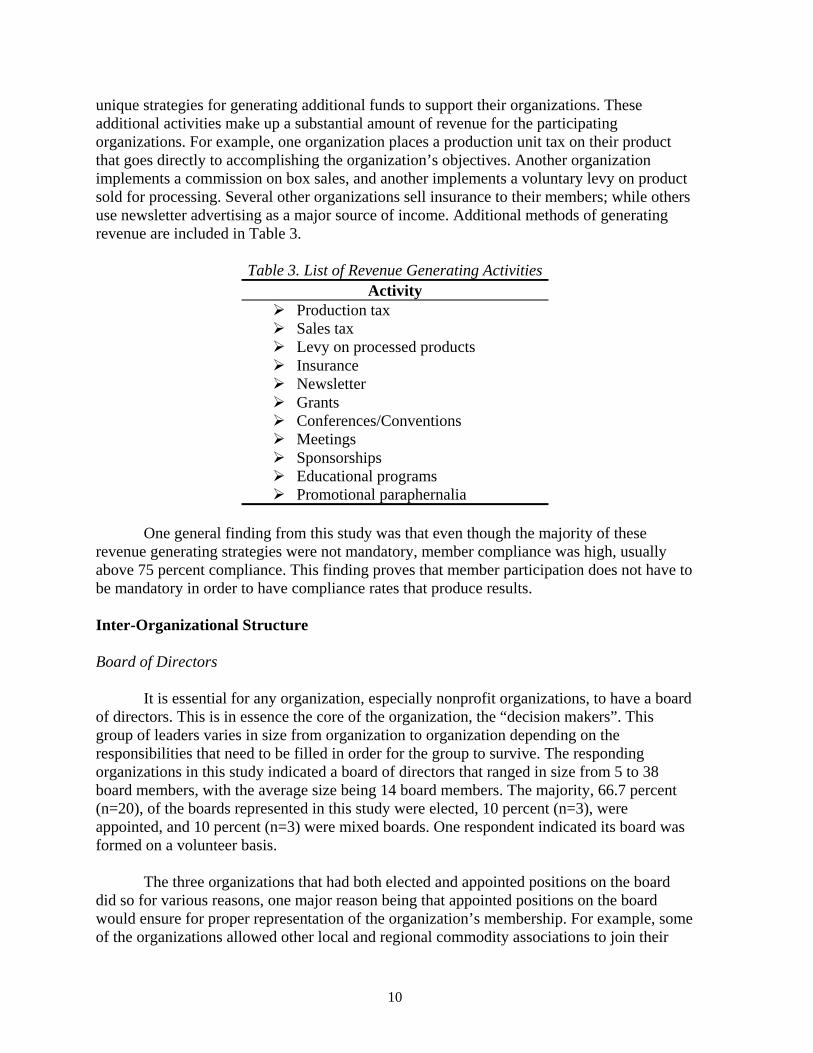
unique strategies for generating additional funds to support their organizations. These additional activities make up a substantial amount of revenue for the participating organizations. For example, one organization places a production unit tax on their product that goes directly to accomplishing the organization’s objectives. Another organization implements a commission on box sales, and another implements a voluntary levy on product sold for processing. Several other organizations sell insurance to their members; while others use newsletter advertising as a major source of income. Additional methods of generating revenue are included in Table 3.
Table 3. List of Revenue Generating Activities Activity
Production tax Sales tax Levy on processed products Insurance Newsletter Grants Conferences/Conventions Meetings Sponsorships Educational programs Promotional paraphernalia
One general finding from this study was that even though the majority of these
revenue generating strategies were not mandatory, member compliance was high, usually above 75 percent compliance. This finding proves that member participation does not have to be mandatory in order to have compliance rates that produce results. Inter-Organizational Structure Board of Directors It is essential for any organization, especially nonprofit organizations, to have a board of directors. This is in essence the core of the organization, the “decision makers”. This group of leaders varies in size from organization to organization depending on the responsibilities that need to be filled in order for the group to survive. The responding organizations in this study indicated a board of directors that ranged in size from 5 to 38 board members, with the average size being 14 board members. The majority, 66.7 percent (n=20), of the boards represented in this study were elected, 10 percent (n=3), were appointed, and 10 percent (n=3) were mixed boards. One respondent indicated its board was formed on a volunteer basis. The three organizations that had both elected and appointed positions on the board did so for various reasons, one major reason being that appointed positions on the board would ensure for proper representation of the organization’s membership. For example, some of the organizations allowed other local and regional commodity associations to join their
organizations. Some even had other states represented in their membership. Several of the responding organizations that had diverse representation in their membership wanted to have the ability to highlight that diversity on the board of directors as well. In many cases, if the diversity was a significant percentage of the membership, it was reflected by having a proportionate number of board members representing that state and/or commodity. Others reasons for electing and appointing board members were to ensure responsibilities would be equally distributed among those interested individuals and that equal representation of the membership was reflected on the board. Administrative Staff
While recognizing the amount of work that some of these organizations perform, it is
not surprising that 80 percent (n=24) of the responding organizations have a paid administrative staff. The remaining 20 percent of the respondents who do not have paid staff seek outside services, purchase services from larger organizations (national associations), or are limited in their revenue generating strategies and as a result do not have enough funds to support a paid staff. These organizations without paid staff rely solely on volunteer time from their members to keep the organization running, which in this study was indicated to be a significant reason for failure and/or the limited benefits provided to members.
Those organizations that do have paid administrative staff vary in the number of paid staff that they employ. For example, one organization that has a very large member base and represents a very large industry in their state, employs 27 full-time positions. Most of the responding organizations employ anywhere from one to four full-time positions. These positions usually include an executive director, administrative assistant, account manager/bookkeeper, director of communications, and a projects coordinator (research and education). Membership Eligibility Most of the responding organizations have open membership, meaning that both individuals from industry and any individual that is interested in the industry can join as members. There were a few organizations that only accepted individuals directly connected to the industry. Specific reasons given for this choice were that they wanted to keep all activities and information inside the industry and they wanted to keep the organizations smaller for easier administration. Also, some organizations did not represent large industries in their geographic areas, which was the reason for the organization’s small size. Over half (57 percent, n=16) of the responding organizations have membership representation from multi-states and multi-commodities. As previously mentioned, most of these organizations allow for this diversity on the board of directors. A few of the organizations do not allow membership from other states or commodities because the primary objective of these organizations is to keep membership benefits localized and/or industry specific for competition, administration, and even communication.
11
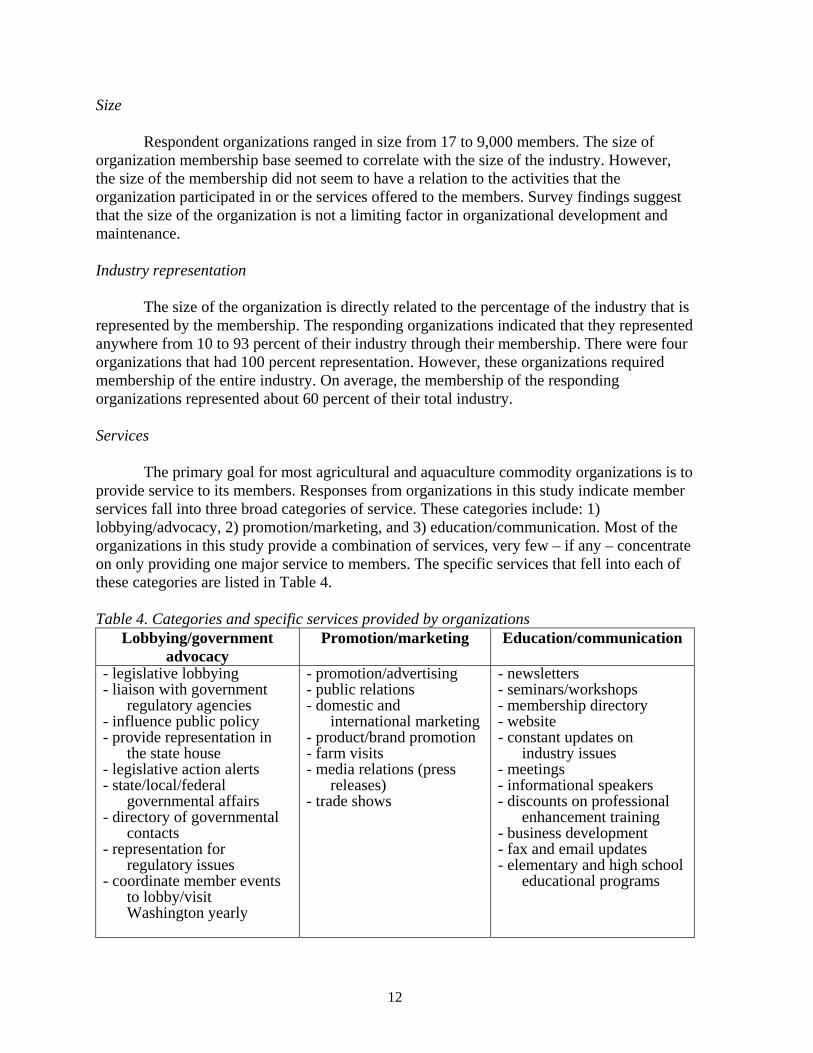
Size Respondent organizations ranged in size from 17 to 9,000 members. The size of organization membership base seemed to correlate with the size of the industry. However, the size of the membership did not seem to have a relation to the activities that the organization participated in or the services offered to the members. Survey findings suggest that the size of the organization is not a limiting factor in organizational development and maintenance. Industry representation The size of the organization is directly related to the percentage of the industry that is represented by the membership. The responding organizations indicated that they represented anywhere from 10 to 93 percent of their industry through their membership. There were four organizations that had 100 percent representation. However, these organizations required membership of the entire industry. On average, the membership of the responding organizations represented about 60 percent of their total industry. Services The primary goal for most agricultural and aquaculture commodity organizations is to provide service to its members. Responses from organizations in this study indicate member services fall into three broad categories of service. These categories include: 1) lobbying/advocacy, 2) promotion/marketing, and 3) education/communication. Most of the organizations in this study provide a combination of services, very few – if any – concentrate on only providing one major service to members. The specific services that fell into each of these categories are listed in Table 4. Table 4. Categories and specific services provided by organizations
Lobbying/government advocacy
Promotion/marketing
Education/communication
- legislative lobbying - liaison with government
regulatory agencies - influence public policy - provide representation in
the state house - legislative action alerts - state/local/federal
governmental affairs - directory of governmental
contacts - representation for
regulatory issues - coordinate member events
to lobby/visit Washington yearly
- promotion/advertising - public relations - domestic and
international marketing - product/brand promotion - farm visits - media relations (press
releases) - trade shows
- newsletters - seminars/workshops - membership directory - website - constant updates on
industry issues - meetings - informational speakers - discounts on professional
enhancement training - business development - fax and email updates - elementary and high school
educational programs
12
Membership Recruitment Acquiring members is a critical function for any organization in order to achieve success. Thus, this study collected information on the techniques used to recruit members. Responses were similar and included word-of-mouth, newsletters, direct mail, and media publicity. However, the most common method was for the organization to produce tangible results and demonstrate the benefits of membership to potential members. Being recognized as a successful organization was indicated as the best method to receive results when recruiting new members. Initial Considerations for Organizing Motivating factors Participating organizations were asked the factors that motivated the development of their organizations. Reponses commonly fell into five categories, which include:
• unified voice/industry interaction, • education /information dissemination, • laws/regulations, • research/competition, and • marketing/promotion.
Some organizations listed several of these factors as reasons for organizational development. However, most of the responding organizations emphasized a single major factor which generated the need for an organizational voice to represent the industry. Six of the responding organizations indicated that an actual crisis situation produced the need for organizational development. For example, one organization cited efforts to deal with federal price controls as a factor that caused the need for an organization to form. Another organization could not compete in the national market due to paying high royalty prices on seed; thus, research and development was necessary to create a local product variety. Key issues to address There are several key issues that need to be considered before developing an organization. Participating organizations were asked to provide suggestions on what some of those key issues are. The responses commonly cited as the major issues to address for successful organizational development include:
• a strong volunteer base, • a recognized need by industry for a unified voice, • an agreed mission by the majority of the industry, • high interest in organizing by a large group of industry representatives, • financial commitments, • geographic spread, • common motivating factors, • industry consensus on the approach to organizing, • a specific need or crisis in need of a response, • adequate representation of industry from membership,
13
• funds for a good professional staff, and • leadership (support and guidance from key local industry leaders).
Four of the responding organizations mentioned that this was not the first time that
they had attempted to organize. Previous attempts for these organizations failed for several different reasons, some financial and some situational. Nonetheless, these failed attempts demonstrate the level of difficulty in starting an organization and highlight the importance of researching the need for an organization’s existence and development for the long-term success of the organization. Possible Organizational Roadblocks Several respondents referenced obstacles or roadblocks that could interfere in the organizational development process. Some of the responses indicated that there is often an issue with members who benefit from the organization’s services but do not contribute to the organization aside from the mandatory dues collected. These members were defined as “free-riders” by many of the respondents. Another roadblock mentioned was the problem with assessment-based revenue generating structures and the reliance on the membership to collect the correct amount of dues. Most of the organizations operating on this type of structure utilize an honor-code system for reporting acreage, production rates, or sales. Without having an official system of record keeping that can be enforced through penalty, which may not be practical, it is very difficult to avoid this problem when using an assessment-based revenue structure.
Some other problems or obstacles that organizations must face when developing include:
• keeping the scope of the organization limited, • setting priorities, • mobilizing leaders, • securing the financial stability to operate on more than just volunteers, • agreeing as an industry on key issues, and • establishing a common mutual goal that will benefit all involved.
Some of these items listed are not actual obstacles that will be encountered but rather items that may cause obstacles if they are not considered and accounted for in the planning process. Measurement of Success Participating organizations were asked how they measure their success; or, how do they know they are successful? The most common response was that success was measured by evaluating membership levels - the more members that the organization attracted, the more successful the organization was deemed to be. Another common indicator of success mentioned by respondents was the ability of the organization to resolve industry issues. These organizations considered themselves to be successful if they represented their membership on issues that had a positive outcome. Other responses focused on the organization’s status in the industry or their financial status as a measure of success. One
14

response was “if we are still here, we are still successful.” This statement clearly expresses the complexity and difficulty of nonprofit survival. Recommendations from Organizations Finally, respondents were asked to provide advice for aspiring organizations based on their own organizational experiences. Responses were candid but extremely insightful. Common themes of the responses included:
• prioritizing issues on which to focus as an industry, • earning participation by majority of the industry so as to have unity, • gaining commitment of industry leaders, and • hiring a professional staff so as not to be dependent entirely upon volunteers.
Supporting the theme of prioritizing industry issues, one respondent suggested that
“In the initial stages of organizational development, list the issues that are a concern for all involved. Agree to disagree on other issues. The list of common issues is sure to be longer. However, having one voice, or entity, to recognize as the contact for the industry is critical.” Gaining commitment of industry leaders was another piece of advice given by several respondents. “Develop and elect qualified leaders with a vision” was one response received. Another respondent echoed this remark by saying “Enthusiastic commitment from leaders as well as their active participation is necessary.” Another theme elicited by the responses was that hiring professional staff is critical, especially in the initial stages of development. One respondent noted that “Do not run the organization with just volunteers, hire a professional person at the outset. Members are too busy to run a volunteer organization and the organization will flounder unless there is a paid professional staff.”
Several other comments did not fall under a particular theme but are important to
consider when organizing an industry-wide coalition. One respondent mentioned that as an organizational leader, “you must ensure that you (and your membership) are willing to make decisions based on the good of the industry as a whole versus personal gain or interest.” Finally, a perceptive response by one individual was to focus on the adage of strength in numbers. “One person cannot do it alone. The value of a collective organization to represent an industry cannot be overstated. The value of the group will be more than the sum of the parts and yet only as good as the time and effort of the members.” The advice provided by those individuals that have already experienced organizational development and maintenance first-hand is invaluable to those that have not.
15
Suggestions The clam farming community in Florida is not unfamiliar with the need to organize.
Over the past 15 years, there have been several organizations that have formed to promote industry interests. These have been mostly local or regional in their intent. For example, the Florida Shellfish Farmers Association (FSFA) was founded in 1988 as the industry began developing on the east coast. Although this nonprofit association originally consisted of growers from Brevard and Indian River Counties, members included growers from the Gulf coast as the industry expanded to other areas of the state. The FSFA has had an impressive tract record as they addressed issues and regulatory roadblocks which hindered the early development of the industry, such as the reduction of minimum size regulations for harvesting cultured clams in 1994. On a regional level, they maintained an active involvement in water quality issues affecting the Indian River, working with water management districts, county commissions, and state agencies. State legislative efforts from 1996 through 1999 resulted in monumental changes for aquaculture – defining aquaculture to be agriculture and shellfish aquaculture to be in the public interest, placing aquaculture in the Department of Agriculture and Consumer Services and creation of the Division of Aquaculture, implementing a certificate of registration program and best management practices, and streamlining the leasing process. With these changes, the FSFA board of directors decided its mission had been completed. Although this association remains incorporated, it is currently inactive.
In the late 1990s, other clam growers’ organizations developed on the Gulf coast to
address local needs or issues. A cooperative, the Placida Clam Coop, was formed in southwest Florida in 1997. At one point in time, up to 50 members were involved in processing and marketing clams from the area. The Hidden Coast Shellfish Producers Association became incorporated in 1998 for the initial intent of serving as an administrative entity for a community land-based nursery project in Dixie County. Since then, the group became active in other aspects of their industry – initiating reclassification of their shellfish harvesting waters and investigating export markets through a federal grant. Another nonprofit grower association was formed in 2000 for the purpose of advancement and promotion of the aquaculture industry in the Cedar Key area. With over 150 members, the Cedar Key Aquaculture Association has had early successes in addressing local development and water quality issues. Last year this group took a leadership role in soliciting state funding for a marketing campaign. With increased production and depressed markets due to a national economic recession, dockside and wholesale clam prices reached the lowest ever realized by this industry. This year the clam aquaculture industry in Florida was faced with another crisis when funding for the Division of Aquaculture was initially eliminated from the state budget. Industry representatives banned together to effectively lobby the state legislation to reinstate the agency funding. Just as important, the industry realized that when they work together they possess a powerful voice.
Although the results from this study cannot be generalized to all organizational
situations, these results do provide guidance and suggestions for those individuals or industries that are interested in organizing. There are a variety of organizational structures and revenue generating strategies presented and discussed within this report. This research
16

17
has revealed several options and alternatives that the Florida clam aquaculture industry could evaluate in assessing how to organize through a unified industry approach. Several organizational structures and strategies are suggested below.
Maintain status quo
The first, and certainly easiest, option for the clam aquaculture industry is to keep things the way they are, or maintain the status quo. The industry already has several organizations that can continue to address issues and needs on a local or regional level. In the event another statewide threat or need emerges, the industry can still react. Unfortunately, this type of response is not proactive and may not always result in a favorable outcome. Further, this does not allow the full strength of the industry, in terms of numbers and diversity, to influence policy, rule making, or state legislation. This type of approach would also have limitations in addressing issues on a federal level. Other disadvantages of this option are it limits the industry in effectively lobbying for funding, creating industry-wide initiatives such as marketing and promotion, and looking to the future needs of the clam farming community in Florida.
Join an existing organization
This option suggests that the industry maintain its current organizational strategy on a local level in addition to joining an existing organization for statewide representation. The “umbrella” organization could provide services, such as lobbying and administrative support. This concept can be effective as survey results identified several successful organizations that represent multiple commodities, for example fruits and vegetables. There are existing organizations incorporated in Florida with missions and goals that would allow for representation of the clam aquaculture industry. These organizations are also structured to represent multiple commodity groups. For example, the mission of the Florida Aquaculture Association, a nonprofit organized in 1983, has been to “enhance the well being of aquaculture firms and to work cooperatively with government agencies to foster the various segments of Florida’s diverse aquaculture industry.” Other umbrella organizations exist and should be considered to determine which would provide the “best fit” for the clam culture industry. Advantages of this option are it eliminates a “start up” period and allows the industry to gain immediate recognition within an established organization. Further, it shares the expenses related to a maintaining a lobbyist and administrative staff with other like-minded groups. Disadvantages of this option must also be considered. For example, a grower may have to pay membership dues twice. However, since most of the local associations dues are low ($20-$50 fixed fee) this should not limit an individual grower from joining another organization. Another possible disadvantage would be if the clam culture industry felt they could not achieve adequate representation on the board of directors of an “umbrella” organization to meet their specific needs. Since this option is a compromising approach, the outcome may be as well.
Create a statewide organization
This option would enable all clam aquaculture businesses in Florida, including growers, seed suppliers and wholesalers, to establish a new organizational structure that would represent their industry from a statewide perspective. By creating a new organization, disadvantages encountered in the options suggested above would be avoided. Yet, this approach would create a new set of circumstances to deal with and necessitate more planning than the previous options. The organization could serve as an umbrella organization for existing growers associations to operate within, or eliminate the need for separate local or regional representation. Using information generated from this survey report, the following provides suggestions on how this new industry-wide organization could structure their group, set membership dues, generate additional funds, establish a board of directors, and proceed in developing effective representation.
• Structure - The most common organizational structure for agricultural and aquaculture commodity groups identified in the survey was a nonprofit trade association. This structure should allow clam farmers to carry out common objectives of promotion, advancement, and protection of the industry. To advocate just and proper laws and regulations for shellfish aquaculture, the nonprofit should chose a tax exemption classification of 501c(5). This classification would also enable the organization to conduct lobbying activities.
• Membership - The clam aquaculture community is comprised of a number of types of businesses. Membership eligibility should reflect this diversity and allow anyone deriving income from clam farming to become an active member. The Department of Agriculture and Consumer Service’s Division of Aquaculture implements a certificate of registration program for aquatic growers. The number of clam aquaculturists, including leaseholders, authorized users, sublessees, hatchery and land-based nursery operators, certified through this program during 2003-4 is 435. This particular program does not identify shellfish wholesalers. There are currently 55 certified in the state, but many dealers are also involved in other aspects of the business. Other clam farming community members include bag manufacturers, suppliers, employees, and truck drivers. Thus, the total number of potential active members could be as high as 500. A category for those interested in the business, agency staff, and extension personnel should also be considered. However, an associate membership category usually does not allow voting privileges. • Dues - In order to financially support their organization, clam industry members would need to establish a dues structure as well as identify additional revenue generating activities. It was cautioned by some of the survey respondents that limiting income to just dues was problematic. In order to determine a fees structure, the proposed organization’s steering committee should first evaluate how much money would be needed to carry out its objectives. Once a financial goal is set, then the committee can evaluate dues alternatives. In this discussion, it is assumed by the authors that a realistic, but, hopefully, attainable budget of $50,000 per year would allow the organization to support a part-time lobbyist and part-time administrative
18
staff (secretary/bookkeeper), as well as conduct or fund necessary activities. To further explore this scenario, it is proposed by the authors that 65 percent, or about $32,000, of the organization’s budget would be derived from dues. Note questions regarding budgetary requirements of organizations were not included in the survey.
o Fixed rate - Since the majority of responding organizations in this survey reported a voluntary fixed rate dues structure, this may be the easiest to implement. Survey results also indicated that on an average the responding organizations represented about 60 percent of their total industry. Thus, the proposed clam aquaculture organization may anticipate representing about 300 active members. At a $100 fixed rate, the average fixed dues reported in this study, $30,000 could be generated for the organization. It may be assumed that associate membership dues would provide additional income.
o Assessment-based - Several examples of assessment-based dues structures provided in this report can be applied to the clam aquaculture industry. Options include assessing membership fees on acreage, production, or total sales. However, each option must allow for a fixed fee since not all potential organizational members may fit the taxing requirement. For example, not all industry members are leaseholders. Although more elaborate than a fixed dues structure, organizations reporting using this option did so on an honor basis with successful results. The planning committee of the proposed clam organization would have to determine if a voluntary assessment-based dues structure would meet with similar results. The following provides an example of how each of these assessment options can be applied to a statewide clam industry organization.
Acreage assessment - There are about 1700 acres of submerged lands dedicated to shellfish aquaculture leases in the state. Using the 60 percent participation rate applied in the fixed dues example above, 1000 acres would be assessed by the organization. Setting dues at $30 per acre would generate $30,000 for the organization. Interestingly, this dues fee is similar to that charged by the state for annual lease rental and surcharge fees. Since the average growout operation is about 4 acres in size, the average fee per member generated by this option would be about $120. A maximum cap could be set for businesses with higher acreage as well as a fixed fee for those members without leases.
Production assessment - The most recent aquaculture survey conducted in
2001 reported 142 million clams sold by growers in the state that year (USDA, 2002). Using this production amount and a 60 percent participation rate, 85 million clams would be assessed by the organization. To achieve the budgetary goal defined above, a fee of $3.50 per 10,000 clams produced, or $0.35 per 1000, would be necessary. Again, application of this option would be limited to growers. A production assessment could be adapted for seed producers or a fixed fee could be set which would also be applicable to other businesses, such as wholesalers or suppliers.
19
Sales volume assessment - The 2001 aquaculture survey reported a farm
gate sales value of $15 million for marketable clams and $3.3 million for seed clams (USDA, 2002). Appling an ad valorem (volume) tax of 0.3 percent of the total sales per grower and 0.15 percent of total sales per seed supplier would generate $30,000 in dues to the organization, assuming a 60 percent participation rate. The lower tax rate of 0.15 percent could also be applied to wholesale sales. The assessment could be charged annually at the end of each fiscal or calendar year. Further, the organization could establish fixed rate categories for a range of sales that a member would fit into based on their business volume. This dues based assessment option should apply to almost all sectors of the industry.
Both the fixed rate and assessment-based options suggested above for a dues
structure would rely upon voluntary participation. To establish a mandatory dues structure for a new industry organization would require a strong and committed membership base. Further, the process in establishing either a checkoff program or marketing order exceeds a year to a year and a half in preparation by the industry and state or federal agency involved. To gain the broad industry support and consensus that is required of these programs suggests that the clam aquaculture industry would first need to establish a viable statewide organization. After which, the organization should consider these programs if they provide solutions to the industry’s problems or needs.
• Additional revenue generating strategies - A variety of activities were identified in this survey, which should assist a clam aquaculture organization in generating additional funds. Newsletter advertising, proceeds from meetings and conferences, sponsorships, and sales of promotional paraphernalia would all have application. There are other unique strategies waiting to be identified. For example, the association could sponsor the production of a wholesale dealer’s tag, which would feature the organization’s logo and Fresh from Florida promotional information. Through the advantage of bulk buying, a rebate could be recouped by the organization from the manufacturer. • Board of directors - The majority of the boards represented in the study were elected with an average size of 14 directors. This size should be adequate to serve the various interests within the clam aquaculture industry for the purpose of state representation. However, a suggestion would be to designate some of these positions as appointed versus elected by the membership. In doing so, the organization would ensure that proper representation of the various business sectors within the industry were included in the organization’s decision making. Further, if this organization was to serve as an “umbrella” for existing regional grower associations, then the board should also be comprised of appointees from those associations as well. The suggestions above may provide a starting point for leaders within the clam
aquaculture industry to consider, adopt, or reject. Regardless, the need for the clam
20

aquaculture industry to work together on common industry issues through an organizational structure is valid. The testimonies of the respondents in this survey can only endorse the need. To consider facing tomorrow’s challenges on an individual basis rather than through a unified industry approach, places at risk the number of viable small businesses that comprise the hard clam aquaculture industry in Florida.
21
References Dillman, D.A. (2000). Mail and internet surveys: The tailored design method (2nd ed.). New
York, NY: John Wiley & Sons, Inc. Florida Department of Agriculture And Consumer Services (2000). Agricultural Group and
Associations: www.florida-agriculture.com. Retrieved February 7, 2003 from the World Wide Web: http://www.fl-ag.com/AgGroups/.
Gallagher, R. (2002). Aquaculture Magazine Buyer’s Guide and Industry Directory.
Asheville, NC: Achill River Corp. 290 pp. Glaser, B. (1978). Theoretical sensitivity. Mill Valley, CA: The Sociology Press. Philippakos, E., Adams, C., Hodges, A., Mulkey, D., Comer, D., & Sturmer, L.N. (2001).
The economic impact of the Florida cultured hard clam industry. Florida Sea Grant, SGR 123, Gainesville, FL: University of Florida. 23 pp.
United States Department of Agriculture. (1988). Florida agriculture – aquaculture.
Orlando, FL: Florida Agricultural Statistics Service. 4 pp. United States Department of Agriculture. (2001, December). AFSIC: Aquaculture Resources.
Retrieved April 1, 2003 from the World Wide Web: http://www.nal.usda.gov/afsic/afsaqua.htm.
United States Department of Agriculture. (2002). Florida agriculture – aquaculture.
Orlando, FL: Florida Agricultural Statistics Service. 4 pp. United States House Committee on Agriculture Glossary. Retrieved September 17, 2003
from the World Wide Web: http://www.house.gov/search97cgi/.
22

Appendices
23
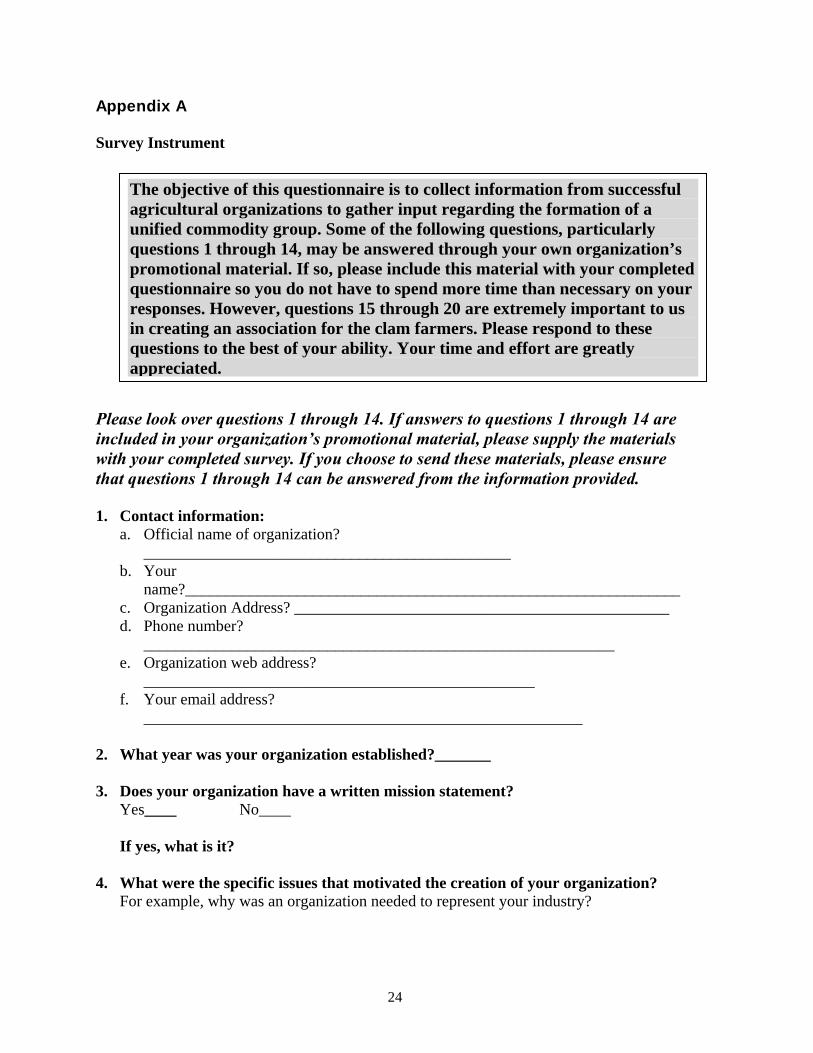
Appendix A Survey Instrument Pleainclwiththat 1. C
a
b
cd
e
f
2. W 3. D
Y I
4. W
F
The objective of this questionnaire is to collect information from successful agricultural organizations to gather input regarding the formation of a unified commodity group. Some of the following questions, particularly questions 1 through 14, may be answered through your own organization’s promotional material. If so, please include this material with your completed questionnaire so you do not have to spend more time than necessary on your responses. However, questions 15 through 20 are extremely important to us in creating an association for the clam farmers. Please respond to these questions to the best of your ability. Your time and effort are greatly appreciated.
se look over questions 1 through 14. If answers to questions 1 through 14 are uded in your organization’s promotional material, please supply the materials your completed survey. If you choose to send these materials, please ensure questions 1 through 14 can be answered from the information provided.
ontact information: . Official name of organization?
______________________________________________ . Your
name?______________________________________________________________ . Organization Address? _______________________________________________ . Phone number?
___________________________________________________________ . Organization web address?
_________________________________________________ . Your email address?
_______________________________________________________
hat year was your organization established?_______
oes your organization have a written mission statement? es____ No____
f yes, what is it?
hat were the specific issues that motivated the creation of your organization? or example, why was an organization needed to represent your industry?
24
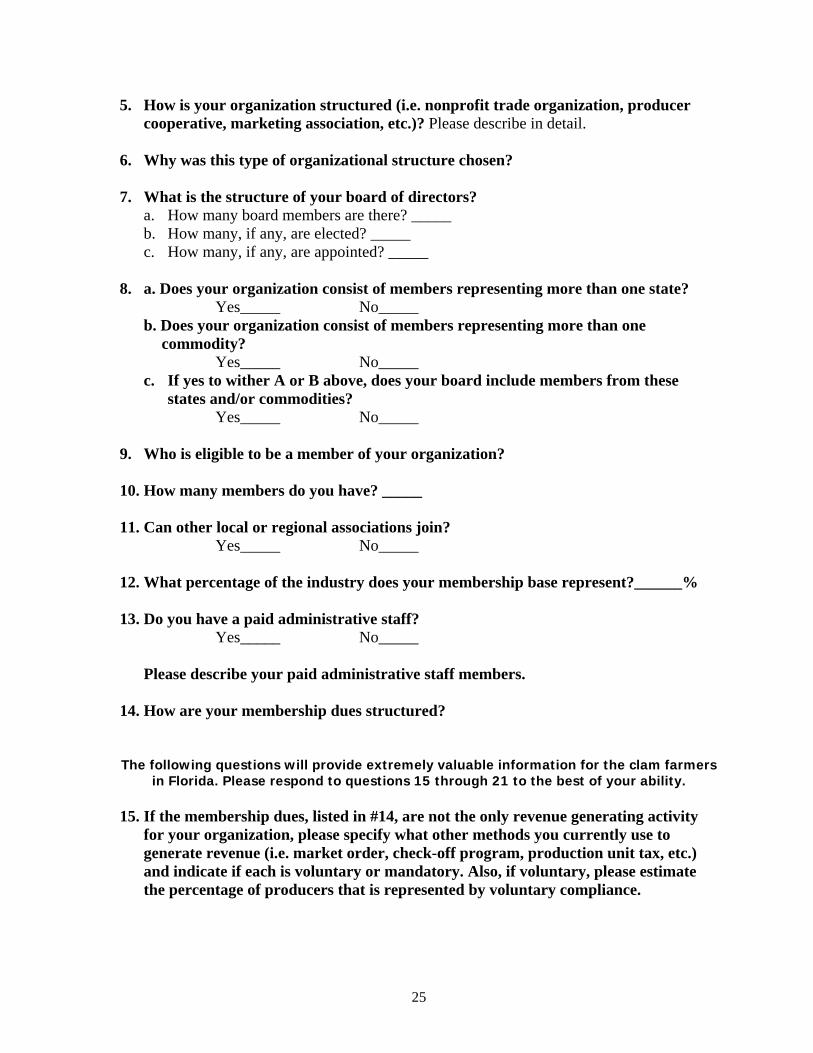
5. How is your organization structured (i.e. nonprofit trade organization, producer cooperative, marketing association, etc.)? Please describe in detail.
6. Why was this type of organizational structure chosen? 7. What is the structure of your board of directors?
a. How many board members are there? _____ b. How many, if any, are elected? _____ c. How many, if any, are appointed? _____
8. a. Does your organization consist of members representing more than one state? Yes_____ No_____
b. Does your organization consist of members representing more than one commodity?
Yes_____ No_____ c. If yes to wither A or B above, does your board include members from these
states and/or commodities? Yes_____ No_____
9. Who is eligible to be a member of your organization? 10. How many members do you have? _____ 11. Can other local or regional associations join?
Yes_____ No_____ 12. What percentage of the industry does your membership base represent?______% 13. Do you have a paid administrative staff?
Yes_____ No_____
Please describe your paid administrative staff members. 14. How are your membership dues structured? The following questions will provide extremely valuable information for the clam farmers
in Florida. Please respond to questions 15 through 21 to the best of your ability. 15. If the membership dues, listed in #14, are not the only revenue generating activity
for your organization, please specify what other methods you currently use to generate revenue (i.e. market order, check-off program, production unit tax, etc.) and indicate if each is voluntary or mandatory. Also, if voluntary, please estimate the percentage of producers that is represented by voluntary compliance.
25
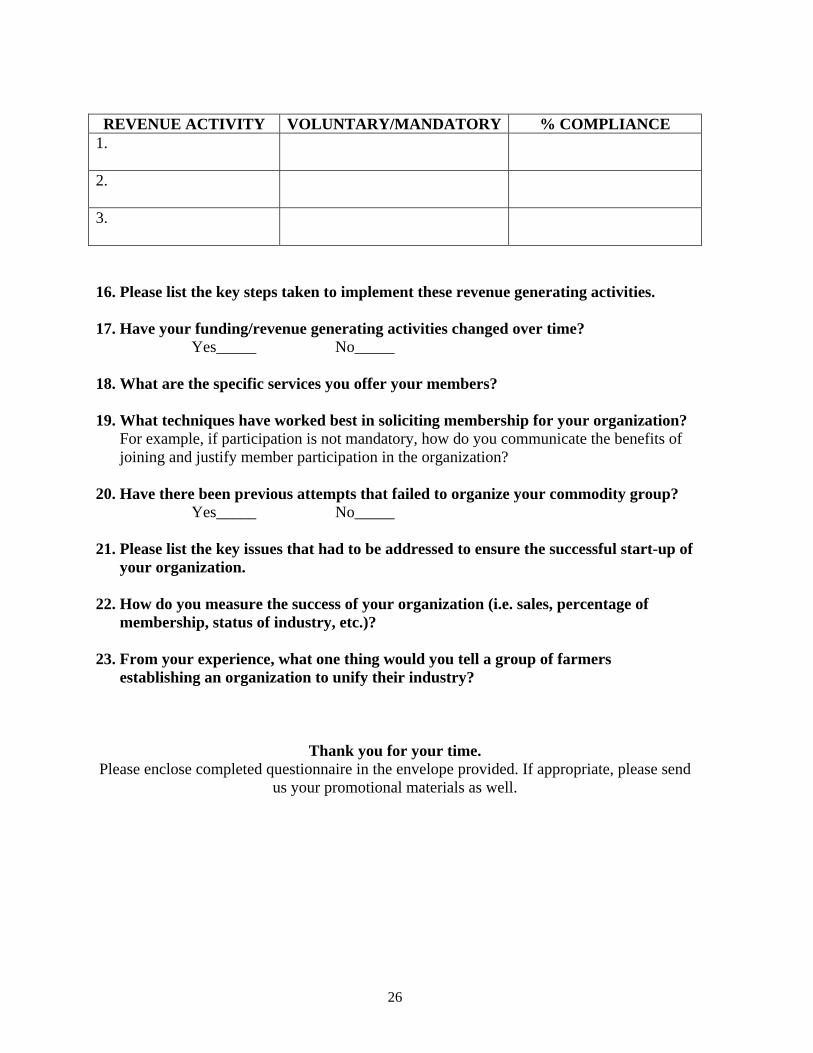
REVENUE ACTIVITY VOLUNTARY/MANDATORY % COMPLIANCE
1.
2.
3.
16. Please list the key steps taken to implement these revenue generating activities. 17. Have your funding/revenue generating activities changed over time?
Yes_____ No_____ 18. What are the specific services you offer your members? 19. What techniques have worked best in soliciting membership for your organization?
For example, if participation is not mandatory, how do you communicate the benefits of joining and justify member participation in the organization?
20. Have there been previous attempts that failed to organize your commodity group?
Yes_____ No_____ 21. Please list the key issues that had to be addressed to ensure the successful start-up of
your organization. 22. How do you measure the success of your organization (i.e. sales, percentage of
membership, status of industry, etc.)? 23. From your experience, what one thing would you tell a group of farmers
establishing an organization to unify their industry?
Thank you for your time. Please enclose completed questionnaire in the envelope provided. If appropriate, please send
us your promotional materials as well.
26
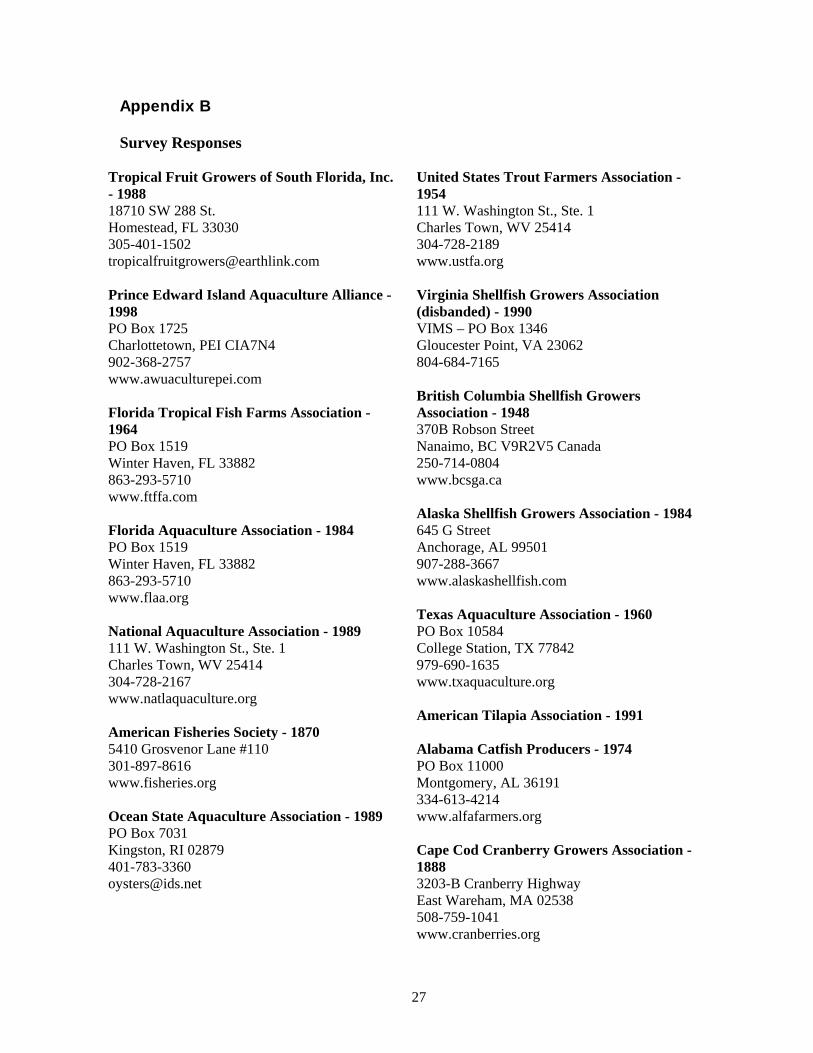
Appendix B Survey Responses
Tropical Fruit Growers of South Florida, Inc. - 1988 18710 SW 288 St. Homestead, FL 33030 305-401-1502 [email protected] Prince Edward Island Aquaculture Alliance - 1998 PO Box 1725 Charlottetown, PEI CIA7N4 902-368-2757 www.awuaculturepei.com Florida Tropical Fish Farms Association - 1964 PO Box 1519 Winter Haven, FL 33882 863-293-5710 www.ftffa.com Florida Aquaculture Association - 1984 PO Box 1519 Winter Haven, FL 33882 863-293-5710 www.flaa.org National Aquaculture Association - 1989 111 W. Washington St., Ste. 1 Charles Town, WV 25414 304-728-2167 www.natlaquaculture.org American Fisheries Society - 1870 5410 Grosvenor Lane #110 301-897-8616 www.fisheries.org Ocean State Aquaculture Association - 1989 PO Box 7031 Kingston, RI 02879 401-783-3360 [email protected]
United States Trout Farmers Association - 1954 111 W. Washington St., Ste. 1 Charles Town, WV 25414 304-728-2189 www.ustfa.org Virginia Shellfish Growers Association (disbanded) - 1990 VIMS – PO Box 1346 Gloucester Point, VA 23062 804-684-7165 British Columbia Shellfish Growers Association - 1948 370B Robson Street Nanaimo, BC V9R2V5 Canada 250-714-0804 www.bcsga.ca Alaska Shellfish Growers Association - 1984 645 G Street Anchorage, AL 99501 907-288-3667 www.alaskashellfish.com Texas Aquaculture Association - 1960 PO Box 10584 College Station, TX 77842 979-690-1635 www.txaquaculture.org American Tilapia Association - 1991 Alabama Catfish Producers - 1974 PO Box 11000 Montgomery, AL 36191 334-613-4214 www.alfafarmers.org Cape Cod Cranberry Growers Association - 1888 3203-B Cranberry Highway East Wareham, MA 02538 508-759-1041 www.cranberries.org
27

Florida Christmas Tree Association - 1982 443 Copy Drive Orange Park, FL 32073 904-272-3890 http://www.fl-ag.com Peace River Valley Citrus Growers Association - 1993 10 East Oak St., Suite B Arcadia, FL 34266 863-494-0061 [email protected] Florida Dairy Products Association - 1941 2558 Capital Medical Blvd., Suite B Tallahassee, FL 32308 850-878-3447 [email protected] Florida Department of Citrus - 1935 1115 East Memorial Blvd. PO Box 148 Lakeland, FL 33802-0148 863-499-2462 www.floridajuice.com Dairy Farmers, Inc. - 1958 166 Lookout Place, Suite 100 Maitland, FL 32751 407-647-8899 www.floridamilk.com Florida Poultry Federation, Inc. - 1961 4508 Oak Fair Blvd., Suite 298 Tampa, FL 33610 910-628-4551 Florida Nurseryman and Growers Association - 1952 1533 Park Center Drive Orlando, FL 32835 407-295-7994 www.fnga.org
FL Fruit & Vegetable Association - 1943 PO Box 140155 Orlando, FL 32814-0155 407-894-1351 www.ffva.com Sunshine State Milk Producers - 1998 PO Box 54766 Orlando, FL 32854 407-648-4311 Citrus Grower Associates, Inc. 2930 Winter Lake Road Lakeland, FL 33803 863-665-0709 Highlands County Citrus Growers Association - 1990 6419 US Highway 27 South Sebring, FL 33876 863-385-8091 www.hccga.com Gulf Oyster Industry Council - 1994 1039 Toulouse New Orleans, LA 70112 504-523-2651 www.gulfoysters.org Maine Aquaculture Association - 1980 207-622-0136 Florida Strawberry Growers Association – 1982 with funds from previous org. PO Drawer 2550 Plant City, FL 33564 813-752-6822 www.straw-berry.org/ Pacific Coast Shellfish Growers Association - 1930 120 State Avenue, NE, PMB#142 Olympia, WA 98501 360-754-2744 www.pcsga.com
28

Table 1. Question: What is your organization’s written mission statement? Respondent Response #1 Look up at www.fl-ag.com/tropical #2 To provide focus for the Prince Edward Island Aquaculture Industry and enhance the industries
prosperity through its development as an effective world competitor. #3 For integrity? #4 To enhance the well being of Florida aquaculture firms, to promote partnerships with their suppliers
and customers, and to cooperatively with governmental agencies to foster the aquaculture industry in Florida.
#5 To provide a unified national voice for aquaculture that ensures its sustainability, protects its profitability, and encourages its development in an environmentally responsible manner.
#6 To improve the conservation and sustainability of fishery resources and aquatic ecosystems by advancing fisheries and aquatic science and promoting the development of fisheries professionals.
#7 N/R #8 To protect and ensure the best interest of trout farmers in the US on legislative and marketing fronts,
to promote the trout industry and recreational trout fishing in the US, to cooperate with others on matters affecting the business and common interests, to serve as a medium for exchange of ideas and for dissemination of information pertinent to fish farming to members, to establish the image of a fairly-produce quality product for its market, and to foster cordial relations among the membership.
#9 To promote and develop cooperation and friendly relationships among its members, provide a medium of exchange of experiences and discussions of industry problems, to promote public education, to advocate just and proper laws and regulations that impact shellfish aquaculture, conduct activities necessary for the advancement , promotion and expansion of the industry in Virginia.
#10 The priority initiatives of the BCSGA include: water quality activities and programs, development of an industry driven Environmental Management System, including Codes of Practice, development of a farm-based HACCP system for improved food safety and quality assurance, and industry-led training programs (no specific mission on site)
#11 To promote shellfish mariculture in Alaska. #12 To provide for an industry-wide exchange of information and to act as a voice of the industry in
dealing with federal and state regulatory agencies #13 To support and facilitate the growth of the Tilapia production and consumption with the United States
with goals in education, member information and networking, government interactions and support for research.
#14 To ensure unlimited opportunities for our rural and agricultural community, through active, well-informed members, emphasizing education, research, government action, economic service, environmental stewardship, leadership development, and fellowship.
#15 Through a unified voice the CCCGA works to promote the cranberry industry through active grower volunteer committees in Public Relations and Promotions, Government Affairs, Research and Environmental Affairs.
#16 To provide education and information for Christmas Tree Growers in Florida #17 To protect, promote, and enhance the ability of our members to ensure citrus profitability and
efficiently. #18 Currently being prepared. #19 To enhance the welfare of the Florida citrus growers and the groves they operate. #20 To enhance the dairy farming industry’s image and increase milk and dairy-product sales statewide
via advertising, education and public relations. #21 Activities that relate to the protection, promotion, well-being and general prosperity of the National
Poultry industry located in the state of Florida. #22 To be the regional leader of Florida’s environmental horticulture industry by advancing its business
interests and enhancing our member’s success. #23 To enhance the competitive and business environment for producing and marketing fruits, vegetables
and other crops. #24 No mission
29

#25 N/A (letter) #26 To protect and enhance the viability and profitability of commercial citrus groves in Highlands
County, Florida. #27 To cooperate with Federal, State, and local regulatory officials toward the protection, promotion, and
advancement of the Gulf oyster industry in the United States, to balance public health protection with legitimate economic consideration, to continue to work cooperatively with shellfish regulators to improve and maintain water quality of our oyster harvest areas, and to promote a favorable regulatory environment for the Gulf oyster industry and prevent or modify legislation and regulation that are detrimental to the preservation and expansion of the Gulf oyster industry
#28 Confidential to members only #29 Partners in research, promotion, and member/community service. #30 Represent the local, state and federal interests of oyster, clam, mussel, scallop and geoduck growers
from Alaska, British Columbia, Washington, Oregon, California, Mexico and Hawaii. Involved in everything from environmental protection, shellfish safety and health issues and technological advances to international marketing and research.
Table 2. Question: What were the issues that motivated the creation of the organization? Respondent Response
#1 Established to pool resources, both financial and grower knowledge, to fund methods to make growers better at growing their tree crops. Also, funds were allocated for promotion of South Florida tropical fruit.
#2 Need to openly discuss issues, protect the interests of the growers, processors, packers and marketers of island aquaculture products, promote a cooperative spirit, and encourage industry, drive research and disseminate information.
#3 To purchase fish farm supplies in bulk to sell to members firms at discount prices. #4 To bring together, under one association, all of the diverse aquaculture commodity groups. #5 Need for a unified national voice. #6 To provide a scientific meeting ground for fish farmers. #7 Regulations hampered leasing #8 Need for a strong, unified voice for the national trout industry. #9 Formed by novice farmers who wanted to exchange experiences and learn more. Evolved into a
“political” group working to improve regulation and provide input to agencies. #10 Need to provide education information and assistance to members, promote the interests of persons,
firms and corporations engaged in the business of growing-servicing-supplying-harvesting –and selling aquatic invertebrates and marine plants, and to make representation on behalf of the shellfish industry to all levels of government.
#11 Need for unified voice in dealing with regulatory agencies, joint marketing, and grant recipients. #12 The state of Texas was giving away free fish, farmers could not compete. Now we are a way to
prevent passage of damaging laws. #13 In the early 90’s Tilapia was not well-known and needed exposure, which sparked the need for an
organized effort to get an INAD approval for the use and drugs in Tilapia culture and to garner research funding.
#14 Need to provide a structure and method of giving emphasis to the principle interest of the producer. #15 The need to standardize the marketing of cranberries and provide a venue for growers to share
information and solve common problems. #16 To answer the questions: can Christmas trees be grown in Florida? What types of information and
education are needed? The group was needed to attract vendors of specialized equipment and supplies and to conduct research with test plots.
#17 Local growers felt the statewide organization was not properly addressing their concerns. #18 (Pre-dates respondent) #19 There were quality issues, standards/regulations needed, and commodity marketing opportunities
recognized #20 (Pre-dates respondent)
30

#21 Taxes, regulations by government, and competition from other foods increased need for organized effort
#22 To join together for mutual purposes (i.e. marketing and government advocacy) #23 Coalesce fruit and vegetable industry efforts to deal with federal price controls in WWII. #24 N/R #25 Need for production research #26 The need to enhance the knowledge of citrus growers on issues potentially impacting their business
and fostering a positive public image. #27 Crises affecting the Gulf Oyster industry in 1994…FDA wanted to close oyster harvesting during the
summer – grassroots industry effort necessary for voice #28 Common issues regarding leasing of sub-tidal waters; and the desire to share information and present
a united front #29 Problems with not having local varieties, had to pay high royalties to California sparked need for
research and development to find local varieties for Florida #30 Organized to ensure a consistent supply of pacific oyster seed – it was a crisis situation Table 3. Question: How is your organization structured and why was this structure chosen? Respondent Response #1 Nonprofit grower association, unknown reason for choice #2 A company without share capital for the purpose of carrying out our objectives #3 Nonprofit trade association, chosen for IRS tax code considerations #4 Nonprofit trade organization, chosen for IRS tax regulations #5 501 (C) (5), chosen for IRS determination #6 Nonprofit scientific individual membership society, chosen because similar to other scientific
societies #7 Nonprofit 501 (C) (3)…should have gone (C) (6), chosen due to the need for lobbying #8 Nonprofit trade association 501 (C) (5), chosen because IRS determination #9 Nonprofit trade organization; however, never incorporated or registered with the state, chosen
because member had previous experience with this structure #10 Nonprofit corporation funded solely on membership fees, managed by a board of directors with staff
hired to conduct operations, chosen based on board directed decision #11 Nonprofit corporation, chosen to qualify under Alaskan statute #12 Nonprofit, chosen based on tax regulations #13 Nonprofit, based on membership dues that are tax deductible #14 Nonprofit independent voluntary organization, chosen to combine the advantages of commodity
activity with the strength of a general farm organization, it provides an opportunity for adequate financing
#15 Nonprofit trade organization 501 (C) (5) because of the lobbying efforts, there is also a subsidiary 501 (C) (3) research foundation to take in funds for general research and education
#16 Nonprofit corporation, chosen because best way to provide information and education #17 Nonprofit corporation 501 (C) (3), chosen because best suited to needs at inception #18 Nonprofit corporation, chosen for tax benefits #19 State agency with mandatory regulations and taxing authority, chosen to avoid free-rider problems
and show importance of industry in Florida #20 Producer cooperative, unknown reason for choice #21 Nonprofit trade organization, unknown reason for choice #22 Nonprofit trade association granted 501 (C) (6) status by the IRS, chosen because largely comprised
of business firms as opposed to a professional society comprised of individuals #23 Organized under Chapter 618 – Florida Statute (Agricultural Cooperative Marketing Association),
chosen for the cooperative protection #24 N/R #25 (letter) #26 Nonprofit grower membership corporation, chosen from legal and accounting counsel received
31
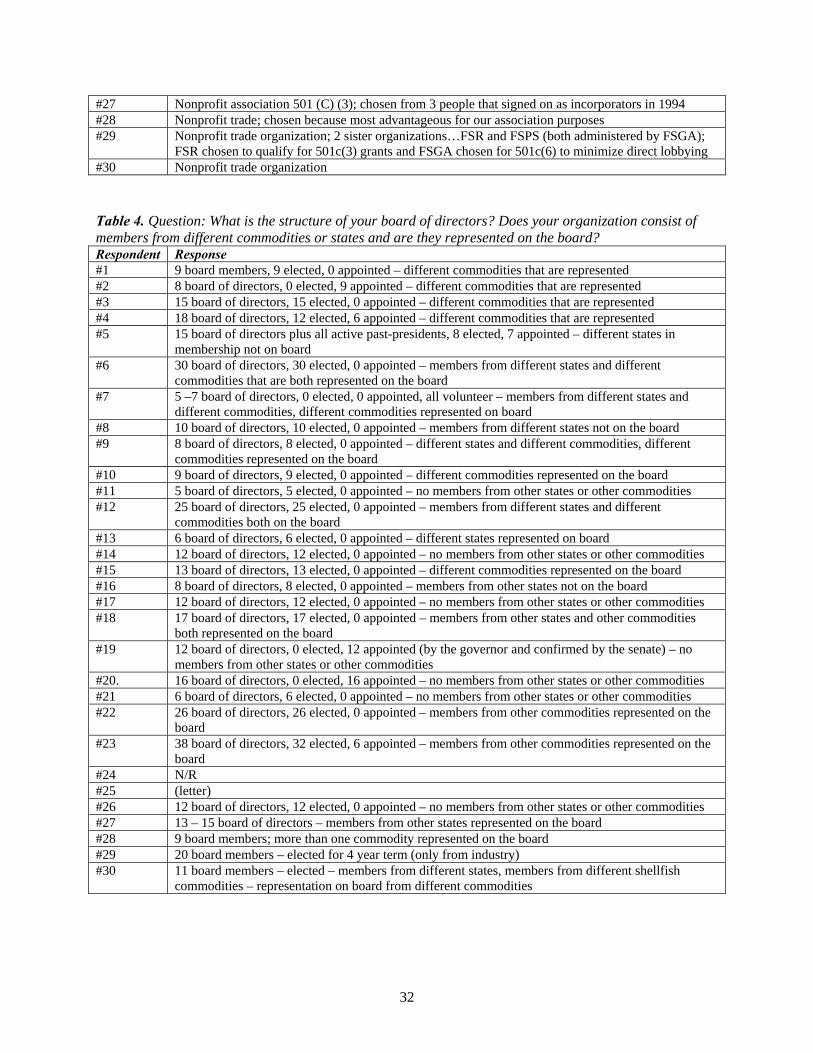
#27 Nonprofit association 501 (C) (3); chosen from 3 people that signed on as incorporators in 1994 #28 Nonprofit trade; chosen because most advantageous for our association purposes #29 Nonprofit trade organization; 2 sister organizations…FSR and FSPS (both administered by FSGA);
FSR chosen to qualify for 501c(3) grants and FSGA chosen for 501c(6) to minimize direct lobbying #30 Nonprofit trade organization Table 4. Question: What is the structure of your board of directors? Does your organization consist of members from different commodities or states and are they represented on the board? Respondent Response #1 9 board members, 9 elected, 0 appointed – different commodities that are represented #2 8 board of directors, 0 elected, 9 appointed – different commodities that are represented #3 15 board of directors, 15 elected, 0 appointed – different commodities that are represented #4 18 board of directors, 12 elected, 6 appointed – different commodities that are represented #5 15 board of directors plus all active past-presidents, 8 elected, 7 appointed – different states in
membership not on board #6 30 board of directors, 30 elected, 0 appointed – members from different states and different
commodities that are both represented on the board #7 5 –7 board of directors, 0 elected, 0 appointed, all volunteer – members from different states and
different commodities, different commodities represented on board #8 10 board of directors, 10 elected, 0 appointed – members from different states not on the board #9 8 board of directors, 8 elected, 0 appointed – different states and different commodities, different
commodities represented on the board #10 9 board of directors, 9 elected, 0 appointed – different commodities represented on the board #11 5 board of directors, 5 elected, 0 appointed – no members from other states or other commodities #12 25 board of directors, 25 elected, 0 appointed – members from different states and different
commodities both on the board #13 6 board of directors, 6 elected, 0 appointed – different states represented on board #14 12 board of directors, 12 elected, 0 appointed – no members from other states or other commodities #15 13 board of directors, 13 elected, 0 appointed – different commodities represented on the board #16 8 board of directors, 8 elected, 0 appointed – members from other states not on the board #17 12 board of directors, 12 elected, 0 appointed – no members from other states or other commodities #18 17 board of directors, 17 elected, 0 appointed – members from other states and other commodities
both represented on the board #19 12 board of directors, 0 elected, 12 appointed (by the governor and confirmed by the senate) – no
members from other states or other commodities #20. 16 board of directors, 0 elected, 16 appointed – no members from other states or other commodities #21 6 board of directors, 6 elected, 0 appointed – no members from other states or other commodities #22 26 board of directors, 26 elected, 0 appointed – members from other commodities represented on the
board #23 38 board of directors, 32 elected, 6 appointed – members from other commodities represented on the
board #24 N/R #25 (letter) #26 12 board of directors, 12 elected, 0 appointed – no members from other states or other commodities #27 13 – 15 board of directors – members from other states represented on the board #28 9 board members; more than one commodity represented on the board #29 20 board members – elected for 4 year term (only from industry) #30 11 board members – elected – members from different states, members from different shellfish
commodities – representation on board from different commodities
32
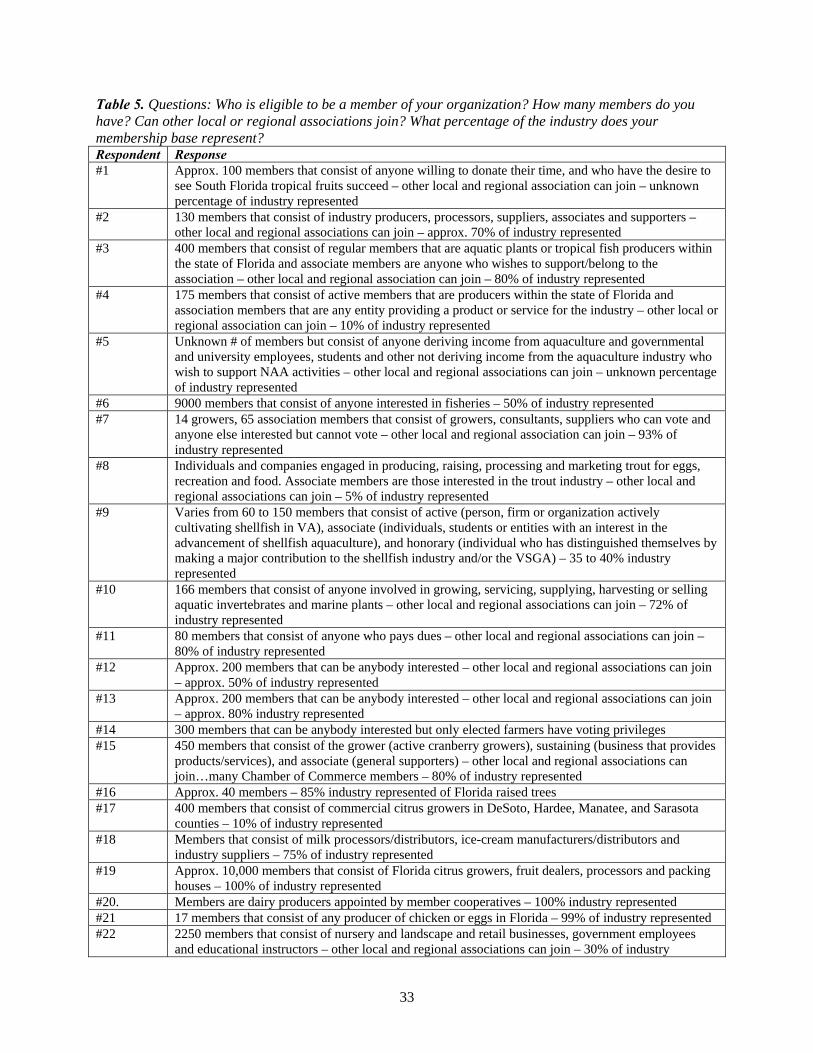
Table 5. Questions: Who is eligible to be a member of your organization? How many members do you have? Can other local or regional associations join? What percentage of the industry does your membership base represent? Respondent Response #1 Approx. 100 members that consist of anyone willing to donate their time, and who have the desire to
see South Florida tropical fruits succeed – other local and regional association can join – unknown percentage of industry represented
#2 130 members that consist of industry producers, processors, suppliers, associates and supporters – other local and regional associations can join – approx. 70% of industry represented
#3 400 members that consist of regular members that are aquatic plants or tropical fish producers within the state of Florida and associate members are anyone who wishes to support/belong to the association – other local and regional association can join – 80% of industry represented
#4 175 members that consist of active members that are producers within the state of Florida and association members that are any entity providing a product or service for the industry – other local or regional association can join – 10% of industry represented
#5 Unknown # of members but consist of anyone deriving income from aquaculture and governmental and university employees, students and other not deriving income from the aquaculture industry who wish to support NAA activities – other local and regional associations can join – unknown percentage of industry represented
#6 9000 members that consist of anyone interested in fisheries – 50% of industry represented #7 14 growers, 65 association members that consist of growers, consultants, suppliers who can vote and
anyone else interested but cannot vote – other local and regional association can join – 93% of industry represented
#8 Individuals and companies engaged in producing, raising, processing and marketing trout for eggs, recreation and food. Associate members are those interested in the trout industry – other local and regional associations can join – 5% of industry represented
#9 Varies from 60 to 150 members that consist of active (person, firm or organization actively cultivating shellfish in VA), associate (individuals, students or entities with an interest in the advancement of shellfish aquaculture), and honorary (individual who has distinguished themselves by making a major contribution to the shellfish industry and/or the VSGA) – 35 to 40% industry represented
#10 166 members that consist of anyone involved in growing, servicing, supplying, harvesting or selling aquatic invertebrates and marine plants – other local and regional associations can join – 72% of industry represented
#11 80 members that consist of anyone who pays dues – other local and regional associations can join – 80% of industry represented
#12 Approx. 200 members that can be anybody interested – other local and regional associations can join – approx. 50% of industry represented
#13 Approx. 200 members that can be anybody interested – other local and regional associations can join – approx. 80% industry represented
#14 300 members that can be anybody interested but only elected farmers have voting privileges #15 450 members that consist of the grower (active cranberry growers), sustaining (business that provides
products/services), and associate (general supporters) – other local and regional associations can join…many Chamber of Commerce members – 80% of industry represented
#16 Approx. 40 members – 85% industry represented of Florida raised trees #17 400 members that consist of commercial citrus growers in DeSoto, Hardee, Manatee, and Sarasota
counties – 10% of industry represented #18 Members that consist of milk processors/distributors, ice-cream manufacturers/distributors and
industry suppliers – 75% of industry represented #19 Approx. 10,000 members that consist of Florida citrus growers, fruit dealers, processors and packing
houses – 100% of industry represented #20. Members are dairy producers appointed by member cooperatives – 100% industry represented #21 17 members that consist of any producer of chicken or eggs in Florida – 99% of industry represented #22 2250 members that consist of nursery and landscape and retail businesses, government employees
and educational instructors – other local and regional associations can join – 30% of industry
33
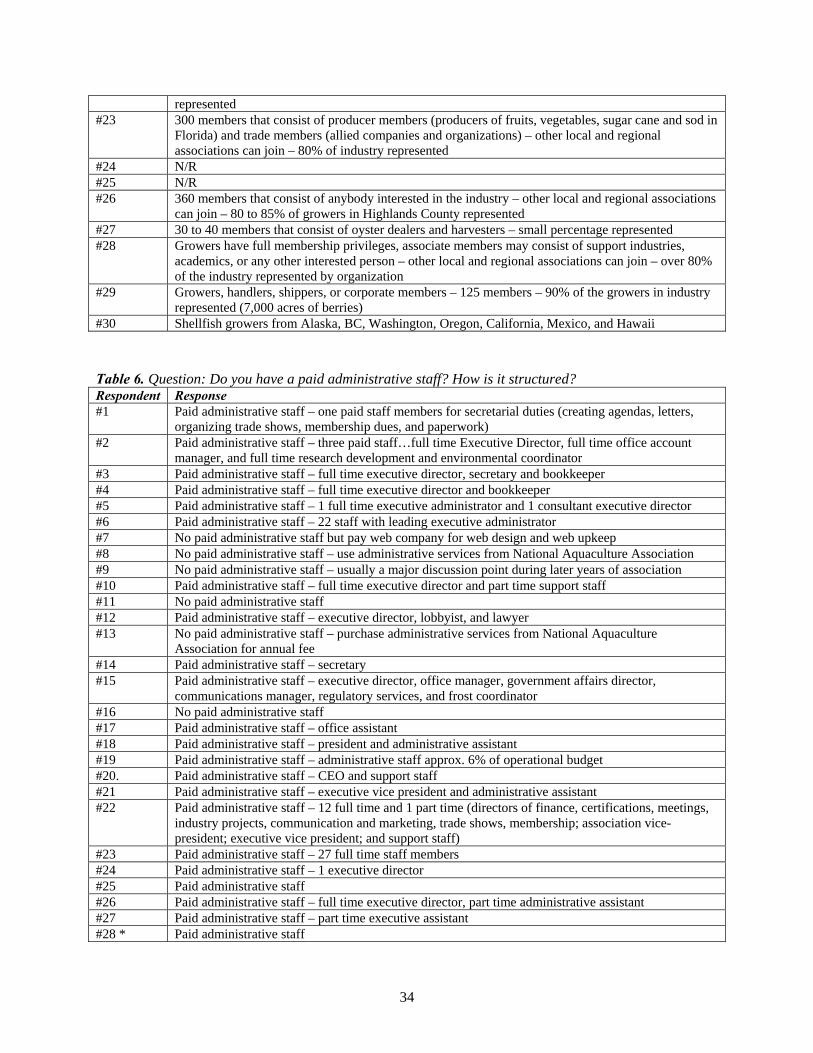
represented #23 300 members that consist of producer members (producers of fruits, vegetables, sugar cane and sod in
Florida) and trade members (allied companies and organizations) – other local and regional associations can join – 80% of industry represented
#24 N/R #25 N/R #26 360 members that consist of anybody interested in the industry – other local and regional associations
can join – 80 to 85% of growers in Highlands County represented #27 30 to 40 members that consist of oyster dealers and harvesters – small percentage represented #28 Growers have full membership privileges, associate members may consist of support industries,
academics, or any other interested person – other local and regional associations can join – over 80% of the industry represented by organization
#29 Growers, handlers, shippers, or corporate members – 125 members – 90% of the growers in industry represented (7,000 acres of berries)
#30 Shellfish growers from Alaska, BC, Washington, Oregon, California, Mexico, and Hawaii Table 6. Question: Do you have a paid administrative staff? How is it structured? Respondent Response #1 Paid administrative staff – one paid staff members for secretarial duties (creating agendas, letters,
organizing trade shows, membership dues, and paperwork) #2 Paid administrative staff – three paid staff…full time Executive Director, full time office account
manager, and full time research development and environmental coordinator #3 Paid administrative staff – full time executive director, secretary and bookkeeper #4 Paid administrative staff – full time executive director and bookkeeper #5 Paid administrative staff – 1 full time executive administrator and 1 consultant executive director #6 Paid administrative staff – 22 staff with leading executive administrator #7 No paid administrative staff but pay web company for web design and web upkeep #8 No paid administrative staff – use administrative services from National Aquaculture Association #9 No paid administrative staff – usually a major discussion point during later years of association #10 Paid administrative staff – full time executive director and part time support staff #11 No paid administrative staff #12 Paid administrative staff – executive director, lobbyist, and lawyer #13 No paid administrative staff – purchase administrative services from National Aquaculture
Association for annual fee #14 Paid administrative staff – secretary #15 Paid administrative staff – executive director, office manager, government affairs director,
communications manager, regulatory services, and frost coordinator #16 No paid administrative staff #17 Paid administrative staff – office assistant #18 Paid administrative staff – president and administrative assistant #19 Paid administrative staff – administrative staff approx. 6% of operational budget #20. Paid administrative staff – CEO and support staff #21 Paid administrative staff – executive vice president and administrative assistant #22 Paid administrative staff – 12 full time and 1 part time (directors of finance, certifications, meetings,
industry projects, communication and marketing, trade shows, membership; association vice-president; executive vice president; and support staff)
#23 Paid administrative staff – 27 full time staff members #24 Paid administrative staff – 1 executive director #25 Paid administrative staff #26 Paid administrative staff – full time executive director, part time administrative assistant #27 Paid administrative staff – part time executive assistant #28 * Paid administrative staff
34
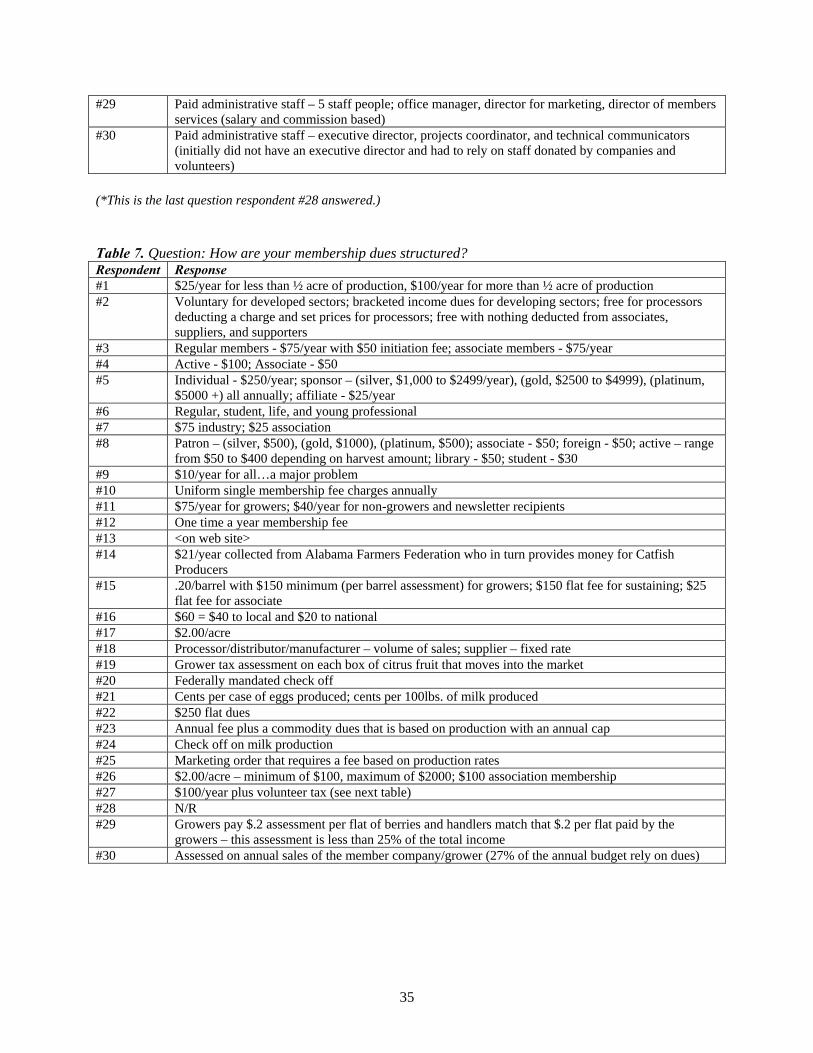
#29 Paid administrative staff – 5 staff people; office manager, director for marketing, director of members services (salary and commission based)
#30 Paid administrative staff – executive director, projects coordinator, and technical communicators (initially did not have an executive director and had to rely on staff donated by companies and volunteers)
(*This is the last question respondent #28 answered.) Table 7. Question: How are your membership dues structured? Respondent Response #1 $25/year for less than ½ acre of production, $100/year for more than ½ acre of production #2 Voluntary for developed sectors; bracketed income dues for developing sectors; free for processors
deducting a charge and set prices for processors; free with nothing deducted from associates, suppliers, and supporters
#3 Regular members - $75/year with $50 initiation fee; associate members - $75/year #4 Active - $100; Associate - $50 #5 Individual - $250/year; sponsor – (silver, $1,000 to $2499/year), (gold, $2500 to $4999), (platinum,
$5000 +) all annually; affiliate - $25/year #6 Regular, student, life, and young professional #7 $75 industry; $25 association #8 Patron – (silver, $500), (gold, $1000), (platinum, $500); associate - $50; foreign - $50; active – range
from $50 to $400 depending on harvest amount; library - $50; student - $30 #9 $10/year for all…a major problem #10 Uniform single membership fee charges annually #11 $75/year for growers; $40/year for non-growers and newsletter recipients #12 One time a year membership fee #13 <on web site> #14 $21/year collected from Alabama Farmers Federation who in turn provides money for Catfish
Producers #15 .20/barrel with $150 minimum (per barrel assessment) for growers; $150 flat fee for sustaining; $25
flat fee for associate #16 $60 = $40 to local and $20 to national #17 $2.00/acre #18 Processor/distributor/manufacturer – volume of sales; supplier – fixed rate #19 Grower tax assessment on each box of citrus fruit that moves into the market #20 Federally mandated check off #21 Cents per case of eggs produced; cents per 100lbs. of milk produced #22 $250 flat dues #23 Annual fee plus a commodity dues that is based on production with an annual cap #24 Check off on milk production #25 Marketing order that requires a fee based on production rates #26 $2.00/acre – minimum of $100, maximum of $2000; $100 association membership #27 $100/year plus volunteer tax (see next table) #28 N/R #29 Growers pay $.2 assessment per flat of berries and handlers match that $.2 per flat paid by the
growers – this assessment is less than 25% of the total income #30 Assessed on annual sales of the member company/grower (27% of the annual budget rely on dues)
35
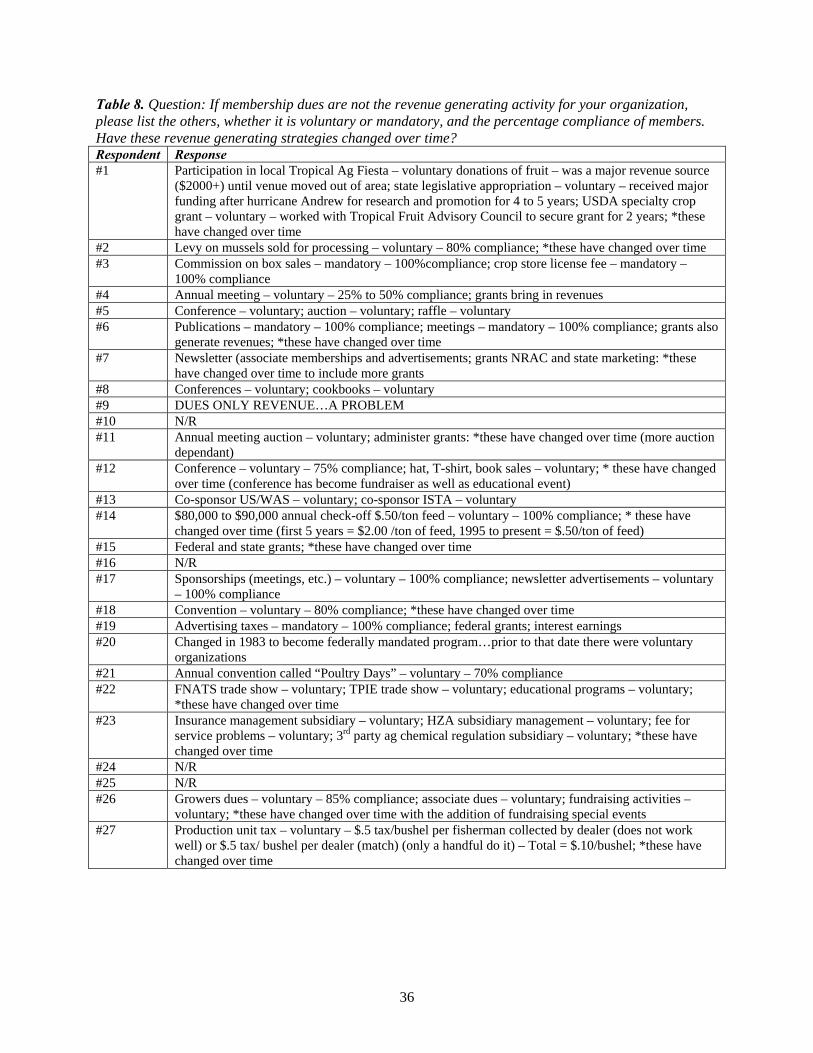
Table 8. Question: If membership dues are not the revenue generating activity for your organization, please list the others, whether it is voluntary or mandatory, and the percentage compliance of members. Have these revenue generating strategies changed over time? Respondent Response #1 Participation in local Tropical Ag Fiesta – voluntary donations of fruit – was a major revenue source
($2000+) until venue moved out of area; state legislative appropriation – voluntary – received major funding after hurricane Andrew for research and promotion for 4 to 5 years; USDA specialty crop grant – voluntary – worked with Tropical Fruit Advisory Council to secure grant for 2 years; *these have changed over time
#2 Levy on mussels sold for processing – voluntary – 80% compliance; *these have changed over time #3 Commission on box sales – mandatory – 100%compliance; crop store license fee – mandatory –
100% compliance #4 Annual meeting – voluntary – 25% to 50% compliance; grants bring in revenues #5 Conference – voluntary; auction – voluntary; raffle – voluntary #6 Publications – mandatory – 100% compliance; meetings – mandatory – 100% compliance; grants also
generate revenues; *these have changed over time #7 Newsletter (associate memberships and advertisements; grants NRAC and state marketing: *these
have changed over time to include more grants #8 Conferences – voluntary; cookbooks – voluntary #9 DUES ONLY REVENUE…A PROBLEM #10 N/R #11 Annual meeting auction – voluntary; administer grants: *these have changed over time (more auction
dependant) #12 Conference – voluntary – 75% compliance; hat, T-shirt, book sales – voluntary; * these have changed
over time (conference has become fundraiser as well as educational event) #13 Co-sponsor US/WAS – voluntary; co-sponsor ISTA – voluntary #14 $80,000 to $90,000 annual check-off $.50/ton feed – voluntary – 100% compliance; * these have
changed over time (first 5 years = $2.00 /ton of feed, 1995 to present = $.50/ton of feed) #15 Federal and state grants; *these have changed over time #16 N/R #17 Sponsorships (meetings, etc.) – voluntary – 100% compliance; newsletter advertisements – voluntary
– 100% compliance #18 Convention – voluntary – 80% compliance; *these have changed over time #19 Advertising taxes – mandatory – 100% compliance; federal grants; interest earnings #20 Changed in 1983 to become federally mandated program…prior to that date there were voluntary
organizations #21 Annual convention called “Poultry Days” – voluntary – 70% compliance #22 FNATS trade show – voluntary; TPIE trade show – voluntary; educational programs – voluntary;
*these have changed over time #23 Insurance management subsidiary – voluntary; HZA subsidiary management – voluntary; fee for
service problems – voluntary; 3rd party ag chemical regulation subsidiary – voluntary; *these have changed over time
#24 N/R #25 N/R #26 Growers dues – voluntary – 85% compliance; associate dues – voluntary; fundraising activities –
voluntary; *these have changed over time with the addition of fundraising special events #27 Production unit tax – voluntary – $.5 tax/bushel per fisherman collected by dealer (does not work
well) or $.5 tax/ bushel per dealer (match) (only a handful do it) – Total = $.10/bushel; *these have changed over time
36
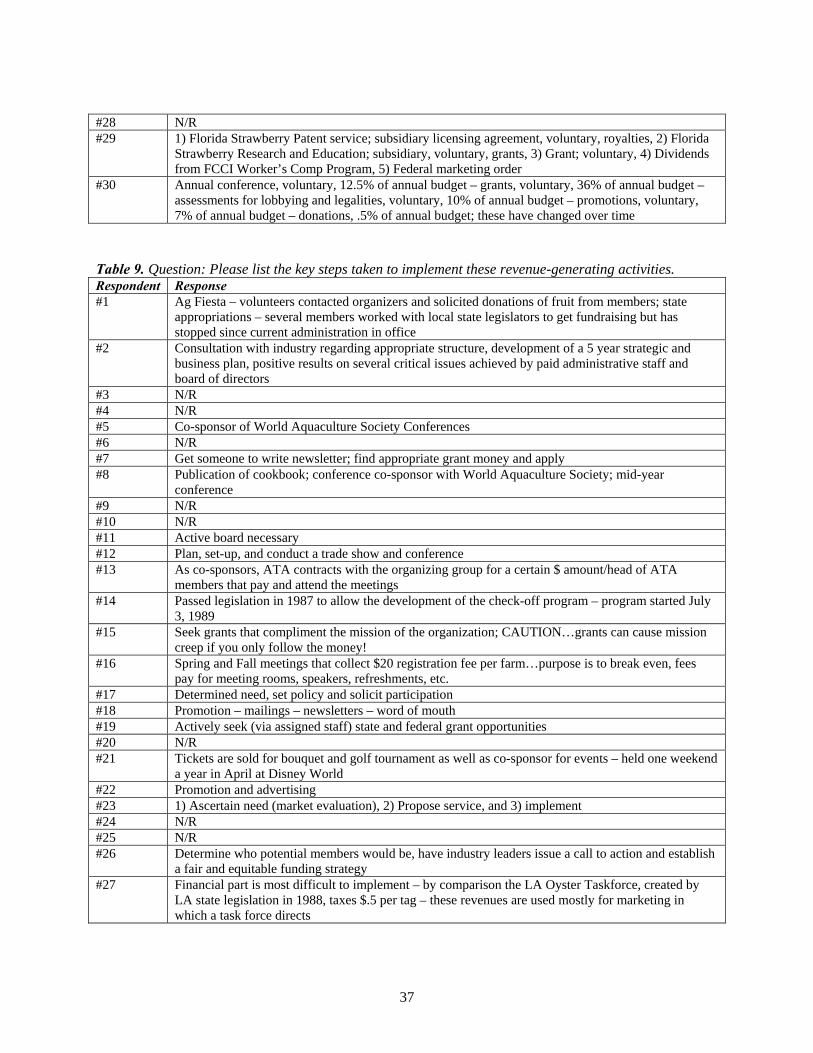
#28 N/R #29 1) Florida Strawberry Patent service; subsidiary licensing agreement, voluntary, royalties, 2) Florida
Strawberry Research and Education; subsidiary, voluntary, grants, 3) Grant; voluntary, 4) Dividends from FCCI Worker’s Comp Program, 5) Federal marketing order
#30 Annual conference, voluntary, 12.5% of annual budget – grants, voluntary, 36% of annual budget – assessments for lobbying and legalities, voluntary, 10% of annual budget – promotions, voluntary, 7% of annual budget – donations, .5% of annual budget; these have changed over time
Table 9. Question: Please list the key steps taken to implement these revenue-generating activities. Respondent Response #1 Ag Fiesta – volunteers contacted organizers and solicited donations of fruit from members; state
appropriations – several members worked with local state legislators to get fundraising but has stopped since current administration in office
#2 Consultation with industry regarding appropriate structure, development of a 5 year strategic and business plan, positive results on several critical issues achieved by paid administrative staff and board of directors
#3 N/R #4 N/R #5 Co-sponsor of World Aquaculture Society Conferences #6 N/R #7 Get someone to write newsletter; find appropriate grant money and apply #8 Publication of cookbook; conference co-sponsor with World Aquaculture Society; mid-year
conference #9 N/R #10 N/R #11 Active board necessary #12 Plan, set-up, and conduct a trade show and conference #13 As co-sponsors, ATA contracts with the organizing group for a certain $ amount/head of ATA
members that pay and attend the meetings #14 Passed legislation in 1987 to allow the development of the check-off program – program started July
3, 1989 #15 Seek grants that compliment the mission of the organization; CAUTION…grants can cause mission
creep if you only follow the money! #16 Spring and Fall meetings that collect $20 registration fee per farm…purpose is to break even, fees
pay for meeting rooms, speakers, refreshments, etc. #17 Determined need, set policy and solicit participation #18 Promotion – mailings – newsletters – word of mouth #19 Actively seek (via assigned staff) state and federal grant opportunities #20 N/R #21 Tickets are sold for bouquet and golf tournament as well as co-sponsor for events – held one weekend
a year in April at Disney World #22 Promotion and advertising #23 1) Ascertain need (market evaluation), 2) Propose service, and 3) implement #24 N/R #25 N/R #26 Determine who potential members would be, have industry leaders issue a call to action and establish
a fair and equitable funding strategy #27 Financial part is most difficult to implement – by comparison the LA Oyster Taskforce, created by
LA state legislation in 1988, taxes $.5 per tag – these revenues are used mostly for marketing in which a task force directs
37
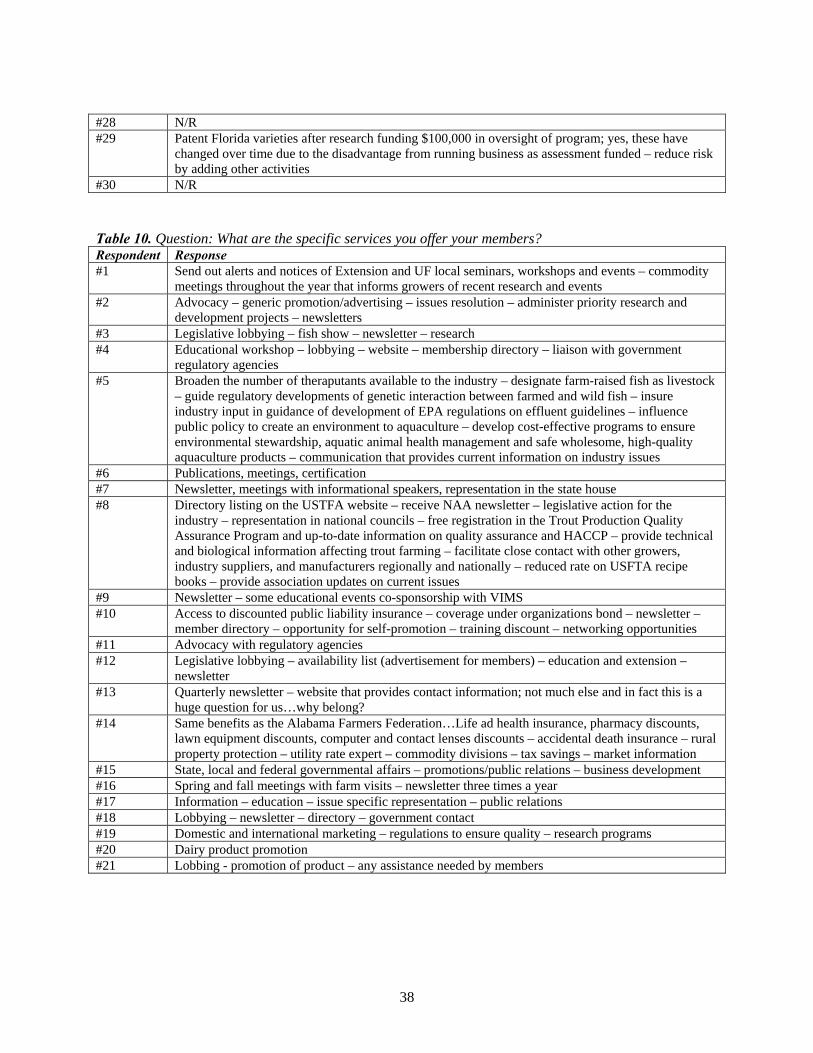
#28 N/R #29 Patent Florida varieties after research funding $100,000 in oversight of program; yes, these have
changed over time due to the disadvantage from running business as assessment funded – reduce risk by adding other activities
#30 N/R Table 10. Question: What are the specific services you offer your members? Respondent Response #1 Send out alerts and notices of Extension and UF local seminars, workshops and events – commodity
meetings throughout the year that informs growers of recent research and events #2 Advocacy – generic promotion/advertising – issues resolution – administer priority research and
development projects – newsletters #3 Legislative lobbying – fish show – newsletter – research #4 Educational workshop – lobbying – website – membership directory – liaison with government
regulatory agencies #5
Broaden the number of theraputants available to the industry – designate farm-raised fish as livestock – guide regulatory developments of genetic interaction between farmed and wild fish – insure industry input in guidance of development of EPA regulations on effluent guidelines – influence public policy to create an environment to aquaculture – develop cost-effective programs to ensure environmental stewardship, aquatic animal health management and safe wholesome, high-quality aquaculture products – communication that provides current information on industry issues
#6 Publications, meetings, certification #7 Newsletter, meetings with informational speakers, representation in the state house #8 Directory listing on the USTFA website – receive NAA newsletter – legislative action for the
industry – representation in national councils – free registration in the Trout Production Quality Assurance Program and up-to-date information on quality assurance and HACCP – provide technical and biological information affecting trout farming – facilitate close contact with other growers, industry suppliers, and manufacturers regionally and nationally – reduced rate on USFTA recipe books – provide association updates on current issues
#9 Newsletter – some educational events co-sponsorship with VIMS #10 Access to discounted public liability insurance – coverage under organizations bond – newsletter –
member directory – opportunity for self-promotion – training discount – networking opportunities #11 Advocacy with regulatory agencies #12 Legislative lobbying – availability list (advertisement for members) – education and extension –
newsletter #13 Quarterly newsletter – website that provides contact information; not much else and in fact this is a
huge question for us…why belong? #14 Same benefits as the Alabama Farmers Federation…Life ad health insurance, pharmacy discounts,
lawn equipment discounts, computer and contact lenses discounts – accidental death insurance – rural property protection – utility rate expert – commodity divisions – tax savings – market information
#15 State, local and federal governmental affairs – promotions/public relations – business development #16 Spring and fall meetings with farm visits – newsletter three times a year #17 Information – education – issue specific representation – public relations #18 Lobbying – newsletter – directory – government contact #19 Domestic and international marketing – regulations to ensure quality – research programs #20 Dairy product promotion #21 Lobbing - promotion of product – any assistance needed by members
38
#22 Trade shows – communications (newsletters and alerts) – certifications – educational programs –
marketing projects – government advocacy #23 Government relations – environmental issues management – labor relations – marketing services –
cooperative management – media relations – educational programs – publications #24 Lobbying – representation in regulatory issues #25 N/R #26 Newsletter – fax and email updates – meeting generation – Executive Director services both
collectively and on personal issues #27 Members visit Washington DC at least once a year to visit congressman and various agencies (EDA,
FDA, NMFS, Sea Grant) #28 N/R #29 Top Priority: regulatory issues involvement, offer workman’s compensation, serve as industry’s
mediator, research, scholarship program, and multiple membership services #30 Marketing and PR efforts, food safety issues, environmental regulation issues, water quality issues,
education and conference, newsletters, and bulk buying power Table 11. Question: What techniques have worked best at soliciting membership for your organization? Respondent Response #1 Word of mouth has been the best – at almost all extension seminars and workshops our organization
is promoted #2 Successful resolution of issues at both community, provincial, national and international with good
media coverage #3 Members may buy fish farm supplies at our Association’s store at discount member prices #4 Offering a discount memberships when registering for an educational conference #5 Media news releases #6 Publicity – marketing – emails #7 Newsletter #8 Board of Directors solicitation – newsletter – website #9 Word of mouth – mass mailings #10 Mail-outs – personal contact #11 Newsletter – annual meetings – sharing of information #12 Direct mail (through TAMU extension) – annual conference #13 Good question and tough to answer…some members join so they are not isolated from the rest of the
industry – some do not join to be isolated from the rest of the industry #14 Publications – radio – TV – billboards – meetings – brochures #15 Produce results! Saved growers money in property taxes – clarifies wetland exemptions – sought
disaster assistance – hold annual growers meetings and workshops – newsletter – produce grower advisories
#16 UF supplied letters from people interested in the industry – newspaper articles at Christmas time – contacts from website and NCTA website
#17 Members talking to prospects works best after staff had attempted contacts and solicitation #18 Word of mouth #19 N/R #20 N/R #21 Percentage of members has always been high because the reputation and accomplishments of the
organization #22 Peer-to-peer – communication tools #23 One-to-one contact (member to potential member and staff to potential member) – advertising #24 N/R #25 N/R #26 The belief that collectively a grower member can affect local or regional governmental decisions –
associate members want to support the industry of the center of their communities
39

#27 Obtain federal monies for research (GOIC administers the Gulf Oyster Industry/Sea Grant Initiative) in the amount of $2million every 2 years
#28 N/R #29 N/R Table 12. Questions: Please list the key issues that had to be addressed to ensure the successful start up of your organization. Have there ever been previous attempts to organize your commodity group? Respondent Response #1 Not around for start-up #2 1) getting the 3 sectors to recognize the strength of combining their voices, 2) getting government to
recognize the alliance as the united voice for the industry; Our groups is made-up of 3 sector associations who each do not have paid staff and agreed to combine resources
#3 No previous attempts to organize #4 Get enough firms to support and volunteer to serve as members; no previous attempts to organize #5 Board of directors representation and voting rights; no previous attempts to organize #6 No previous attempts to organize #7 Incorporate, by-laws, newsletter, good speakers at meetings; there were previous attempts to organize #8 No previous attempts to organize #9 1) critical mass of volunteers willing to do the work, 2) commitment from the Sea Grant marine
advisory service fisheries specialist to become involved; this was the first attempt to organize and it lasted 12 years
#10 No previous attempt to organize #11 Create a mission statement, goals, by laws, and board structure; no previous attempts to organize #12 Not sure #13 Initially the INAD for sex reversal was such an issue that everyone pulled together, once the INAD
was in place members began to fade…it takes a crisis for Tilapia producers to get together; there were previous attempts to organize
#14 Financial stability, adequate representation of membership, producers wanting to organize and asking for help…an interest; no previous attempts to organize
#15 1) needs to be grass roots and inclusive…avoid the “good old boys club” 2) establish committees to work on specific issues, need to get grower buy in by having them help
direct the future of their industry; there were previous attempts to organize in 1867 #16 Money for mail-outs, officers to keep records and plan meetings, mail outs to newspapers to produce
articles and internet presence; no previous attempts to organize #17 There was competition between counties as to who was leadership, joint leadership had to be
established with the goal of everyone working together for better good; no previous attempts to organize
#18 Participation, commitment, finances, and leadership; no previous attempts to organize #19 Membership must represent the majority of the industry, and provide value added programs; no
previous attempts to organize #20 Predates respondents involvement; no previous attempts to organize #21 The fact that people in industry realized that they could not do it alone and that there is strength in
numbers; no previous attempts to organize #22 Multiple commodities, geographic spread, and representation of chapters and commodities; no
previous attempts to organize #23 Common motivating factor (in this case WWII issues), funding mechanism, and consensus on an
approach; no previous attempts to organize #24 Mandatory membership, recognition of needs discovered in the services members needed (lobbying);
no previous attempts to organize
40
#25. N/R #26 Demonstrate the need, good initial participation by key local industry leaders, good professional staff;
no previous attempts to organize #27 Need a crisis to get people involved, need a select groups of motivated people (only 7 to 8 that
actually do the work), more power being multi-state; there were previous attempts to organize (in the late 1980s LA formed an industry council but the Gulf wide crisis resulted in needing more coalition power)
#28 N/R #29 Learning curve high and question priorities – 2 other attempts to organize the failed #30 No previous attempts to organize Table 13. Question: How do you measure the success of your organization? Respondent Response #1 Since we do not collect money from sales of fruit, we look at our membership level, we observe how
successful attempts are at moving fruit out of the area (if a fruit is not moving or having trouble we try to see the reason and brainstorm ways to move the fruit)
#2 Effectiveness in resolving industry issues, level of financial support from industry (i.e. 80% compliance on a voluntary level), status of industry
#3 Our ability to promote and protect the Florida tropical fish industry #4 How successful we are in promoting and protecting the interest of our industry/members #5 Industry status and partnerships with regulatory agencies #6 Membership retention/loyalty, financial solvency, increasing industry representation #7 Achievements in regulatory change, high visibility, and more growers #8 Industry status and consistency of membership #9 Membership level #10 Membership renewals, successful project completions #11 Participation levels, grower perceptions #12 Still alive, still here, still successful…no longer here = failed #13 Good question…I do not know how; personally think the ATA is a has been organization…I cannot
get assistance with articles for the newsletters, when I ask for cooperation with marketing issues, no one comes forward
#14 Accomplishing goals, financial stability, membership involvement, leadership development #15 Measure by political success, status of industry and its influence and percentage of membership; this
is a voluntary assessment on a growers crop to pull 80% is a measure of success #16 Attracting new members to carry on the work of the association #17 Finances translate to membership but true success is how much help you have been to your members #18 Ability to meet membership needs #19 Grower rewards, industry balanced scorecards #20 Indicators: consumption, image issues, media impressions (favorable vs. negative), market
penetration of school programs, etc. #21 By the service rendered to each member as well as the success of promotional activities #22 Percentage of membership of bona fide businesses, status of association…prestige and respect #23 Membership retention, occasional surveys #24 Legislative bills passed or defeated, assisting members with regulatory or research needs #25 #26 If we can prevent an increase of governmental regulatory burden upon our members #27 Funding for research, education, and marketing and recognition in Washington with legislators and
agencies #28 N/R #29 Percentage of membership, increase in services and sales and production (from $38 million in 1985 to
$175 million today), and success in influencing policy
41
Table 14. Question: From your experience, what one thing would you tell a group of farmers establishing an organization to unify their industry? Respondent Response #1 DO YOUR HOMEWORK FIRST! Find growers who are interested in seeing the industry succeed,
not just themselves prosper. We have been fortunate to have a group of growers that work for the benefit of other commodities. Their success helps other Florida tropicals succeed as well.
#2 As an individual they are one voice in a million that you will have to deal with (and can therefore choose to ignore); as an association they gain professionalism and strength for unity on issues
#3 Join together or go out of business #4 Join together or go out of business #5 Being proactive to accomplish their mission #6 Keep focused on a mission #7 Strength in numbers. One person cannot do it alone. The value of an organization cannot be
overstated. More than the sum of the parts and yet only as good as the time and effort of the members #8 It is important to be proactive #9 Be prepared to do most of the work, at least initially. Do not be discouraged, pick an easy issue to
focus on, to show an early success. Publicize your success to other growers. Utilize Sea Grant/Dept. of Agriculture and Consumer Services to the max
#10 Ensure you are willing to make decisions based on the good of the industry as a whole versus personal gain or interest
#11 List the issues that are a concern for all. Agree to disagree on other issues. The list for common issues is sure to be longer, having one voice, or entity, to recognize as the contact for the industry is critical
#12 Try to achieve having one voice #13 You must have a common, mutual goal to accomplish. Back stabbing, deals under the table, cutting
prices for market share never helps the industry, or in the long run, the individual #14 Develop and elect qualified leaders with a vision, do not form because of one issue, assure financial
success #15 Identify the common issues that will unite all farmers regardless of geographic location or marketing
affiliation. Stay focused and know what issues are for the good of the entire population and which ones may be someone’s political agenda.
#16 Take an active part, contribute to the costs, and share information #17 Participation by everyone makes effort easier on load more manageable; however, you tend to have a
few “worker bees” that carry the load #18 Enthusiastic commitment and active participation necessary #19 Limit scope of organization with realistic goals, establish an evaluation process #20 A unified voice for crisis communications and issues management can be invaluable #21 The ability to get attention of policy makers (legislature, congress, count commissioner) #22 Do not run the organization with just volunteers – hire a professional staff person at the outset.
Members are too busy to run a volunteer organization and the organization will flounder unless there is paid professional staff
#23 Create an effective governance structure #24 Make it mandatory #25 N/R #26 Get as much collective cost sharing as possible, employ professional staff, have an ACTIVE Board of
Directors, and maintain a high positive profile within the community #27 Have to have a “message” and be clear about what you want #28 N/R #29 Set priorities, identify programs (develop those that are identifiable), build community involvement,
invest in research/education/promotion, leadership development, set 30% of association profit to marketing and research goals, and create a strong volunteer base
#30 Strong board (committed with strong leadership), effective communication (newsletters, web site, action alerts, phone trees), professional staff (professional image), strong volunteer cone, big start up donations (several years of dues up front), and good membership services
42

Appendix C Phone Interviews Respondent A
• One and a half cent per case of eggs and a quarter of a cent per pound of chicken meat is the membership dues structure. This is based on monthly production rates and paid on a monthly basis. Send out a fill-in-the-blank form with fixed rates every month.
• Completely voluntary…would not dare to question an amount that the member contributed…not worth the possibility of them dropping membership.
• Never had a problem financially supporting the organization with member dues. • First, determine how many clams the industry produces for the market and how much money is needed to
fund what the clam growers want to do with the organization…simple math. • Organizations do not need a lot of money to be effective, especially in formative stages. For lobbying/voice
presence, shop for a lobbyist (reasonable to need $50,000 to $75,000 a session for lobbying). • Decide exactly what you need an organization for and then focus on that one thing!
Respondent B
• Membership dues structure of $100 minimum and $2000 maximum, which is an annual fee based on a $2.00/per acre of production fee.
• Voluntary structure where the small guy benefits as much as the large guy but the large guy may have to pay more because of a larger production area.
• Have 160 members, of which the membership dues fund ½ of the organizations budget the other half is fundraising…golf tournament, monthly newsletter with advertisements, and annual meeting.
• The formation of their organization was based on a need to have a presence in county and state meetings and a voice in the industry. Focus on hiring a person to represent the organization.
• Newsletter was a big addition to the organization. Keeps everyone updated and allows for sponsorships and added services.
• To form…gather main leaders in industry to brainstorm the need and objective and then get them to sell it to their constituents…sell the fact that the organization will do things that the member does not have time for!
• Do not go cheap…if you are going to do it, do it right. • For statewide organization, contact Florida Citrus Mutual and the Florida Farm Bureau. Maybe even align
yourself or pay for services that the Farm Bureau can provide. Respondent C
• The assessment is voluntary and on the honor system. If they know of a grower who is not paying their full dues they send the check back and ask them to pay based on their actual crop. For example, if a grower has 50 acres of bog and they are paying the minimum of $150 the organization knows that their dues should be closer to $1,400 based on the acreage and state average yield.
• Success accomplishes member participation! The organization has developed a proven track record of representing the growers on the issues that impact their ability to farm and remain profitable. For example, this past year there was a movement to license and fee all "dam structures". The definition was so broad that it would have unnecessarily included all cranberry bog dikes and water control structures. They successfully lobbied to have agricultural "dams" exempted and defined. This action saved growers thousands of dollars far exceeding their members cost to join our organization. Then you have to tell them this and tell them that the dues paying members are paying for the benefit of their non-paying neighbors.
• Do not publish the names of non-paying members but only those who pay their dues. • Start at the grass routes level. You need farmer buy in and you need a rallying point. Pick an issue that
impacts all farmers regardless of their geographic location or marketing affiliation. Get farmers to focus on solving the issue and achieve success in solving it.
• Is not sure how the structure was chosen. So emailed a copy of by-laws which will cover the organizations structure and how the board is elected, etc.
• Feel free to call with further questions. I believe strongly in farmers being organized.
43
Respondent D • Chose 501c3 over a 501c6 because understanding is that the latter allows you to lobby legally whereas the
former does not. • Use of volunteers - often the work takes a back seat to real job and important tasks get blown off, delayed
or done shabbily, depending on the season. • OSAA’s assessment is that every good association either has paid staff or a really committed individual
volunteer with enthusiasm and a knack for getting others to help out. Lately their organization has gotten much better, now have 3 folks they can depend on and some state marketing money to help farm out certain tasks to members or subcontractors for a fee.
• Northeastern Regional Aquaculture Center and Sea Grant gives associations money for speaker support. • Successful in garnering support because organization taught most of them how to grow. They have good
meetings with great speakers talking about stuff that is interesting to growers. • It is difficult at times but just do it - do the best you can. Try and deliver what the growers want - they want
marketing assistance and new techniques to facilitate their business. • In 20 to 40 man hours you can form the corporation - send out a mailing - hold a meeting with a good
speaker and go from there. Could be tougher since FL is so much bigger than RI, but E-mail is a wonderful tool.
Respondent E • The fee is annual and is according to the grower. There is a minimum fee of $50, so growers with smaller
acreage pay for their expenses--newsletter, record keeping etc. • The largest constraint to our association is financial in nature. Organization includes small family farms
who are involved daily with their businesses or have outside employment to make ends meet. In this nature, they don't keep up with some things they should or just see membership as a cost they can skip. Many will tell you, why should I pay when you will do what you are doing (because other will pay) and look out for our industry, even without my money? It is a constant battle, which takes away from your ability to focus on more important issues.
• The second constraint would be the lack of volunteer time. Since members are working on their farms or in other jobs, they have little time to attend educational meetings, to learn things they need to improve their situation, or to put in the time necessary for political issues, etc.
• For an organization to be successful, the clam growers would have to be totally supportive. A very high percentage of growers would have to be willing to be members and committed for the long haul. It took probably seven or eight years to get PRVCGA to a level of operation where we are recognized as making a difference. In the early years, there is much organizational work and time spent trying ideas, scraping those that don't work and building on those that do work. This is necessary time for a strong foundation, but many members will not wait it out and support the organization through this foundation period. Then it is much harder to get them on board.
• Once the industry sees you are successful, they will utilize your strength but not necessarily come back into active membership. It is an interesting and complex scenario.
Respondent F
• The Alliance began discussions at the Board and AGM level to gain the mandate to develop and put in place a voluntary levy. After significant discussion a levy rate was agreed to for 2001, 2002, 2003, and 2004. Independent mussel growers and processors (some are vertically integrated units) were contacted by the Alliance about the possibility of participating in the voluntary levy. It was agreed that all monies collected should be sent to a third party (in this case a local accountant) where the funds would be put in trust and a monthly check and list of members paying the levy and plants collecting the levy would be submitted to the Alliance. This process ensures the growers that the plants do not know how much product they are selling to other plants and that others in the industry do not know their landings. It also ensures that the confidentiality of a plant's customer list is secured. To date we have approximately 80 percent of landings accounted for in our levy.
• The benefits of memberships depend on what level of membership (i.e. developed industry member, developing industry member, processor, associate, supplier or supporter). They all get a industry dinner annually, as well as a united voice and dedicated staff to work on their behalf. Some get advertising in the newsletter, again ad size and inserts dependent on membership level. Others also get passes to the PEI
44
International Shellfish Festival and an annual meeting with the various alliances boards and government representatives dedicated to the crucial issues and R&D requirements of the day.
• Our association is a not-for-profit company that allows us to charge a fee for our services but to spend that revenue on the agreed to mandate and objectives. Our Directors represent the PEI Cultured Mussel Growers Association (4), the Island Oyster Growers Group (2), the PEI Finfish Association (2) and when it was active the Island Clam Growers Association (1). See our website for detail - www.aquaculturepei.com.
• The key to a successful Alliance is bringing together the major players in the industry (growers, processors, equipment manufacturers, etc.) and getting a consensus, or recognition if you will, of the value of working together with one united voice. They may not always agree on how an issue should be handled but if they agree that working together will accomplish more that the divide and conquer mentality then they will be surprised by the outcome.
• Our association was somewhat slow off the mark (1998 to 2001) at getting strong support. However, with a couple of issues addressed to industry's satisfaction due to the fact that the Alliance was able to help them hold strong on a united position membership drives have not been a big priority.
• The key is not to give up but to get a couple of enthusiastic individuals, committed to this type of approach, who can move things forward. Once the association is in place and effective it should take on a life of its own. Growers will talk to other growers about the benefits they attained by offering support (and caution others about where the industry might be if the association hadn't been able to win a particular battle for them). This kind of support can't be bought but must be earned through continuous, tireless efforts.
45
Appendix D Additional Information Nonprofit Organization A nonprofit organization is an organization in which the distribution of profits to owners and members is prohibited. Nonprofit organizations offer services to their members that government or private businesses cannot provide. They can be as simple as a local group that comes together to perform a certain task, or as complex as to incorporate to exist as a separate legal entity and recruit members from all over the state and country. Nonprofits are not commercially motivated and only exist to provide a particular service or services to both its members and the community. A nonprofit organization is the most common legal structure used by communities to help attract tax-deductible contributions and private grant money to perform:
• Research, • Document critical issues, • Give a voice to those unspoken for, and • Unite communities along common interests.
Most nonprofit organizations are defined by the type of tax-exempt status acquired. The
Internal Revenue Code, which contains all federal tax laws, grants tax-exempt status to nonprofit organizations in more than 20 categories under section 501c. Categories used by agriculture for common types of tax exemption are listed below. Depending on their category of tax-exemption, a nonprofit organization may be permitted to, or prohibited from, engaging in various activities. One of these activities is lobbying, which is the act of providing support or opposition to legislation.
• 501c(3) organizations include the public benefit category. Exemption status is given
to these organizations that serve charitable, religious, scientific or educational purposes. 501c(3) organizations may engage in lobbying up to $1 million dollars.
• 501c(5) organizations include labor, agricultural, and horticultural organizations.
Internal Revenue Services (IRS) regulations state that organizations are eligible for this category if their purposes are for the betterment of conditions of those engaged in labor, agriculture, or horticulture; the improvement of the grade of their products; and, the development of a higher degree of efficiency in their occupations. 501c(5) organizations may engage in unlimited lobbying, but may be required to either provide notice to its members regarding the percentage of dues paid that are applicable to lobbying activities or pay a proxy tax.
• 501c(6) organizations include business leagues, chambers of commerce, real estate
boards, and boards of trade. IRS regulations state that a business league is an association of persons having some common business interest, the purpose of which is to promote such common interests. Activities should be directed to the improvement of business conditions in one or more lines of business. 501c(6)
46
organizations may engage in unlimited lobbying as long as it furthers the purpose of the organization under its tax-exempt status.
There are two paths in starting a nonprofit organization. One path is to make use of
another nonprofit organization’s tax-exempt status by making it an “umbrella organization” or a fiscal agent or sponsor. This allows the new organization to apply for and administer grants or other funds under the existing organization’s tax-free status. To consider this avenue, contact an existing nonprofit organization. The second path is to start a new nonprofit organization by following these steps outlined by the U.S. Department of Agriculture.
1. Bring together a group of interested citizens to establish a nonprofit community organization. At the meeting name the organization, its goals, and objectives.
2. Contact the Florida Secretary of State’s office and request the materials required to establish a nonprofit corporation. The materials will include an articles of incorporation form and instructions; the state’s nonprofit statues, which should be reviewed carefully prior to preparing the articles of incorporation and corporate bylaws; a list of fees for filing; and, instructions for post-incorporation activities. The Secretary of State’s office will also be able to determine whether your organization’s proposed name is available to incorporate under and is not the name of another incorporated organization.
3. Acquire IRS Publication 557, “Tax Exempt Status for Your Organization,” from the Internal Revenue Service by phone (800) 829-3676 or web site www.irs.gov.
4. Complete and file the articles of incorporation with the Secretary of State. The articles of incorporation are difficult to amend, so consider writing the articles of incorporation in general terms. Use more specific language in the bylaws. Each state has its own laws and format, but it is important that certain “IRS organizational test language” be inserted into the articles of incorporation. This language deals with the permitted charitable purposes, earnings, and provisions regarding dissolution of the corporation. You may want to consider hiring an attorney to help guide you through the process of filling for your tax-exempt status. Many lawyers will provide this service to you at no cost as part of their professional public service commitment, or you can contact Legal Aid, or state or local bar associations for information on availability of free legal service in your community.
5. Write bylaws to address issues such as membership, board-of-directors policies, fiscal management, and other operating procedures. Bylaws are fairly easy to amend and therefore can contain details regarding operations.
6. Once you have incorporated, the next step is to file for tax-exempt status with the IRS. This is done by filing Form 1023, in which the IRS is informed about the organization and why it should be exempt from taxation. The IRS conducts a thorough, in-depth review of Form 1023, which necessitates that it be prepared professionally.
7. The IRS will also review your group’s proposed legislative activities. The IRS looks at the amount of money, resources, staff time, or effort expanded on lobbying relative to other activities of the organization. In general, if a substantial part of the activities of your organization consists of promoting a political agenda or otherwise attempting to influence legislation, your organization’s application for exemption could be denied.
47
8. Once you receive tax-exempt status, there are other IRS returns and reports that must be filed. The most common return is Form 990, if your gross receipts in each tax year are more than $25,000.
Contacts Florida Department of State Division of Corporations P.O. Box 6327 Tallahassee, FL 32314 Phone: (850) 245-6052 www.dos.state.fl.us Florida Department of Revenue Central Registration Phone: (850) 487-4130 www.sun6.dms.state.fl.us/dor/ Websites http://members.aol.com/irsform1023/misc/togo.html www.nonprofits.org www.irs.gov www.mapnp.org References United States Department of Agriculture. April 1999. Applying for 501© (3) Tax-free Status (TN-16). Office of Community Development. American Library Association Tax Status. no date. Basic Rules, Appendix A. Document Number 587431.
48
Business Cooperative
A cooperative is a business owned and controlled by the people who use its services. Several small businesses or farmers can join together to finance and operate a cooperative for their mutual benefit. In many respects cooperatives resemble other businesses. They have similar physical facilities, perform similar functions, and must follow the same sound business practices. Instead of competing with one another, cooperatives can help farmers pool their financial and human resources to accomplish a common financial goal. By organizing under a cooperative, individual farmers can achieve objectives that would not be attainable if acting alone. The objectives of a cooperative include:
• Improving bargaining power - combining the volume of several producers leverages their position when dealing with other business,
• Reducing costs - purchasing by volume reduces the purchase price of needed supplies,.
• Obtaining market access or broadening market opportunities - attracting more buyers through large quantities of an assured type and quality of product,
• Spreading the risks and costs - combining the resources of several producers, and • Obtaining products or services otherwise unavailable - providing services and
products that would not attract small business.
Starting a cooperative is an arduous task. A successful cooperative requires participant agreement on many issues including goals, management, operations, sales functions, and the roles of all parties involved. Cooperatives like other businesses take a considerable amount of planning, with specialized help needed throughout the various stages. A general sequence of events is as follows:
1. Invite leading potential member-users to meet and discuss issues. Identify the economic need a cooperative might fill.
2. Conduct an exploratory meeting with potential member-users. If the group votes to continue, select a steering committee.
3. Survey prospective members to determine the potential use of a cooperative. 4. Discuss survey results at a second general meeting of all potential members and vote
on whether to proceed. 5. Conduct a needs or use cost analysis. 6. Discuss results of the cost analysis at a third general meeting. Vote by secret ballot on
whether to proceed. 7. Conduct a feasibility analysis and develop a business plan. 8. Present results of the feasibility analysis at the fourth general meeting. If participants
agree to proceed, decide whether to keep or change the steering committee members. 9. Prepare legal papers and incorporate. 10. Call a meeting of charter members and all potential members to review and adopt the
proposed bylaws and elect a board of directors. 11. Convene the first meeting of the board and elect officers. Assign responsibilities to
implement the business plan. 12. Conduct a membership drive. 13. Acquire capital and develop a loan application package. 14. Hire the manager.
49
15. Acquire facilities. 16. Begin operations. The Cooperative Service Program of the U.S. Department of Agriculture’s Rural
Business-Cooperative Service (RBS) provides a wide range of assistance for people interested in forming new cooperatives. Their help can range from an initial feasibility study to the creation and implementation of a business plan. The Cooperative Service (CS) staff includes cooperative development specialists, who do everything from identifying potential cooperative functions, to the development of bylaws and business plans, to the training of cooperative directors. Contacts The Cooperative Specialist contact in Florida is: Elizabeth Whitaker USDA Rural Development 4440 N.W. 25th Place P.O. Box 147010 Gainesville, FL 32614-7010 Phone: (352) 338-3442 Fax: (352) 338-3405 E-mail: [email protected] Websites www.rurdev.usda.gov/rbs/coops/cswhat.htm References Florida Department of Agriculture and Consumer Services. 2002. Changing times, growing challenges. DACS Bureau of Seafood and Aquaculture Marketing, Tallahassee, FL. 50 pp. United States Department of Agriculture. December 1995 (revised). Cooperative Information Report 28. USDA Rural Development Cooperative Services. United States Department of Agriculture. September 1996 (revised). Cooperative Information Report 7. USDA Rural Development Cooperative Services.
50
Marketing Order A marketing order is a coordinated endeavor between a government body, either state or federal, and a commodity industry. It is a privilege granted by the legislature to an agricultural industry to provide a mechanism whereby funds are assessed and collected from producers, and expanded for specific functions relating to the respective commodity group. Marketing orders are binding on all individuals and businesses who are classified as growers or shippers/handlers in the geographical area covered by an order. In contrast, a marketing agreement, which is setup in a similar manner as a marketing order, is only binding to those growers and shippers who voluntarily participate in the agreement.
Marketing orders may be established federally or through the state. The U.S. Department
of Agriculture’s Agriculture Marketing Service (AMS) is the agency in charge of federal marketing orders as authorized by the U.S. Congress Act of 1937. Federal marketing orders provide the same services as state marketing orders only they can be applied to the entire nation. State marketing orders are restricted to state boundaries, and are established through the Commissioner of Agriculture in the Department of Agriculture and Consumer Services (DACS), as authorized by the Florida state legislature in 1987.
In federal marketing orders, legislation affords powers and duties to the Secretary of
Agriculture. In state marketing orders, legislation affords powers and duties to the Commissioner of Agriculture. Both provide for the creation and operation of an advisory council that is nominated by the industry and appointed by the Secretary or Commissioner. The advisory council recommends administrative rules and regulations pertaining to the order, receives and reports complaints or violations of the order, recommends amendments that require additional hearings and referendums, assists the Secretary or Commissioner in the assessment and collection of funds to cover expenses incurred in the administration of the marketing order, and establishes committees and subcommittees to carry out assigned duties and functions. For example, a seafood marketing order can authorize the following:
• Regulation of quality, • Regulation of quantity to market, • Standardize containers and packs, • Provide provisions for production, market research, development, and promotion, • Prohibition of unfair trade practices, • Regulation of price posting, • Establish minimum prices and provide information, and • Determination of existence and extent of surpluses and their control and distribution.
The process of establishing a federal or state marketing order is similar. The major
difference is that federal marketing orders are approved through AMS and the Secretary of Agriculture; whereas, state marketing orders are approved through the DACS and the Commissioner of Agriculture. Starting a marketing order for a specific commodity may take over a year to develop. The time commitment depends on the size of the industry, the complexity of the proposal, and the availability of resources within the industry that can be devoted to the project.
51
Steps in installing a marketing order, as outlined by AMS, are summarized below: 1. The industry meets to identify mutual marketing problems and determine whether a
marketing order could help the industry solve these problems. During these discussions, USDA staff may help the industry identify marketing order authorities relevant to the industry’s problems.
2. If there is support for the program, a preliminary proposal is prepared by a steering committee of key industry people. Growers and shippers are included in discussions of the proposal.
3. A list of industry growers and handlers is developed by proponents. Next a request for a hearing on the proposal is sent to the Administrator of AMS. It should indicate the degree of industry support, the problems the program would address, and suggest a possible hearing site and approximate date.
4. AMS reviews the request and supporting documents, as well as any alternative proposal from interested parties.
5. A Notice of Public Hearing is then issued, and it is published at least 15 days before the hearing. USDA staff can comment only on procedural questions after this point.
6. A USDA Administrative Law Judge presides at the public hearing and a verbatim record is compiled of the testimony of opponents, proponents and others, including USDA personnel.
7. A recommended decision is issued by USDA based on hearing evidence. This is the USDA’s formal recommendation on the proposal. Persons are allowed to file exceptions to it for a set time period.
8. After consideration of all exceptions to the recommended decision, USDA prepares a final decision. If it is favorable, a grower referendum is held on the proposal.
9. If the proposed program is a marketing agreement, copies of a companion marketing agreement are sent to handlers for their signature. Through their signatures on the agreement, handlers indicate their intention to abide by the terms of the program.
10. If at least two-thirds of the growers voting by number or by volume approve the proposal, the Secretary of Agriculture issues the marketing order or agreement. When a marketing order is implemented all growers and shippers within the geographical area covered by the order are responsible for complying with its rules and regulations.
The USDA’s Marketing Order Administration Branch of the Agricultural Marketing
Service is responsible for the overall administration of marketing order programs for fruits, vegetables and specialty crops and can provide information through regional offices. Contacts Christian Nissen Southeast Marketing Field Office Marketing Order Administration Branch USDA Agricultural Marketing Service 799 Overlook Drive, Suite A Winter Haven, FL 33884 Phone: (863) 324-3375 Fax: (863) 325-8793
52
Email: [email protected] www.ams.usda.gov Les Harrison Division of Marketing Florida Department of Agriculture & Consumer Services 407 South Calhoun Street, Room 429 Tallahassee, FL 32399-0800 Phone: (850) 488-5831 http://doacs.state.fl.us/ Websites www.ams.usda.gov/fv/moab.html References Florida Department of Agriculture and Consumer Services. no date. Florida State Marketing Order Programs: What they do, how they operate, who finances them. DACS Division of Marketing, Tallahassee, FL. 2pp. United States Department of Agriculture. no date. What are Marketing Orders and How do they Operate? USDA Agriculture Marketing Service, Fruit and Vegetable Marketing Orders. United States Department of Agriculture. no date. Steps in Developing a Fruit and Vegetable Marketing Agreement Program. USDA Agriculture Marketing Service, Fruit and Vegetable Marketing Orders.
53
Checkoff Program
A checkoff program is an industry-funded generic marketing and research program designed to increase domestic and/or international demand for an agricultural commodity. This is accomplished through promotion, research, new product development, and a variety of marketing tools. Each checkoff program is supported entirely by producers and handlers/shippers. There are no taxpayer or governmental funds involved. Checkoff programs provide a method by which producers and shippers “check off” a contribution to its generic marketing and research program. Contribution rates vary throughout the different programs, but they are always based on a percentage of net sales or assessed at a set rate per production unit.
A checkoff program is directed by its funders and managed by a professional staff. Funders are responsible for allocating funds and approving business plans and programs. As in any business, professionals, staffs, and contractors are accountable to their boards to meet performance-based goals. The process of establishing a national promotion and research program involves the following steps.
1. Farmers must provide the U. S. Department of Agriculture (USDA), Agriculture Marketing Service (AMS) with a profile of the industry, including the volume, value and geographic distribution of the production area. Imports must also be analyzed, along with the number of large and small businesses that might be affected by a national promotion order.
2. The industry must determine what marketing problems exist and how a national promotion program would address these problems. Farmers must also determine how much income the program is expected to generate at the optimum assessment rate, how much it would cost to administer a program and whether the remaining funds are enough to conduct an effective promotion program.
3. The industry must identify what it expects to achieve through the program and write a proposal.
4. The proposal must contain information on how the program would affect small farmers, including compliance and paperwork requirements.
5. Without broad industry support, USDA will not consider a proposed order. 6. A proposal must contain the above five items as well as who pays the assessment rate
and whether small businesses are exempt. The proposal also must define the percentage of funds to be used for promotion and for research.
7. After the industry has completed the above steps, the proposal can then be submitted to USDA for approval.
8. After a proposal is submitted, USDA will review and publish it in the Federal Register. If broad industry support and consensus is lacking or unclear, USDA will hold public hearings. After reviewing the comments, USDA determines if the program meets the guidelines of the law. If so, a final program will be issued.
Contacts
• American Egg Board www.aeb.org -- (847) 296-7043
54
• Cattlemen’s Beef Board www.beefboard.org -- (303) 220-9890
• National Honey Board www.nhb.org -- (800) 553-7162
• National Dairy Research and Promotion Board www.dairyinfo.com -- (847) 803-2000
• National Pork Board www.porkboard.org -- (515) 223-2620
• National Watermelon Promotion Board www.watermelon.org -- (407) 895-5100
• United Soybean Board www.unitedsoybean.org -- (800) 989-USB1
Christian Nissen Southeast Marketing Field Office Marketing Order Administration Branch USDA Agricultural Marketing Service 799 Overlook Drive, Suite A Winter Haven, FL 33884 Phone: (863) 324-3375 Fax: (863) 325-8793 Email: [email protected] Margaret Irby USDA Agriculture Marketing Service 1400 SW Independence Avenue, Room 2535 Washington DC 20250 Phone: (202) 720 9915 Email: [email protected] Websites www.ams.usda.gov References National Commodity Checkoff Boards and Councils. no date. Facts about Checkoffs. www.unitedsoybean.org/checkoff.pdf Rawlins, Scott. 1997. Law Simplifies Setup of Checkoff Program. Farm Bureau News.
55