Embed Size (px)
Citation preview
MORICHES BAY
2003 HARD CLAM GROWTH RATE STUDY
FINAL SUMMARY REPORT
DECEMBER 2004
Prepared by: U.S. Army Corps of Engineers
New York District, Planning Division (CENAN-PL-E) 26 Federal Plaza New York, New York 10278-0090
Atlantic Coast of Long Island, Fire Island Inlet to Montauk Point (FIMP), Reformulation Study New York
MORICHES BAY
2003 HARD CLAM GROWTH RATE STUDY FINAL SUMMARY REPORT
FOR THE
ATLANTIC COAST OF LONG ISLAND, FIRE ISLAND INLET TO MONTAUK POINT (FIMP), REFORMULATION STUDY, NEW YORK
DECEMBER 2004
Prepared by:
U.S. Army Corps of Engineers New York District, Planning Division (CENAN-PL-E)
26 Federal Plaza New York, New York 10278-0090

FIRE ISLAND INLET TO MONTAUK POINT REFORMULATION STUDY
December 2004 - i - 2003 Hard Clam Growth Rate Study Final Summary Report
TABLE OF CONTENTS
SECTION PAGE
LIST OF TABLES..........................................................................................................................iii
LIST OF FIGURES ........................................................................................................................iv
LIST OF APPENDICES..................................................................................................................v
1.0 INTRODUCTION ...............................................................................................................1
1.1 STUDY GOALS AND OBJECTIVES .......................................................................................1
1.2 SITE DESCRIPTION ............................................................................................................1
1.3 HARD CLAM GROWTH RATES...........................................................................................3
2.0 METHODS ..........................................................................................................................6
2.1 STUDY DESIGN YEAR 2000...............................................................................................7
2.2 STUDY DESIGN YEAR 2001...............................................................................................9
2.3 STUDY DESIGN YEAR 2003.............................................................................................10
3.0 DATA ANALYSIS ...........................................................................................................11
3.1 SHELL GROWTH RATE FOR 2001 ....................................................................................11
3.1.1 Shell Growth Rate Analysis 2001................................................................................11
3.1.2 Dry Weight 2001 .........................................................................................................11
3.2 SHELL AND TISSUE GROWTH 2003..................................................................................12
3.3 PHYTOPLANKTON ...........................................................................................................12
3.3.1 Phytoplankton Identification and Enumeration Chlorophyll 2001..............................12
3.3.2 Total Chlorophyll 2003................................................................................................13
3.4 WATER QUALITY............................................................................................................13
4.0 RESULTS ..........................................................................................................................14
4.1 GROWTH RATE ...............................................................................................................14
4.1.1 Shell Growth Rate 2001...............................................................................................14
4.1.2 Dry Weight 2001 .........................................................................................................16

FIRE ISLAND INLET TO MONTAUK POINT REFORMULATION STUDY
December 2004 - ii - 2003 Hard Clam Growth Rate Study Final Summary Report
TABLE OF CONTENTS (continued)
SECTION PAGE
4.1.3 Shell Growth 2003 .......................................................................................................18
4.1.4 Tissue Growth 2003.....................................................................................................21
4.1.5 Comparison of Shell Growth 2001 and 2003 ..............................................................23
4.2 PHYTOPLANKTON ...........................................................................................................24
4.2.1 Total Chlorophyll 2001................................................................................................24
4.2.2 Differential Phytoplankton Identification and Enumeration 2001 ..............................26
4.2.3 Total Chlorophyll 2003................................................................................................29
4.3 WATER QUALITY............................................................................................................31
4.3.1 Temperature .................................................................................................................31
4.3.2 Salinity.........................................................................................................................31
5.0 DISCUSSION....................................................................................................................33
6.0 CLOSING REMARKS......................................................................................................36
7.0 LITERATURE CITED......................................................................................................37
FIRE ISLAND INLET TO MONTAUK POINT REFORMULATION STUDY
December 2004 - iii - 2003 Hard Clam Growth Rate Study Final Summary Report
LIST OF TABLES
TABLE PAGE Table 4.1. Results from the single-factor ANOVA on the shell length growth rate of clams in
2001 ..........................................................................................................................15 Table 4.2. Results from the two-factor ANOVA on the shell length growth rate of clams in
2001 ..........................................................................................................................15 Table 4.3. Results from the single-factor ANOVA on the tissue growth rate of clams in 2001 ..........................................................................................................................16 Table 4.4. Results from the two-factor ANOVA on the tissue growth rate of the clams in 2001 ..........................................................................................................................17 Table 4.5. Average shell lengths (mm) growth for top and bottom level cages for three sites at
Moriches Bay, June through October 2003 ..............................................................18 Table 4.6. Average clam dry weight (g) for three sites at Moriches Bay, June through October
2003 ..........................................................................................................................21 Table 4.7. Species diversity of diatoms and dinoflagellates at all sites during incoming tide at
Moriches Inlet from June through October 2001 .....................................................28 Table 4.8. Comparison of total number of diatom and dinoflagelllates species found in all
samples, to total numbers found in Moriches Inlet, during incoming tides from June 1 through August 30, 2001 .......................................................................................29
Table 4.9. Average chlorophyll concentrations (µg l-1) for four sites at Moriches Bay, May 30
through September 20, 2003 .....................................................................................29 Table 4.10. Average temperature (F), July - September, at grow out stations ............................31 Table 4.11. Average seasonal dissolved oxygen levels (mg/l) at grow out stations ....................32
FIRE ISLAND INLET TO MONTAUK POINT REFORMULATION STUDY
December 2004 - iv - 2003 Hard Clam Growth Rate Study Final Summary Report
LIST OF FIGURES
FIGURE PAGE Figure 1.1. Hard clam growth rate study area location.................................................................3 Figure 1.2. Research site locations................................................................................................5 Figure 2.1. Grow out cage configuration ......................................................................................9 Figure 4.1. Average shell length growth of clams from the experimental sites in Moriches Bay,
June 15 through October 4, 2001..............................................................................14 Figure 4.2. Average shell growth rate for the June through August, and August through
October, 2001 growth periods, at the three sites in Moriches Bay...........................16 Figure 4.3. Average dry weight tissue growth of clams from the experimental sites in Moriches
Bay, June 15 through October 4, 2001 .....................................................................17 Figure 4.4. Average clam tissue growth rate for the June-August and August-October 2001,
growth periods at the three sites in Moriches Bay....................................................18 Figure 4.5. Average shell length growth of clams from the experimental sites in Moriches Bay,
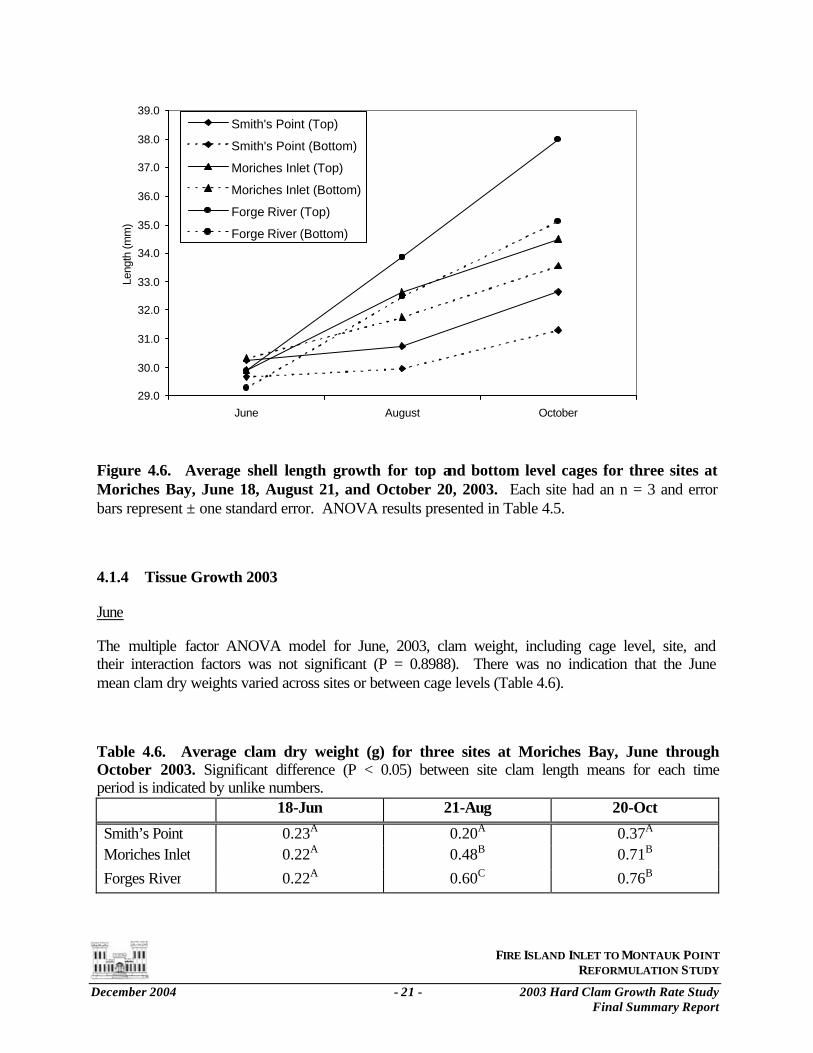
June 18 through October 20, 2003............................................................................20 Figure 4.6. Average shell length growth for top and bottom level cages for three sites at
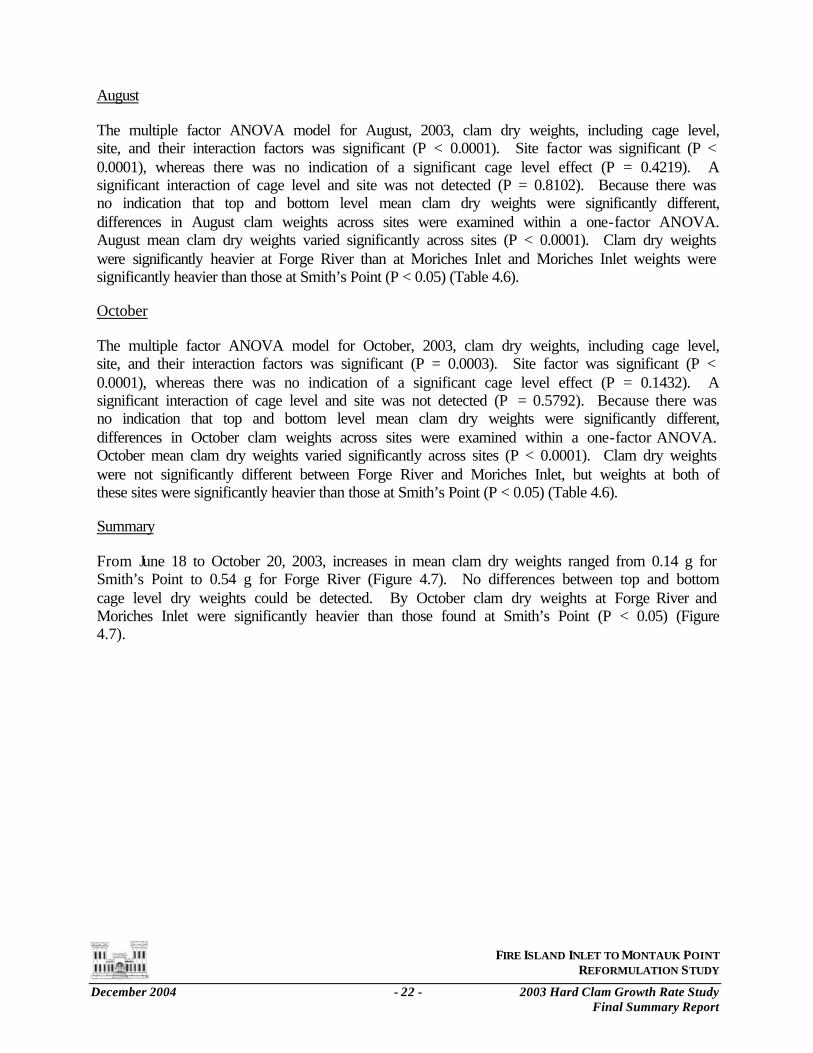
Moriches Bay, June 18, August 21, and October 20, 2003 ......................................21 Figure 4.7. Average clam dry weight for three sites at Moriches Bay, June 18, August 21, and
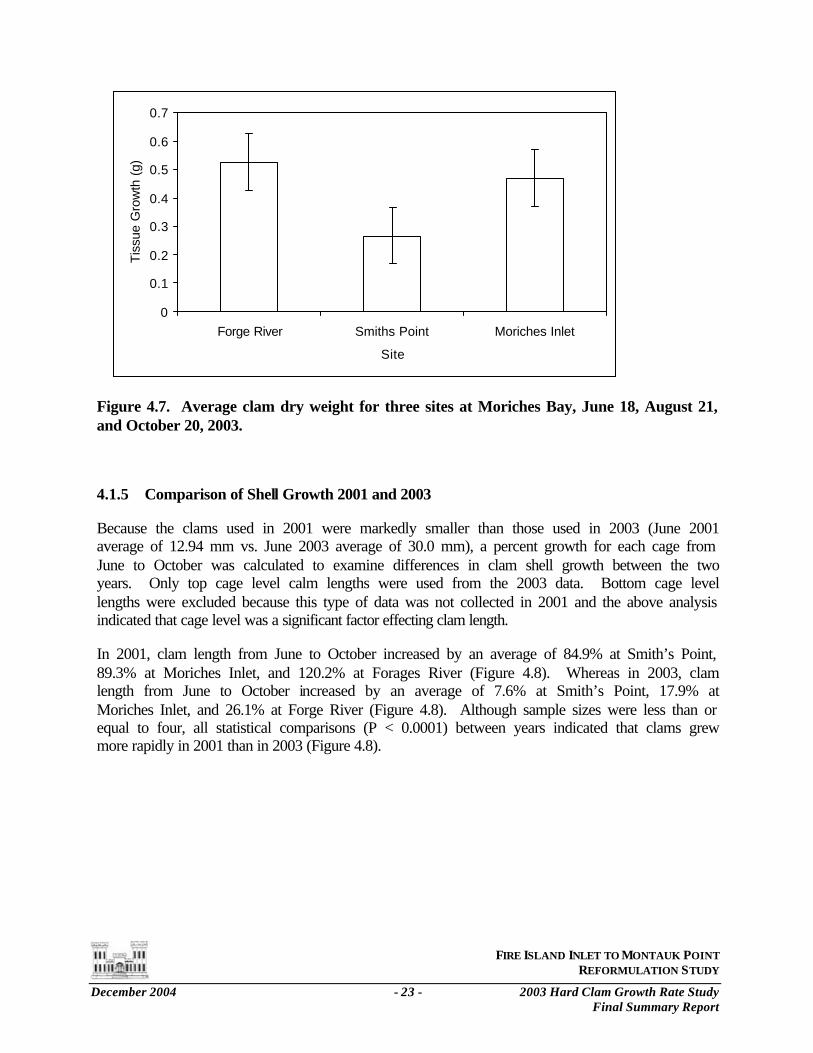
October 20, 2003 ......................................................................................................23 Figure 4.8. Average percent clam shell growth from June through October 2001 and 2003, at
three sites at Moriches Bay.......................................................................................24 Figure 4.9. Daily average total chlorophyll concentrations at the clam growth sites, and an
additional site in Great South Bay, in 2001 ..............................................................25 Figure 4.10. Average total chlorophyll concentrations at the clam growth sites, and at an
additional site in Moriches Bay, in 2001 ..................................................................26
FIRE ISLAND INLET TO MONTAUK POINT REFORMULATION STUDY
December 2004 - v - 2003 Hard Clam Growth Rate Study Final Summary Report
LIST OF FIGURES (continued) FIGURE PAGE Figure 4.11. Daily average chlorophyll concentrations at the clam growth sites, and at an
additional site in Great South Bay, in 2003 .............................................................31 Figure 4.12. Average total chlorophyll concentrations at the clam growth sites, and at an
additional site in Moriches Bay, in 2003 .................................................................32
LIST OF APPENDICES
APPENDIX Appendix A (on enclosed CD)
Appendix A-1 2000 Hard Clam Growth Rate Study Summary Report Appendix A-2 Length Frequency Distributions, June 15th and October 4th, 2001 Appendix A-3 Length Frequency Distributions, June 20th and October 20th, 2003 Appendix A-4 Temperature and Salinity Data, Study Year 2000 Appendix A-5 Phytoplankton Species List and Enumeration, Study Year 2001 Appendix A-6 Phytoplankton/Chlorophyll Size Fractionation, Study Year 2001 Appendix A-7 Phytoplankton/Chlorophyll Size Fractionation, Study Year 2001
Appendix B Temperature and Salinity Charts, Study Year 2000
FIRE ISLAND INLET TO MONTAUK POINT REFORMULATION STUDY
December 2004 - 1 - 2003 Hard Clam Growth Rate Study Final Summary Report
1.0 INTRODUCTION
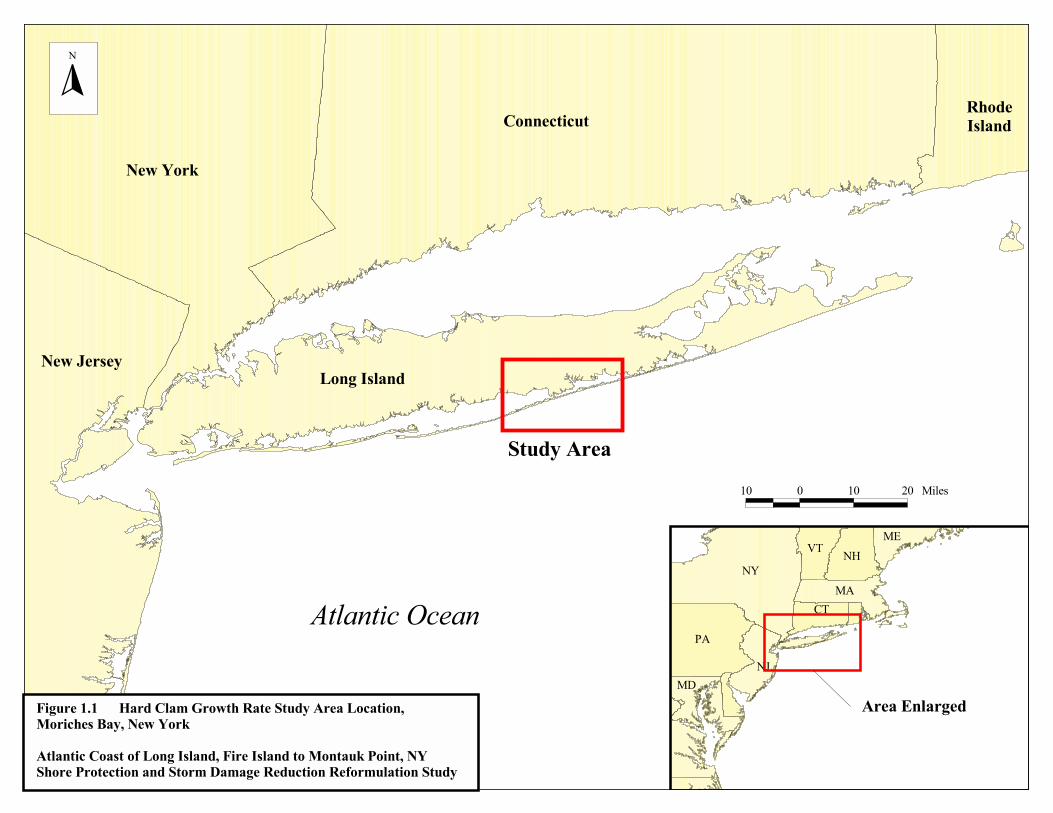
The United States Army Corps of Engineers (USACE), New York District (District) is conducting a reformulation of the shore protection and storm damage reduction project for the south shore of Long Island, New York, from Fire Island Inlet to Montauk Point (FIMP). The project area includes the barrier islands, the Atlantic Ocean shorelines and adjacent back-bay areas of the Great South Bay, Moriches Bay, and Shinnecock Bay. Historically documented breaches resulting from major storm events have occurred along the project shoreline (USACE 1995). The hurricane of 1938 created several openings to Moriches and Shinnecock bays. During January 1980, a breach formed about 1,000 feet east of the eastern jetty of Moriches Inlet. Other locations along the study area have experienced breaching, overwash, or shoreline and dune recession sufficient to suggest that future storms could result in severe impacts including breach formation (USACE 1995). One of the immediate affects of a breach is a the storm surge induced increase in high tide, which can result in erosion, flooding, property damage and related safety issues. Concurrently, a new opening to the ocean has the potential to have significant effects on the physical and biological characteristics of the bay. It has been suggested that such “naturally” occurring breaches may help alleviate some of the water quality problems apparent in estuaries impacted by dense population and development.
Multiple environmental impacts related to the development of Long Island’s coastal areas, including exploitation of the regions natural resources, have affected the productivity and character of the area’s barrier island estuaries. Because the hard clam (Mercenaria mercenaria) was once abundant enough to support a robust commercial fishery, its decline and reports of reduced growth rates have raised many questions and concerns over the health of the south shore embayments of Long Island, especially in Great South Bay (GSB). These concerns include questions about potential changes to the estuaries and their resources in relationship to the occurrence of storm-induced breaches.
1.1 STUDY GOALS AND OBJECTIVES
This report chronicles a study conducted in 2000, 2001 and 2003. The goal of the study was to simulate the various water quality characteristics that exist in an enclosed barrier bay when the barrier island is breached, and to evaluate how the influence of the new inlet may affect the growth of the hard clam. The study examined the influence of a breach by monitoring growth rates of the hard clam at separate sampling locations and comparing these rates with water quality characteristic and total chlorophyll levels. The relative health and abundance of a hard clam population is considered an indicator of the overall viability of a coastal ecosystem (Stanley 1983).
1.2 SITE DESCRIPTION
The study area (Figure 1.1) was located on the south shore of Long Island in Suffolk County, New York, in the townships of Brookhaven and South Hampton and within the bay waters of Moriches Bay (the Bay). The Bay is connected to the Atlantic Ocean through Moriches Inlet and connected by narrow channels to Great South Bay in the west and Shinnocock Bay to the east, and is located approximately 83.7 kilometers (km) west of Montauk Point and 128.7 km east of Battery Park, New York City (Turner 1983).
New York
Connecticut
New Jersey
Atlantic Ocean
RhodeIsland
Long Island
Study Area
Area Enlarged
PA
NY
NJ
CTMA
NHVTME
MD
N
10 0 10 20 Miles
Figure 1.1 Hard Clam Growth Rate Study Area Location, Moriches Bay, New York
Atlantic Coast of Long Island, Fire Island to Montauk Point, NYShore Protection and Storm Damage Reduction Reformulation Study
FIRE ISLAND INLET TO MONTAUK POINT REFORMULATION STUDY
December 2004 - 3 - 2003 Hard Clam Growth Rate Study Final Summary Report
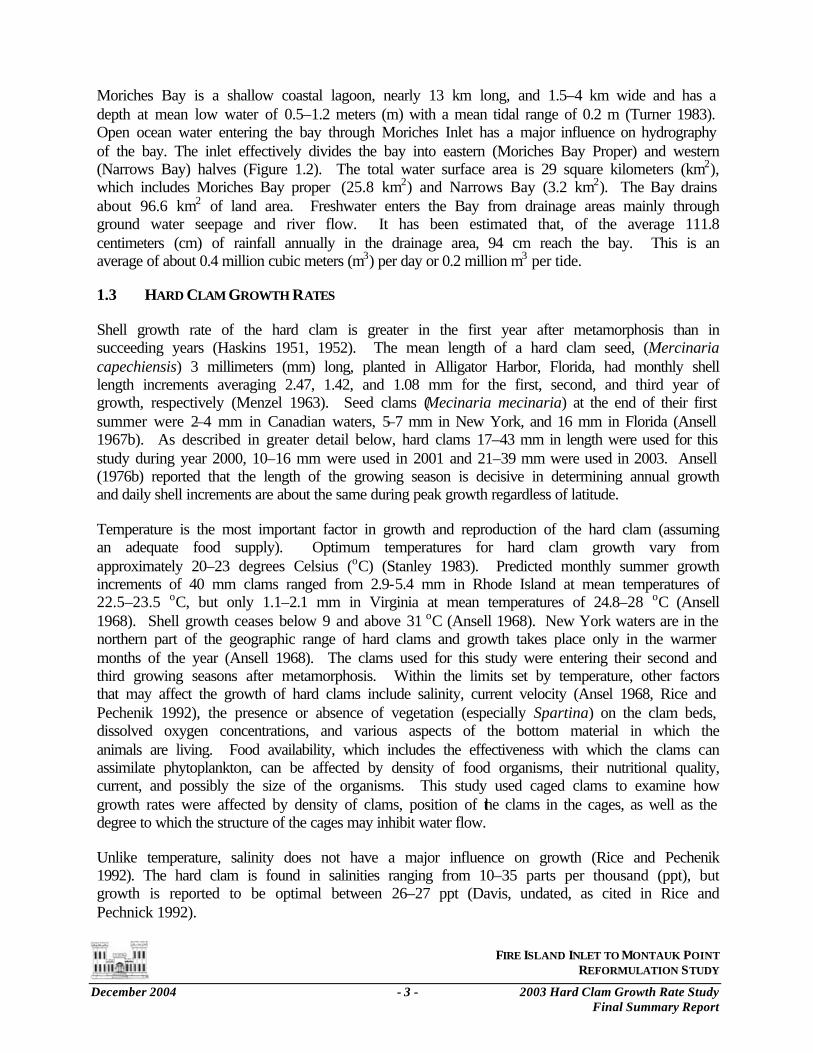
Moriches Bay is a shallow coastal lagoon, nearly 13 km long, and 1.5–4 km wide and has a depth at mean low water of 0.5–1.2 meters (m) with a mean tidal range of 0.2 m (Turner 1983). Open ocean water entering the bay through Moriches Inlet has a major influence on hydrography of the bay. The inlet effectively divides the bay into eastern (Moriches Bay Proper) and western (Narrows Bay) halves (Figure 1.2). The total water surface area is 29 square kilometers (km2), which includes Moriches Bay proper (25.8 km2) and Narrows Bay (3.2 km2). The Bay drains about 96.6 km2 of land area. Freshwater enters the Bay from drainage areas mainly through ground water seepage and river flow. It has been estimated that, of the average 111.8 centimeters (cm) of rainfall annually in the drainage area, 94 cm reach the bay. This is an average of about 0.4 million cubic meters (m3) per day or 0.2 million m3 per tide.
1.3 HARD CLAM GROWTH RATES
Shell growth rate of the hard clam is greater in the first year after metamorphosis than in succeeding years (Haskins 1951, 1952). The mean length of a hard clam seed, (Mercinaria capechiensis) 3 millimeters (mm) long, planted in Alligator Harbor, Florida, had monthly shell length increments averaging 2.47, 1.42, and 1.08 mm for the first, second, and third year of growth, respectively (Menzel 1963). Seed clams (Mecinaria mecinaria) at the end of their first summer were 2–4 mm in Canadian waters, 5–7 mm in New York, and 16 mm in Florida (Ansell 1967b). As described in greater detail below, hard clams 17–43 mm in length were used for this study during year 2000, 10–16 mm were used in 2001 and 21–39 mm were used in 2003. Ansell (1976b) reported that the length of the growing season is decisive in determining annual growth and daily shell increments are about the same during peak growth regardless of latitude.
Temperature is the most important factor in growth and reproduction of the hard clam (assuming an adequate food supply). Optimum temperatures for hard clam growth vary from approximately 20–23 degrees Celsius (oC) (Stanley 1983). Predicted monthly summer growth increments of 40 mm clams ranged from 2.9-5.4 mm in Rhode Island at mean temperatures of 22.5–23.5 oC, but only 1.1–2.1 mm in Virginia at mean temperatures of 24.8–28 oC (Ansell 1968). Shell growth ceases below 9 and above 31 oC (Ansell 1968). New York waters are in the northern part of the geographic range of hard clams and growth takes place only in the warmer months of the year (Ansell 1968). The clams used for this study were entering their second and third growing seasons after metamorphosis. Within the limits set by temperature, other factors that may affect the growth of hard clams include salinity, current velocity (Ansel 1968, Rice and Pechenik 1992), the presence or absence of vegetation (especially Spartina) on the clam beds, dissolved oxygen concentrations, and various aspects of the bottom material in which the animals are living. Food availability, which includes the effectiveness with which the clams can assimilate phytoplankton, can be affected by density of food organisms, their nutritional quality, current, and possibly the size of the organisms. This study used caged clams to examine how growth rates were affected by density of clams, position of the clams in the cages, as well as the degree to which the structure of the cages may inhibit water flow.
Unlike temperature, salinity does not have a major influence on growth (Rice and Pechenik 1992). The hard clam is found in salinities ranging from 10–35 parts per thousand (ppt), but growth is reported to be optimal between 26–27 ppt (Davis, undated, as cited in Rice and Pechnick 1992).
1 0 1 2 Miles
GreatSouth Bay
Moriches Bay
Atlantic Ocean
Bellport Bay
Long Island
N
Mastic Beach
Center Moriches
Bellview Beach
Fire Island National Seashore
ÊÚ ÊÚ
ÊÚ ÊÚ
Moriches Inlet
Smith Point Site
Forge River Site
Great South BaySite
Moriches InletSite
Area Enlarged
Atlantic Ocean
North Bellport
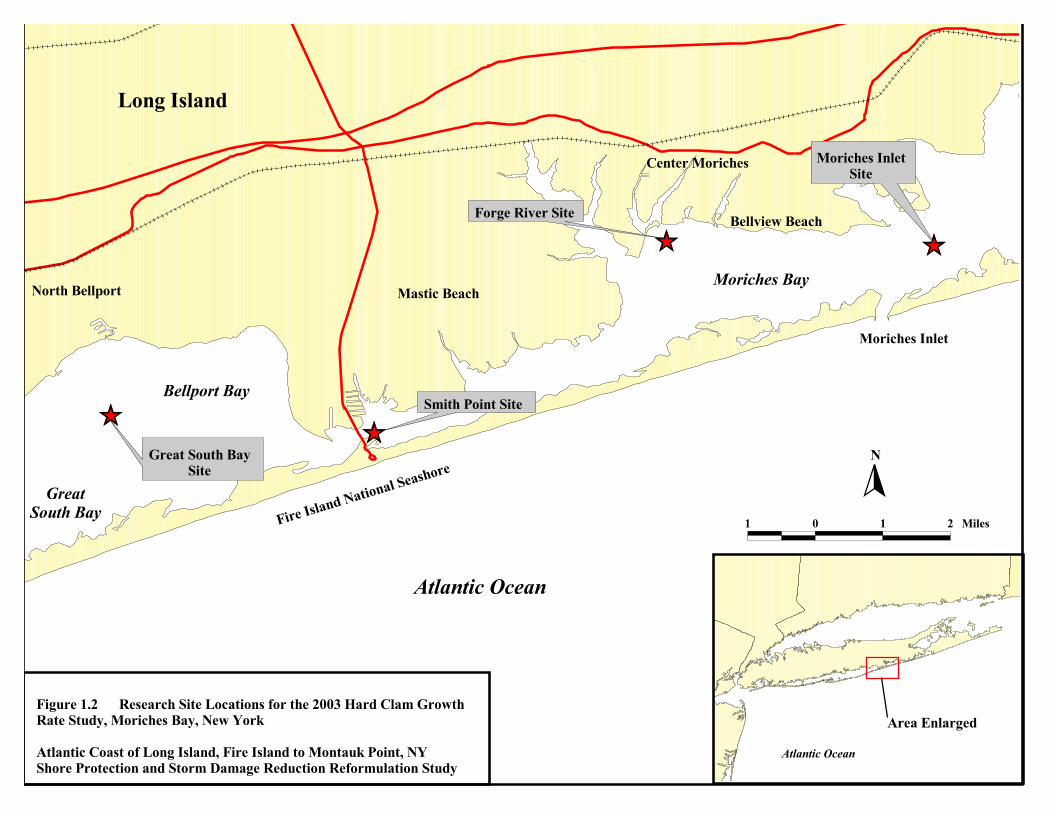
Figure 1.2 Research Site Locations for the 2003 Hard Clam GrowthRate Study, Moriches Bay, New York
Atlantic Coast of Long Island, Fire Island to Montauk Point, NYShore Protection and Storm Damage Reduction Reformulation Study
FIRE ISLAND INLET TO MONTAUK POINT REFORMULATION STUDY
December 2004 - 5 - 2003 Hard Clam Growth Rate Study Final Summary Report
Predation is the primary natural control of hard clam populations (Virstein 1977). Predators include fish, birds, seastars, crabs, and other mollusks. Clam defenses include burrowing and setting among shells, rocks, or vegetation. Kraeuter and Castagna (1980) observed that without shell or rock cover the juvenile hard clam is nearly exterminated by predators. During the first year (2000) of this study, predation by seastars and small crabs were significant causes of mortality (USACE 2001). During the second and third years, a much smaller mesh was used and the grow out cages were raised off the bottom. As a result, predation was almost completely eliminated.
FIRE ISLAND INLET TO MONTAUK POINT REFORMULATION STUDY
December 2004 - 6 - 2003 Hard Clam Growth Rate Study Final Summary Report
2.0 METHODS
The FIMP Technical Management Group examined many important issues regarding the possible influences of a breach on back-bay ecology. One of the important issues was the possible general affects on shellfish growth, and what role a breach might play in the ecology of the small form algal populations, which have been cited as a possible factor leading to the decrease in productivity of the hard clam. A related phytoplankton issue was whether or not an inlet or breach supplies the bay with “high quality phytoplankton” in significant abundance such that it can help to alleviate any negative impacts related to brown tides or other deleterious algal blooms. The study utilized a two-fold approach to investigate these issues in 2001 and 2003. The first method was to use fractionate (via filtration) the total phytoplankton population and measure micrograms per liter (ug/l) of chlorophyll from size fractions larger than or smaller than 5 micrometer (um). The second analytical method used was to time the phytoplankton sampling effort to the tide phases as observed at Moriches Inlet. During data collection, attempts were made to collect the MI sample about mid-tide at flood. The station at the inlet was situated in relatively shallow water close enough to the mouth of the inlet to give a high degree of certainty (as can be seen from the salinity data) that very little mixing was occurring during most of the incoming tide phase so that the water sampled was essentially oceanic in character. Under this assumption the biological and physical parameters of the incoming “breach” station were compared to that of the well-mixed waters of the other two stations (Forge River and Smith Point).
Clam growth during 2001 and 2003, was monitored by measuring shell growth and tissue weight. Clams were measured three times throughout the study: once prior to setting up sites (June); once midway through the study (late July or early August); and, once at the end of the study (October) of each year. These rates were examined through Length Frequency Distribution, single factor ANOVA, multiple factor ANOVA, and Tukey-Kramer post hoc multiple comparisons test; significance level for each contrast was determined using a Bonferroni adjustment for multiple comparisons to control for the experimental-wise error rate.
The growth rate measurement period started in mid June and ended early in October; a duration of 3 and 1/2 months. The three sites chosen (based on consistent salinity differences) were labeled Moriches Inlet (MI), Forge River (FR), and Smiths Point (SP) as shown in Figure 1.2. Representative salinity conditions were chosen to be analogous to:
a. Conditions in the vicinity of a new breach (oceanic about half the time) – MI;
b. Well mixed, but close enough to the inlet to maintain an intermediate salinity and moderated temperature – FR; and,
c. Little or no direct influence from the inlet, relatively low salinity and central to two very shallow bays, Moriches to the east, Great South Bay to the west.
Grow out cages were used to retain clams at each study site (Figure 1.2). Cages were Coastal Aquaculture (CA) OBC models, that had either 1/4, 3/8, or 5/8 inch square mesh. See Figure 2.1 for a diagram of grow out cage configuration. The cages were acquired from Cornell
FIRE ISLAND INLET TO MONTAUK POINT REFORMULATION STUDY
December 2004 - 7 - 2003 Hard Clam Growth Rate Study Final Summary Report
Cooperative’s Suffolk County Marine Environmental Learning Center (SCMELC). The clams were acquired from Paradise Point Oyster Farms (PPOF), in Southold, NY and SCMELC.
Water quality parameters were monitored throughout the entire study. Hydrolab corded H2O probe (units) and Hydrolab Datasonde 3 and 4A (units) were used to collect water quality parameters. The units monitored the water quality parameters at the three grow out sites and at one site in Great South Bay. The H2O probe was lowered from the boat for spot monitoring and the Datasondes were secured to one cage at each grow out station and to a US Coast Guard navigational buoy in the Great South Bay. Upon retrieval, the data were downloaded onto a laptop computer and entered into spreadsheet data files. The amount of time the datasondes remained on station (up to 48 hours) was dependent on weather conditions and how long it took to complete all the required tasks at each station. All grow out stations were in relatively shallow stations, all strongly affected by wind and surface conditions resulting in adequate dissolved oxygen concentrations.
2.1 STUDY DESIGN YEAR 2000
As described in detail in the study year 2000 summary report (USACE 2001), each of the three grow out stations consisted of five replicate cages of 50 clams and two control cages, for a total of seven cages. One of the control cages had 50 clams and the other had 32 clams to establish a test for differences in growth that could be caused by clam density. The five sample cages were set in line and secured to each other with a 5-ft length of rope. Each end of the line was secured with a 15 lb mushroom anchor. The two control cages were set up in the same manner and set parallel to the sample cages. The cages used were CA model OBC-3, with a 5/8-inch square mesh. Water quality data was collected approximately every two weeks.
Cages at the MI site were lost or destroyed in June, presumably as a result of heavy recreational boating in the area. In addition, the MI site was disturbed in July when cages were dislodged from the bottom during an extreme weather event. At this time (July 12, 2000), the study was terminated and clams were collected, consolidated by site, and measured. The shells of the clams that died were also measured. The clams that survived were combined with additional clams provided by SCMELC to restart the study. No statistical analysis on shell and tissue growth for the study year 2000 were used in this report because of the loss or destruction of cages and the high predation at the Moriches Inlet site.
The sampling design was modified during the second part of the year 2000 study. On July 15, three sample cages and one control cage, each containing 50 clams, were redeployed at the grow out stations. A new low salinity site located near Smiths Point (SP), just east of the Smiths Point Bridge, was established. In order to avoid some of the recreational boat traffic, the MI site was moved slightly to the northeast of the original site, away from the main boat channel.

TOP GROW OUT CAGE 18’ OFF BOTTOM (2001/2003)
2 x 3 WOOD SUPPORT SYSTEM BRACKET FOR PVC
UP-RIGHTS
BOTTOM GROW OUT CAGE
AND PVC SUPPORT EXTENSION (2003)
1” PVC CAGE SUPPORT
TOP VIEW
FIGURE 2.1. GROW OUT CAGE SYSTEM
2 x 3 WOOD SUPPORT FRAME
CINDER BLOCK BASE
FIRE ISLAND INLET TO MONTAUK POINT REFORMULATION STUDY
December 2004 - 9 - 2003 Hard Clam Growth Rate Study Final Summary Report
Clam growth in the sample cages was monitored in August and September by measuring the shells of a randomly selected sub-sample of 25 clams from each cage. At the end of the experiment in October, all clams were measured. The cages used for this part of study were OBC-2 (3/8-inch mesh). The smaller mesh was used to reduce predation. Because of the loss of cages and the need to restart the study, few reliable conclusions could be drawn from the growth rate data that were obtained. However, the water quality data recorded at these three stations was reliable and thus, 2000 data were useful for comparisons with water quality data from 2001 and 2003.
Bi-monthly water quality (WQ) monitoring was conducted during eight sampling periods from late June to early October at each grow out site and at four additional locations in the Bay using Hydrolab DataSonde units. The units were secured in place with 6.8 kg mushroom anchors and suspended in the water column with 9-inch round buoy markers. Units were programmed to take readings every 20 minutes and were left in the water for 24–48 hour (hr) periods. Weather conditions etc., in 2000, were most conducive for consistent WQ monitoring and produced the best data set. These results are available on CD, Appendix A-4 of this report.
No phytoplankton analysis was performed in Study Year 2000.
The entire 2000 summary report (USACE 2001) can be accessed on the CD, Appendix A-1 of this report.
2.2 STUDY DESIGN YEAR 2001
Each of the previously established three grow out stations had four cages, each attached to cinder block and raised approximately 18 in off the bottom of the bay (Figure 2.1). For the 2001 study, the cages were raised to reduce predation and the influence that differing substrate characteristics may have had on clam growth. Raising the cages also provided easier access for bi-weekly cleaning. Each cage had 50 measured clams. All clams were measured on June 15, August 16, and October 4, 2001. All clams were measured in length (anterior to posterior axes) to the nearest 0.1 mm using calipers. Haskins (1950) found that the relation of shell height, shell width, and cube root of clam weight to shell length is linear, thus, there are no changes in proportions with growth. Five clams from each cage were removed during each measuring session to measure tissue growth through dry weight analysis. One cage at each site was equipped with Datasonics APL-364 acoustic pinger and each site had the latitude and longitude coordinates recorded with a Garmin GPS128. The cages were maintained bimonthly (during data collection periods) by visually inspecting for any damage and by cleaning the exterior of the cages with scrub brushes. During these maintenance periods which could last from @ 8 to 48 hours, the hydrolab instruments were attached to one of the cages and the acoustic pinger was attached to the instrument.
Phytoplankton analysis was added to the study in 2001. Phytoplankton samples were collected bimonthly and sent Southampton College for analysis. Two one-liter samples were taken at each grow out station and one site in the Great South Bay (GSB) Bellport Harbor area, located west of the Smiths Point site (Figure 1.2). Each sample was taken within 0.5 m of the bottom using a WaterMark 2.2 liter Horizontal Water Sampling Bottle. With the exception of the June 1 sampling (sampled on incoming tide only), samples were collected on the incoming and outgoing
FIRE ISLAND INLET TO MONTAUK POINT REFORMULATION STUDY
December 2004 - 10 - 2003 Hard Clam Growth Rate Study Final Summary Report
tides. Total and size fractions chlorophyll analysis was performed as well as differential phytoplankton identification and enumeration for each sample.
From May 9 to July 3 a corded probe (Hydrolab H2O unit) was employed to collect data for the period of time the boat was on station. From August until the conclusion of sampling, automatic data loggers (Hydrolab Datasonde 3 and 4A units) were used to record parameters for longer durations (up to 48 hrs) depending on weather conditions.
2.3 STUDY DESIGN YEAR 2003
During discussions regarding the various aspects of this study in 2001 and 2003, a question arose concerning the possibility that increases in near-bottom total suspended sediments (TSS) related to development, may play a part in the recent observations of poor clam growth and declining populations. In 2003, the grow out cage orientation was modified to examine this hypothesis. In 2003, each grow out station had two cages attached to each cinder block, one cage at 18 in above the bottom as before, and a second cage attached to the block but resting on the bottom. Three pairs of cages were deployed for a total of six per station. This design facilitated the comparison of differences in growth between clams grown at substrate level to clams suspended in the water column. Each cage had 50 measured clams. The clams were measured in June, August, and October 2003. Five clams from each cage were removed during each measuring session to measure tissue growth through dry weight analysis. One pair of cages at each site was equipped with Datasonics APL-364 acoustic pinger and each site had the latitude and longitude coordinates recorded with a Garmin GPS128. Maintenance and data collection schedules were similar to 2001.
Phytoplankton sampling focused on the incoming tide, but was also performed during outgoing tides when time constraints and weather events permitted. After collection was completed for each tidal cycle, samples were immediately transported back to lab for analysis. Total and size fractions chlorophyll analysis was performed. No enumeration or species identification was performed in 2003 due to budgetary constraints.
Collection of water parameters during this phase of the study was performed similar to those executed in 2001. The units were deployed during each phytoplankton event and information was recorded from 10 minutes to 48 hrs dependent on the unit application. Upon retrieval, the data were downloaded onto a laptop computer and entered into spreadsheet data files.
FIRE ISLAND INLET TO MONTAUK POINT REFORMULATION STUDY
December 2004 - 11 - 2003 Hard Clam Growth Rate Study Final Summary Report
3.0 DATA ANALYSIS
All clams were randomly selected, measured, and divided into groups of fifty (n=50) for each cage. All measurements were recorded in tenths of mm and means were rounded to the nearest 0.1 mm. All live clams were measured three times during the experiment. The measurements were entered into an EXCEL spreadsheet and total clams measured, smallest, largest, mean size, and standard deviation, were calculated for each cage. Length Frequency Distributions of shell growth were calculated and graphed for each of the clam cages in 2001 and 2003 and are available on CD, Appendix A-2 and A-3 of this report. In addition to shell length measurements, during each measuring session, five clams from each cage were examined for tissue growth using dry weight analysis.
3.1 SHELL GROWTH RATE FOR 2001
A total of 12 grow out cages were used for the 2001 experiment; four cages per station. Growth rate was calculated between time periods for each cage by dividing the difference in average length by the number of days between sampling events (i.e., growth rate per day). Growth rate was calculated for the entire sampling period between June and October, June and August, and August and October.
3.1.1 Shell Growth Rate Analysis 2001
A single factor ANOVA was used to test the hypothesis that mean shell growth (length) between the first and last sampling events did not differ across sites. A Tukey-Kramer post hoc multiple comparisons test was used to test for differences between each factor level mean within single factor models. A multiple factor ANOVA was used to test the effects of site, growth period, and their interaction on clam growth rate. Two growth periods were used within the multiple factor model, June to August (62 days) and August to October (50 days). Orthogonal contrasts were used with the multiple factor ANOVA to examine differences among factor level means between each site. Significance level for each contrasts was determined using a Bonferroni adjustment for multiple comparisons to control for the experimental-wise error rate. For example, comparison of growth rate among three sites would require a significance level of 0.02 (0.05 divided by 3 comparisons). Significant level for all other statistical tests was set at 0.05.
3.1.2 Dry Weight 2001
Tissue growth (i.e., increases in average dry weight of tissue) was calculated for the entire sampling period between June and October, June and August and August and September. Mean tissue growth rates were calculated for these time periods for each cage by dividing the difference in average tissue growth by the number of days between sampling events (i.e., tissue growth rate per day).
A single factor ANOVA was used to test the hypothesis that mean tissue growth between the first and last sampling events did not differ across sites. A Tukey-Kramer post hoc multiple comparisons test was used to test for differences between each factor level mean within single factor models. A multiple factor ANOVA was used to test the effects of site, growth period, and their interaction on tissue growth rate. Two growth periods were used within the multiple factor
FIRE ISLAND INLET TO MONTAUK POINT REFORMULATION STUDY
December 2004 - 12 - 2003 Hard Clam Growth Rate Study Final Summary Report
model, June to August (62 days) and August to October (50 days). Orthogonal contrasts were used with the multiple factor ANOVA to examine differences among factor level means between each site. Significance level for each contrast was determined using a Bonferroni adjustment for multiple comparisons to control for the experimental-wise error rate. For example, comparison of tissue growth rate among 3 sites would require a significance level of 0.02 (0.05 divided by 3 comparisons). Significant level for all other statistical tests was set at 0.05.
3.2 SHELL AND TISSUE GROWTH 2003
A total of 18 grow out cages were used for the 2003 experiment; six cages per station. To begin the study, a random selection effort was made to ensure that clams used at each site were of similar size at the start. To examine if this effort was successful, a multiple factor analysis of variance (ANOVA) was used to test the hypotheses that mean clam length and mean clam dry weight did not vary between the three sites or between cage levels during the initial June 18, 2003, sampling. Similarly, a multiple factor ANOVA was used to test the hypothesis that mean clam lengths and clam dry weights did not vary between sites or between cage levels in August and October. For significant multiple factor ANOVA models with no significant interaction a one factor ANOVA was used to examine factor level (i.e., between site, between cage levels) differences. For significant one factor ANOVA models, a Tukey-Kramer post hoc multiple comparisons test was used to test for differences between each factor level mean.
ANOVA assumes that the data are sampled from one or more normal distributions, as well as that the variances of the different populations are the same (homoscedasticity). ANOVA model assumptions were tested using two tests. Normality was tested using the Shapiro-Wilk test and for normally distributed data, Bartlett’s test was used to test for unequal variances. Significance level for all statistical tests was set at 0.05.
3.3 PHYTOPLANKTON 3.3.1 Phytoplankton Identification and Enumeration Chlorophyll 2001
Two water samples, one during the outgoing and one during the incoming tide, were collected on eight days during the growth period between June and October for at all three clam growth sites and an additional site in Great South Bay (Figure 1.2). Water samples for total chlorophyll were analyzed by Southampton College. Daily average total chlorophyll was calculated for each site. Also, average total chlorophyll values were calculated for each site for the entire growth period, the June to August growth period and the August to October growth period.
Total chlorophyll data were not normally distributed and exhibited unequal variances, violating the assumptions of the Analysis of Variance (ANOVA) test. Therefore, nonparametric tests were used to test whether the chlorophyll data differed across sites and between growth periods for each site. A Kruskal-Wallis sum or ranks test (H statistic) was used to test for differences across sites and a Tukey-Kramer post hoc multiple comparisons test was used on the ranked means to investigate where specific site differences occurred. A Wilcox rank-sum test (U statistic) was used to test for differences between the June to August and August to October average total chlorophyll concentrations at each site.
FIRE ISLAND INLET TO MONTAUK POINT REFORMULATION STUDY
December 2004 - 13 - 2003 Hard Clam Growth Rate Study Final Summary Report
During the bimonthly sampling, differential phytoplankton identification and enumeration was also preformed. This was broken down into four categories: diatoms, dinoflagellates, ciliates, and other. Each species was identified to the lowest possible identifiable level (LPIL) and recorded in cells per liter. Similar to the chorophyll analysis, data were collected during both incoming and outgoing tides. Data were collected during both incoming and outgoing tides.
3.3.2 Total Chlorophyll 2003
In 2003, budgetary constraints permitted only the analysis of total chlorophyll. Two water samples, one during the outgoing and one during the incoming tide, were collected on six days from May 30 to September 20, 2003, at all three clam growth sites and an additional site in Great South Bay (Figure 1.2). Daily average total chlorophyll was calculated for each site. Total chlorophyll data were not normally distributed and exhibited unequal variances, violating the assumptions of the ANOVA test. Therefore, nonparametric tests were used to test whether the chlorophyll concentrations data varied across sites. A Kruskal-Wallis sum or ranks test (H statistic) was used to test for this variation.
3.4 WATER QUALITY
Water quality parameters were monitored bimonthly at each station throughout the entire study. The data were downloaded from datasondes and entered into an EXCEL spreadsheet, total readings recorded, smallest, largest, mean size, and standard deviation were calculated for each parameter (temperature, dissolved oxygen, salinity, pH and turbidity).
FIRE ISLAND INLET TO MONTAUK POINT REFORMULATION STUDY
December 2004 - 14 - 2003 Hard Clam Growth Rate Study Final Summary Report
4.0 RESULTS
4.1 GROWTH RATE
4.1.1 Shell Growth Rate 2001
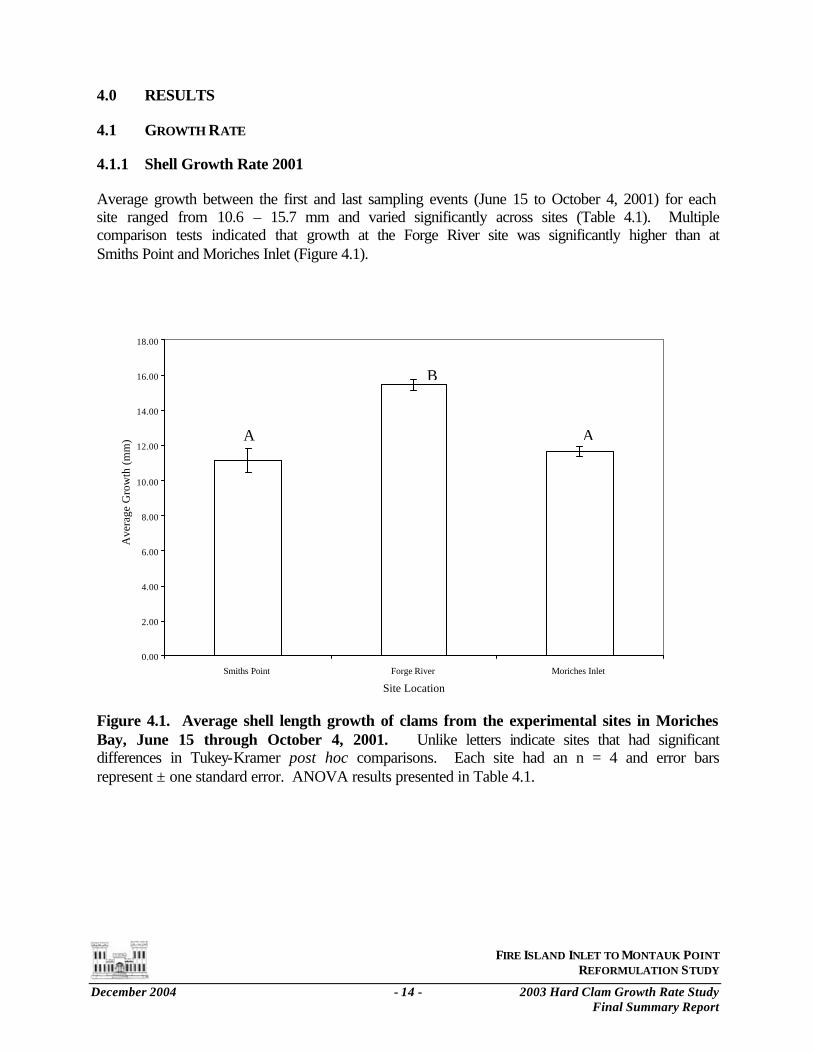
Average growth between the first and last sampling events (June 15 to October 4, 2001) for each site ranged from 10.6 – 15.7 mm and varied significantly across sites (Table 4.1). Multiple comparison tests indicated that growth at the Forge River site was significantly higher than at Smiths Point and Moriches Inlet (Figure 4.1).
Figure 4.1. Average shell length growth of clams from the experimental sites in Moriches Bay, June 15 through October 4, 2001. Unlike letters indicate sites that had significant differences in Tukey-Kramer post hoc comparisons. Each site had an n = 4 and error bars represent ± one standard error. ANOVA results presented in Table 4.1.
A
B
0.00
2.00
4.00
6.00
8.00
10.00
12.00
14.00
16.00
18.00
Smiths Point Forge River Moriches Inlet
Site Location
Ave
rage
Gro
wth
(mm
) A
FIRE ISLAND INLET TO MONTAUK POINT REFORMULATION STUDY
December 2004 - 15 - 2003 Hard Clam Growth Rate Study Final Summary Report
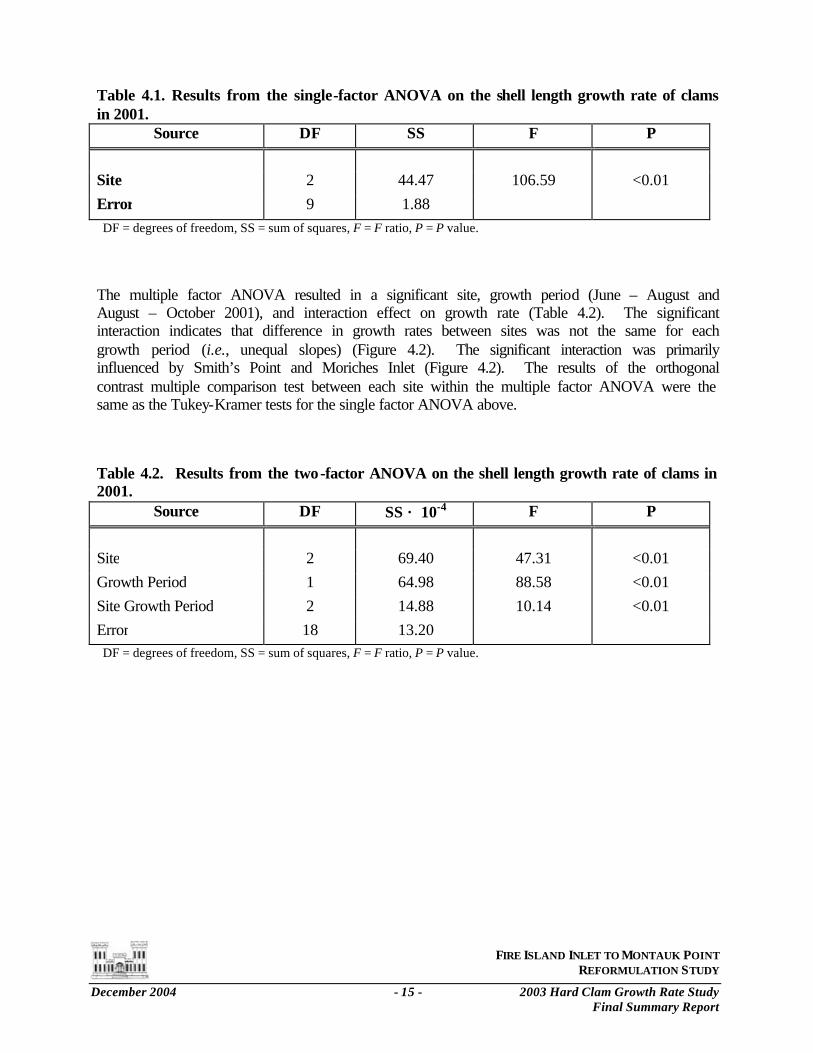
Table 4.1. Results from the single-factor ANOVA on the shell length growth rate of clams in 2001.
Source DF SS F P
Site 2 44.47 106.59 <0.01 Error 9 1.88 DF = degrees of freedom, SS = sum of squares, F = F ratio, P = P value.
The multiple factor ANOVA resulted in a significant site, growth period (June – August and August – October 2001), and interaction effect on growth rate (Table 4.2). The significant interaction indicates that difference in growth rates between sites was not the same for each growth period (i.e., unequal slopes) (Figure 4.2). The significant interaction was primarily influenced by Smith’s Point and Moriches Inlet (Figure 4.2). The results of the orthogonal contrast multiple comparison test between each site within the multiple factor ANOVA were the same as the Tukey-Kramer tests for the single factor ANOVA above.
Table 4.2. Results from the two-factor ANOVA on the shell length growth rate of clams in 2001.
Source DF SS × 10-4 F P
Site 2 69.40 47.31 <0.01 Growth Period 1 64.98 88.58 <0.01 Site Growth Period 2 14.88 10.14 <0.01 Error 18 13.20 DF = degrees of freedom, SS = sum of squares, F = F ratio, P = P value.
FIRE ISLAND INLET TO MONTAUK POINT REFORMULATION STUDY
December 2004 - 16 - 2003 Hard Clam Growth Rate Study Final Summary Report
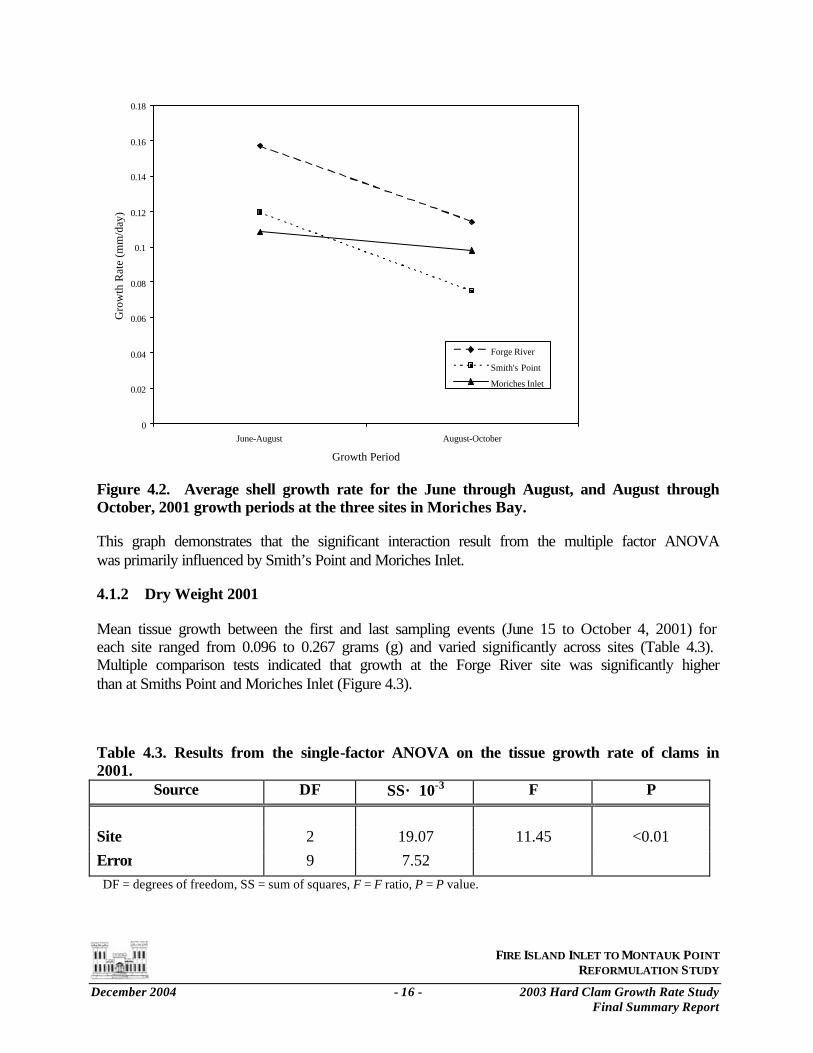
Figure 4.2. Average shell growth rate for the June through August, and August through October, 2001 growth periods at the three sites in Moriches Bay.
This graph demonstrates that the significant interaction result from the multiple factor ANOVA was primarily influenced by Smith’s Point and Moriches Inlet.
4.1.2 Dry Weight 2001
Mean tissue growth between the first and last sampling events (June 15 to October 4, 2001) for each site ranged from 0.096 to 0.267 grams (g) and varied significantly across sites (Table 4.3). Multiple comparison tests indicated that growth at the Forge River site was significantly higher than at Smiths Point and Moriches Inlet (Figure 4.3).
Table 4.3. Results from the single-factor ANOVA on the tissue growth rate of clams in 2001.
Source DF SS× 10-3 F P
Site 2 19.07 11.45 <0.01 Error 9 7.52 DF = degrees of freedom, SS = sum of squares, F = F ratio, P = P value.
0
0.02
0.04
0.06
0.08
0.1
0.12
0.14
0.16
0.18
June-August August-October
Growth Period
Gro
wth
Rat
e (m
m/d
ay)
Forge River
Smith's Point
Moriches Inlet
FIRE ISLAND INLET TO MONTAUK POINT REFORMULATION STUDY
December 2004 - 17 - 2003 Hard Clam Growth Rate Study Final Summary Report
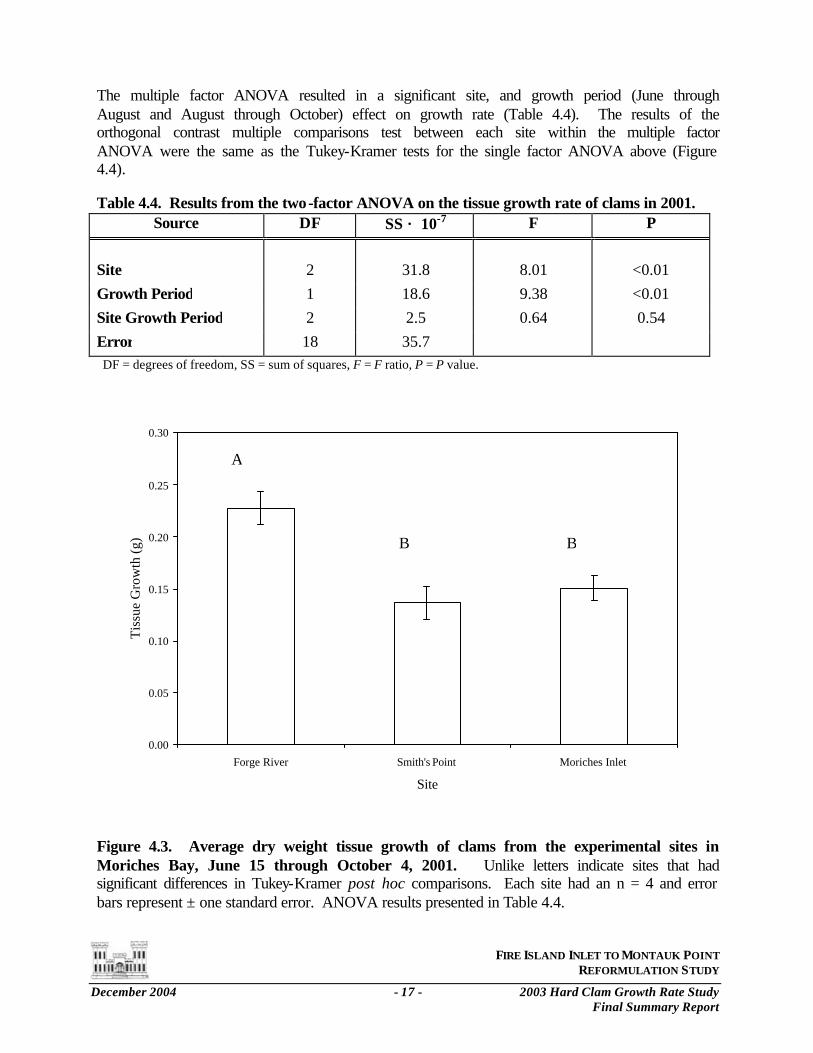
The multiple factor ANOVA resulted in a significant site, and growth period (June through August and August through October) effect on growth rate (Table 4.4). The results of the orthogonal contrast multiple comparisons test between each site within the multiple factor ANOVA were the same as the Tukey-Kramer tests for the single factor ANOVA above (Figure 4.4).
Table 4.4. Results from the two-factor ANOVA on the tissue growth rate of clams in 2001. Source DF SS × 10-7 F P
Site 2 31.8 8.01 <0.01 Growth Period 1 18.6 9.38 <0.01 Site Growth Period 2 2.5 0.64 0.54 Error 18 35.7 DF = degrees of freedom, SS = sum of squares, F = F ratio, P = P value.
Figure 4.3. Average dry weight tissue growth of clams from the experimental sites in Moriches Bay, June 15 through October 4, 2001. Unlike letters indicate sites that had significant differences in Tukey-Kramer post hoc comparisons. Each site had an n = 4 and error bars represent ± one standard error. ANOVA results presented in Table 4.4.
A
B B
0.00
0.05
0.10
0.15
0.20
0.25
0.30
Forge River Smith's Point Moriches Inlet
Site
Tis
sue
Gro
wth
(g)
FIRE ISLAND INLET TO MONTAUK POINT REFORMULATION STUDY
December 2004 - 18 - 2003 Hard Clam Growth Rate Study Final Summary Report
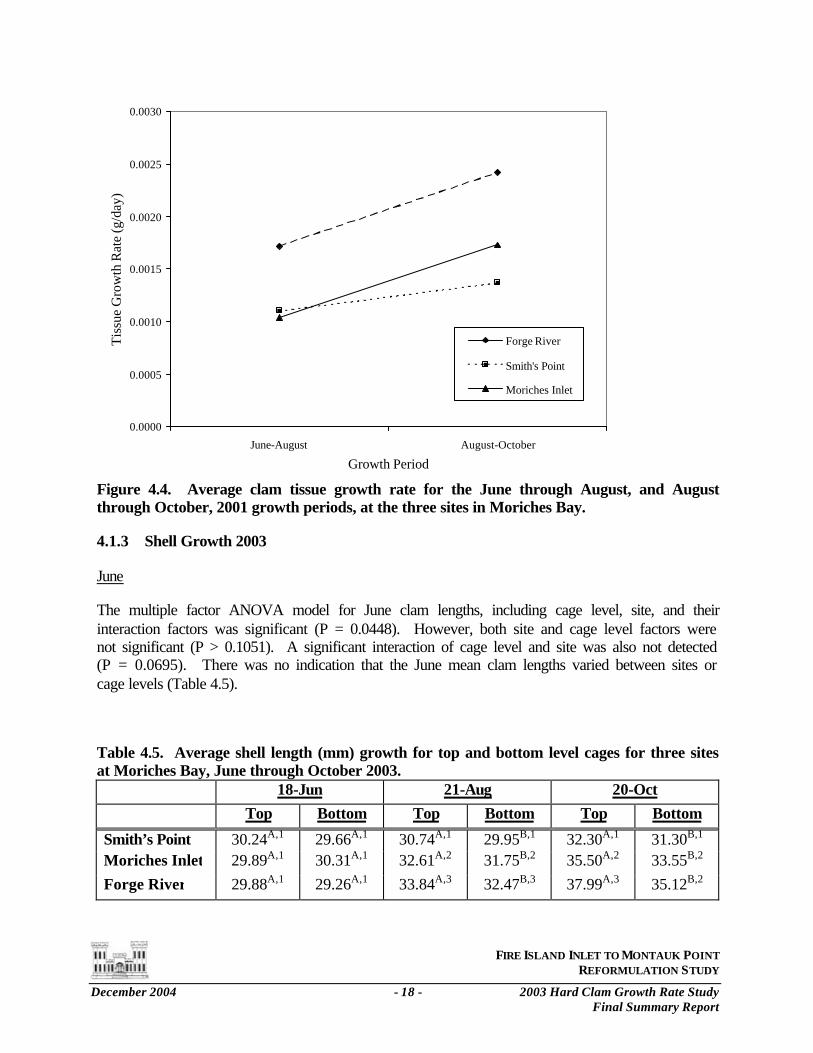
Figure 4.4. Average clam tissue growth rate for the June through August, and August through October, 2001 growth periods, at the three sites in Moriches Bay.
4.1.3 Shell Growth 2003
June
The multiple factor ANOVA model for June clam lengths, including cage level, site, and their interaction factors was significant (P = 0.0448). However, both site and cage level factors were not significant (P > 0.1051). A significant interaction of cage level and site was also not detected (P = 0.0695). There was no indication that the June mean clam lengths varied between sites or cage levels (Table 4.5).
Table 4.5. Average shell length (mm) growth for top and bottom level cages for three sites at Moriches Bay, June through October 2003.
18-Jun 21-Aug 20-Oct Top Bottom Top Bottom Top Bottom
Smith’s Point 30.24A,1 29.66A,1 30.74A,1 29.95B,1 32.30A,1 31.30B,1 Moriches Inlet 29.89A,1 30.31A,1 32.61A,2 31.75B,2 35.50A,2 33.55B,2 Forge River 29.88A,1 29.26A,1 33.84A,3 32.47B,3 37.99A,3 35.12B,2
0.0000
0.0005
0.0010
0.0015
0.0020
0.0025
0.0030
June-August August-October
Growth Period
Tis
sue
Gro
wth
Rat
e (g
/day
)
Forge River
Smith's Point
Moriches Inlet
FIRE ISLAND INLET TO MONTAUK POINT REFORMULATION STUDY
December 2004 - 19 - 2003 Hard Clam Growth Rate Study Final Summary Report
Significant difference (P < 0.05) between top and bottom cage level mean clam lengths for each site for each time period is indicated by unlike letters. Significant difference (P < 0.05) between site clam length means for top and bottom levels for each time period is indicated by unlike numbers.
August
The multiple factor ANOVA model for August, 2003, clam lengths, including cage level, site, and their interaction factors was significant (P < 0.0001). Both cage level and site factors were significant (P < 0.0001). A significant interaction of cage level and site was not detected (P < 0.4856), indicating that the difference between the top and bottom level cage lengths was similar across sites (i.e., same slopes). August top level clam lengths were significantly longer than bottom level clam lengths at all three sites (P < 0.0259) (Table 4.1). Because of the significant cage level effect, variability in August clam lengths across sites was examined for top and bottom level cages separately using a one factor ANOVA. August top level mean clam lengths varied significantly across sites (P < 0.0001). Top level clam lengths were significantly longer at Forge River than at Moriches Inlet and Moriches Inlet lengths were significantly longer than those at Smith’s Point (P < 0.05). August bottom level mean clam lengths varied significantly across sites (P < 0.0001) (Table 4.5). Bottom level clam lengths were significantly longer at Forge River than at Moriches Inlet and Moriches Inlet lengths were significantly longer than those at Smith’s Point (P < 0.05) (Table 4.1).
October
The multiple factor ANOVA model for October, 2003, clam lengths, including cage level, site, and their interaction factors was significant (P < 0.0001). Both cage level and site factors were significant (P < 0.0001). A significant interaction of cage level and site was not detected (P < 0.085), indicating that the difference between the top and bottom level cage lengths was similar across sites (i.e., same slopes). October top level clam lengths were significantly longer than bottom level clam lengths at all three sites (P < 0.0019) (Table 4.1). Because of the significant cage level effect, variability in October clam lengths across sites was examined for top and bottom level cages separately using a one factor ANOVA. October top level mean clam lengths varied significantly across sites (P < 0.0001). Top level clam lengths were significantly longer at Forge River than at Moriches Inlet and Moriches Inlet lengths were significantly longer than those at Smith’s Point (P < 0.05) (Table 4.1). October bottom level mean clam lengths varied significantly across sites (P < 0.0001). Bottom level clam lengths were not significantly different between Forge River and Moriches Inlet, but lengths at both of these sites were significantly longer than those at Smith’s Point (P < 0.05) (Table 4.5).
Summary
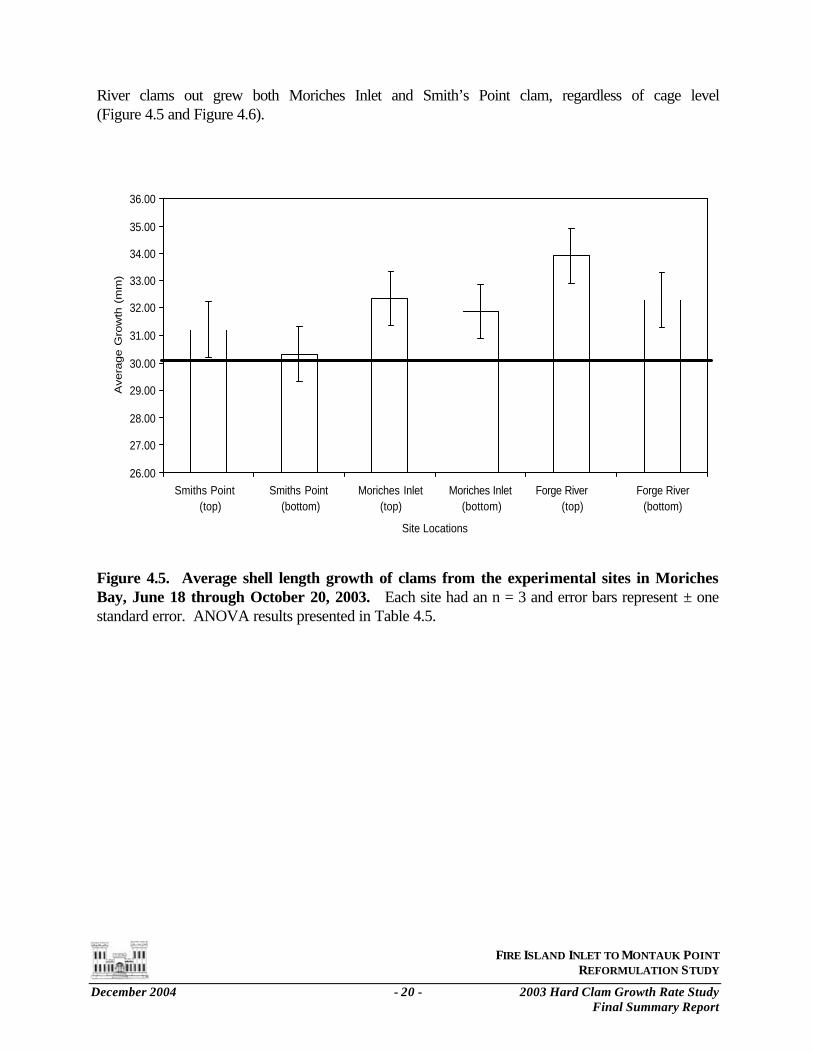
Between June 18, 2003, and October 20, 2003, increases in mean clam length (October length mean – June length mean) for clams held in the top level cages ranged from 2.06 mm for Smith’s Point to 8.11 mm for Forge River (Figure 4.5 and Figure 4.6). For the same time period bottom level length increases ranged from 1.64 mm for Smith’s Point to 5.28 mm for Forge River. From June to October, 2003, top level clams out grew bottom level clams at all three sites and Forge
FIRE ISLAND INLET TO MONTAUK POINT REFORMULATION STUDY
December 2004 - 20 - 2003 Hard Clam Growth Rate Study Final Summary Report
River clams out grew both Moriches Inlet and Smith’s Point clam, regardless of cage level (Figure 4.5 and Figure 4.6).
26.00
27.00
28.00
29.00
30.00
31.00
32.00
33.00
34.00
35.00
36.00
Smiths Point (top)
Smiths Point(bottom)
Moriches Inlet(top)
Moriches Inlet(bottom)
Forge River (top)
Forge River(bottom)
Site Locations
Ave
rage G
row
th (
mm
)
Figure 4.5. Average shell length growth of clams from the experimental sites in Moriches Bay, June 18 through October 20, 2003. Each site had an n = 3 and error bars represent ± one standard error. ANOVA results presented in Table 4.5.
FIRE ISLAND INLET TO MONTAUK POINT REFORMULATION STUDY
December 2004 - 21 - 2003 Hard Clam Growth Rate Study Final Summary Report
29.0
30.0
31.0
32.0
33.0
34.0
35.0
36.0
37.0
38.0
39.0
June August October
Leng
th (m
m)
Smith's Point (Top)
Smith's Point (Bottom)
Moriches Inlet (Top)
Moriches Inlet (Bottom)
Forge River (Top)
Forge River (Bottom)
Figure 4.6. Average shell length growth for top and bottom level cages for three sites at Moriches Bay, June 18, August 21, and October 20, 2003. Each site had an n = 3 and error bars represent ± one standard error. ANOVA results presented in Table 4.5.
4.1.4 Tissue Growth 2003
June
The multiple factor ANOVA model for June, 2003, clam weight, including cage level, site, and their interaction factors was not significant (P = 0.8988). There was no indication that the June mean clam dry weights varied across sites or between cage levels (Table 4.6).
Table 4.6. Average clam dry weight (g) for three sites at Moriches Bay, June through October 2003. Significant difference (P < 0.05) between site clam length means for each time period is indicated by unlike numbers.
18-Jun 21-Aug 20-Oct
Smith’s Point 0.23A 0.20A 0.37A Moriches Inlet 0.22A 0.48B 0.71B Forges River 0.22A 0.60C 0.76B
FIRE ISLAND INLET TO MONTAUK POINT REFORMULATION STUDY
December 2004 - 22 - 2003 Hard Clam Growth Rate Study Final Summary Report
August
The multiple factor ANOVA model for August, 2003, clam dry weights, including cage level, site, and their interaction factors was significant (P < 0.0001). Site factor was significant (P < 0.0001), whereas there was no indication of a significant cage level effect (P = 0.4219). A significant interaction of cage level and site was not detected (P = 0.8102). Because there was no indication that top and bottom level mean clam dry weights were significantly different, differences in August clam weights across sites were examined within a one-factor ANOVA. August mean clam dry weights varied significantly across sites (P < 0.0001). Clam dry weights were significantly heavier at Forge River than at Moriches Inlet and Moriches Inlet weights were significantly heavier than those at Smith’s Point (P < 0.05) (Table 4.6).
October
The multiple factor ANOVA model for October, 2003, clam dry weights, including cage level, site, and their interaction factors was significant (P = 0.0003). Site factor was significant (P < 0.0001), whereas there was no indication of a significant cage level effect (P = 0.1432). A significant interaction of cage level and site was not detected (P = 0.5792). Because there was no indication that top and bottom level mean clam dry weights were significantly different, differences in October clam weights across sites were examined within a one-factor ANOVA. October mean clam dry weights varied significantly across sites (P < 0.0001). Clam dry weights were not significantly different between Forge River and Moriches Inlet, but weights at both of these sites were significantly heavier than those at Smith’s Point (P < 0.05) (Table 4.6).
Summary
From June 18 to October 20, 2003, increases in mean clam dry weights ranged from 0.14 g for Smith’s Point to 0.54 g for Forge River (Figure 4.7). No differences between top and bottom cage level dry weights could be detected. By October clam dry weights at Forge River and Moriches Inlet were significantly heavier than those found at Smith’s Point (P < 0.05) (Figure 4.7).
FIRE ISLAND INLET TO MONTAUK POINT REFORMULATION STUDY
December 2004 - 23 - 2003 Hard Clam Growth Rate Study Final Summary Report
0
0.1
0.2
0.3
0.4
0.5
0.6
0.7
Forge River Smiths Point Moriches Inlet
Site
Tiss
ue G
row
th (
g)
Figure 4.7. Average clam dry weight for three sites at Moriches Bay, June 18, August 21, and October 20, 2003.
4.1.5 Comparison of Shell Growth 2001 and 2003
Because the clams used in 2001 were markedly smaller than those used in 2003 (June 2001 average of 12.94 mm vs. June 2003 average of 30.0 mm), a percent growth for each cage from June to October was calculated to examine differences in clam shell growth between the two years. Only top cage level calm lengths were used from the 2003 data. Bottom cage level lengths were excluded because this type of data was not collected in 2001 and the above analysis indicated that cage level was a significant factor effecting clam length.
In 2001, clam length from June to October increased by an average of 84.9% at Smith’s Point, 89.3% at Moriches Inlet, and 120.2% at Forages River (Figure 4.8). Whereas in 2003, clam length from June to October increased by an average of 7.6% at Smith’s Point, 17.9% at Moriches Inlet, and 26.1% at Forge River (Figure 4.8). Although sample sizes were less than or equal to four, all statistical comparisons (P < 0.0001) between years indicated that clams grew more rapidly in 2001 than in 2003 (Figure 4.8).
FIRE ISLAND INLET TO MONTAUK POINT REFORMULATION STUDY
December 2004 - 24 - 2003 Hard Clam Growth Rate Study Final Summary Report
0
20
40
60
80
100
120
Smith's Point Forage River Moriches Inlet
20012003
Figure 4.8. Average percent clam shell growth from June to October 2001, and 2003, at three sites at Moriches Bay. Note: the 2003 growth period was 12 days longer than that of 2001.
4.2 PHYTOPLANKTON
4.2.1 Total Chlorophyll 2001
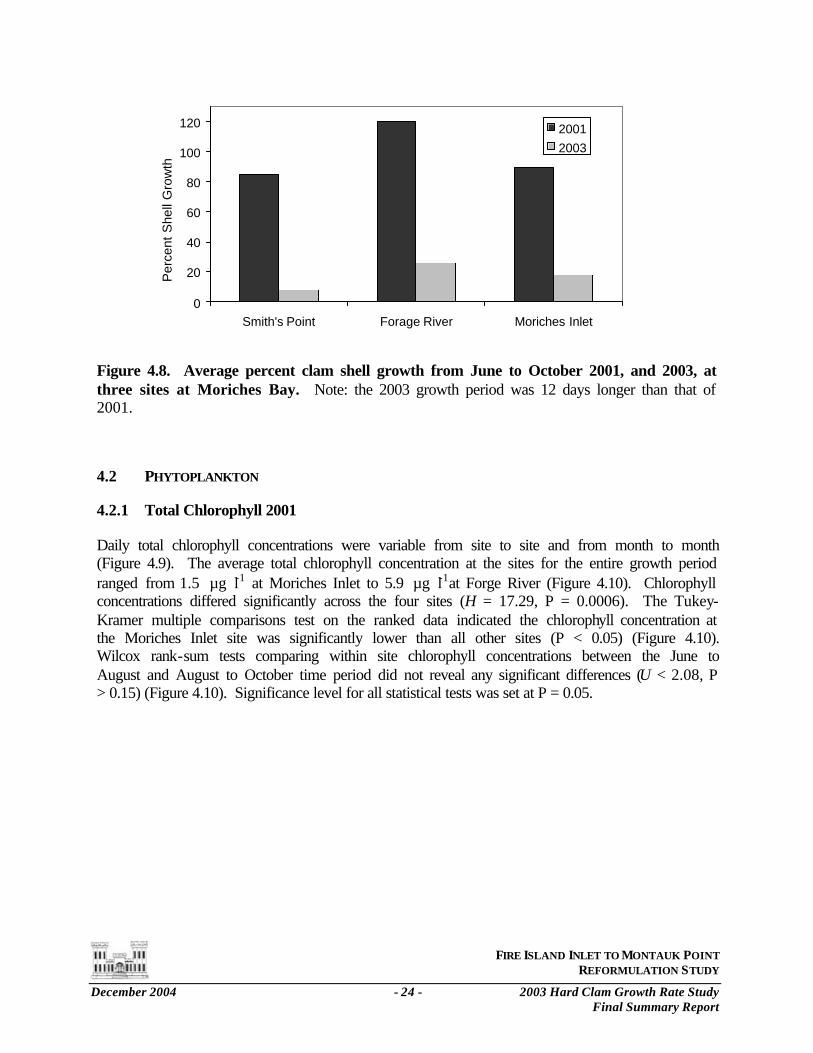
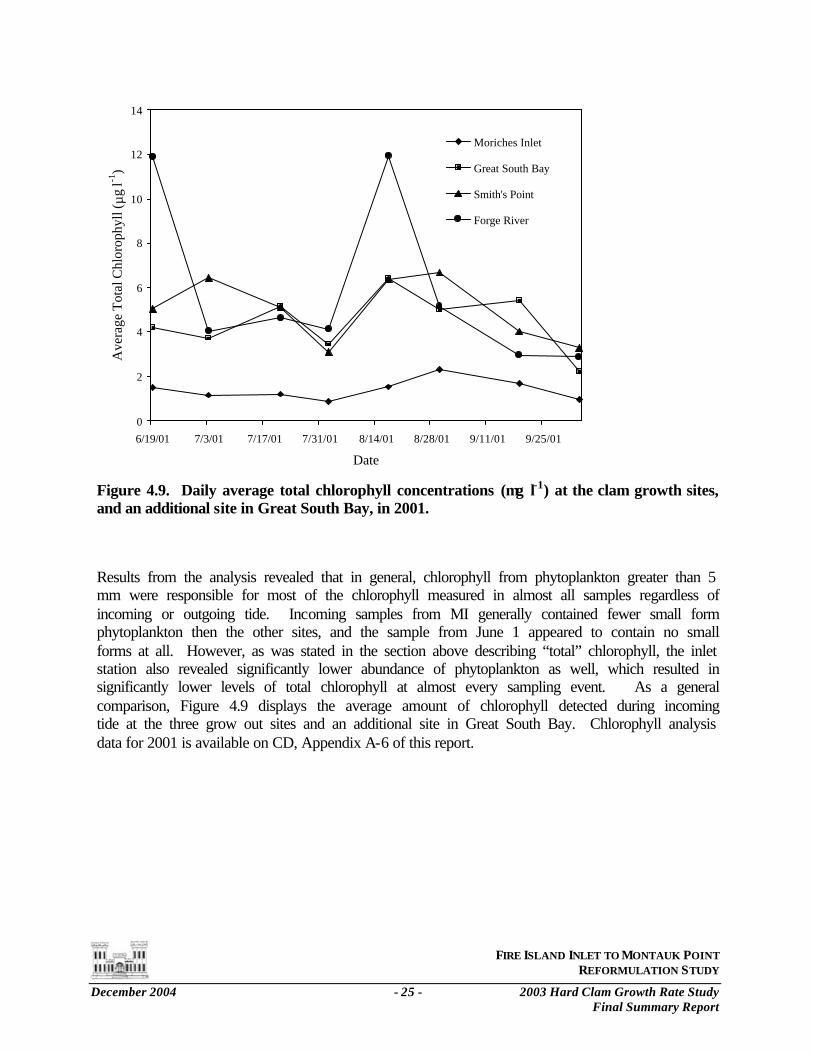
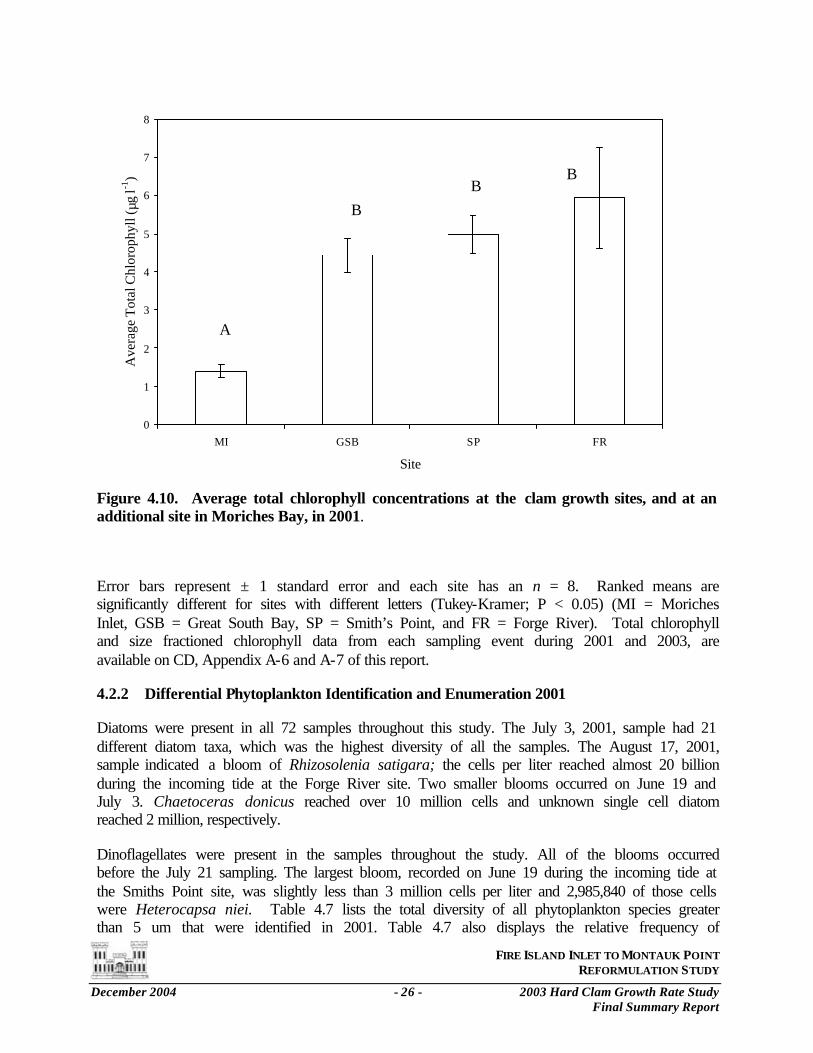
Daily total chlorophyll concentrations were variable from site to site and from month to month (Figure 4.9). The average total chlorophyll concentration at the sites for the entire growth period ranged from 1.5 µg l-1 at Moriches Inlet to 5.9 µg l-1at Forge River (Figure 4.10). Chlorophyll concentrations differed significantly across the four sites (H = 17.29, P = 0.0006). The Tukey-Kramer multiple comparisons test on the ranked data indicated the chlorophyll concentration at the Moriches Inlet site was significantly lower than all other sites (P < 0.05) (Figure 4.10). Wilcox rank-sum tests comparing within site chlorophyll concentrations between the June to August and August to October time period did not reveal any significant differences (U < 2.08, P > 0.15) (Figure 4.10). Significance level for all statistical tests was set at P = 0.05.
Per
cent
She
ll G
row
th
FIRE ISLAND INLET TO MONTAUK POINT REFORMULATION STUDY
December 2004 - 25 - 2003 Hard Clam Growth Rate Study Final Summary Report
Figure 4.9. Daily average total chlorophyll concentrations (µg l-1) at the clam growth sites, and an additional site in Great South Bay, in 2001.
Results from the analysis revealed that in general, chlorophyll from phytoplankton greater than 5 mm were responsible for most of the chlorophyll measured in almost all samples regardless of incoming or outgoing tide. Incoming samples from MI generally contained fewer small form phytoplankton then the other sites, and the sample from June 1 appeared to contain no small forms at all. However, as was stated in the section above describing “total” chlorophyll, the inlet station also revealed significantly lower abundance of phytoplankton as well, which resulted in significantly lower levels of total chlorophyll at almost every sampling event. As a general comparison, Figure 4.9 displays the average amount of chlorophyll detected during incoming tide at the three grow out sites and an additional site in Great South Bay. Chlorophyll analysis data for 2001 is available on CD, Appendix A-6 of this report.
0
2
4
6
8
10
12
14
6/19/01 7/3/01 7/17/01 7/31/01 8/14/01 8/28/01 9/11/01 9/25/01
Date
Ave
rage
Tot
al C
hlor
ophy
ll ( µ
g l-1
)
Moriches Inlet
Great South Bay
Smith's Point
Forge River
FIRE ISLAND INLET TO MONTAUK POINT REFORMULATION STUDY
December 2004 - 26 - 2003 Hard Clam Growth Rate Study Final Summary Report
Figure 4.10. Average total chlorophyll concentrations at the clam growth sites, and at an additional site in Moriches Bay, in 2001.
Error bars represent ± 1 standard error and each site has an n = 8. Ranked means are significantly different for sites with different letters (Tukey-Kramer; P < 0.05) (MI = Moriches Inlet, GSB = Great South Bay, SP = Smith’s Point, and FR = Forge River). Total chlorophyll and size fractioned chlorophyll data from each sampling event during 2001 and 2003, are available on CD, Appendix A-6 and A-7 of this report.
4.2.2 Differential Phytoplankton Identification and Enumeration 2001
Diatoms were present in all 72 samples throughout this study. The July 3, 2001, sample had 21 different diatom taxa, which was the highest diversity of all the samples. The August 17, 2001, sample indicated a bloom of Rhizosolenia satigara; the cells per liter reached almost 20 billion during the incoming tide at the Forge River site. Two smaller blooms occurred on June 19 and July 3. Chaetoceras donicus reached over 10 million cells and unknown single cell diatom reached 2 million, respectively.
Dinoflagellates were present in the samples throughout the study. All of the blooms occurred before the July 21 sampling. The largest bloom, recorded on June 19 during the incoming tide at the Smiths Point site, was slightly less than 3 million cells per liter and 2,985,840 of those cells were Heterocapsa niei. Table 4.7 lists the total diversity of all phytoplankton species greater than 5 um that were identified in 2001. Table 4.7 also displays the relative frequency of
0
1
2
3
4
5
6
7
8
MI GSB SP FR
Site
Ave
rage
Tot
al C
hlor
ophy
ll ( µ
g l-1
) B B
A
B
FIRE ISLAND INLET TO MONTAUK POINT REFORMULATION STUDY
December 2004 - 27 - 2003 Hard Clam Growth Rate Study Final Summary Report
occurrence of individual species and compares them within MI upon incoming and within the rest of the bay in relationship to the other to stations. The purpose of this accounting was to determine if there was an obvious difference between species coming into the bay at the inlet, and diversity in other parts of the bay. Table 4.8 displays this information on a sampling date basis. Phytoplankton diversity and enumeration data for each of the samples collected during 2001 can be found on CD in Appendix A-5 of this report.
Of the small form organisms identified in this analysis, cilliates were the least diverse and the least abundant. No more than two taxa were present in any sample and never reached more than 80 thousand cells per liter. Stombiduim spp. was the dominant taxa, reaching 76,560 cells per liter during the September 19, 2001 sampling.
FIRE ISLAND INLET TO MONTAUK POINT REFORMULATION STUDY
December 2004 - 28 - 2003 Hard Clam Growth Rate Study Final Summary Report
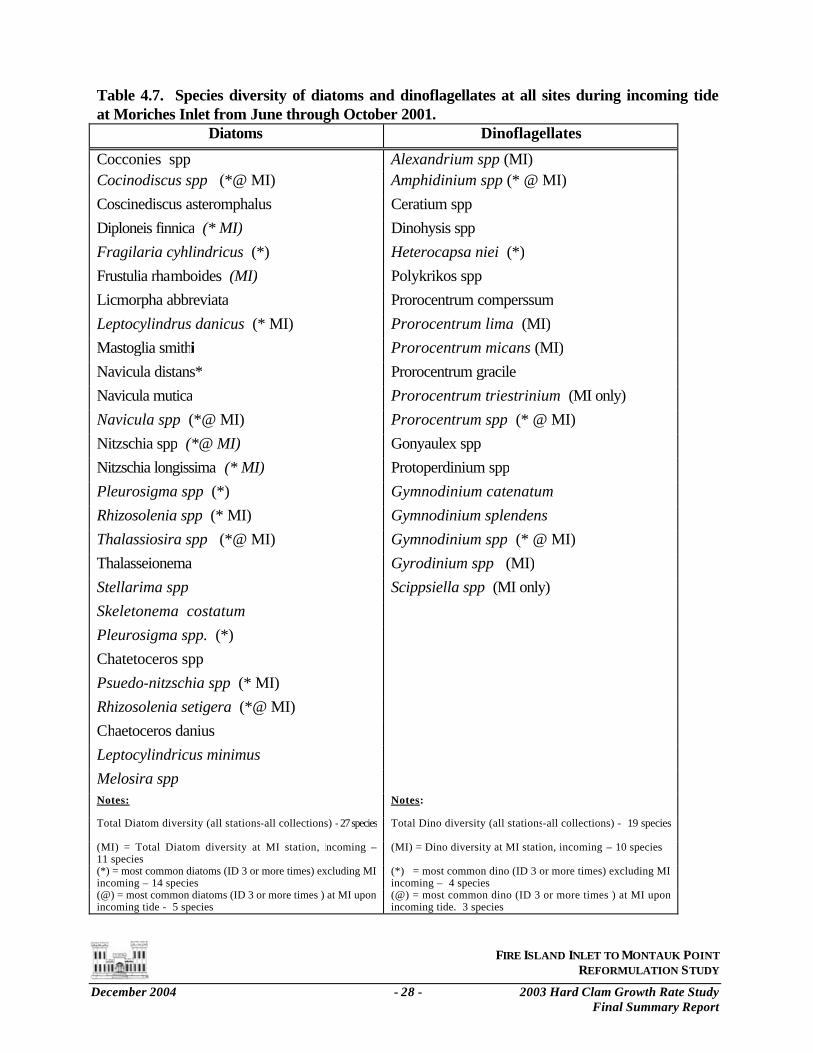
Table 4.7. Species diversity of diatoms and dinoflagellates at all sites during incoming tide at Moriches Inlet from June through October 2001.
Diatoms Dinoflagellates
Cocconies spp Alexandrium spp (MI) Cocinodiscus spp (*@ MI) Amphidinium spp (* @ MI) Coscinediscus asteromphalus Ceratium spp Diploneis finnica (* MI) Dinohysis spp Fragilaria cyhlindricus (*) Heterocapsa niei (*) Frustulia rhamboides (MI) Polykrikos spp Licmorpha abbreviata Prorocentrum comperssum Leptocylindrus danicus (* MI) Prorocentrum lima (MI) Mastoglia smithi Prorocentrum micans (MI) Navicula distans* Prorocentrum gracile Navicula mutica Prorocentrum triestrinium (MI only) Navicula spp (*@ MI) Prorocentrum spp (* @ MI) Nitzschia spp (*@ MI) Gonyaulex spp Nitzschia longissima (* MI) Protoperdinium spp Pleurosigma spp (*) Gymnodinium catenatum Rhizosolenia spp (* MI) Gymnodinium splendens Thalassiosira spp (*@ MI) Gymnodinium spp (* @ MI) Thalasseionema Gyrodinium spp (MI) Stellarima spp Scippsiella spp (MI only) Skeletonema costatum Pleurosigma spp. (*) Chatetoceros spp Psuedo-nitzschia spp (* MI) Rhizosolenia setigera (*@ MI) Chaetoceros danius Leptocylindricus minimus Melosira spp Notes: Notes:
Total Diatom diversity (all stations-all collections) - 27 species Total Dino diversity (all stations-all collections) - 19 species (MI) = Total Diatom diversity at MI station, incoming – 11 species
(MI) = Dino diversity at MI station, incoming – 10 species
(*) = most common diatoms (ID 3 or more times) excluding MI incoming – 14 species
(*) = most common dino (ID 3 or more times) excluding MI incoming – 4 species
(@) = most common diatoms (ID 3 or more times ) at MI upon incoming tide - 5 species
(@) = most common dino (ID 3 or more times ) at MI upon incoming tide. 3 species
FIRE ISLAND INLET TO MONTAUK POINT REFORMULATION STUDY
December 2004 - 29 - 2003 Hard Clam Growth Rate Study Final Summary Report
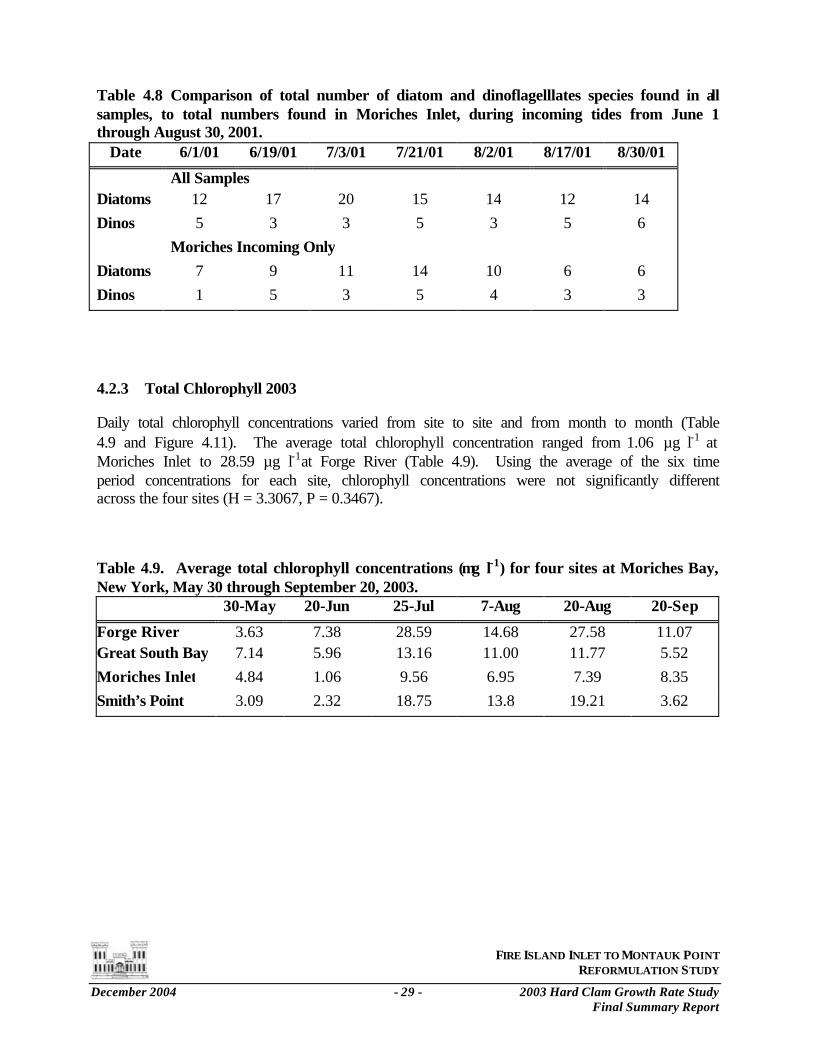
Table 4.8 Comparison of total number of diatom and dinoflagelllates species found in all samples, to total numbers found in Moriches Inlet, during incoming tides from June 1 through August 30, 2001.
Date 6/1/01 6/19/01 7/3/01 7/21/01 8/2/01 8/17/01 8/30/01
All Samples Diatoms 12 17 20 15 14 12 14 Dinos 5 3 3 5 3 5 6 Moriches Incoming Only Diatoms 7 9 11 14 10 6 6 Dinos 1 5 3 5 4 3 3
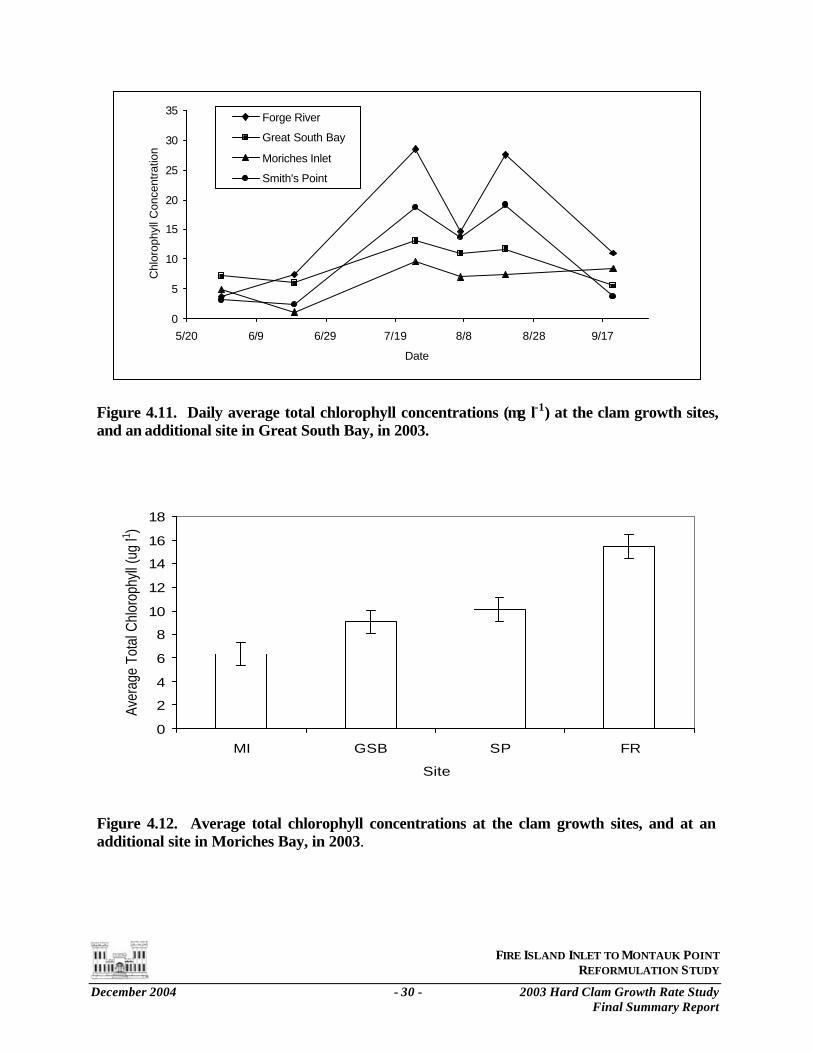
4.2.3 Total Chlorophyll 2003
Daily total chlorophyll concentrations varied from site to site and from month to month (Table 4.9 and Figure 4.11). The average total chlorophyll concentration ranged from 1.06 µg l-1 at Moriches Inlet to 28.59 µg l-1at Forge River (Table 4.9). Using the average of the six time period concentrations for each site, chlorophyll concentrations were not significantly different across the four sites (H = 3.3067, P = 0.3467).
Table 4.9. Average total chlorophyll concentrations (µg l-1) for four sites at Moriches Bay, New York, May 30 through September 20, 2003. 30-May 20-Jun 25-Jul 7-Aug 20-Aug 20-Sep
Forge River 3.63 7.38 28.59 14.68 27.58 11.07 Great South Bay 7.14 5.96 13.16 11.00 11.77 5.52 Moriches Inlet 4.84 1.06 9.56 6.95 7.39 8.35 Smith’s Point 3.09 2.32 18.75 13.8 19.21 3.62
FIRE ISLAND INLET TO MONTAUK POINT REFORMULATION STUDY
December 2004 - 30 - 2003 Hard Clam Growth Rate Study Final Summary Report
0
5
10
15
20
25
30
35
5/20 6/9 6/29 7/19 8/8 8/28 9/17
Date
Chl
orop
hyll
Con
cent
ratio
n
Forge River
Great South Bay
Moriches Inlet
Smith's Point
Figure 4.11. Daily average total chlorophyll concentrations (µg l-1) at the clam growth sites, and an additional site in Great South Bay, in 2003.
0
2
4
6
8
10
12
14
16
18
MI GSB SP FR
Site
Aver
age
Tota
l Chl
orop
hyll
(ug
l-1)
Figure 4.12. Average total chlorophyll concentrations at the clam growth sites, and at an additional site in Moriches Bay, in 2003.
FIRE ISLAND INLET TO MONTAUK POINT REFORMULATION STUDY
December 2004 - 31 - 2003 Hard Clam Growth Rate Study Final Summary Report
4.3 WATER QUALITY
4.3.1 Temperature
Water temperature during this study corresponded to expected seasonal changes for a shallow coastal lagoon found in the New York Bight area. As would be expected temperature increased as the summer months approached, and peaked in late summer (late August to mid September). During the 2001 study, the water temperature peaked during August, with GSB recording the highest mean temperature on August 16
th of 25.6oC. Table 4.10 shows the seasonal (average for the entire study period @ June 15 – Oct 1) at each grow out station for each year. Two important trends are revealed in the table: first, temperatures at each site between years were quite similar; and, second, average temperature increased as distance increased from the inlet.
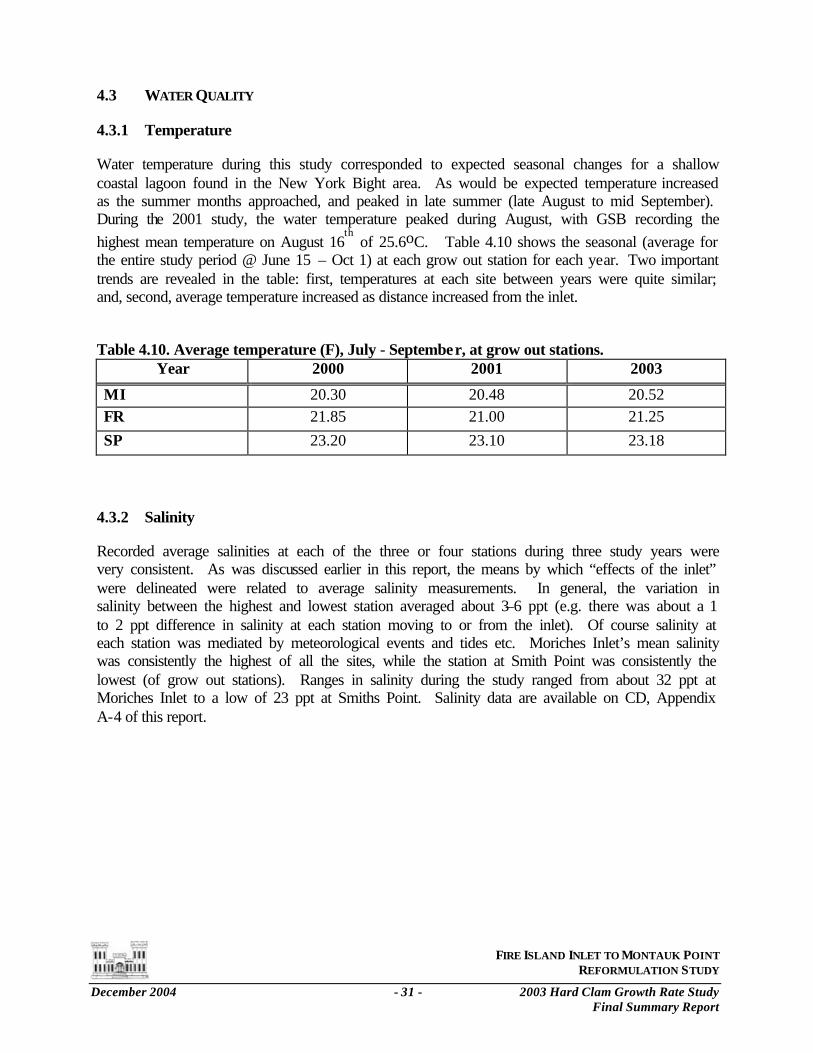
Table 4.10. Average temperature (F), July - September, at grow out stations.
Year 2000 2001 2003
MI 20.30 20.48 20.52 FR 21.85 21.00 21.25 SP 23.20 23.10 23.18
4.3.2 Salinity
Recorded average salinities at each of the three or four stations during three study years were very consistent. As was discussed earlier in this report, the means by which “effects of the inlet” were delineated were related to average salinity measurements. In general, the variation in salinity between the highest and lowest station averaged about 3–6 ppt (e.g. there was about a 1 to 2 ppt difference in salinity at each station moving to or from the inlet). Of course salinity at each station was mediated by meteorological events and tides etc. Moriches Inlet’s mean salinity was consistently the highest of all the sites, while the station at Smith Point was consistently the lowest (of grow out stations). Ranges in salinity during the study ranged from about 32 ppt at Moriches Inlet to a low of 23 ppt at Smiths Point. Salinity data are available on CD, Appendix A-4 of this report.
FIRE ISLAND INLET TO MONTAUK POINT REFORMULATION STUDY
December 2004 - 32 - 2003 Hard Clam Growth Rate Study Final Summary Report
4.3.3 Dissolved Oxygen
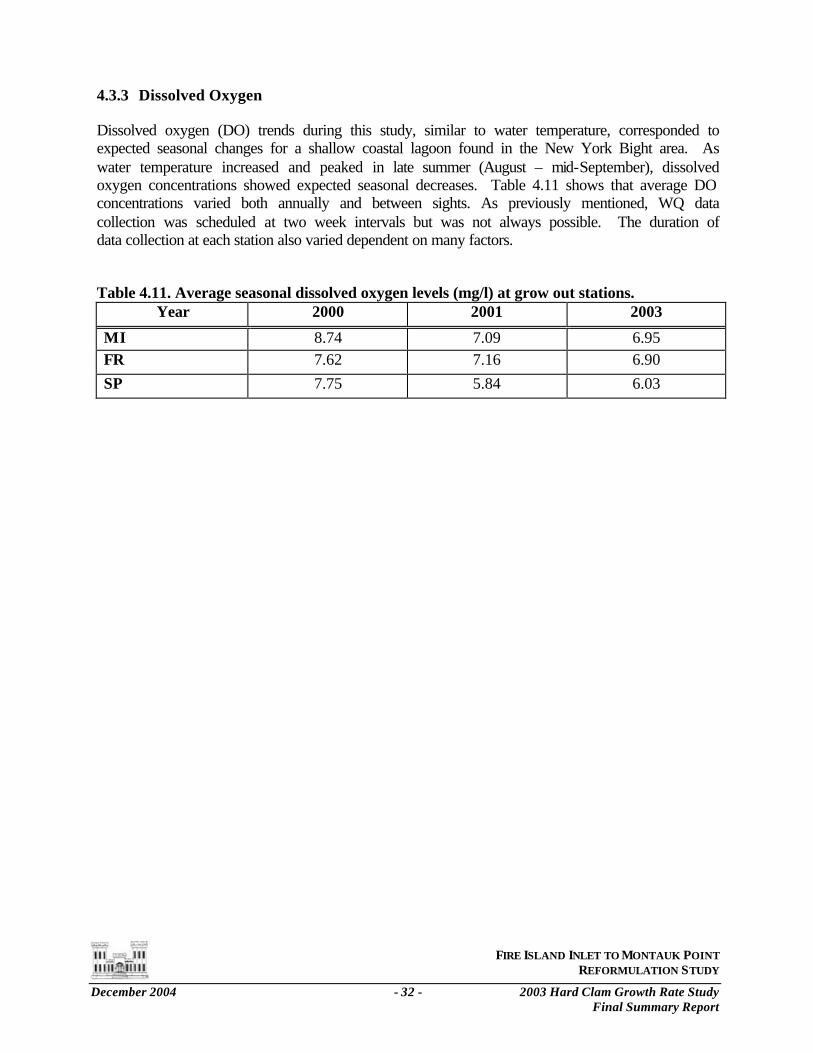
Dissolved oxygen (DO) trends during this study, similar to water temperature, corresponded to expected seasonal changes for a shallow coastal lagoon found in the New York Bight area. As water temperature increased and peaked in late summer (August – mid-September), dissolved oxygen concentrations showed expected seasonal decreases. Table 4.11 shows that average DO concentrations varied both annually and between sights. As previously mentioned, WQ data collection was scheduled at two week intervals but was not always possible. The duration of data collection at each station also varied dependent on many factors.
Table 4.11. Average seasonal dissolved oxygen levels (mg/l) at grow out stations. Year 2000 2001 2003
MI 8.74 7.09 6.95 FR 7.62 7.16 6.90 SP 7.75 5.84 6.03
FIRE ISLAND INLET TO MONTAUK POINT REFORMULATION STUDY
December 2004 - 33 - 2003 Hard Clam Growth Rate Study Final Summary Report
5.0 DISCUSSION
Clam shell growth rates were very good at all stations during 2001 and much reduced in 2003. But, as stated previously, the relative rates were different year to year due to the different average starting size of the clams at the start of each study. Clams at Forge River showed significantly higher growth than either Moriches Inlet or Smiths Point during both years. Examination of the data for 2001 revealed some trends describing the growth at each station. Figure 4.4 shows that at all three stations the hard clams in the study were adding shell material at a higher rate at the beginning of the season than at the end of the grow out period. Forge River clearly started out at the highest rate. Smiths Point started out at a significantly lower rate of shell growth, but the rate of change (decrease) in shell growth appears to be about the same as that of Forge River. The slope of the lines representing growth rate for Forge River and Smiths Point are almost identical. Shell length increase at Moriches Inlet started out at a rate a little lower than that of Smiths point but over the course of the study the rate decreased only slightly, displaying a much more constant rate of shell growth. This growth pattern was not evident in 2003 data.
Figure 4.3 displays the calculated average daily increase in tissue weight in grams per day. Interestingly this figure shows that tissue growth rates increase from June through October. This occurred at all three stations and intuitively makes sense. The clams need to provide space for the tissue to grow into. In Figure 4.4 Forge River and Moriches Inlet display a parallel change in rate of increase for tissue growth, albeit the Forge River clams rates throughout the study were significantly higher that either the Inlet or Smiths Point. The clams at Smith Point started off at about the same rate of tissue growth as Moriches Inlet but the rate did not increase like that of both Moriches Inlet and Forge River. As mentioned previously, shell growth rates of the 2003 clams were relatively slow compared to those of 2001. However, examination of the tissue data shows that the (smaller) clams from 2001 only gained about 0.1 to 0.15 grams of tissue weight over the course of a growing season that showed a doubling and in some cases almost a tripling in shell length. Shell growth in 2003 was much less, but, tissue weight increased from about 0.25 to 0.5 grams. The most interesting observation involving tissue growth in 2003, is that the measurement taken at the hottest point of the season (Table 4.6 August 21) revealed that the clams at the Smith Point station had begun to loose weight. However by October (and cooling of the water) Smiths point had regained weight and added about 0.15 grams from the starting point. The other two stations, Forge River and Moriches Inlet showed a steady increase in weight throughout the growing season.
Analysis of environmental factors such as temperature, salinity and phytoplankton parameters revealed that all these factors can vary significantly within a relatively small area. In this study, food supply and temperature appear to be strongly affecting clam growth, with temperature being the most influential parameter. In areas where phytoplankton was “abundant” (FR>SP> MI), the growth rates started at, and maintained, higher levels as long as water temperature was moderated. Forge River had the greatest supply of chlorophyll and the clams showed the greatest growth (shell length and tissue weight) because temperature was moderated by its proximity to the Inlet. Moriches Inlet had a significantly lower average level of chlorophyll than Forge River and Smiths Point, but even at these lower concentrations of phytoplankton, clams maintained a “good” growth rate. Temperature seems to be the key factor in the slow increase
FIRE ISLAND INLET TO MONTAUK POINT REFORMULATION STUDY
December 2004 - 34 - 2003 Hard Clam Growth Rate Study Final Summary Report
of tissue growth at Smiths Point. As stated earlier, 23 oC is about the ceiling for optimal clam growth. Although average temperature at Smiths Point was about 23 oC, water temperatures during the summer ranged up to about 27 oC. Although DO levels measured during all three years of this study were well above acceptable standards, 2003 which recorded the warmest water temperatures also recorded the lowest average DO.
Hard clam growth results in 2001 and 2003 were very different than those that were observed at the conclusion of the first year (2000) of this study (USACE 2001). Mean growth (length) appeared to be only on the order of 1 to 3 mm, at all of the stations and it follows that there were no significant differences among stations. The observed “slow” rate of growth in 2000 was likely an artifact of restarting the experiment in mid-summer with relatively larger and older clams, which was all that was available. Spring and early summer season appears to be an important “starter” period for hard clams and it was entirely lost for this second try in 2000. Another aspect, which probably factored into the observed slow growth rates, was the placement of the cages on the bottom.
During 2001 and 2003, the clams were raised off the bottom in order to decrease predation, keep the cages cleaner between scheduled maintenance, and reduce any difference in growth due to bottom type. As mentioned earlier, results from 2000 may have also been influenced by several factors relating to placing the cages directly on the bottom. One factor relates to the probability that circulation through the cages was reduced by having the bottom blocked off as well as the increased likelihood of having the sides partially clogged by debris moving along the bottom. A second possibility is related to a hypothesis suggested by several investigators studying the decline of shellfish in estuaries that clam growth and survival have been heavily impacted by development that may be responsible for a significant increase in near bottom suspended sediments. An increase in suspended sediment could affect several aspects of the hard clam’s metabolism.
To investigate any difference in clam growth that might occur in relationship to cage position the 2003 cages at each station were deployed at the bottom and suspended as in 2001. As seen in Figure 4.8, there was a distinct difference in clam shell growth rates between the top and bottom cages. The shell length growth ranged from 2.06–8.11 mm in the top cages and 1.64–5.28 mm in the bottom cages. However, no distinct differences in dry weights between top and bottom cages were detected. These results suggest that shell formation was affected differently than tissue growth. The 2003 study may indicate that clam growth may be affected by an existing microclimate present at the substrate level of the bay and further studies would be necessary to test this theory. Examination of Figure 4.7, a comparison of percent shell growth between 2001 and 2003, shows that the ratio of shell growth from station to station between years is very similar despite the obvious differences in absolute growth observed.
Phytoplankton enumeration and identification did not reveal any significant inputs of “high quality species” coming through Moriches Inlet during flood tide. Analysis of the data revealed that species commonly found at Moriches during incoming tide were widespread throughout Moriches Bay and in most cases were more abundant at the other stations. In general, chlorophyll values at the inlet during flood tide were almost always significantly lower than at the other stations.
FIRE ISLAND INLET TO MONTAUK POINT REFORMULATION STUDY
December 2004 - 35 - 2003 Hard Clam Growth Rate Study Final Summary Report
In 2001 the Forge River station routinely had the highest chlorophyll levels and this often included the greatest abundance of small forms. The Forge River area was utilized heavily during the peak of Long Island’s duck farming activities and at present the area is used by large number of waterfowl including a large population of swans. The flow of the river is not very strong and the bottom is covered consists of black organic ooze, and ulva is usually present in great abundance. Based on field observations of Forge River’s general characteristics, including sediment type and potential for harboring small form algal species, this site would not appear to be a favorable environment for a population of naturally occurring hard clams. However, for suspended caged clams, this station showed significantly higher growth rates than either Moriches or Smiths Point during 2001 and 2003.
FIRE ISLAND INLET TO MONTAUK POINT REFORMULATION STUDY
December 2004 - 36 - 2003 Hard Clam Growth Rate Study Final Summary Report
6.0 CLOSING REMARKS
The impetus for developing and executing this study was to ascertain what influence a breach through one of Long Island’s barrier islands might have on the hard clams inhabiting the barrier island bay. In general, this was defined to mean how a breach influences growth rate (and survivability). Within the framework of what is known of present day environmental conditions in Long Island south shore bays specific questions came to mind. The questions included the following: First, does a breach provide an abundant source of “desirable” phytoplankton in comparison to what is found within a bay, especially taking into account the brown tide, a small form algae that was thought to have contributed to the recent decline of local hard clam populations? Secondly, how may a breach influence the physical water quality parameters (especially dissolved oxygen and temperature), as these factors are also known to strongly influence the hard clams physiology and growth?
Observations from all three years of the study confirmed that the presence of predators (crabs and starfish) was significantly greater at the “breach” than at the more estuarine stations. This was very apparent during the first season (2000), which started off with larger mesh cages that resulted in much more predation at the inlet site (USACE 2001). During 2001 and 2003, the presence of predators on and sometimes within the cages was always greater at the inlet station. The observed results are in agreement with the previously referenced literature, which indicated that predation upon seed and juvenile clams within proximity of the inlet or a breach would likely be very high.
From the results of the phytoplankton analysis, it does not appear that a breach would act as a significant source of advantageous algal species in either abundance or diversity. Samples from the bay stations consistently showed greater abundance, diversity and biomass than samples from the Inlet station, even after the small forms were removed. With regards to the question of how the brown tide may influence clam physiology and growth, the most recent consensus (personal communication from Dr. Robert Cerrato, Stony Brook Marine Science Research Center) is that under otherwise “average” conditions, presence of high concentrations of brown tide does not appear to have a negative impact to Mercinaria. This observation appears to hold true in this study, as the Forge River stations consistently showed the greatest growth rates even though small form counts were high. However, the increased turbidity of the water due to algal blooms is likely to facilitate the absorption of solar energy exacerbating high temperatures in shallow water bodies.
Analysis of the growth rates and water quality data confirmed that clam growth declined once temperature goes beyond optimal conditions. In general this would also tend to lower the D.O, and could exacerbate any negative effects on growth. High water temperature impacts were apparent at the Smiths Point station and appear to have had the greatest effect during 2003. The study also showed that under the right conditions, a breach can favorably moderate temperatures resulting in excellent growth rates within a localized area, the extent of which would directly related to such factors as the size of the breach, bathymetry, geographic features of the shoreline and other features.
FIRE ISLAND INLET TO MONTAUK POINT REFORMULATION STUDY
December 2004 - 37 - 2003 Hard Clam Growth Rate Study Final Summary Report
7.0 LITERATURE CITED
Ansell, A.D. 1968, 1976b. The rate of growth of the hard clam Mercenaria mercenaria (L.) throughout the geographical range. J. Cons. Int. Explor. Mer 31:364-409.
Hamwi, A. 1969. Oxygen consumption and pumping rate of the hard clam Mercenaria mercenaria L. Ph.D. Dissertation. Rutgers University, New Brunswisck, N.J. 185pp.
Haskin, H.H. 1950. Growth studies on the Quahaug, Venus mercenaria. Proc. Natl. Sellfish. Assoc. 40:67-75
Haskin, H.H. 1952. Further studies on the quahaug, Venus mercenaria. Proc. Natl. Shellfish. Assoc. 42:181-187
Kraeuter, J.N., and M. Castagna. 1980. Effects of Large Predators on the Field Culture of the Hard Clam, Mercenaria mercenaria. U.S. National Marine Fisheries Service, Fisheries Bulletin 78(2). 538-541pp
MacKenzie, C.L., Jr. 1977. Predation on hard Clam Mercenaria mercenaria populations. Trans. Am. Fish. Soc. 106(6) 530-537pp
MacKenzie, C.L., Jr. 1979. Relation of Biological and Environmental Factors to Soft-shell and Hard Shell Clam Management. Proceedings of the Northeast Clam Industries: Management for the Future. Sea Grant Extension Advisory Program, Univ. of Mass. And M.I.T. Sea Grant Program SP-112. 67-78pp
Menzel, R.W. 1963. Seasonal growth of northern quahog, Mercenaria mercenaaria and the southern quahog, M. capechiensis, in Alligator Harbor, Florida. Proc. Natl. Shellfish. Assoc. 52:37-46.
New York State Dept. of Health, Div. Of Pure Water, 1966. Report on Water Quality, Moriches Bay and the Eastern Section of Great South Bay, Long Island, New York. Albany, New York. 750pp
Pratt, D.M. and D.A. Campbell. 1956. Environmental Factors Affecting Growth in Venus merenaria. Limnology and Oceanography Bulletin 1(1). 2-17pp
Rice, D.M. and D.A. Campbell. 1992. A review of the factors influencing the growth of the northern quahog, Mercenaria mercenaria (Linnaeus, 1758). J. Shellfish Res. 11(2):279-287.
Ritchie, T.P. 1977. A Comprehensive Review of the Commercial Clam Industries in the United States, U.S. Natl. Mar. Fish. Serv., Delaware Sea Grant Program, College Marine Studies, Univ. Del., Newark and Lewes, Del. DEL-SG-26-76 106pp
Stanley, Jon G. 1983. Species Profiles: Life Histories and Environmental Requirements of Coastal Fishes and Invertebrates (North Atlantic) Hard Clam, U.S. Fish and Wildlife Service Report Number FWS/OBS-82/11.18 1-19pp.
FIRE ISLAND INLET TO MONTAUK POINT REFORMULATION STUDY
December 2004 - 38 - 2003 Hard Clam Growth Rate Study Final Summary Report
Turner, H.J. 1953. A review of the biology of some commercial mollusks of the east coast of North America. Sixth Rep. Invest. Shellfish Mass., Mass. Dept. Nat. Res. Div. Mar. Fish: 39-74.
Turner, Elizabeth J. 1983. Effects of a Storm-Induced Breach on Mercenaria mercenaria in Moriches Bay, Thesis- Marine Science Research Center, State University of New York, Stony Brook. 1-71pp
U.S. Army Corps of Engineers. 1995. Fire Island to Montauk Point Long Island, New York. Draft Breach Contingency Plan, Executive Summary and Draft Environmental Assessment, USACOE, NY District, North Atlantic Division. 1-32pp.
U.S. Army Corps of Engineers. 2001. Moriches Bay, 2000 Hard Clam Growth Rate Study. USACOE, NY District, North Atlantic Division. 1-32pp
Van Winkle, W., S.Y. Feng, and H.H. Haskin. 1976. Effect of temperature and salinity on extension of siphons by Mercenaria mercenaria. J. Fish. Res. Bd. Can. 33(7): 1540-1546.
Virstein, R.W. 1977. The Importance of Predation by Crabs and Fishes on Benthic Infauna in Chesapeake Bay. Ecology 58(6) 1199-1217pp
APPENDIX A
CD CONTAINING THE FOLLOWING:
A-1 2000 Hard Clam Growth Rate Study
Summary Report
A-2 Length Frequency Distribution June 15th and October 4th, 2001
A-3
Length Frequency Distribution June 20th and October 20th, 2003
A-4
Temperature and Salinity Data Study Year 2000
A-5
Phytoplankton Species List and Enumeration Study Year 2001
A-6
Phytoplankton/Chlorophyll Size Fractionation Study Year 2001
A-7
Phytoplankton/Chlorophyll Size Fractionation Study Year 2003
APPENDIX B
Temperature and Salinity Charts Study Year 2000
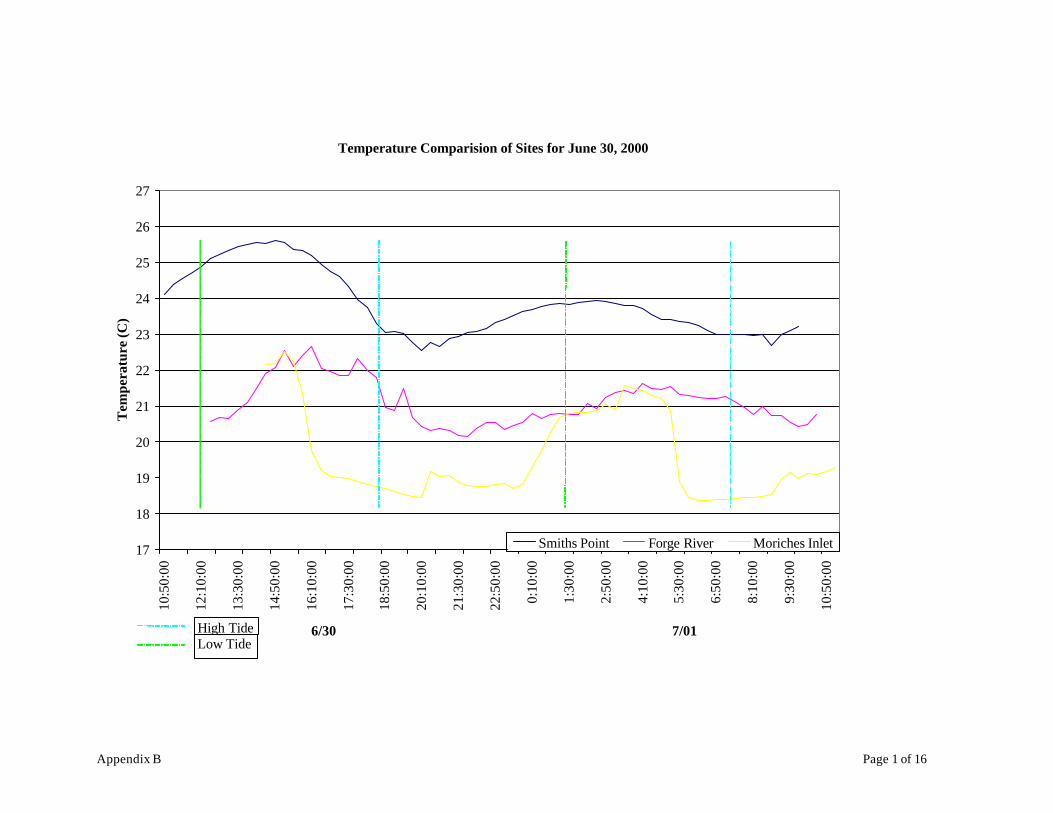
Appendix B Page 1 of 16
Temperature Comparision of Sites for June 30, 2000
17
18
19
20
21
22
23
24
25
26
27
10:5
0:00
12:1
0:00
13:3
0:00
14:5
0:00
16:1
0:00
17:3
0:00
18:5
0:00
20:1
0:00
21:3
0:00
22:5
0:00
0:10
:00
1:30
:00
2:50
:00
4:10
:00
5:30
:00
6:50
:00
8:10
:00
9:30
:00
10:5
0:00
6/30 7/01
Tem
pera
ture
(C)
Smiths Point Forge River Moriches Inlet
High TideLow Tide
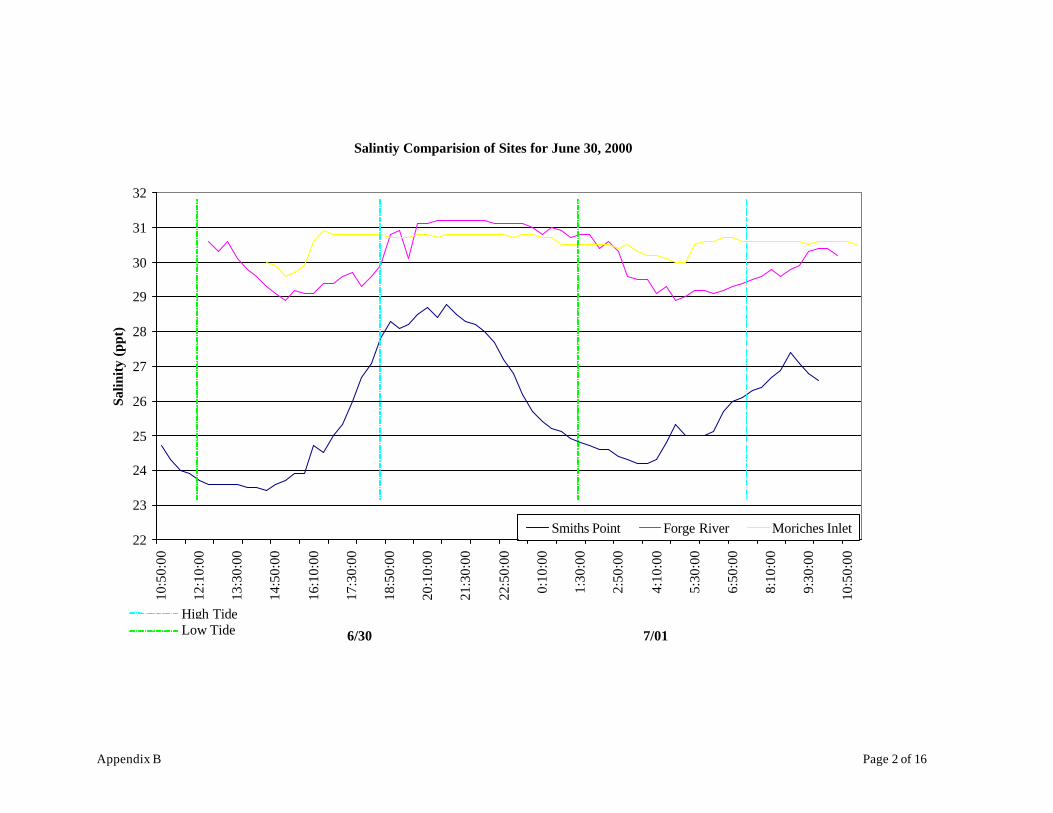
Appendix B Page 2 of 16
Salintiy Comparision of Sites for June 30, 2000
22
23
24
25
26
27
28
29
30
31
32
10:5
0:00
12:1
0:00
13:3
0:00
14:5
0:00
16:1
0:00
17:3
0:00
18:5
0:00
20:1
0:00
21:3
0:00
22:5
0:00
0:10
:00
1:30
:00
2:50
:00
4:10
:00
5:30
:00
6:50
:00
8:10
:00
9:30
:00
10:5
0:00
6/30 7/01
Salin
ity (
ppt)
Smiths Point Forge River Moriches Inlet
High TideLow Tide
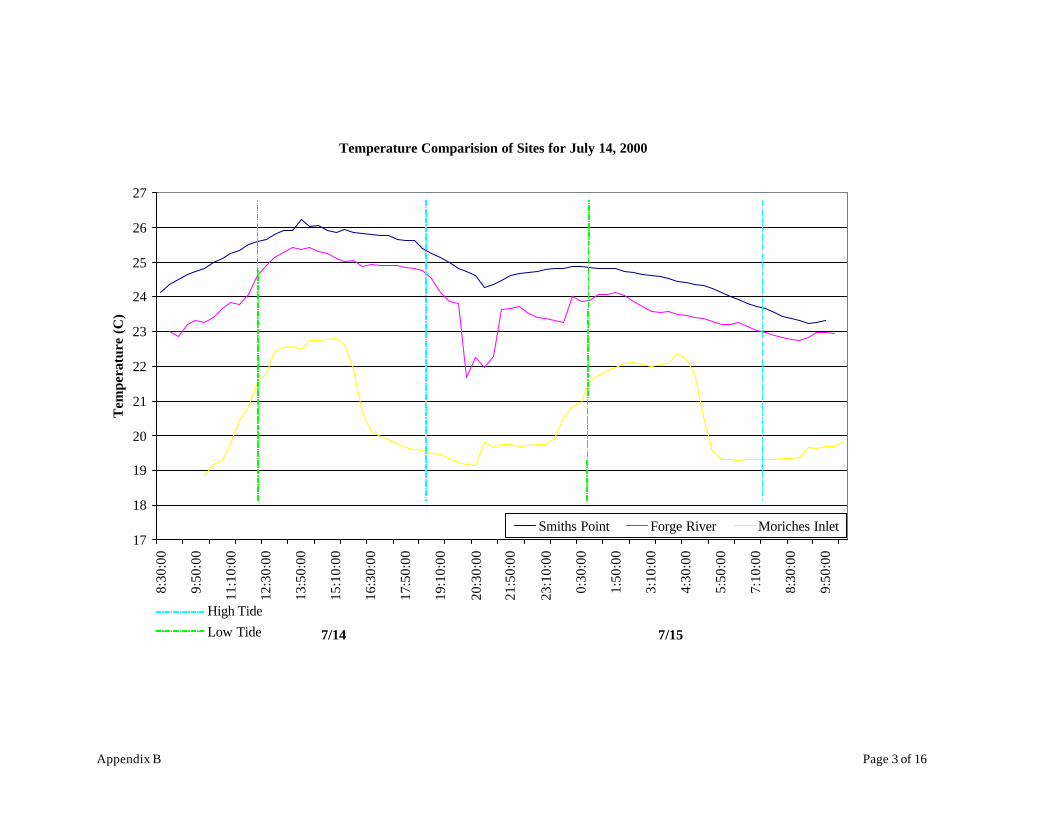
Appendix B Page 3 of 16
Temperature Comparision of Sites for July 14, 2000
17
18
19
20
21
22
23
24
25
26
27
8:30
:00
9:50
:00
11:1
0:00
12:3
0:00
13:5
0:00
15:1
0:00
16:3
0:00
17:5
0:00
19:1
0:00
20:3
0:00
21:5
0:00
23:1
0:00
0:30
:00
1:50
:00
3:10
:00
4:30
:00
5:50
:00
7:10
:00
8:30
:00
9:50
:00
7/14 7/15
Tem
pera
ture
(C
)
Smiths Point Forge River Moriches Inlet
High TideLow Tide
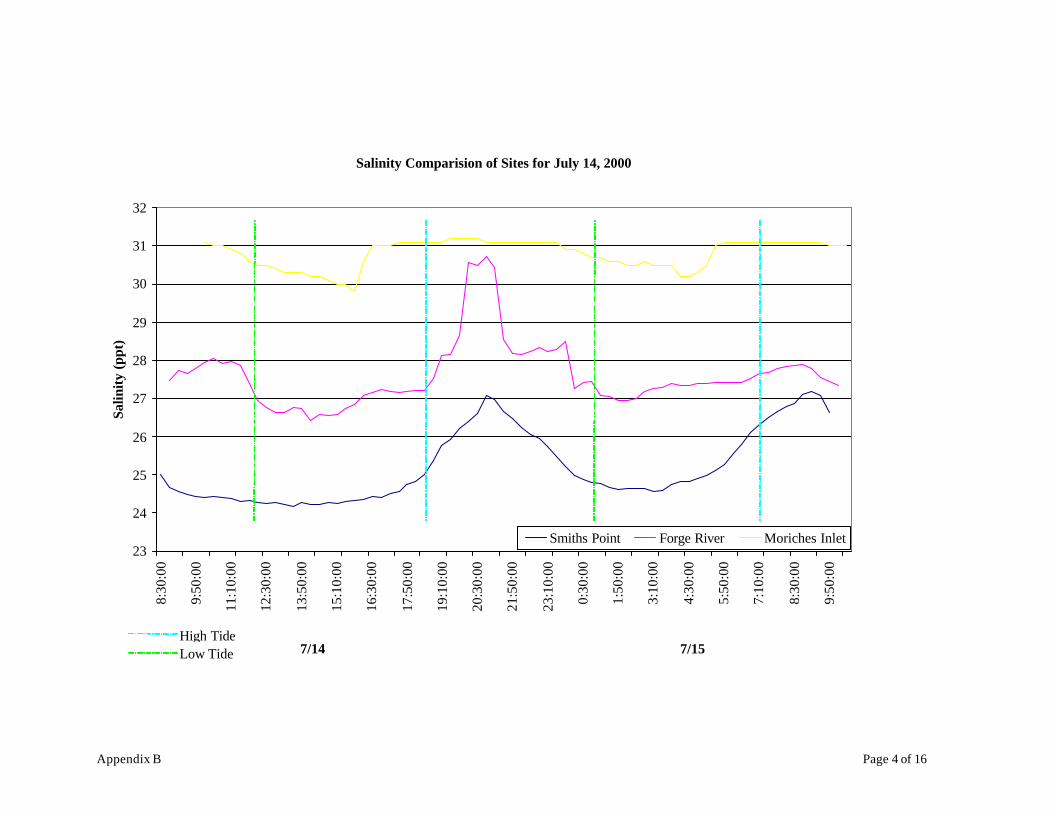
Appendix B Page 4 of 16
Salinity Comparision of Sites for July 14, 2000
23
24
25
26
27
28
29
30
31
32
8:30
:00
9:50
:00
11:1
0:00
12:3
0:00
13:5
0:00
15:1
0:00
16:3
0:00
17:5
0:00
19:1
0:00
20:3
0:00
21:5
0:00
23:1
0:00
0:30
:00
1:50
:00
3:10
:00
4:30
:00
5:50
:00
7:10
:00
8:30
:00
9:50
:00
7/14 7/15
Salin
ity (
ppt)
Smiths Point Forge River Moriches Inlet
High TideLow Tide
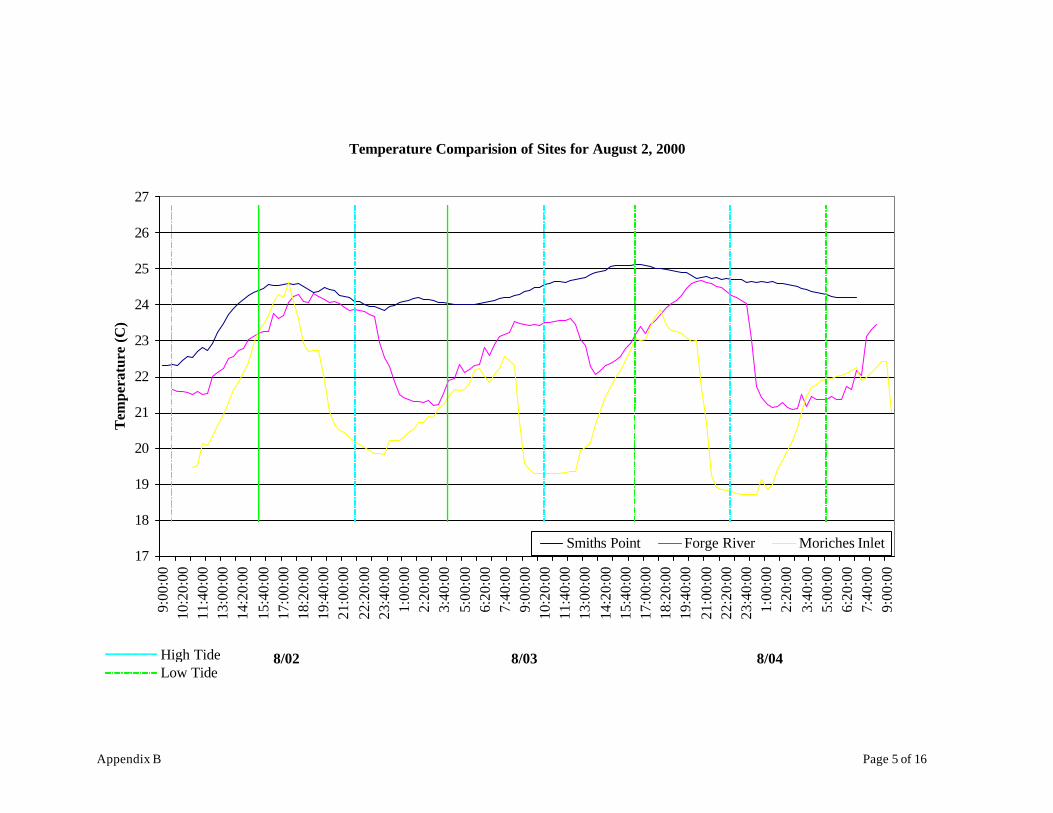
Appendix B Page 5 of 16
Temperature Comparision of Sites for August 2, 2000
17
18
19
20
21
22
23
24
25
26
27
9:00
:00
10:2
0:00
11:4
0:00
13:0
0:00
14:2
0:00
15:4
0:00
17:0
0:00
18:2
0:00
19:4
0:00
21:0
0:00
22:2
0:00
23:4
0:00
1:00
:00
2:20
:00
3:40
:00
5:00
:00
6:20
:00
7:40
:00
9:00
:00
10:2
0:00
11:4
0:00
13:0
0:00
14:2
0:00
15:4
0:00
17:0
0:00
18:2
0:00
19:4
0:00
21:0
0:00
22:2
0:00
23:4
0:00
1:00
:00
2:20
:00
3:40
:00
5:00
:00
6:20
:00
7:40
:00
9:00
:00
8/02 8/03 8/04
Tem
pera
ture
(C)
Smiths Point Forge River Moriches Inlet
High TideLow Tide
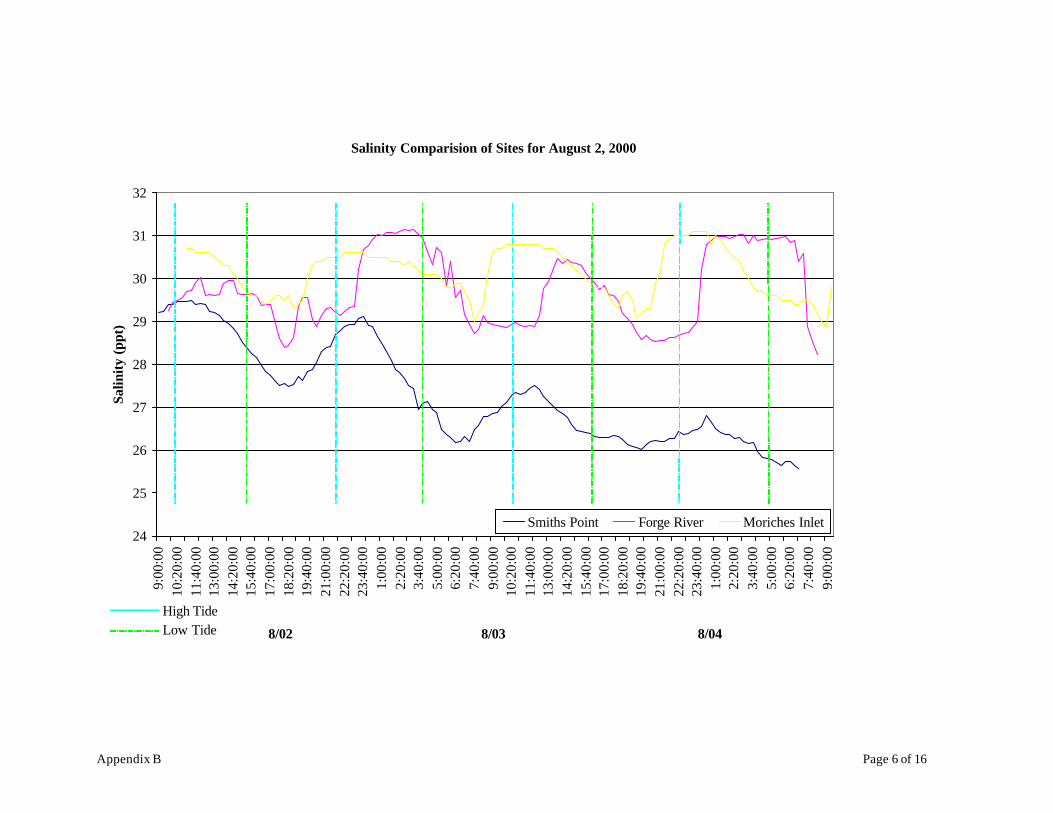
Appendix B Page 6 of 16
Salinity Comparision of Sites for August 2, 2000
24
25
26
27
28
29
30
31
32
9:00
:00
10:2
0:00
11:4
0:00
13:0
0:00
14:2
0:00
15:4
0:00
17:0
0:00
18:2
0:00
19:4
0:00
21:0
0:00
22:2
0:00
23:4
0:00
1:00
:00
2:20
:00
3:40
:00
5:00
:00
6:20
:00
7:40
:00
9:00
:00
10:2
0:00
11:4
0:00
13:0
0:00
14:2
0:00
15:4
0:00
17:0
0:00
18:2
0:00
19:4
0:00
21:0
0:00
22:2
0:00
23:4
0:00
1:00
:00
2:20
:00
3:40
:00
5:00
:00
6:20
:00
7:40
:00
9:00
:00
8/02 8/03 8/04
Salin
ity (
ppt)
Smiths Point Forge River Moriches Inlet
High TideLow Tide
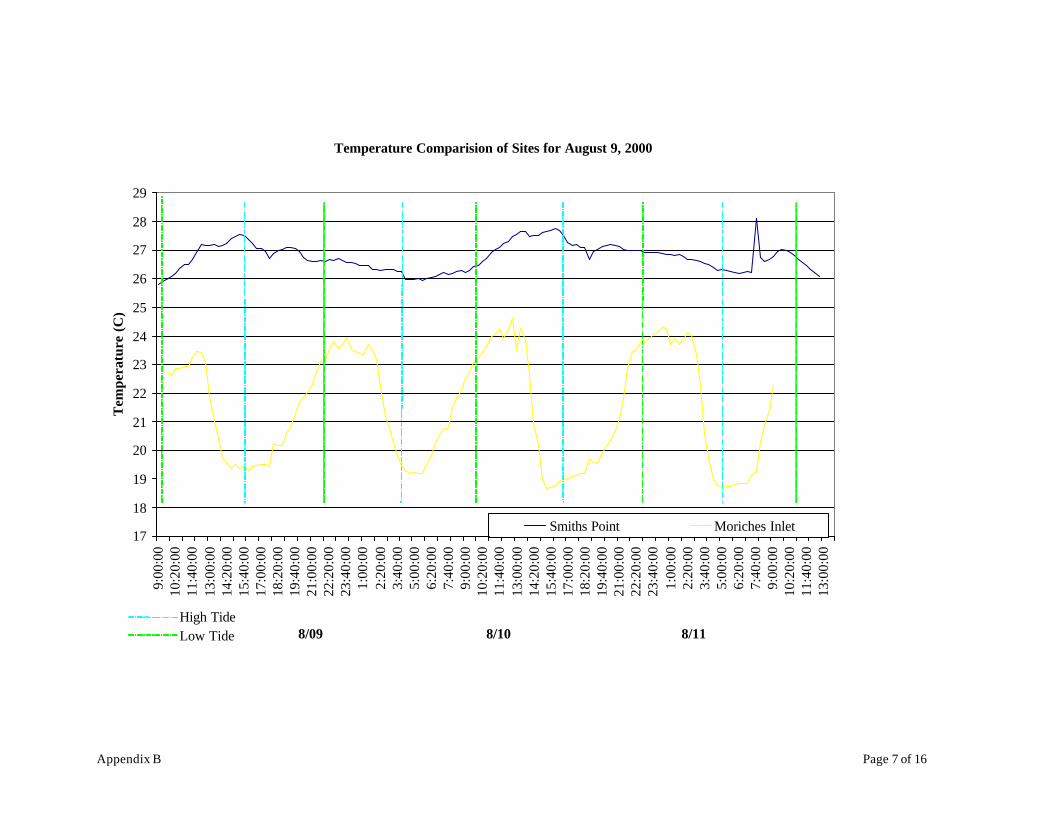
Appendix B Page 7 of 16
Temperature Comparision of Sites for August 9, 2000
17
18
19
20
21
22
23
24
25
26
27
28
29
9:00
:00
10:2
0:00
11:4
0:00
13:0
0:00
14:2
0:00
15:4
0:00
17:0
0:00
18:2
0:00
19:4
0:00
21:0
0:00
22:2
0:00
23:4
0:00
1:00
:00
2:20
:00
3:40
:00
5:00
:00
6:20
:00
7:40
:00
9:00
:00
10:2
0:00
11:4
0:00
13:0
0:00
14:2
0:00
15:4
0:00
17:0
0:00
18:2
0:00
19:4
0:00
21:0
0:00
22:2
0:00
23:4
0:00
1:00
:00
2:20
:00
3:40
:00
5:00
:00
6:20
:00
7:40
:00
9:00
:00
10:2
0:00
11:4
0:00
13:0
0:00
8/09 8/10 8/11
Tem
pera
ture
(C
)
Smiths Point Moriches Inlet
High TideLow Tide
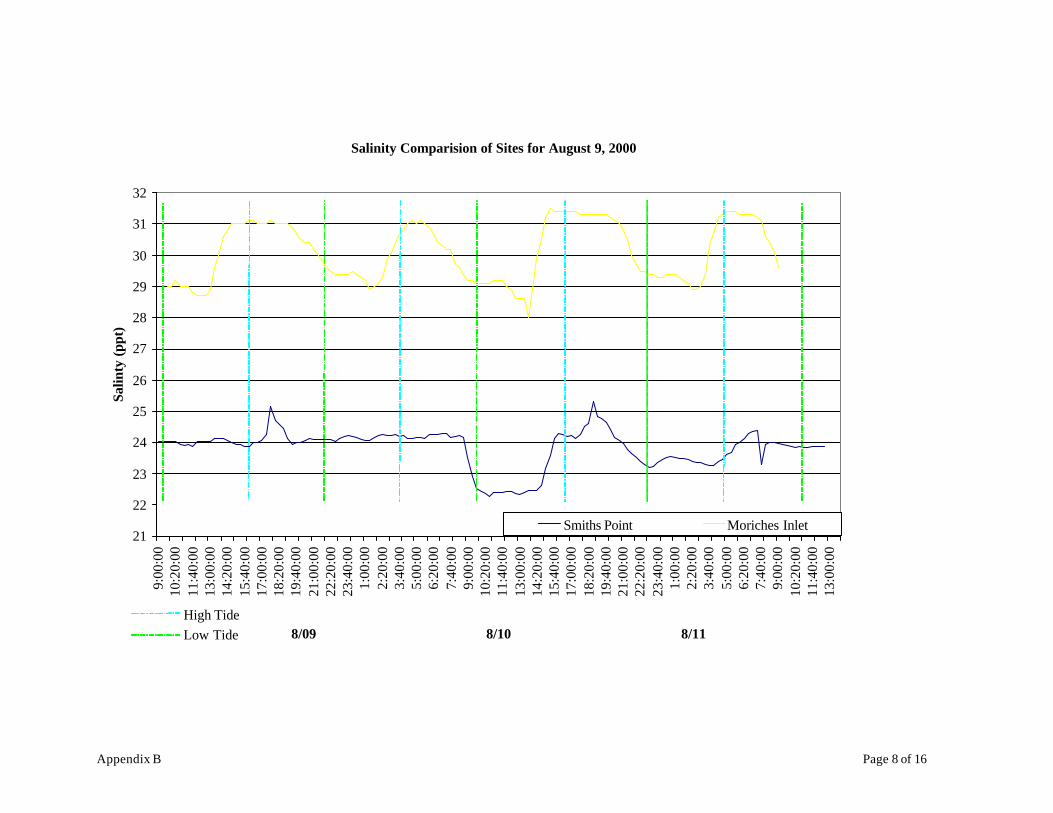
Appendix B Page 8 of 16
Salinity Comparision of Sites for August 9, 2000
21
22
23
24
25
26
27
28
29
30
31
32
9:00
:00
10:2
0:00
11:4
0:00
13:0
0:00
14:2
0:00
15:4
0:00
17:0
0:00
18:2
0:00
19:4
0:00
21:0
0:00
22:2
0:00
23:4
0:00
1:00
:00
2:20
:00
3:40
:00
5:00
:00
6:20
:00
7:40
:00
9:00
:00
10:2
0:00
11:4
0:00
13:0
0:00
14:2
0:00
15:4
0:00
17:0
0:00
18:2
0:00
19:4
0:00
21:0
0:00
22:2
0:00
23:4
0:00
1:00
:00
2:20
:00
3:40
:00
5:00
:00
6:20
:00
7:40
:00
9:00
:00
10:2
0:00
11:4
0:00
13:0
0:00
8/09 8/10 8/11
Salin
ty (
ppt)
Smiths Point Moriches Inlet
High TideLow Tide
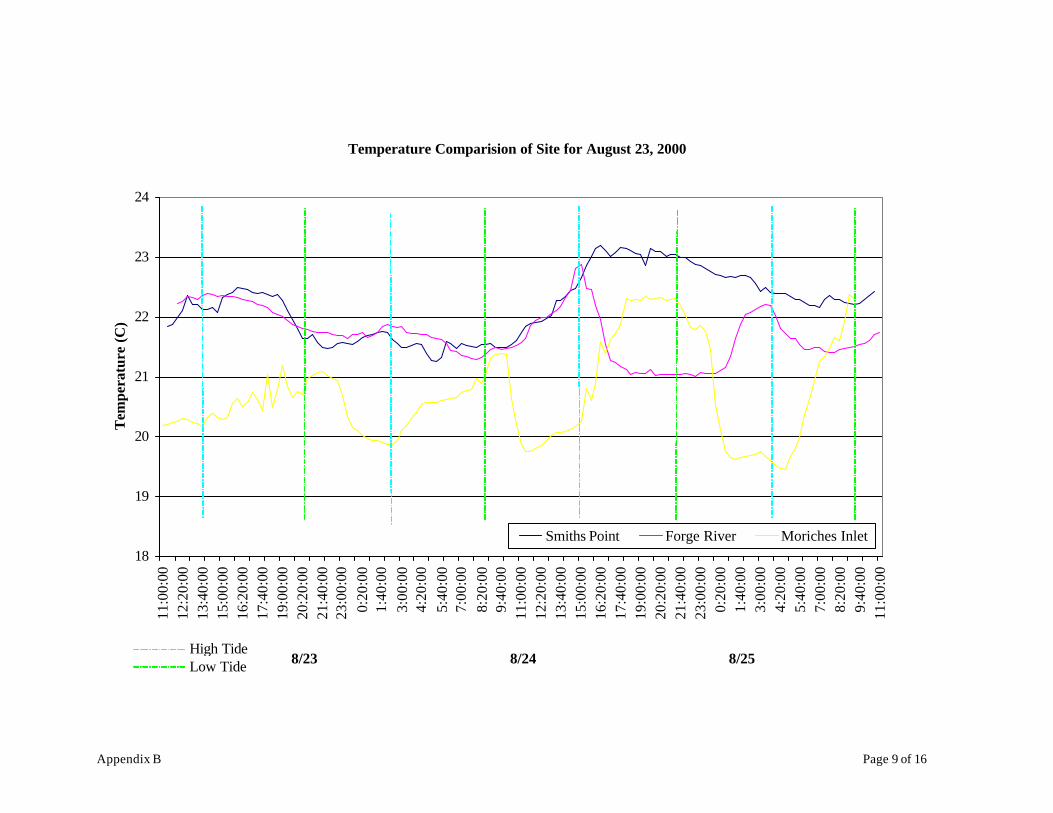
Appendix B Page 9 of 16
Temperature Comparision of Site for August 23, 2000
18
19
20
21
22
23
24
11:0
0:00
12:2
0:00
13:4
0:00
15:0
0:00
16:2
0:00
17:4
0:00
19:0
0:00
20:2
0:00
21:4
0:00
23:0
0:00
0:20
:00
1:40
:00
3:00
:00
4:20
:00
5:40
:00
7:00
:00
8:20
:00
9:40
:00
11:0
0:00
12:2
0:00
13:4
0:00
15:0
0:00
16:2
0:00
17:4
0:00
19:0
0:00
20:2
0:00
21:4
0:00
23:0
0:00
0:20
:00
1:40
:00
3:00
:00
4:20
:00
5:40
:00
7:00
:00
8:20
:00
9:40
:00
11:0
0:00
8/23 8/24 8/25
Tem
pera
ture
(C)
Smiths Point Forge River Moriches Inlet
High TideLow Tide
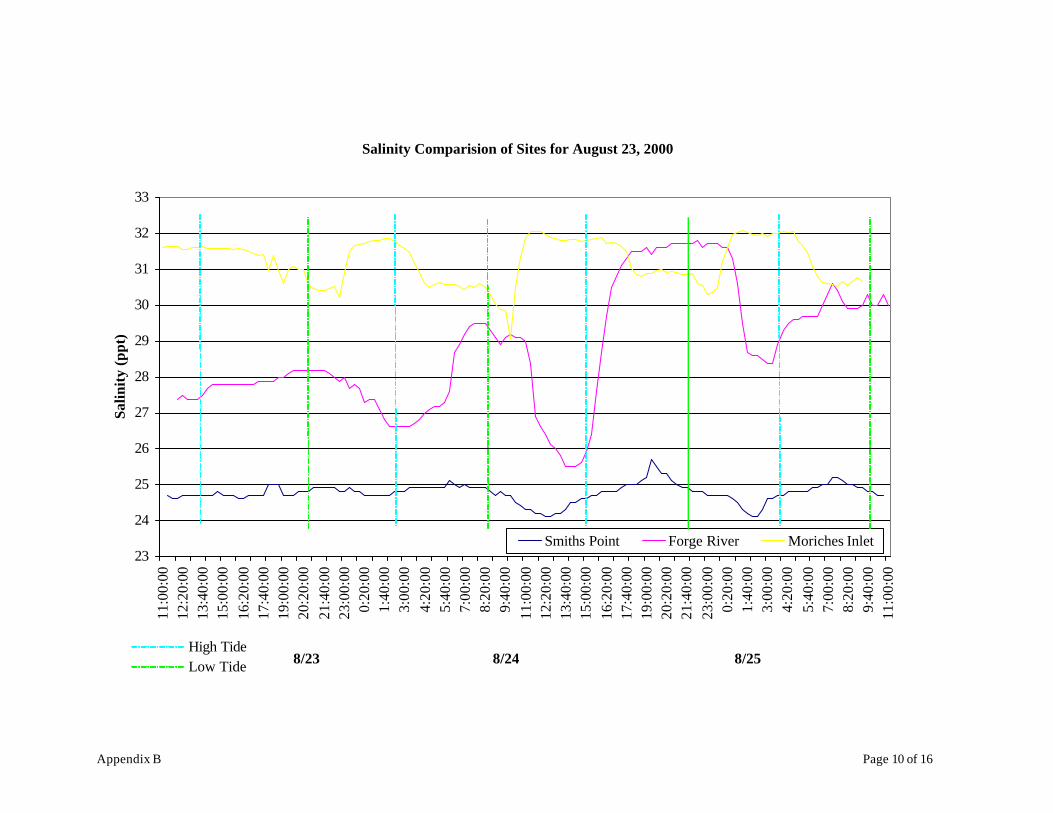
Appendix B Page 10 of 16
Salinity Comparision of Sites for August 23, 2000
23
24
25
26
27
28
29
30
31
32
33
11:0
0:00
12:2
0:00
13:4
0:00
15:0
0:00
16:2
0:00
17:4
0:00
19:0
0:00
20:2
0:00
21:4
0:00
23:0
0:00
0:20
:00
1:40
:00
3:00
:00
4:20
:00
5:40
:00
7:00
:00
8:20
:00
9:40
:00
11:0
0:00
12:2
0:00
13:4
0:00
15:0
0:00
16:2
0:00
17:4
0:00
19:0
0:00
20:2
0:00
21:4
0:00
23:0
0:00
0:20
:00
1:40
:00
3:00
:00
4:20
:00
5:40
:00
7:00
:00
8:20
:00
9:40
:00
11:0
0:00
8/23 8/24 8/25
Salin
ity
(ppt
)
Smiths Point Forge River Moriches Inlet
High TideLow Tide
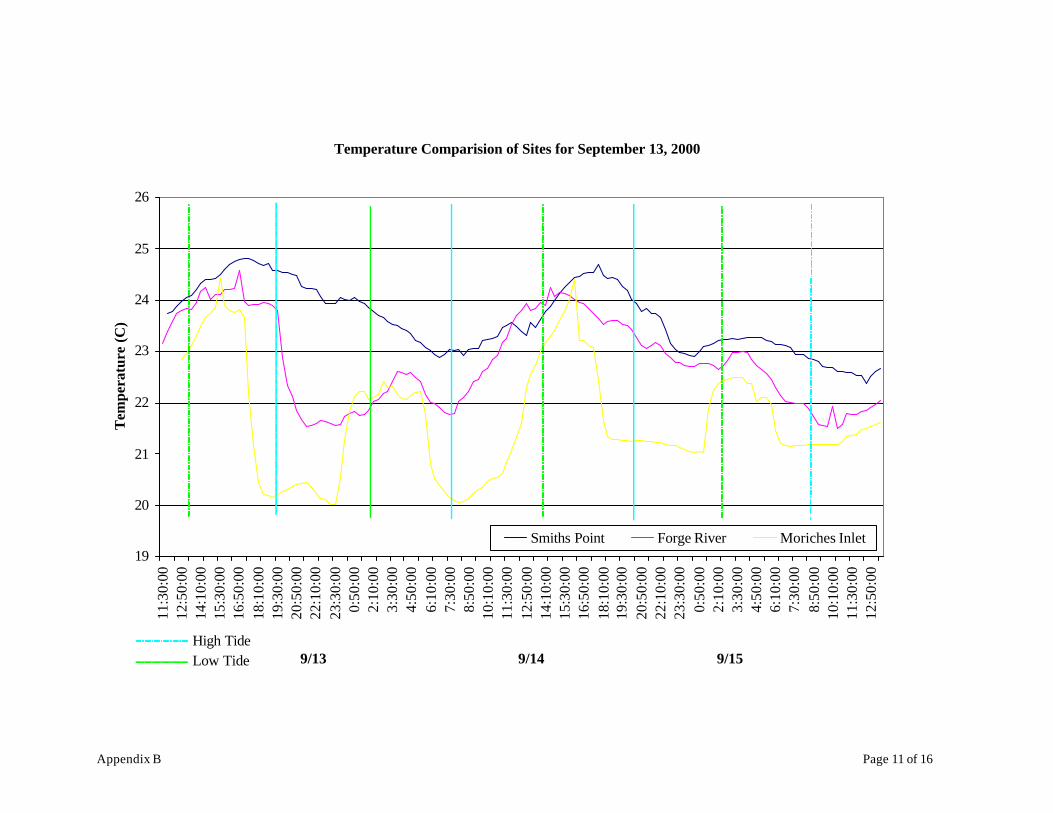
Appendix B Page 11 of 16
Temperature Comparision of Sites for September 13, 2000
19
20
21
22
23
24
25
26
11:3
0:00
12:5
0:00
14:1
0:00
15:3
0:00
16:5
0:00
18:1
0:00
19:3
0:00
20:5
0:00
22:1
0:00
23:3
0:00
0:50
:00
2:10
:00
3:30
:00
4:50
:00
6:10
:00
7:30
:00
8:50
:00
10:1
0:00
11:3
0:00
12:5
0:00
14:1
0:00
15:3
0:00
16:5
0:00
18:1
0:00
19:3
0:00
20:5
0:00
22:1
0:00
23:3
0:00
0:50
:00
2:10
:00
3:30
:00
4:50
:00
6:10
:00
7:30
:00
8:50
:00
10:1
0:00
11:3
0:00
12:5
0:00
9/13 9/14 9/15
Tem
pera
ture
(C)
Smiths Point Forge River Moriches Inlet
High TideLow Tide
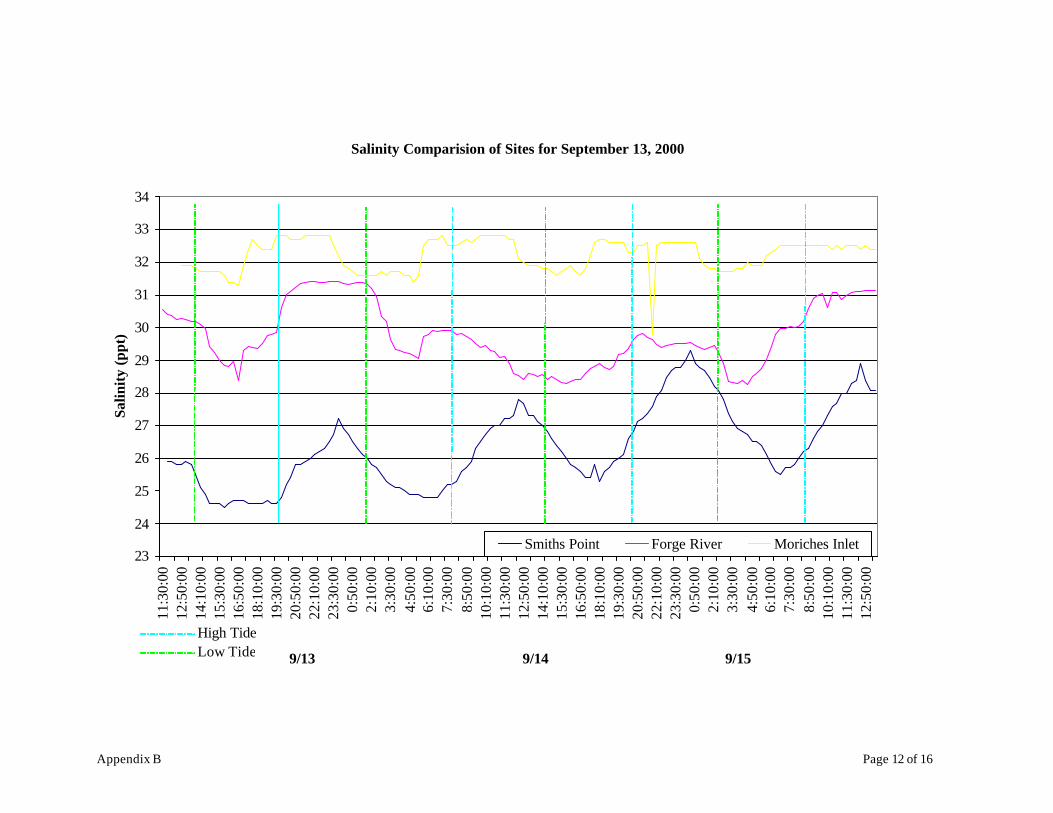
Appendix B Page 12 of 16
Salinity Comparision of Sites for September 13, 2000
23
24
25
26
27
28
29
30
31
32
33
34
11:3
0:00
12:5
0:00
14:1
0:00
15:3
0:00
16:5
0:00
18:1
0:00
19:3
0:00
20:5
0:00
22:1
0:00
23:3
0:00
0:50
:00
2:10
:00
3:30
:00
4:50
:00
6:10
:00
7:30
:00
8:50
:00
10:1
0:00
11:3
0:00
12:5
0:00
14:1
0:00
15:3
0:00
16:5
0:00
18:1
0:00
19:3
0:00
20:5
0:00
22:1
0:00
23:3
0:00
0:50
:00
2:10
:00
3:30
:00
4:50
:00
6:10
:00
7:30
:00
8:50
:00
10:1
0:00
11:3
0:00
12:5
0:00
9/13 9/14 9/15
Salin
ity
(ppt
)
Smiths Point Forge River Moriches Inlet
High TideLow Tide
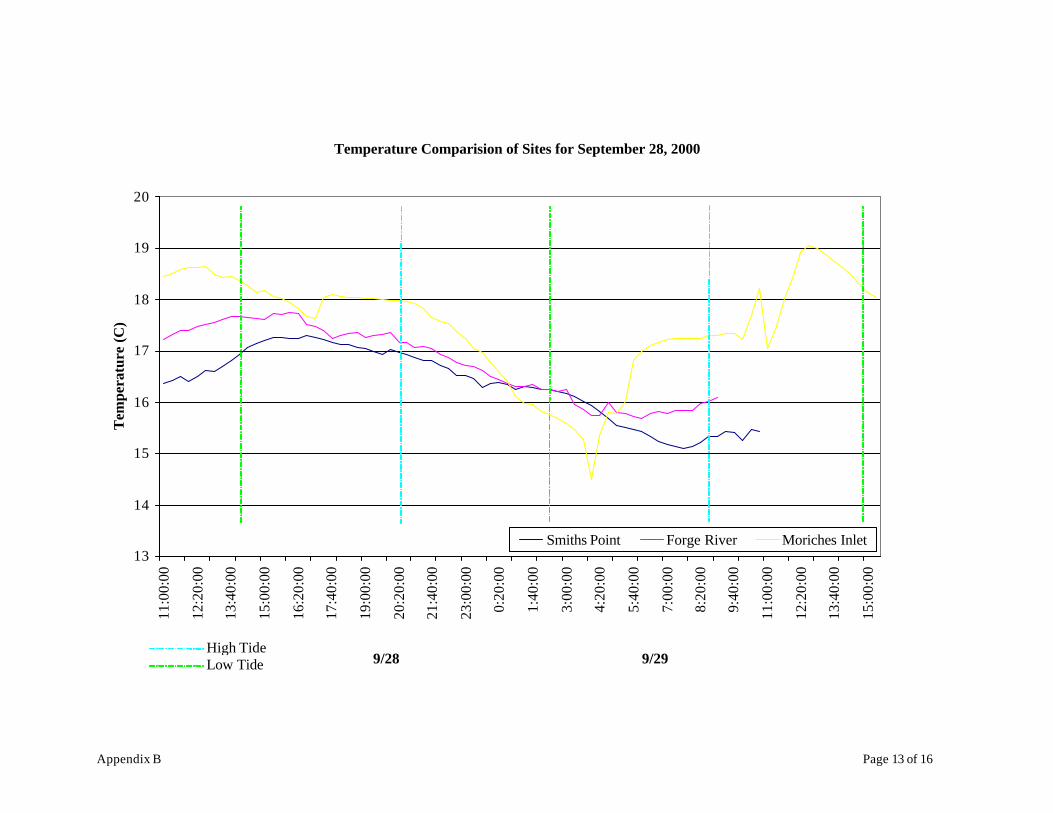
Appendix B Page 13 of 16
Temperature Comparision of Sites for September 28, 2000
13
14
15
16
17
18
19
20
11:0
0:00
12:2
0:00
13:4
0:00
15:0
0:00
16:2
0:00
17:4
0:00
19:0
0:00
20:2
0:00
21:4
0:00
23:0
0:00
0:20
:00
1:40
:00
3:00
:00
4:20
:00
5:40
:00
7:00
:00
8:20
:00
9:40
:00
11:0
0:00
12:2
0:00
13:4
0:00
15:0
0:00
9/28 9/29
Tem
pera
ture
(C)
Smiths Point Forge River Moriches Inlet
High TideLow Tide
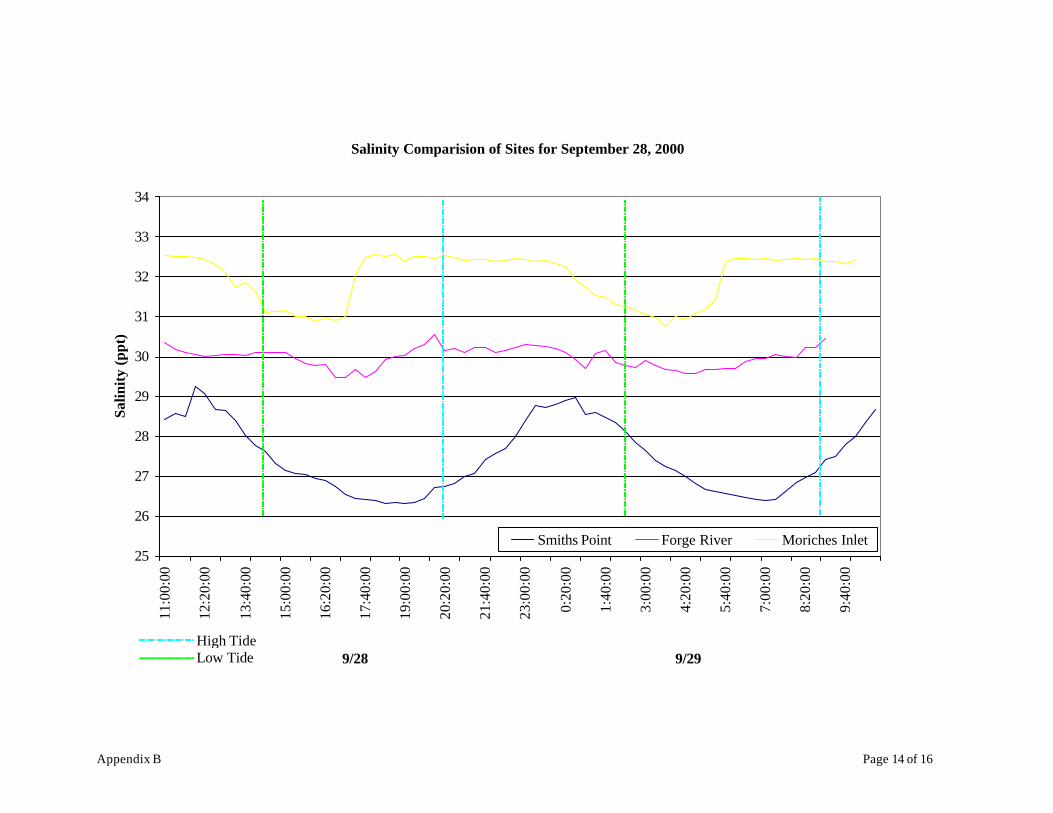
Appendix B Page 14 of 16
Salinity Comparision of Sites for September 28, 2000
25
26
27
28
29
30
31
32
33
34
11:0
0:00
12:2
0:00
13:4
0:00
15:0
0:00
16:2
0:00
17:4
0:00
19:0
0:00
20:2
0:00
21:4
0:00
23:0
0:00
0:20
:00
1:40
:00
3:00
:00
4:20
:00
5:40
:00
7:00
:00
8:20
:00
9:40
:00
9/28 9/29
Salin
ity
(ppt
)
Smiths Point Forge River Moriches Inlet
High TideLow Tide
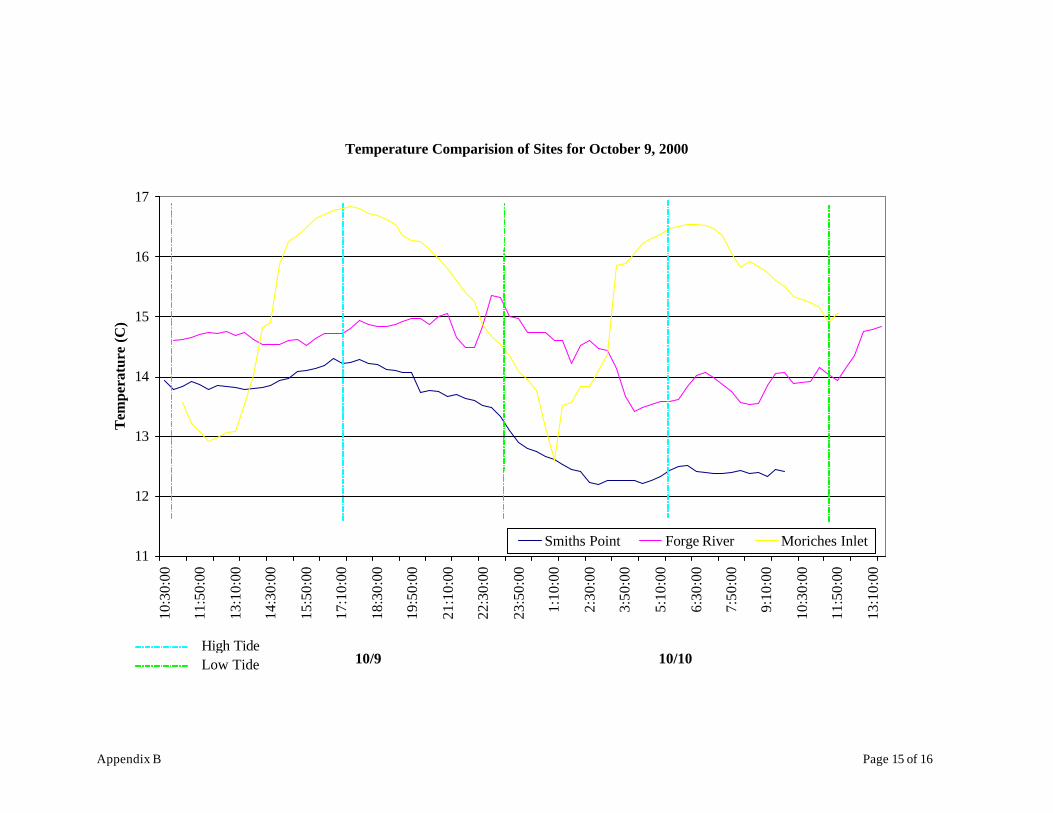
Appendix B Page 15 of 16
Temperature Comparision of Sites for October 9, 2000
11
12
13
14
15
16
17
10:3
0:00
11:5
0:00
13:1
0:00
14:3
0:00
15:5
0:00
17:1
0:00
18:3
0:00
19:5
0:00
21:1
0:00
22:3
0:00
23:5
0:00
1:10
:00
2:30
:00
3:50
:00
5:10
:00
6:30
:00
7:50
:00
9:10
:00
10:3
0:00
11:5
0:00
13:1
0:00
10/9 10/10
Tem
pera
ture
(C)
Smiths Point Forge River Moriches Inlet
High TideLow Tide
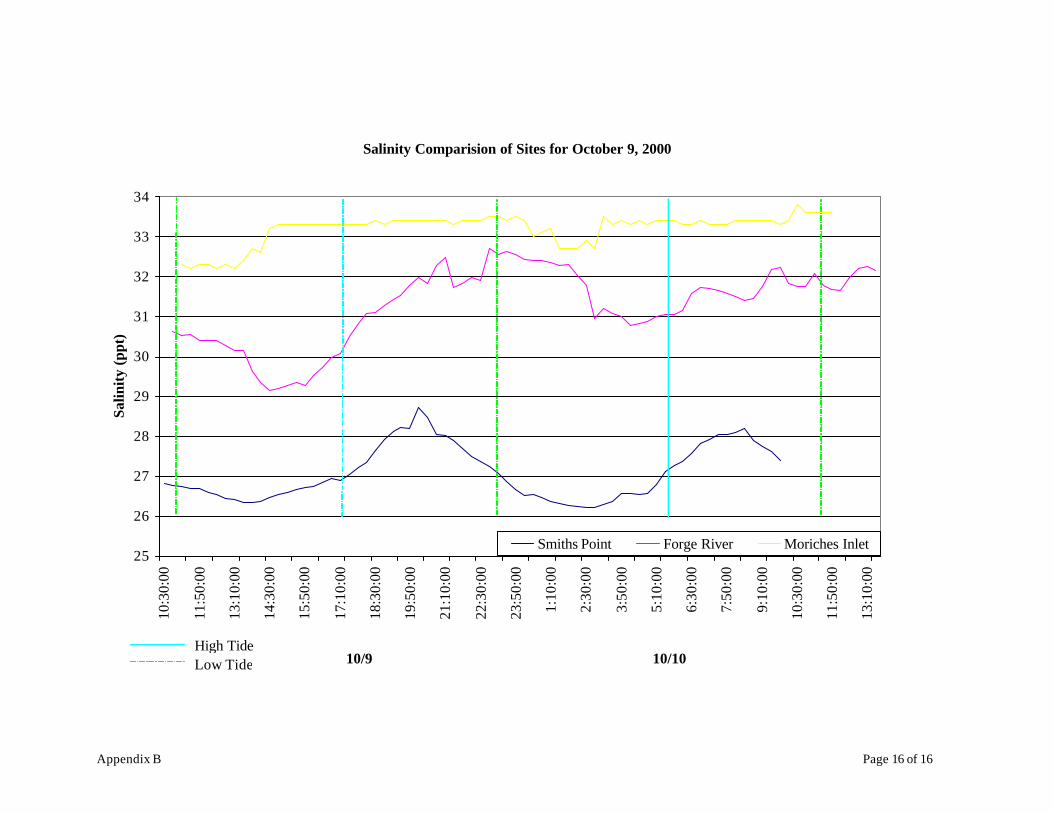
Appendix B Page 16 of 16
Salinity Comparision of Sites for October 9, 2000
25
26
27
28
29
30
31
32
33
34
10:3
0:00
11:5
0:00
13:1
0:00
14:3
0:00
15:5
0:00
17:1
0:00
18:3
0:00
19:5
0:00
21:1
0:00
22:3
0:00
23:5
0:00
1:10
:00
2:30
:00
3:50
:00
5:10
:00
6:30
:00
7:50
:00
9:10
:00
10:3
0:00
11:5
0:00
13:1
0:00
10/9 10/10
Salin
ity
(ppt
)
Smiths Point Forge River Moriches Inlet
High TideLow Tide