Embed Size (px)
Citation preview
Published in final edited form as: Yan, R., Antonietti, M., & Oschatz, M. (2018). Toward the Experimental Understanding of the Energy Storage Mechanism and Ion Dynamics in Ionic Liquid Based Supercapacitors. Advanced Energy Materials, 8(18): 1800026. doi:10.1002/aenm.201800026.
Toward the Experimental Understanding of the Energy Storage Mechanism and Ion Dynamics in
Ionic Liquid Based Supercapacitors
Runyu Yan, Markus Antonietti, Martin Oschatz
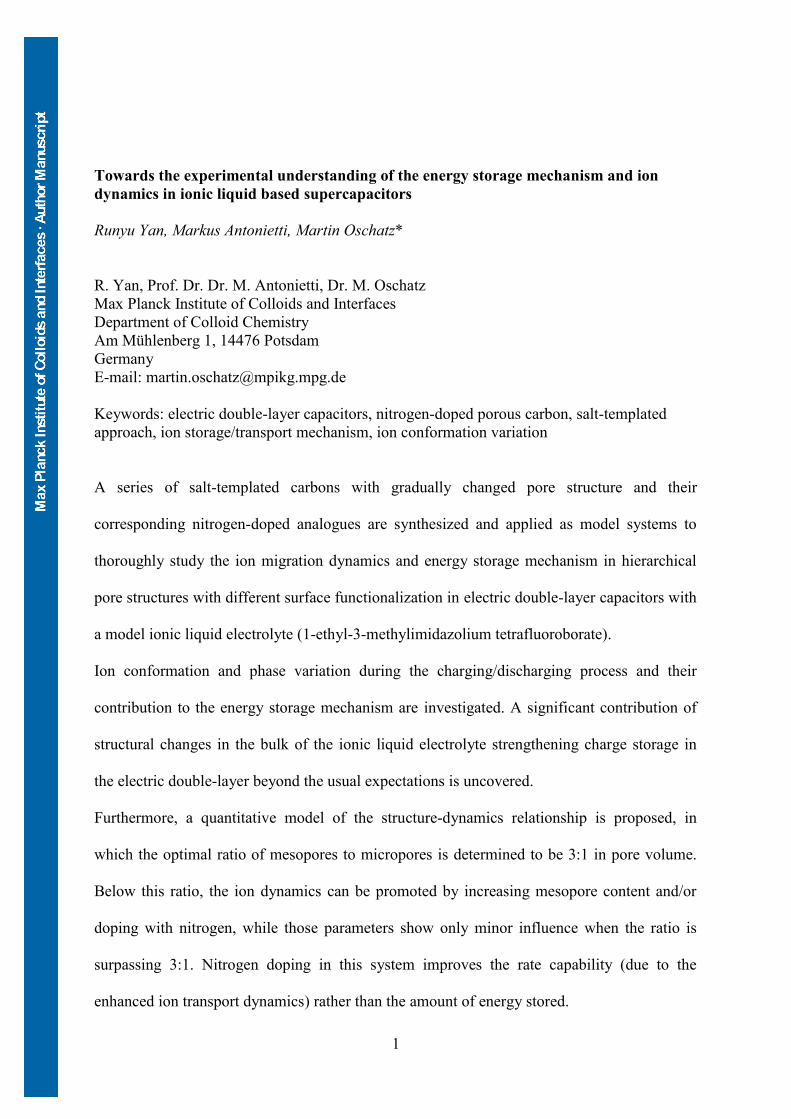
In electric double‐layer capacitors with ionic liquid electrolytes, ion conformation change and phase variation during charging/discharging are uncovered, which significantly strengthen charge storage in the electric double‐layer and supplement the traditional energy storage mechanism. A quantitative model of the structure–dynamics relationship is proposed, in which the optimal ratio of mesopores to micropores is determined to be 3:1 in pore volume.
This article may be used for non‐commercial purposes in accordance with WileyTerms and Conditions for Self‐Archiving.
MPIKG Public Access Author Manuscript
1
Towards the experimental understanding of the energy storage mechanism and ion dynamics in ionic liquid based supercapacitors Runyu Yan, Markus Antonietti, Martin Oschatz* R. Yan, Prof. Dr. Dr. M. Antonietti, Dr. M. Oschatz Max Planck Institute of Colloids and Interfaces Department of Colloid Chemistry Am Mühlenberg 1, 14476 Potsdam Germany E-mail: [email protected] Keywords: electric double-layer capacitors, nitrogen-doped porous carbon, salt-templated approach, ion storage/transport mechanism, ion conformation variation A series of salt-templated carbons with gradually changed pore structure and their corresponding nitrogen-doped analogues are synthesized and applied as model systems to thoroughly study the ion migration dynamics and energy storage mechanism in hierarchical pore structures with different surface functionalization in electric double-layer capacitors with a model ionic liquid electrolyte (1-ethyl-3-methylimidazolium tetrafluoroborate). Ion conformation and phase variation during the charging/discharging process and their contribution to the energy storage mechanism are investigated. A significant contribution of structural changes in the bulk of the ionic liquid electrolyte strengthening charge storage in the electric double-layer beyond the usual expectations is uncovered. Furthermore, a quantitative model of the structure-dynamics relationship is proposed, in which the optimal ratio of mesopores to micropores is determined to be 3:1 in pore volume. Below this ratio, the ion dynamics can be promoted by increasing mesopore content and/or doping with nitrogen, while those parameters show only minor influence when the ratio is surpassing 3:1. Nitrogen doping in this system improves the rate capability (due to the enhanced ion transport dynamics) rather than the amount of energy stored.
Max Pla
nck Ins
titute of
Colloid
s and In
terfaces
· Author
Manus
cript
2
1. Introduction Owing to the increasing electrification of the world, there is an ever-growing demand for high-performance, cost-effective, and environmentally-friendly electrochemical energy storage systems. Electric double-layer capacitors (EDLCs), which store charges at the electrode/electrolyte interface through reversible ion adsorption on porous conductive electrodes, are energy storage devices offering exceptionally large power densities that can be used to harvest energy produced by intermittent renewable energy sources and for energy recovery on short time scales.[1] Porous carbons have been the prime choice of the electrode materials for EDLCs owing to their versatile porosity, high surface area, and good electronic conductivity.[2] However, most often the inferior energy density of EDLCs poses restrictions for some of their possible large-scale applications. Given the square dependence of the energy density on applied voltage windows for EDLCs, a key strategy to enhance energy storage capacity is to implement electrolytes with higher electrochemical windows and stabilities. Ionic liquids (ILs), also known as low temperature molten salts (melting points below 100 °C) are composed solely of ions and thus display promising alternatives to the established solvent-based systems due to their wide operation voltage (as high as 4 V), negligible volatility, non-flammability, as well as the large potential operating temperature range.[3] An issue of such electrolytes, however, is that they tend to lower the power density of EDLCs. Typically, ion transport in ILs is slow in the bulk and could be even slower in carbon nanopores, leading to sluggish charging dynamics and lowered power density. Resolving these issues necessitates the fundamental understanding of transport dynamics in nanopores filled with ILs. For example, while most studies demonstrate better IL dynamics in larger pores,[4] molecular simulation disclosed ultrahigh transport coefficient in charged micropores as well.[5] The ion dynamics also depend on the surface chemistry where both the ionophobic carbon micropores and hydrophobic silica mesopores provide surprisingly high migration
Max Pla
nck Ins
titute of
Colloid
s and In
terfaces
· Author
Manus
cript
3
coefficients of IL ions.[6] Molecular dynamics simulation has revealed the dynamic heterogeneity of IL confined inside uncharged mesopores where the dynamics slow down appreciably as the ions approach the pore walls,[7] as well as the great variation of the ion occupancy (total ion density) inside pores with different charging rates.[8] These works attracted much attention and have contributed significantly to the progress toward the elucidation of how the size, surface chemistry, charging state, ion-packing density,[9] and other physicochemical properties of the pores, affect the charge storage mechanism and charge transport dynamics in IL-filled supercapacitors. However, the nanopores in all these theoretic studies are monodisperse in pore size without hierarchy, while hierarchical pore structure with both micro- and mesopores have been proven experimentally to provide efficient ion transport for a high power density while maintaining the high energy density.[10] There is still a lack of systematic studies and comprehensive interpretation of the dynamics of electrolyte ions in such complex electrode structures during the charging/discharging process. Understanding requires a combination of computational simulation and experiments, whereas the inadequate characterization of the intricate structure of hierarchical porous carbons without long-range order poses a significant challenge to the modelling and thus the simulation.[11] On the other side, the great difficulty in fabricating nearly ideal carbon models with well-defined hierarchical porosity as well as precisely controlling their pore structures impedes an experimental probing of the sophisticated hierarchical pore structure-property relationships. From the experimental and material perspective, heteroatom (especially nitrogen) doping of the carbon atom framework has been acknowledged as another efficient approach to improve both the capacitance and rate capability of supercapacitors.[12] Nevertheless, all the above fundamental research on charge storage mechanisms has been devoted exclusively to pure carbon materials. A deep comprehension of a potential change of mechanisms after nitrogen doping remains missing.
Max Pla
nck Ins
titute of
Colloid
s and In
terfaces
· Author
Manus
cript
4
Numerous pioneering experimental and theoretical studies have been devoted to explore the underlying physics for IL charge storage under equilibrium conditions in carbon nanopores, which have led to an improved understanding of the molecular mechanisms of charge storage. For instance, powerful techniques such as computer simulations,[13] electrochemical quartz crystal microbalance,[14] nuclear magnetic resonance (NMR) spectroscopy,[15] and infrared spectroelectrochemical techniques[16] have provided molecular information about the dynamic charge storage, where the ion exchange (swapping of co-ions for counter-ions) seems to play a vital role.[1d, 17] Great efforts have been devoted to investigating the dependence of capacitance on the pore size for an ionic liquid electrolyte, especially the anomalous increase of capacitance when the pore size decreases to the ion size.[18] Using molecular dynamics simulations, the capacitance is found to depend on the applied voltage as well, where the capacitance reaches a maximum when all co-ions are expelled from the pores.[13] These reports emphasize the significance of the charging process, applied voltage, pore sizes, ion-wall/ion-ion interactions, and physico-chemical properties of the IL, just to name a few. Up to now, the mechanisms for charge storage revealed in these studies neglect possible conformation variations and phase changes in the bulk of the rather large IL ions during charging/discharging. Simulation studies only employ coarse-grained, rigid models of IL ions, and experimental studies have not taken the influence of such variations into consideration, although they are very likely to occur as a function of the strength of ion-ion and/or ion-wall interactions in presence of an electric potential. A limited number of simulation studies have revealed that the ion-wall interactions can significantly affect the molecular conformation of IL ions.[5, 7b] Nevertheless, no experimental results confirming this prediction have been reported, and its importance for the energy storage mechanism as well as the origin remains ambiguous. In this work, a series of salt-templated carbon materials (STCs) and their corresponding nitrogen-doped counterparts (NDSTCs) with tunable pore structure and well-defined pore size

Max Pla
nck Ins
titute of
Colloid
s and In
terfaces
· Author
Manus
cript
5
dispersion were synthesized and used as model systems to thoroughly study the dynamics of the ion transport in hierarchical pore structures with different surface functionalization. The ion conformation and possible phase variations in the bulk of the IL confined in the carbon pores during charging/discharging process and its contribution to the charge storage mechanism was investigated as well. A quantitative model is proposed for the relationship between hierarchical pore structure/surface functionalization and ion dynamics. The increasing amount of mesopores and doping with nitrogen can promote the amount of energy stored in the EDLC only when it is limited by the inferior ion dynamics inside micropores. The ion migration dynamics inside mesopores commence to limit the EDLC performance when the ratio of mesopores to micropores surpasses a critical point of 3:1 in volume. Above this ratio neither increase of mesopore volume nor nitrogen doping will have significant influence. In terms of the energy storage itself, the occurrence of ion conformation variation during charging/discharging process leads to an unexpected deviation of the energy storage mechanism from the classical double-layer theory due to significant contributions from the intermolecular interactions in the IL volume. 2. Results A series of salt-templated carbons (STCs)[19] with different pore structures was prepared by employing the salt template ZnCl2 as porogen for well-defined micropores and mesopores (Scheme 1). Sucrose as a renewable carbon precursor and different amounts of ZnCl2 were mixed in aqueous solution, followed by polycondensation of the carbohydrate at 160 °C with the salt template inside. Afterwards, the mixture was carbonized at 900 °C followed by thorough washing with HCl solution to remove the ZnCl2. Thermogravimetric analysis (TGA) of the materials indicated a small ash-content (less than 3 wt%) above 600 °C (Figure S1). X-ray diffraction (XRD) results (Figure S2) of all the samples showed only broad (002) and (101) carbon peaks at 26° and 44° 2Theta, verifying the mainly amorphous carbon phase and
Max Pla
nck Ins
titute of
Colloid
s and In
terfaces
· Author
Manus
cript
6
the nearly complete absence of inorganic residuals after carbonization and washing with HCl. Removal of the salt leads to the formation of micropores and mesopores at controllable ratio depending on the relative amounts of ZnCl2 in different STCs (Table 1). This synthesis scheme stands out due to the tunable hierarchical pore structure formation with high surface area by a simple one-step salt-template approach using a potentially reusable template ZnCl2. Reasonable yields of carbon can be achieved from a renewable precursor, which is sustainable, cost-effective, and favorable to mass production. Subsequently, nitrogen doping of STCs was carried out by dispersing the STCs in aqueous cyanamide solution followed by drying and cross-condensation at 800 °C under N2 to obtain the corresponding nitrogen-doped STCs (NDSTCs, Scheme 1). The nitrogen content is 5-6 wt% for all these samples, as detected by elemental analysis (Table 1). X-ray photoelectron spectroscopy (XPS) was employed to characterize the N-doped samples (NDSTC-1 and NDSTC-16) for the nitrogen/oxygen containing functional groups. The survey XPS spectra (Figure S3a and d) of the two samples reveal the presence of C, N, and O. Traces of residual zinc are also detected which is consistent with the results of TGA. The high-resolution N 1s spectra (Figure S3b and e) of both NDSTCs display four fitted peaks at 397.9, 398.5, 400.1, and 403.2 eV, which can be assigned to the pyridinic nitrogen, pyrrolic nitrogen, graphitic nitrogen, and N-O (oxidized nitrogen), respectively.[20] The high-resolution O 1s spectra (Figure S3c and f) can be deconvoluted into two peaks centered at 531.5, and 532.8 eV, corresponding to the carbonyl groups (C=O) and hydroxyl groups (C–OH), respectively.[21] The nitrogen contents of NDSTC-1 and NDSTC-16 are determined to be 6.01 and 3.68 at%, respectively, which suggests the success of nitrogen doping since negligible amount of nitrogen was detected in STC-1 and STC-16 by XPS in accordance with the results of elemental analysis. N2 (-196 °C) and CO2 (0 °C) physisorption experiments were carried out to analyze the pore structures (Figure 1, Figure S4 and Table 1). STC-1 shows type I(a) isotherm, indicating its

ZnCl2:Sucrose (weight) SSA (𝐦𝟐/𝐠) Vt (𝐜𝐦𝟑/𝐠) DFT N content (wt%) Thickness (µm) Mass loading (mg cm-2) Vmic (𝒄𝒎𝟑/𝒈) Vmeso (𝒄𝒎𝟑/𝒈) STC-1 1 1138 0.51 0.39 0.11 / 126 9.6 STC-2 2 1430 0.81 0.33 0.42 / 122 7.6 STC-4 4 1739 1.08 0.36 0.67 / 125 5.7 STC-8 8 2203 1.48 0.36 1.08 / 118 5.0
STC-16 16 2324 1.66 0.41 1.25 / 123 4.8 NDSTC-1 1 1163 0.51 0.39 0.08 5.40 130 11.6 NDSTC-2 2 1468 0.80 0.37 0.38 5.52 123 6.9 NDSTC-4 4 1811 1.09 0.42 0.62 5.74 126 6.2 NDSTC-8 8 2181 1.42 0.36 1.02 6.09 119 5.0 NDSTC-16 16 2308 1.63 0.40 1.15 5.43 121 4.8 Ac-STC-1 1 1493 0.72 0.50 0.18 / 122 8.6
Ac-STC-16 16 2833 1.89 0.48 1.35 / 116 3.2
Scheme 1. Preparation of salt-templated carbons (STCs) and nitrogen-doped STCs (NDSTCs).
Sucrose ZnCl2 Water
160 ℃
Polymerization
900 ℃
Carbonization
Salt template removal
STCPolymerized sucrose with
salt templates insideNDSTC
Cyanamide
Condensation
Table 1. Mass ratio of ZnCl2 to sucrose, BET Specific surface area (SSA), total pore volume (Vt), DFT micropore volume (Vmic), DFT mesopore volume (Vmeso), nitrogen content of the carbon materials, as well as the thickness and mass loading of the corresponding electrodes.

Max Pla
nck Ins
titute of
Colloid
s and In
terfaces
· Author
Manus
cript
7
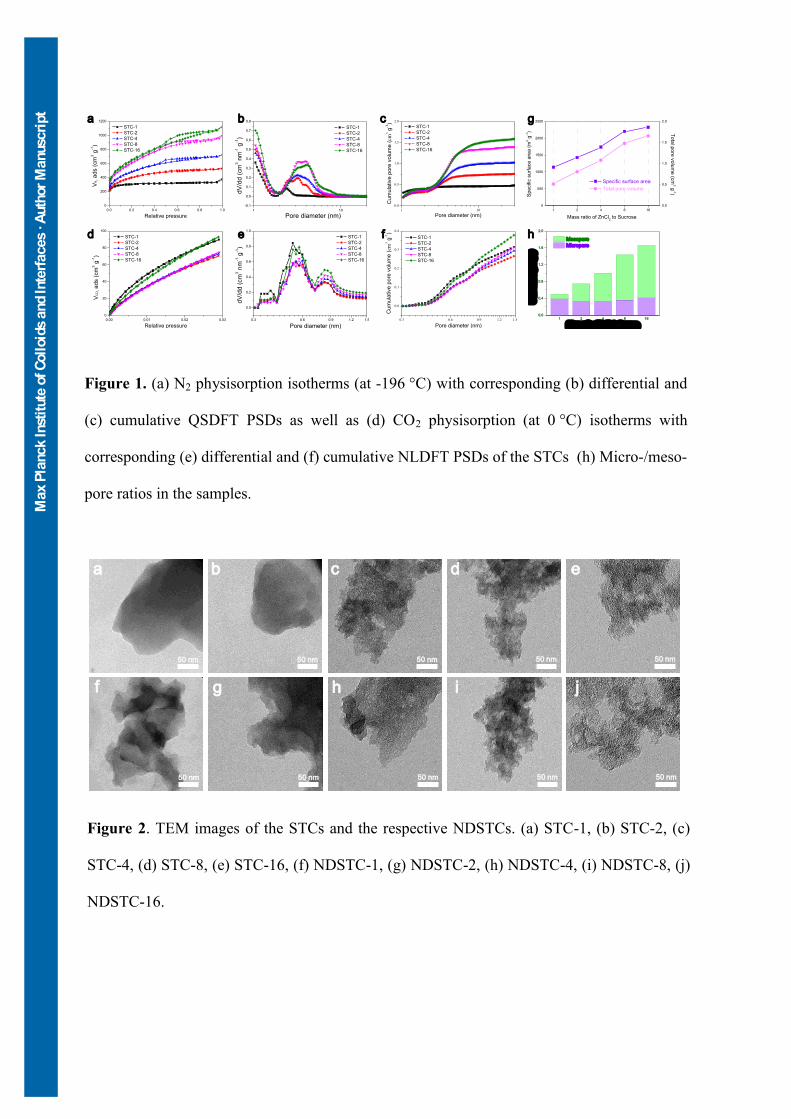
purely microporous structure, while STC-2 has the type I(b) isotherm which suggests the presence of a small amount of narrow mesopores in addition to the micropores. STC-4, STC-8 and STC-16 exhibit type IV(a) isotherms with a continuous slope above a relative pressure of 0.2 with the hysteresis loop of H4 type in the relative pressure range between 0.4 and 0.9, indicating the existence of significant amounts of mesopores (Figure 1a). To study the transformation of pore structure with the increase of the salt template, the pore size distribution (PSD) was further analyzed using the quenched-solid density functional theory (QSDFT) for N2 adsorbed on carbon with slit/cylindrical pore shape (Figure 1b). All the STC samples exhibit comparable micropore volumes around 0.4 cm3 g-1 (Table 1). In the case of STC-1 with the moderate SSA of 1138 m2 g-1, the micropores account for the overwhelming fraction of the total pores (Figure 1c), verifying its microporous pore structure. With the increase of the salt loading, the specific surface areas (SSAs) gradually and significantly increase to 2203 m2 g-1 for STC-8, followed by 2324 m2 g-1 for STC-16 (Figure 1g and Table 1). The content of mesopores exhibits a drastic rise with increased template content (Figure 1h), which in turn results in a continuous augment of the total pore volumes from 0.51 cm3 g-1 for STC-1 to 1.66 cm3 g-1 for STC-16. In addition, the diameters of the mesopores are also enlarged slightly from 3 nm (STC-2) to 4 nm (STC-16) (Figure 1b) which is likely due to percolation of the salt templates, allowing to fine tune the hierarchical pore structure. The cumulative PSD plots (Figure 1c) indicate that micropores only contribute a small fraction of the total pore volume in the STC-4, STC-8, and STC-16. The distributions of micropores with diameters of 1.5 nm and below were further evaluated by non-local DFT (NLDFT) analysis of CO2 physisorption measurements (Figure 1d-f). All samples contain three kinds of well-defined narrow micropores with diameters of 0.35, 0.55, and 0.80 nm, corresponding to different well-defined salt template clusters (Figure 1e). A higher ZnCl2/sucrose ratio leads to a larger volume of micropores with the diameter of 0.80 nm, which is in the range of the ion size of EMIm+ (0.76 nm). This underlines that the salt-templating method provides a
Max Pla
nck Ins
titute of
Colloid
s and In
terfaces
· Author
Manus
cript
8
sufficiently precise control over the size and amount of narrow micropores. The N2 physisorption results of NDSTCs show the similarity of pore structure compared with their corresponding parental STCs (Figure S4 and Table 1), indicating that the nitrogen doping process is a molecular cross-condensation which has no significant effects on the pore structure. The presence of comparable amounts of nitrogen in purely microporous NDSTC-1 and other hierarchical porous NDSTCs (Table 1) suggest the homogenous nitrogen doping along both micropores and mesopores. The influence of the amount of ZnCl2 and nitrogen doping on the pore structure was further studied by transmission electron microscopy (TEM). Low content of ZnCl2 (STC-1 and STC-2) leads to a rather dense morphology with the presence of abundant narrow micropores, while mesopores can hardly be observed (Figure 2a-b). With the gradual increase of ZnCl2 (STC-4, STC-8, and STC-16), the morphologies clearly exhibit a distinct trend of being more diluted and open, reflecting the development of open mesoporous pore systems (Figure 2c-e). After nitrogen doping, the NDSTCs consist of pore structures which are comparable to their corresponding STC parents (Figure 2f-j). This is in good accordance with the physisorption experiments. In the Raman spectra (Figure S5), the D-band near 1340 cm-1 originates from the breathing modes of the six-fold sp2-hybridized carbon rings in the presence of defects and disorder.[22] The width of the D-band reflects the degree of structural ordering and size distribution of sp2 rings (i.e., 5-, 6-, 7-, and 8-membered rings). The wide (157-196 cm-1) D-bands (Table S1) in all samples reveal the existence of abundant disordered sections as it is typical for highly microporous carbons.[22a] The G-band near 1580 cm-1 is caused by bond stretching of sp2 carbon in either rings or chains. The peak height ratio of the D- and G-band (ID/IG) is proportional to the amount of six-membered sp2 carbon rings, which is commonly employed to evaluate the level of carbon ordering in porous carbons.[22-23] The comparable ID/IG value (Table S1) with the increase of salt-template (the values of STC-1, STC-2, STC-4, STC-8,
Max Pla
nck Ins
titute of
Colloid
s and In
terfaces
· Author
Manus
cript
Figure 1. (a) N2 physisorption isotherms (at -196 °C) with corresponding (b) differential and(c) cumulative QSDFT PSDs as well as (d) CO2 physisorption (at 0 °C) isotherms withcorresponding (e) differential and (f) cumulative NLDFT PSDs of the STCs (h) Micro-/meso-pore ratios in the samples.
1 100.0
0.5
1.0
1.5
2.0 STC-1
STC-2
STC-4
STC-8
STC-16
Cum
ula
tive p
ore
volu
me (
cm3 g-1)
Pore diameter (nm)0.0 0.2 0.4 0.6 0.8 1.0
0
200
400
600
800
1000
1200
VN
2 a
ds (
cm
3 g
-1)
Relative pressure
STC-1
STC-2
STC-4
STC-8
STC-16
1 10
-0.1
0.0
0.1
0.2
0.3
0.4
0.5
0.6
0.7
0.8
STC-1
STC-2
STC-4
STC-8
STC-16
dV
/dd (
cm
3 n
m-1 g
-1)
Pore diameter (nm)
0.00 0.01 0.02 0.03
0
20
40
60
80
100
VC
O2 a
ds (
cm
3 g
-1)
Relative pressure
STC-1
STC-2
STC-4
STC-8
STC-16
0.3 0.6 0.9 1.2 1.5
0.0
0.2
0.4
0.6
0.8
1.0
STC-1
STC-2
STC-4
STC-8
STC-16
dV
/dd (
cm
3 n
m-1 g
-1)
Pore diameter (nm)
0.3 0.6 0.9 1.2 1.5
0.0
0.1
0.2
0.3
0.4 STC-1
STC-2
STC-4
STC-8
STC-16
Cum
ula
tive p
ore
volu
me (
cm3 g-1)
Pore diameter (nm)
1 2 4 8 160
500
1000
1500
2000
2500
Specific
surface
area (m
2 g-1 )
Specific surface area
0.0
0.5
1.0
1.5
2.0
Total pore volume
Mass ratio of ZnCl2 to Sucrose
Total pore volume (cm3 g -1)
a b c
d e f
g
h
1 2 4 8 160.0
0.4
0.8
1.2
1.6
2.0
Mass ratio of ZnCl2 to Sucrose
Pore vo
lume (c
m3 g-1 )
Mesopore Micropore
Figure 2. TEM images of the STCs and the respective NDSTCs. (a) STC-1, (b) STC-2, (c) STC-4, (d) STC-8, (e) STC-16, (f) NDSTC-1, (g) NDSTC-2, (h) NDSTC-4, (i) NDSTC-8, (j) NDSTC-16.
50 nm 50 nm 50 nm 50 nm 50 nm
50 nm 50 nm 50 nm 50 nm 50 nm
a b c d e
f g h i j
1 100.0
0.5
1.0
1.5
2.0 STC-1
STC-2
STC-4
STC-8
STC-16
Cum
ula
tive p
ore
volu
me (
cm3 g-1)
Pore diameter (nm)
0.0 0.2 0.4 0.6 0.8 1.0
0
200
400
600
800
1000
1200
VN
2 a
ds (
cm
3 g
-1)
Relative pressure
STC-1
STC-2
STC-4
STC-8
STC-16
1 10
-0.1
0.0
0.1
0.2
0.3
0.4
0.5
0.6
0.7
0.8
STC-1
STC-2
STC-4
STC-8
STC-16
dV
/dd (
cm
3 n
m-1 g
-1)
Pore diameter (nm)
0.00 0.01 0.02 0.03
0
20
40
60
80
100
VC
O2 a
ds (
cm
3 g
-1)
Relative pressure
STC-1
STC-2
STC-4
STC-8
STC-16
0.3 0.6 0.9 1.2 1.5
0.0
0.2
0.4
0.6
0.8
1.0
STC-1
STC-2
STC-4
STC-8
STC-16
dV
/dd (
cm
3 n
m-1 g
-1)
Pore diameter (nm)0.3 0.6 0.9 1.2 1.5
0.0
0.1
0.2
0.3
0.4 STC-1
STC-2
STC-4
STC-8
STC-16
Cum
ula
tive p
ore
volu
me (
cm3 g-1)
Pore diameter (nm)
1 2 4 8 160
500
1000
1500
2000
2500
Specific
surface
area (m
2 g-1 )
Specific surface area
0.0
0.5
1.0
1.5
2.0
Total pore volume
Mass ratio of ZnCl2 to Sucrose
Total pore volume (cm3 g -1)
a b c
d e f
g
h
1 2 4 8 160.0
0.4
0.8
1.2
1.6
2.0
Mass ratio of ZnCl2 to Sucrose
Pore vo
lume (c
m3 g-1 )
Mesopore Micropore
50 nm 50 nm 50 nm 50 nm 50 nm
50 nm 50 nm 50 nm 50 nm 50 nm
a b c d e
f g h i j
Max Pla
nck Ins
titute of
Colloid
s and In
terfaces
· Author
Manus
cript
9
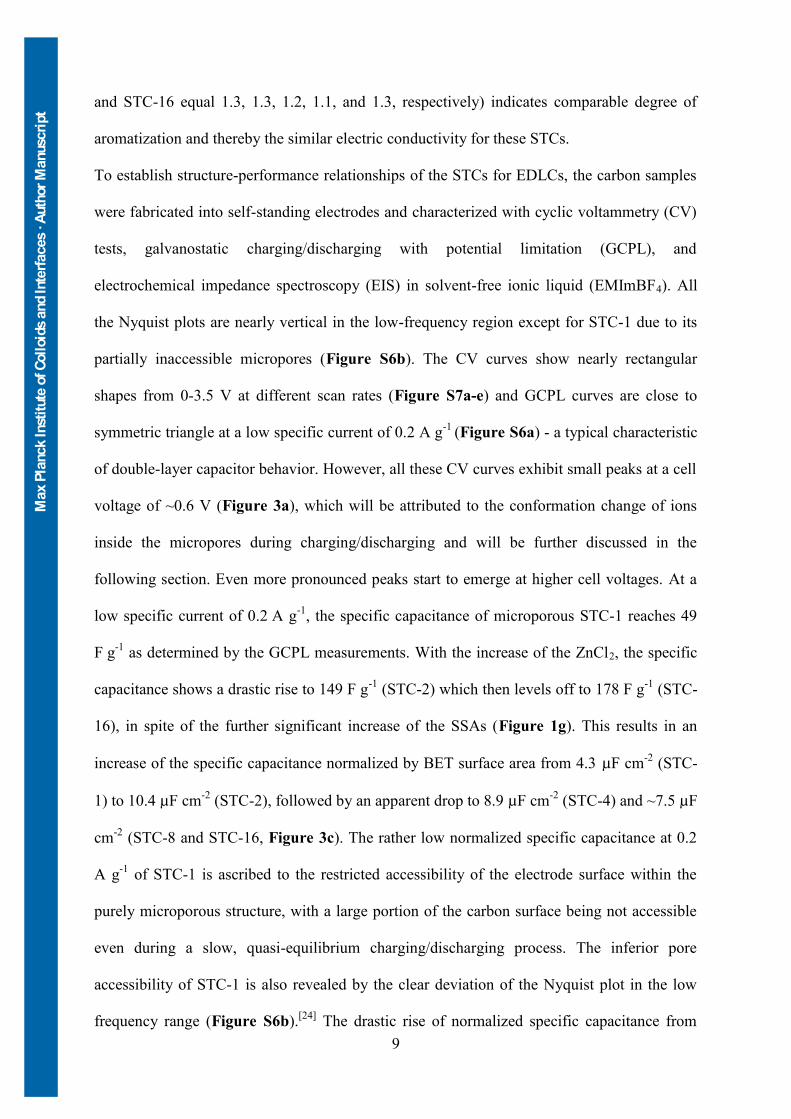
and STC-16 equal 1.3, 1.3, 1.2, 1.1, and 1.3, respectively) indicates comparable degree of aromatization and thereby the similar electric conductivity for these STCs. To establish structure-performance relationships of the STCs for EDLCs, the carbon samples were fabricated into self-standing electrodes and characterized with cyclic voltammetry (CV) tests, galvanostatic charging/discharging with potential limitation (GCPL), and electrochemical impedance spectroscopy (EIS) in solvent-free ionic liquid (EMImBF4). All the Nyquist plots are nearly vertical in the low-frequency region except for STC-1 due to its partially inaccessible micropores (Figure S6b). The CV curves show nearly rectangular shapes from 0-3.5 V at different scan rates (Figure S7a-e) and GCPL curves are close to symmetric triangle at a low specific current of 0.2 A g-1 (Figure S6a) - a typical characteristic of double-layer capacitor behavior. However, all these CV curves exhibit small peaks at a cell voltage of ~0.6 V (Figure 3a), which will be attributed to the conformation change of ions inside the micropores during charging/discharging and will be further discussed in the following section. Even more pronounced peaks start to emerge at higher cell voltages. At a low specific current of 0.2 A g-1, the specific capacitance of microporous STC-1 reaches 49 F g-1 as determined by the GCPL measurements. With the increase of the ZnCl2, the specific capacitance shows a drastic rise to 149 F g-1 (STC-2) which then levels off to 178 F g-1 (STC-16), in spite of the further significant increase of the SSAs (Figure 1g). This results in an increase of the specific capacitance normalized by BET surface area from 4.3 µF cm-2 (STC-1) to 10.4 µF cm-2 (STC-2), followed by an apparent drop to 8.9 µF cm-2 (STC-4) and ~7.5 µF cm-2 (STC-8 and STC-16, Figure 3c). The rather low normalized specific capacitance at 0.2 A g-1 of STC-1 is ascribed to the restricted accessibility of the electrode surface within the purely microporous structure, with a large portion of the carbon surface being not accessible even during a slow, quasi-equilibrium charging/discharging process. The inferior pore accessibility of STC-1 is also revealed by the clear deviation of the Nyquist plot in the low frequency range (Figure S6b).[24] The drastic rise of normalized specific capacitance from

Max Pla
nck Ins
titute of
Colloid
s and In
terfaces
· Author
Manus
cript
10
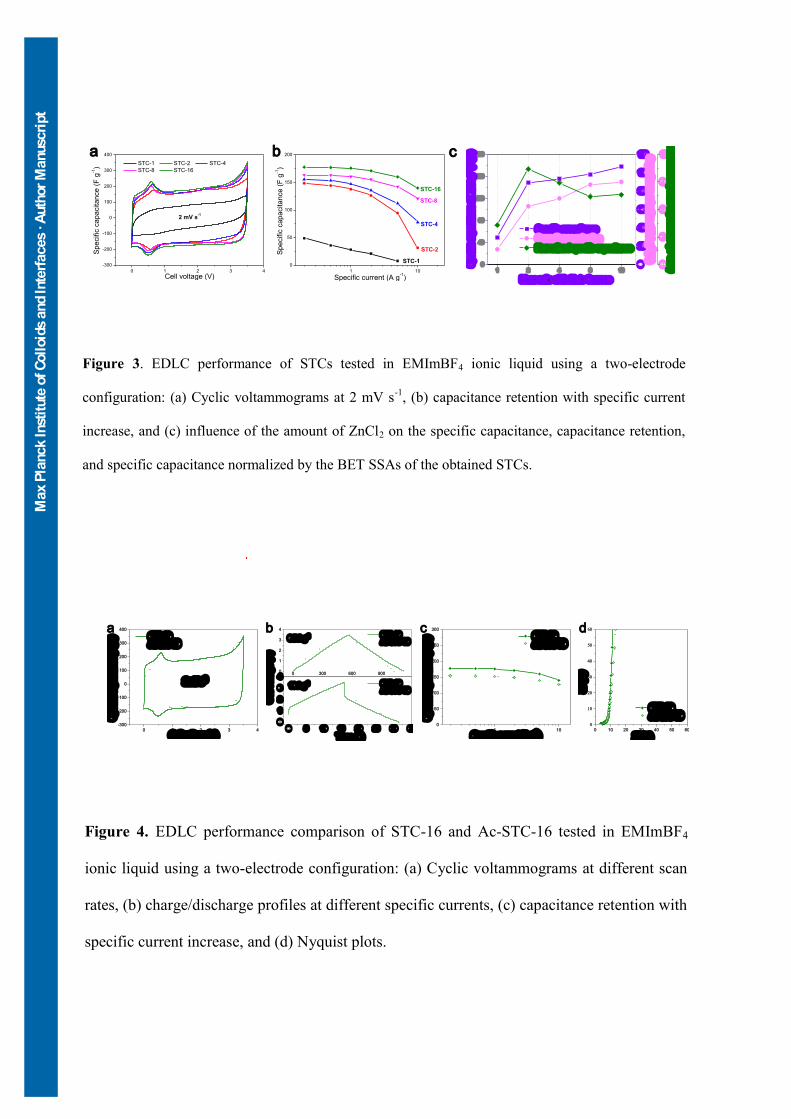
STC-1 to STC-2 is caused by the introduction of mesopores, which renders the whole carbon surface available to ions at a low charging/discharging rate. Due to its enlarged SSA and mesopore volume, STC-2 reaches a relatively high specific capacitance of 149 F g-1. It is worth mentioning that further increase of the SSA only gives rise to the slight improvement of specific capacitance, leading to the decline of normalized specific capacitance to approximate 7.5 µF cm-2 for STC-8 and STC-16 (Figure 3c). This is consistent with the rather general observation that an “endless” increase of SSAs above 1500 m2 g-1 has only small impacts on the specific capacitance, and the pore size distribution becomes crucial.[1a, 1e] This is also supported by analysis of a CO2-activated STC-16 (Ac-STC-16) which “only” reaches 154 F g
-
1 (Figure 4) despite its ultrahigh SSA of 2833 m2 g-1. On base of the normalized specific capacitance of 5.4 µF cm-2, this material provides an even lower specific capacitance compared with that of STC-16 (Figure 4b and Figure 4c).[18e] The rate capabilities from STC-1 to STC-8 show a clear improvement with the higher amounts of the mesopores, which is seen by the smaller voltage drop (Figure S6a) and higher capacitance retention (Figure 3b-c). Typically, in the case of STC-1, STC-2, and STC-4, only part of the surface in the micropores is used by ions at a high charging/discharging rate because of the poor ion dynamics. This can be addressed by the substantial development of mesopores (introduced by increasing amounts of salt template), leading to the shrinkage of domains of micropores, thus significantly improving the rate capability. It should be noticed that the larger areal loading (at similar thickness) of the electrodes with the microporous carbons could also contribute their worse rate capability by decreasing migration dynamics of charge carriers, especially at very high current density. On the other hand, STC-8 and STC-16 exhibit similar rate capabilities with polarization induced voltage drops of 0.34 V and 0.37 V, and capacitance retentions of 87% and 89%, respectively, at a specific current of 5 A g-1, despite their apparent difference in content of mesopores (Figure 1h). This is in accordance with the Nyquist plots of the STCs (Figure S6b), where the length of the 45° sloped curve
Max Pla
nck Ins
titute of
Colloid
s and In
terfaces
· Author
Manus
cript
Figure 3. EDLC performance of STCs tested in EMImBF4 ionic liquid using a two-electrode configuration: (a) Cyclic voltammograms at 2 mV s-1, (b) capacitance retention with specific current increase, and (c) influence of the amount of ZnCl2 on the specific capacitance, capacitance retention, and specific capacitance normalized by the BET SSAs of the obtained STCs.
1 10
0
50
100
150
200
STC-1
STC-2
STC-4
STC-8
Sp
ecific
ca
pa
cita
nce
(F
g-1)
Specific current (A g-1)
STC-16
0 1 2 3 4
-300
-200
-100
0
100
200
300
400
2 mV s-1
Sp
ecific
ca
pa
cita
nce
(F
g-1)
Cell voltage (V)
STC-1 STC-2 STC-4
STC-8 STC-16
a b c
1 2 4 8 160
40
80
120
160
200
Specific capacitance
Mass ratio of ZnCl2 to Sucrose
Specific
capacit
ance a
t 0.2 A
g-1 (F g-1 )
0
20
40
60
80
100
120
Capacitance retention
Capacitance retention at 5 A g -1 (%) 0
3
6
9
12
Normalized specific capacitance
Normalized specific capacitance (F cm-2)
a b c
0 1 2 3 4-300-200-100
0100200300400
2 mV s-1
Specific
capacit
ance (F
g-1 )
Cell voltage (V)
STC-16 Ac-STC-16d
1 100
50
100
150
200
250
300
Specific
capacit
ance (F
g-1 )
Specific current (A g-1)
STC-16 Ac-STC-16
0 300 600 90001234
0 5 10 15 20 25 30 3501234
0.5 A g-1
10 A g-1
STC-16 Ac-STC-16
Cell vo
ltage (V
)
Time (s)
STC-16 Ac-STC-16
0 10 20 30 40 50 600
10
20
30
40
50
60
Z'' (
)
Z' ()
STC-16 Ac-STC-16
Figure 4. EDLC performance comparison of STC-16 and Ac-STC-16 tested in EMImBF4 ionic liquid using a two-electrode configuration: (a) Cyclic voltammograms at different scan rates, (b) charge/discharge profiles at different specific currents, (c) capacitance retention with specific current increase, and (d) Nyquist plots.
1 10
0
50
100
150
200
STC-1
STC-2
STC-4
STC-8
Sp
ecific
ca
pa
cita
nce
(F
g-1)
Specific current (A g-1)
STC-16
0 1 2 3 4
-300
-200
-100
0
100
200
300
400
2 mV s-1
Sp
ecific
ca
pa
cita
nce
(F
g-1)
Cell voltage (V)
STC-1 STC-2 STC-4
STC-8 STC-16
a b c
1 2 4 8 160
40
80
120
160
200
Specific capacitance
Mass ratio of ZnCl2 to Sucrose
Specific
capacit
ance a
t 0.2 A
g-1 (F g-1 )
0
20
40
60
80
100
120
Capacitance retention
Capacitance retention at 5 A g -1 (%) 0
3
6
9
12
Normalized specific capacitance
Normalized specific capacitance (F cm-2)
a b c
0 1 2 3 4-300-200-100
0100200300400
2 mV s-1
Specific
capacit
ance (F
g-1 )
Cell voltage (V)
STC-16 Ac-STC-16d
1 100
50
100
150
200
250
300
Specific
capacit
ance (F
g-1 )
Specific current (A g-1)
STC-16 Ac-STC-16
0 300 600 90001234
0 5 10 15 20 25 30 3501234
0.5 A g-1
10 A g-1
STC-16 Ac-STC-16
Cell vo
ltage (V
)
Time (s)
STC-16 Ac-STC-16
0 10 20 30 40 50 600
10
20
30
40
50
60
Z'' (
)
Z' ()
STC-16 Ac-STC-16

Max Pla
nck Ins
titute of
Colloid
s and In
terfaces
· Author
Manus
cript
11
(known as the Warburg portion in the middle-frequency region, related to the transport of electrolyte ions into the carbon pores) shows an apparent reduction from 10.9 Ω for STC-1 to 4.9 Ω for STC-8, while constancy of this value (~4.9 Ω) is observed for STC-8 and STC-16. This suggests that the further shortening of transport length in the micropores in STC-8 has little influence on the rate capability. To identify the rate determining process, we tested the EDLC performance with Ac-STC-16 as an “activated” electrode material where the
micropore sizes are slightly enlarged with broader distribution (Figure S8), so that the ion transport dynamics at the junctions of mesopores and micropores are expected to be improved. However, the rate capability is almost impervious to the enlargement of micropores, as revealed by the similar voltage drop (1.1 V and 1.0 V), and capacitance retention (79% and 81%) of STC-16 and Ac-STC-16 at 10 A g-1, as well as their similar Nyquist plots (Figure 4b-d). The slightly lower capacitance retention of STC-16 is attributed to the absent peak at the high charging/discharging rate (Figure S7e). Besides, in our recent study, a hierarchical porous carbon with ordered mesopores shows outstanding rate capability (0.64 V voltage drop and 88% capacitance retention at 10 A g-1), compared with that of the STCs with disordered and relatively narrow mesopores.[10c] Therefore, we conclude that the limiting factor of the ion dynamics inside the mesopores comes into play when the ratio of mesopores to micropores surpasses 3:1 in pore volume (STC-8). Moreover, after activation, the peak at the cell voltage of ~0.6 V disappears in the CV curves of Ac-STC-16 (Figure 4a), which indicates that the presence or absence of such a peak is related to the size distribution of the micropores. Similar to STCs, the nitrogen-doped NDSTCs exhibit an ideal double-layer capacitance behavior, as indicated by the regular shape of the CV curves (Figure 5a and Figure S7f-j), the symmetrical triangle shapes with some small voltage drops of GCPL curves (Figure S7k-o), as well as the nearly vertical Nyquist plots in the low-frequency region (Figure S7p-t, except NDSTC-1 because of its partially inaccessible micropores). Compared with the CV curves of the STCs (Figure 3a and Figure S7a-e), the peaks at the cell voltage of ~0.6 V
12
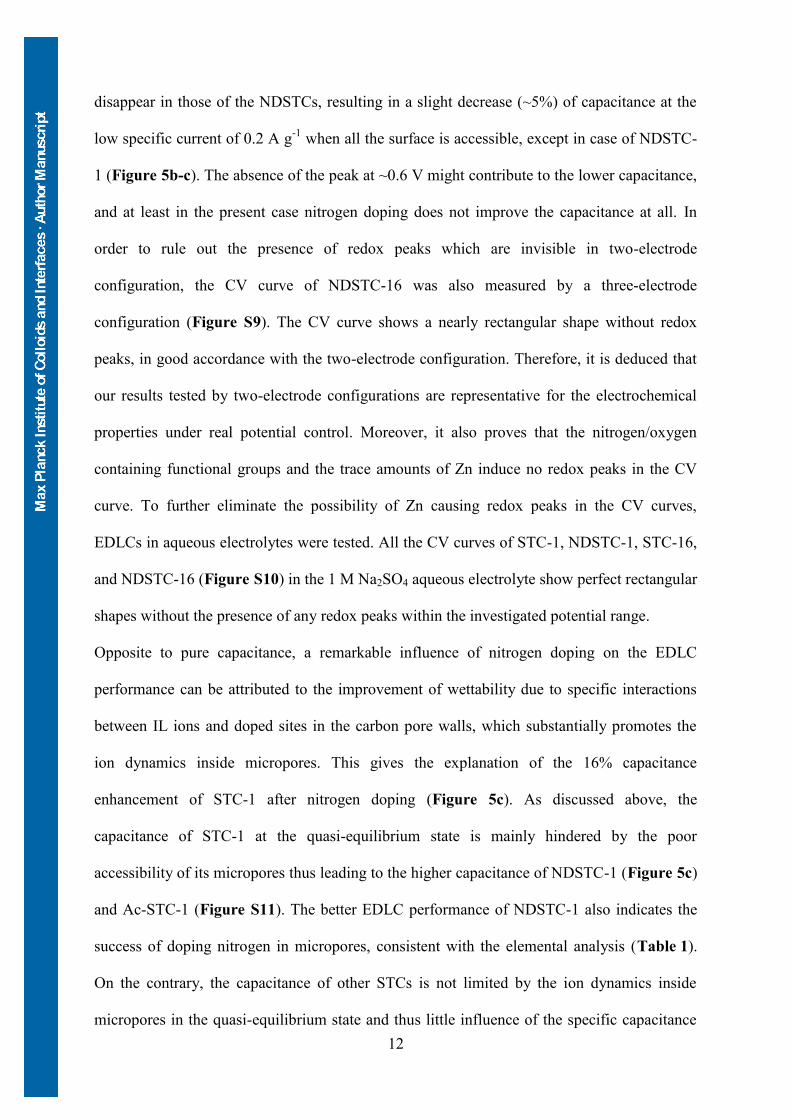
disappear in those of the NDSTCs, resulting in a slight decrease (~5%) of capacitance at the low specific current of 0.2 A g-1 when all the surface is accessible, except in case of NDSTC-1 (Figure 5b-c). The absence of the peak at ~0.6 V might contribute to the lower capacitance, and at least in the present case nitrogen doping does not improve the capacitance at all. In order to rule out the presence of redox peaks which are invisible in two-electrode configuration, the CV curve of NDSTC-16 was also measured by a three-electrode configuration (Figure S9). The CV curve shows a nearly rectangular shape without redox peaks, in good accordance with the two-electrode configuration. Therefore, it is deduced that our results tested by two-electrode configurations are representative for the electrochemical properties under real potential control. Moreover, it also proves that the nitrogen/oxygen containing functional groups and the trace amounts of Zn induce no redox peaks in the CV curve. To further eliminate the possibility of Zn causing redox peaks in the CV curves, EDLCs in aqueous electrolytes were tested. All the CV curves of STC-1, NDSTC-1, STC-16, and NDSTC-16 (Figure S10) in the 1 M Na2SO4 aqueous electrolyte show perfect rectangular shapes without the presence of any redox peaks within the investigated potential range. Opposite to pure capacitance, a remarkable influence of nitrogen doping on the EDLC performance can be attributed to the improvement of wettability due to specific interactions between IL ions and doped sites in the carbon pore walls, which substantially promotes the ion dynamics inside micropores. This gives the explanation of the 16% capacitance enhancement of STC-1 after nitrogen doping (Figure 5c). As discussed above, the capacitance of STC-1 at the quasi-equilibrium state is mainly hindered by the poor accessibility of its micropores thus leading to the higher capacitance of NDSTC-1 (Figure 5c) and Ac-STC-1 (Figure S11). The better EDLC performance of NDSTC-1 also indicates the success of doping nitrogen in micropores, consistent with the elemental analysis (Table 1). On the contrary, the capacitance of other STCs is not limited by the ion dynamics inside micropores in the quasi-equilibrium state and thus little influence of the specific capacitance

Max Pla
nck Ins
titute of
Colloid
s and In
terfaces
· Author
Manus
cript
1 10
0
50
100
150
200
250
Sp
ecific
ca
pa
cita
nce
(F
g-1)
Specific current (A g-1)
STC-1 NDSTC-1
STC-2 NDSTC-2
STC-4 NDSTC-4
STC-8 NDSTC-8
STC-16 NDSTC-16
1 2 4 8 16-20
0
20
40
60
80 Influence on capacitance Influence on rate capability
Mass ratio of ZnCl2 to Sucrose
Influenc
e of N
doping
oncap
acitanc
e and
rate cap
ability (
%)
0 1 2 3 4
-300
-200
-100
0
100
200
300
400
2 mV s-1
Sp
ecific
ca
pa
cita
nce
(F
g-1)
Cell voltage (V)
NDSTC-1 NDSTC-2 NDSTC-4
NDSTC-8 NDSTC-16
a b c
Figure 5. EDLC performance of NDSTCs tested in EMImBF4 ionic liquid using a two-electrode configuration: (a) Cyclic voltammograms at 2 mV s-1, (b) capacitance retention with specific current increase, and (c) influence of nitrogen doping on specific capacitance at 0.2 A g-1 and capacitance retention at 5 A g-1 compared with the corresponding STCs.

Max Pla
nck Ins
titute of
Colloid
s and In
terfaces
· Author
Manus
cript
13
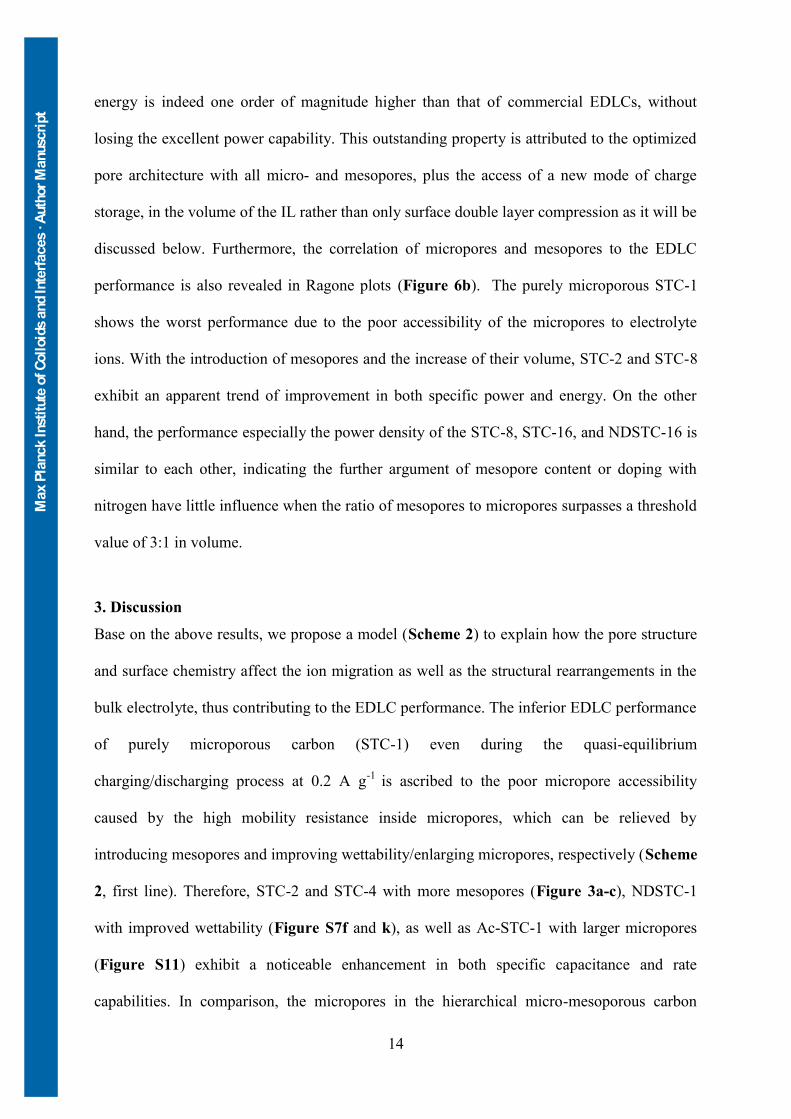
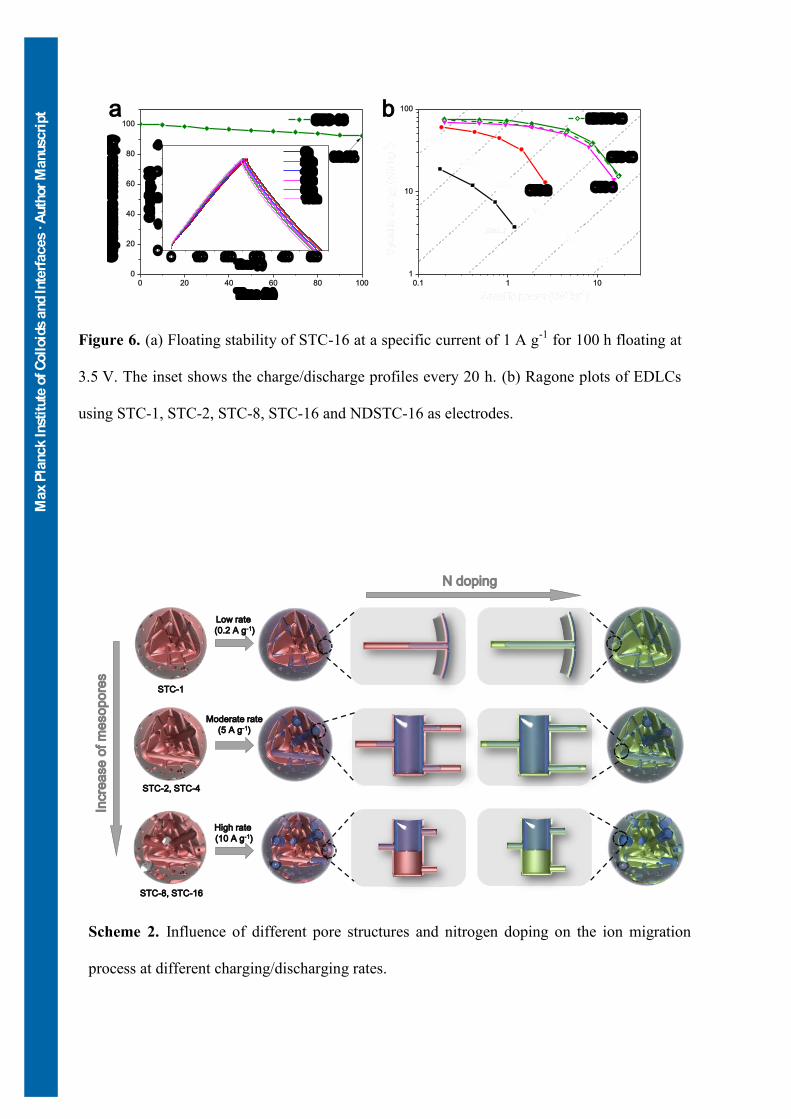
by the nitrogen doping is observed (Figure 5c). This mechanism also explains the decreasing influence of nitrogen doping on the rate capabilities with the increase of the ZnCl2 (Figure 5c). It is deduced that the EDLC performance comparison between different carbon electrodes is unaffected by the electric conductivity and is exclusively dependent on the ion dynamics inside the carbon pores. Because the electric conductivities of all these STC and NDSTC electrodes approximate to each other as indicated by the intercepts along the real axis (~5 Ω) in the EIS measurement (Figure S6b and Figure S7p-t), which is ascribed to their similar degree of aromatization as already reflected by the Raman spectroscopy (Figure S4 and Table S1). With the highest capacitance and best rate capability among all the samples, STC-16 was selected as the model material to test stability and calculate its specific energy/power. The stability was measured by the voltage floating test, a more demanding benchmarking to survey the electrochemical performance stability compared to voltage cycling.[25] The cell voltage was held at 3.5 V for 100 h and interrupted by cycling at 1 A g−1 after every 10 h. This approach provides a more strict condition than voltage cycling, which means an EDLC cell is more likely to undergo failure during floating test. A high electrochemical stability of STC-16 was revealed by the desirable capacitance retention of more than 92% (significantly above the industry-relevant level of 80%[25]) and the almost unchanged GCPL curves (Figure 6a). In addition, after cycling at a high charging/discharging rate at 10 A g-1 for 10,000 cycles, capacitance retention over 90% is obtained, indicating its admirable cycling stability at such a high rate. The Ragone plot (Figure 6b) of EDLCs using STC-16 as electrodes with a mass loading of 4.8 mg cm-2 shows that the symmetric cells provide the maximum specific energy of 76 Wh kg-1 (32 Wh L-1) at a specific power of 0.2 kW kg-1 (0.09 kW L-1), with a slight drop to 72 Wh kg-1 (31 Wh L-1) at 1 kW kg-1 (0.43 kW L-1), and still maintains 39 Wh kg-1 (17 Wh L-1) at a specific power of 9 kW kg-1 (3.9 kW L-1). The specific
Max Pla
nck Ins
titute of
Colloid
s and In
terfaces
· Author
Manus
cript
14
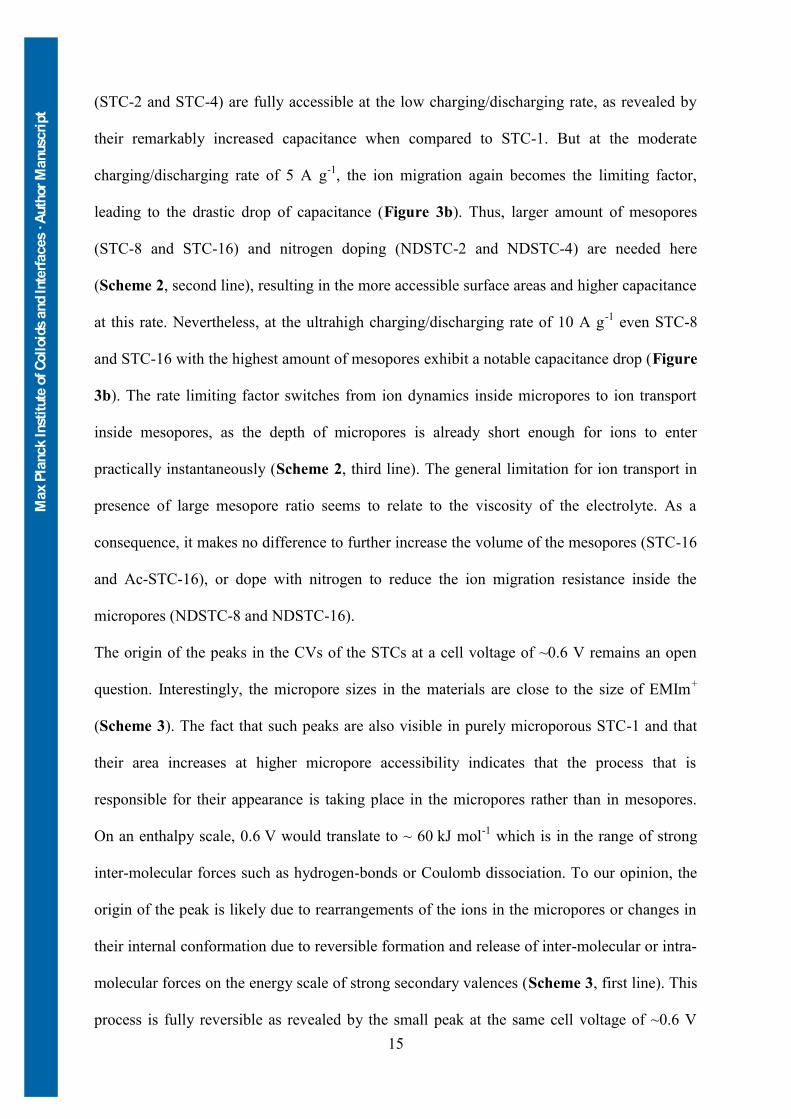
energy is indeed one order of magnitude higher than that of commercial EDLCs, without losing the excellent power capability. This outstanding property is attributed to the optimized pore architecture with all micro- and mesopores, plus the access of a new mode of charge storage, in the volume of the IL rather than only surface double layer compression as it will be discussed below. Furthermore, the correlation of micropores and mesopores to the EDLC performance is also revealed in Ragone plots (Figure 6b). The purely microporous STC-1 shows the worst performance due to the poor accessibility of the micropores to electrolyte ions. With the introduction of mesopores and the increase of their volume, STC-2 and STC-8 exhibit an apparent trend of improvement in both specific power and energy. On the other hand, the performance especially the power density of the STC-8, STC-16, and NDSTC-16 is similar to each other, indicating the further argument of mesopore content or doping with nitrogen have little influence when the ratio of mesopores to micropores surpasses a threshold value of 3:1 in volume. 3. Discussion Base on the above results, we propose a model (Scheme 2) to explain how the pore structure and surface chemistry affect the ion migration as well as the structural rearrangements in the bulk electrolyte, thus contributing to the EDLC performance. The inferior EDLC performance of purely microporous carbon (STC-1) even during the quasi-equilibrium charging/discharging process at 0.2 A g-1 is ascribed to the poor micropore accessibility caused by the high mobility resistance inside micropores, which can be relieved by introducing mesopores and improving wettability/enlarging micropores, respectively (Scheme 2, first line). Therefore, STC-2 and STC-4 with more mesopores (Figure 3a-c), NDSTC-1 with improved wettability (Figure S7f and k), as well as Ac-STC-1 with larger micropores (Figure S11) exhibit a noticeable enhancement in both specific capacitance and rate capabilities. In comparison, the micropores in the hierarchical micro-mesoporous carbon
Max Pla
nck Ins
titute of
Colloid
s and In
terfaces
· Author
Manus
cript
a b
0.1 1 10
1
10
100
NDSTC-16
STC-8
STC-16
STC-2
0.4s
Sp
ecific
en
erg
y (
Wh
kg
-1)
Specific power (kW kg-1)
2s
1000s
240s
50s
10s
STC-1
0 20 40 60 80 100
0
20
40
60
80
100
0 100 200 300 400 5000
1
2
3
4
Ca
pa
cita
nce
re
ten
tio
n (
%)
Time (h)
STC-16
92.1% 0h
20h
40h
60h
80h
100h
Cell
voltage (
V)
Time (s)
Figure 6. (a) Floating stability of STC-16 at a specific current of 1 A g-1 for 100 h floating at3.5 V. The inset shows the charge/discharge profiles every 20 h. (b) Ragone plots of EDLCsusing STC-1, STC-2, STC-8, STC-16 and NDSTC-16 as electrodes.
Scheme 2. Influence of different pore structures and nitrogen doping on the ion migration process at different charging/discharging rates.
STC-1
STC-2, STC-4
STC-8, STC-16
Incre
ase
of m
eso
po
res
N doping
Low rate
(0.2 A g-1)
Moderate rate
(5 A g-1)
High rate
(10 A g-1)
Max Pla
nck Ins
titute of
Colloid
s and In
terfaces
· Author
Manus
cript
15
(STC-2 and STC-4) are fully accessible at the low charging/discharging rate, as revealed by their remarkably increased capacitance when compared to STC-1. But at the moderate charging/discharging rate of 5 A g-1, the ion migration again becomes the limiting factor, leading to the drastic drop of capacitance (Figure 3b). Thus, larger amount of mesopores (STC-8 and STC-16) and nitrogen doping (NDSTC-2 and NDSTC-4) are needed here (Scheme 2, second line), resulting in the more accessible surface areas and higher capacitance at this rate. Nevertheless, at the ultrahigh charging/discharging rate of 10 A g-1 even STC-8 and STC-16 with the highest amount of mesopores exhibit a notable capacitance drop (Figure 3b). The rate limiting factor switches from ion dynamics inside micropores to ion transport inside mesopores, as the depth of micropores is already short enough for ions to enter practically instantaneously (Scheme 2, third line). The general limitation for ion transport in presence of large mesopore ratio seems to relate to the viscosity of the electrolyte. As a consequence, it makes no difference to further increase the volume of the mesopores (STC-16 and Ac-STC-16), or dope with nitrogen to reduce the ion migration resistance inside the micropores (NDSTC-8 and NDSTC-16). The origin of the peaks in the CVs of the STCs at a cell voltage of ~0.6 V remains an open question. Interestingly, the micropore sizes in the materials are close to the size of EMIm+ (Scheme 3). The fact that such peaks are also visible in purely microporous STC-1 and that their area increases at higher micropore accessibility indicates that the process that is responsible for their appearance is taking place in the micropores rather than in mesopores. On an enthalpy scale, 0.6 V would translate to ~ 60 kJ mol-1 which is in the range of strong inter-molecular forces such as hydrogen-bonds or Coulomb dissociation. To our opinion, the origin of the peak is likely due to rearrangements of the ions in the micropores or changes in their internal conformation due to reversible formation and release of inter-molecular or intra-molecular forces on the energy scale of strong secondary valences (Scheme 3, first line). This process is fully reversible as revealed by the small peak at the same cell voltage of ~0.6 V
Max Pla
nck Ins
titute of
Colloid
s and In
terfaces
· Author
Manus
cript
16
during discharging in the CV curves (Figure 3a) and the superior stability (Figure 6a). It can thus be concluded that the actual energy storage mechanism in EDLCs with IL electrolytes is based on contributions of double-layer formation plus energy stored by solvation of single IL units and their placement in appropriately sized micropores, which is also in agreement with some literature.[18a, 18b] In the case of the NDSTCs with the same micropore size, the ion-pore wall interactions are likely to be stronger and more diverse caused by the (weakly) nitrogen-doped polar surface.[7b] In this case, the relative energy change throughout pore integration is lower and also distributed, and thus a narrow peak due to molecular rearrangements of IL ions in the micropores is not observed (Scheme 3, second line). However, also in this case the specific binding between carbon and IL ions will contribute to energy storage in the electrode in addition to double-layer formation. Considering that, it makes sense that hierarchical micro- and mesoporous STCs and NDSTCs show comparable capacities under quasi-equilibrium conditions although their energy storage mechanisms suggested by the CVs seem to be different at first glance. The fact that changes in the molecular and intermolecular structure of the ILs also contribute to the energy storage in the mesopores is, as smeared over the whole voltage range, maybe less obvious, but even more relevant for the practical use of such supercapacitors. In addition to the (later vanishing) peaks at ~0.6 V during charging and discharging, the overall charge density is simply too high for ordinary double layers, plus there is another pronounced peak at very high voltage in the CVs of all mesopore-containing materials discussed here not related to material degradation (Figure 3). This voltage, when put on a single molecule, would translate to a much higher enthalpy of above 300 kJ mol-1 which is ten times the value of a typical heat of vaporization, i.e. the resolution of all intermolecular forces. This makes it clear that such transitions must be related to collective properties and in structural transitions in the bulk of the IL rather than in the electrolyte-carbon interface.

Max Pla
nck Ins
titute of
Colloid
s and In
terfaces
· Author
Manus
cript
Scheme 3. Proposed mechanism of the ion conformation change inside micropores, causing the emergence of the small peaks in the CV curves of STCs and their disappearance in case of NDSTCs and Ac-STCs.
STC
NDSTC
Cell voltage = 0 V Cell voltage = 0.6 V
N d
op
ing
Original conformation Metastable conformation
Metastable conformation Metastable conformation
Ion
conformation
unchanged
Ion
conformation
changed
Max Pla
nck Ins
titute of
Colloid
s and In
terfaces
· Author
Manus
cript
17
A cell voltage of 3.5 V and specific capacitance up to 178 F g-1 relates to a stored charge of 623 C g-1. This is remarkable considering the huge size of the ions of IL electrolytes. It is illustrative to calculate the surface area occupied by one charge. Taking STC-16 as an example, the large EMIm+ ions (0.76 × 0.43 nm) must be attributed to a calculated surface area per ion of 0.6 nm2 which is already very close to the molecular dimensions of these ions, implying a close to dense layer of cations on the carbon surface. In STC-2 with a lower mesopore ratio, EMIm+ ions are formally even attributed to a calculated area of only 0.44 nm2. Such a high double-layer compression appears to be unrealistic for large IL ions in absence of solvent molecules. In contrast to aqueous and organic electrolytes, the density of cations and anions in ionic liquids should stay close to the bulk value, i.e. the energy is essentially not stored in ion compression, but rather in ion rearrangement towards Coulombic higher voltage situations, which obviously can propagate about nanometers into the bulk. We do not doubt contribution of double-layer formation on carbon surfaces to the energy storage in IL electrolytes in general but from our results we conclude the absence of double-layer compression as present in aqueous and organic electrolytes, as it has already been shown.[1d, 17] Instead, there seems to be a strong contribution of structural changes in the bulk phase of the ILs to the energy storage mechanism in EDLCs. This indeed would request a paradigm change of energy storage, as then the majority of energy is not stored in micropores (and cannot be related to a high specific surface area), but rather in appropriately designed mesopores which enable high energy Coulombic rearrangements of the IL in the bulk. In these mesopores, the structural changes of IL ions can be rather assigned to disorder-order transitions in the bulk of the electrolyte than interactions between single ions and the surface, as it is likely the case in micropores. It has been shown that the present family of bulk IL are actually liquid crystals and the peak could, for instance, originate from the formation and disappearance of differently organization schemes of the bulk IL in mesopores.[26] According to this view, such contributions cannot be observed in
Max Pla
nck Ins
titute of
Colloid
s and In
terfaces
· Author
Manus
cript
18
microporous STC-1 and NDSTC-1, and their intensity increases with larger mesopore contribution in the carbon materials. The process is fully reversible as indicated by the high stability of the devices and the nearly perfect symmetrical charge-discharge curves at low current densities. Based on the present data, we regard it as experimentally proven that the energy storage mechanism in such ionic liquid supercapacitors significantly deviates from the traditional theory of double-layer compression as present in aqueous and organic electrolytes and that there is a notable contribution of ion-ion rearrangements in the bulk of the ionic liquids to the energy storage mechanism in IL-based EDLCs. 4. Conclusion A series of hierarchical porous carbon with different amounts of well-defined micropores and mesopores, large specific surface areas up to 2324 m2 g-1 and high pore volumes exceeding 1.65 cm3 g-1 was synthesized. The pore structure, electronic properties, and surface chemistry of the electrode materials is adjusted elaborately by tailoring the ratio of salt templates to carbon precursor and doping with nitrogen, so that the influence of these parameters to EDLC performance could be thoroughly investigated in a homogeneous set of samples. EDLCs based on STC electrodes achieve high specific capacitance of 178 F g-1 at 0.2 A g-1 as well as excellent rate capability (140 F g-1 at 10 A g-1) combined with an admirable stability, using the ionic liquid model electrolyte of EMImBF4 with the voltage window of 0-3.5 V. In terms of ion dynamics, a model is proposed, where the increasing amount of mesopores and nitrogen doping can promote the EDLC performance only when the ion dynamics inside micropores areas are the rate limiting factor. Ion dynamics inside mesopores commence to limit the EDLC performance at ultrahigh rates when the ratio of mesopores to micropores surpasses 3:1 in volume. Above this ratio, either increase of mesopores or nitrogen doping will have little influence.

Max Pla
nck Ins
titute of
Colloid
s and In
terfaces
· Author
Manus
cript
19
Moreover, a peak in the CV curves of the STCs was observed, and ascribed to an ion conformation change inside micropores during the charging/discharging process. Such additional energy storage due to ion conformation change (i.e., the formation of a metastable phase) is also taking place in NDSTCs but is not observed as peak in the CVs due to the stronger interactions of the IL molecules with the carbon surface leading to non-equilibrium conformation of IL ions before charging. A comparable mechanism in mesopores can be deduced from the formally too-high Coulombic loading and an onset of another peak in the CVs apparent at higher voltages, both related to bulk structural changes simply by the amount of energy involved. The precise insights into structure-performance relationships enabled by our series of samples let us conclude that there is a significant contribution to energy storage due to molecular rearrangements and phase changes into the bulk of the electrolytes in addition to charge storage in the electric double layer. Decoupling their respective contributions in carbon materials with different pore sizes and surface chemistries holds much promise for further targeted improvement of IL-based energy storage devices. Based on our findings, the introduction of specific adsorption sites to strengthen the electrode-electrolyte interaction and thus to stabilize high energy electrolyte modifications is a more promising way to further increase the energy density of EDLCs than striving for ever-higher micropore volumes and SSAs. Finally, the uncovered mechanism offers new possibilities in modifying and optimizing the energy storage mechanisms in IL-based supercapcitors by controlled adjustments of the electrolyte composition (i.e., presence of traces of inorganic salts, traces of solvents, or variations of the ionic liquid ions themselves). 5. Experimental Section Synthesis of STCs: ZnCl2 was employed as the salt template for the synthesis of STCs. In a typical process, 30 mL aqueous solution of 5 g sucrose, a certain amount of ZnCl2 and 0.55 g
Max Pla
nck Ins
titute of
Colloid
s and In
terfaces
· Author
Manus
cript
20
concentrated sulfuric acid was dried at 100 °C for 6 h, before being heated to 160 °C and kept for 6 h. The amount of ZnCl2 is determined by the mass ratio of the salt template to sucrose regarding different STCs (Table 1). The mixture was then transferred to a horizontal tubular furnace for carbonization at 900 °C for 2 h under N2 flow with heating rate of 1 °C min-1. Synthesis of NDSTCs: The STC was dispersed in the aqueous solution of cyanamide (1 g mL-
1) with the mass ratio of STC to cyanamide of 1:2, followed by drying at 60 °C for 12 h under air. After calcination of the mixture at 800 °C for 4 h under N2 flow at with a heating rate of 1 °C min-1, the corresponding NDSTC was obtained. Synthesis of Ac-STCs: Ac-STCs were synthesized by CO2 activation of the STCs. Typically, a certain amount of the as-prepared STC was put in a horizontal tubular furnace for thermal treatment at 800 °C for 0.5 h under CO2 flow with a heating rate of 10 °C min-1 to get the corresponding Ac-STC. Material characterization: N2 physisorption experiments were carried out at -196 °C on a Quadrasorb apparatus (40-60 mg sample) from Quantachrome Instruments. Prior to all measurements, the samples were outgassed at 150 °C for 20 h under vacuum. SSAs were calculated using the multi-point Brunauer-Emmett-Teller (BET) model (p/p0 = 0.05-0.2). Total pore volumes (Vt) were determined at p/p0 = 0.95. Pore size distributions were calculated using the quenched-solid density functional theory (QSDFT) method (adsorption branch kernel) for N2 adsorbed on carbon with a slit/cylindrical pore shape at -196 °C from the data obtained by the low-pressure measurements. CO2 physisorption experiments were carried out at 0 °C on the same instrument to investigate the pores with the diameter smaller than 1.5 nm. Corresponding PSDs were calculated by the non-local density functional theory (NLDFT) method for CO2 adsorbed on carbon at 0 °C. X-ray photoelectron spectroscopy (XPS) was performed on a spectrometer equipped with AlKα anode (hυ = 1486.6 eV). Elemental compositions were determined using survey scans over a range of 1350-0 eV with a step size of 1.0 eV and a pass energy of 200 eV.

Max Pla
nck Ins
titute of
Colloid
s and In
terfaces
· Author
Manus
cript
21
Quantitative characterization of the presence of various nitrogen and oxygen sites were accomplished with high-resolution XPS, scanning over a range of 410-392 eV and 544-524 eV, respectively, with a step size of 0.1 eV and pass energy of 50 eV. Further structural characterization was carried out by transmission electron microscopy (TEM, EM 912 Omega/Carl-Zeiss Oberkochen) operating at 120 kV. To prepare the TEM samples, carbon particles were dispersed in ethanol by sonication for 10 min, followed by dropping several droplets on a carbon-coated copper TEM grid and drying at room temperature. Raman spectra were recorded using a Witec Raman Microscope operating at an excitation wavelength of 532 nm with a power of 4.0 mW. After the background noise was subtracted from the obtained Raman spectra, the D, D2, A, and G bands were fitted with a Lorentz function. Thermogravimetric analysis (TGA) was conducted with a Netzsch TG 209 F1 device under constant artificial air flow in platinum pans at a heating rate of 10 °C min-1 to 1000 °C. Fabrication of EDLCs and electrochemical measurements: To prepare free-standing electrodes for EDLCs, carbon materials and polytetrafluoroethylene (PTFE, 60 wt% solution in H2O from Sigma Aldrich) were mixed with a mass ratio of ~9:1 in ethanol. The solution was then transferred to a glass plate and mixed with razor blades until it changed to a rubber-like consistency. Then it was placed into aluminum foil and rolled to uniformly thin sheets (thicknesses 120±10 µm) using a commercial roll mill, followed by punching into free-standing electrode disks of 10 mm in diameter. The areal loading of an electrode was above 3 mg cm-2. The electrodes were dried at 120 °C for 12 h under vacuum. EDLCs were tested with a symmetrical two-electrode configuration employing either the ionic liquid 1-ethyl-3-methylimidazolium tetrafluoroborate (EMImBF4, ≥99.0%, Sigma Aldrich) or 1 M Na2SO4 in H2O as the electrolyte. A Swagelok cell was assembled using a pair of circular electrodes sandwiching a separator (Dreamweaver Silver, 13 mm in diameter), with 20 µL electrolyte and two platinum foils as current collectors. For the test in three-electrode configuration,

Max Pla
nck Ins
titute of
Colloid
s and In
terfaces
· Author
Manus
cript
22
another piece of PVDF-bound activated carbon was introduced from the side to a custom-made cell[27] and served as quasi-reference electrode (reference potential: 190 ± 10 mV versus ferrocene).[27] The counter electrode was made of PTFE-bound NDSTC-16 and largely oversized in charge capacity. All other test conditions are chosen similar to the two-electrode configuration. The EDLCs with IL as electrolytes were assembled in an argon filled glove box (H2O < 0.1 ppm, O2 < 0.1 ppm). A Biologic MPG-2 galvanostat/potentiostat was used for electrochemical characterization. All measurements were performed at room temperature. The electrochemical impedance spectroscopy was performed at open circuit potential with a sinusoidal signal over a frequency range from 20 kHz to 10-2 Hz at an amplitude of 10 mV. Cyclic voltammetry (CV) tests were performed at scan rates of 2-100 mV s-1. The carbon differential gravimetric capacitance for CV plots, Cd (F g-1) was calculated according to the following equations:
𝐶𝑑 =2𝐼
𝑚𝛾 (1)
where 𝐼 is the current (A), 𝛾 is the scan rate (V s-1), and 𝑚 is the active mass in a single carbon electrode (g). Galvanostatic charge/discharge with potential limitation (GCPL) was applied at specific currents between 0.2 and 10 A g-1 in a voltage range from 0 to +3.5 V. The carbon gravimetric capacitance, C (F g-1), was calculated according to the following equation:
𝐶 =2𝑄𝑑𝑖𝑠
(𝑉−𝑉𝑑𝑟𝑜𝑝)𝑚 (2)
where 𝑄𝑑𝑖𝑠 (C) is the charge of the discharging cycle, 𝑉 (V) is the discharging potential change, 𝑉𝑑𝑟𝑜𝑝 (V) is the voltage drop at the beginning of the discharge, and 𝑚 (g) is the active mass in a single carbon electrode. The specific energy, E (Wh kg-1) and specific power, P (W kg-1) of EDLCs were estimated via:
𝐸 =1
8×3.6𝐶(𝑉 − 𝑉𝑑𝑟𝑜𝑝)
2 (3)
Max Pla
nck Ins
titute of
Colloid
s and In
terfaces
· Author
Manus
cript
23
𝑃 =𝐸×3600
∆𝑡 (4)
where 𝑉 (V) is the discharging potential change, 𝑉𝑑𝑟𝑜𝑝 (V) is the voltage drop at the beginning of the discharge, ∆𝑡 (s) is the discharging time. For long-term stability tests, the voltage of the cell was kept at 3.5 V for 100 h, and the specific capacity was measured every 10 h by galvanostatic cycling at 1 A g-1. In addition, the cycling stability test is accomplished by charging and discharging the cell at a specific current of 10 A g-1 for 10,000 cycles. Supporting Information Supporting Information is available from the Wiley Online Library or from the author. Acknowledgements R.Y. acknowledges financial support from China Scholarship Council. All authors thank Dr. Johannes Schmidt (Technical University Berlin, Group of Functional Materials lead by Prof. Dr. Arne Thomas) for providing the XPS data. Received: ((will be filled in by the editorial staff)) Revised: ((will be filled in by the editorial staff)) Published online: ((will be filled in by the editorial staff)) References [1] a) P. Simon, Y. Gogotsi, Acc. Chem. Res. 2012, 46, 1094; b) G. Wang, L. Zhang, J. Zhang, Chem. Soc. Rev. 2012, 41, 797; c) J. R. Miller, P. Simon, Science 2008, 321, 651; d) M. Salanne, B. Rotenberg, K. Naoi, K. Kaneko, P. L. Taberna, C. P. Grey, B. Dunn, P. Simon, Nat. Energy 2016, 1; e) P. Simon, Y. Gogotsi, Nat. Mater. 2008, 7, 845. [2] a) L. Borchardt, M. Oschatz, S. Kaskel, Mater. Horiz. 2014, 1, 157; b) H. Jiang, P. S. Lee, C. Li, Energ Environ Sci 2013, 6, 41. [3] a) C. Zhong, Y. D. Deng, W. B. Hu, J. L. Qiao, L. Zhang, J. J. Zhang, Chem. Soc. Rev. 2015, 44, 7484; b) K. L. Van Aken, M. Beidaghi, Y. Gogotsi, Angewandte Chemie International Edition 2015, 54, 4806. [4] a) M. Davenport, A. Rodriguez, K. J. Shea, Z. S. Siwy, Nano Lett. 2009, 9, 2125; b) C. Pean, C. Merlet, B. Rotenberg, P. A. Madden, P. L. Taberna, B. Daffos, M. Salanne, P. Simon, ACS Nano 2014, 8, 1576; c) N. N. Rajput, J. Monk, R. Singh, F. R. Hung, J. Phys. Chem. C 2012, 116, 5170. [5] Y. D. He, R. Qiao, J. Vatamanu, O. Borodin, D. Bedrov, J. S. Huang, B. G. Sumpter, J Phys Chem Lett 2016, 7, 36. [6] a) S. Kondrat, P. Wu, R. Qiao, A. A. Kornyshev, Nat. Mater. 2014, 13, 387; b) S. Kondrat, A. A. Kornyshev, Nanoscale Horiz 2016, 1, 45; c) C. Iacob, J. R. Sangoro, P.

24
Papadopoulos, T. Schubert, S. Naumov, R. Valiullin, J. Karger, F. Kremer, Phys. Chem. Chem. Phys. 2010, 12, 13798. [7] a) R. Singh, J. Monk, F. R. Hung, J. Phys. Chem. C 2011, 115, 16544; b) R. Singh, N. N. Rajput, X. X. He, J. Monk, F. R. Hung, Phys. Chem. Chem. Phys. 2013, 15, 16090; c) J. Monk, R. Singh, F. R. Hung, J. Phys. Chem. C 2011, 115, 3034. [8] Y. D. He, J. S. Huang, B. G. Sumpter, A. A. Kornyshev, R. Qiao, J Phys Chem Lett 2015, 6, 22. [9] N. N. Rajput, J. Monk, F. R. Hung, J. Phys. Chem. C 2012, 116, 14504. [10] a) M. Oschatz, L. Borchardt, K. Pinkert, S. Thieme, M. R. Lohe, C. Hoffmann, M. Benusch, F. M. Wisser, C. Ziegler, L. Giebeler, M. H. Rümmeli, J. Eckert, A. Eychmüller, S. Kaskel, Adv. Energy Mater. 2014, 4, 1300645; b) M. Oschatz, S. Boukhalfa, W. Nickel, J. T. Lee, S. Klosz, L. Borchardt, A. Eychmuller, G. Yushin, S. Kaskel, J. Mater. Chem. A 2014, 2, 5131; c) R. Yan, T. Heil, V. Presser, R. Walczak, M. Antonietti, M. Oschatz, Advanced Sustainable Systems 2017, 1700128; d) M. Oschatz, S. Boukhalfa, W. Nickel, J. P. Hofmann, C. Fischer, G. Yushin, S. Kaskel, Carbon 2017, 113, 283. [11] A. C. Forse, C. Merlet, P. K. Allan, E. K. Humphreys, J. M. Griffin, M. Aslan, M. Zeiger, V. Presser, Y. Gogotsi, C. P. Grey, Chem. Mater. 2015, 27, 6848. [12] a) J. H. Hou, C. B. Cao, F. Idrees, X. L. Ma, ACS Nano 2015, 9, 2556; b) J.-K. Ewert, D. Weingarth, C. Denner, M. Friedrich, M. Zeiger, A. Schreiber, N. Jäckel, V. Presser, R. Kempe, J. Mater. Chem. A 2015, 3, 18906. [13] P. Wu, J. S. Huang, V. Meunier, B. G. Sumpter, R. Qiao, J Phys Chem Lett 2012, 3, 1732. [14] a) M. D. Levi, N. Levy, S. Sigalov, G. Salitra, D. Aurbach, J. Maier, J. Am. Chem. Soc. 2010, 132, 13220; b) W.-Y. Tsai, P.-L. Taberna, P. Simon, J. Am. Chem. Soc. 2014, 136, 8722. [15] A. C. Forse, J. M. Griffin, C. Merlet, P. M. Bayley, H. Wang, P. Simon, C. P. Grey, J. Am. Chem. Soc. 2015, 137, 7231. [16] F. W. Richey, B. Dyatkin, Y. Gogotsi, Y. A. Elabd, J. Am. Chem. Soc. 2013, 135, 12818. [17] A. C. Forse, C. Merlet, J. M. Griffin, C. P. Grey, J. Am. Chem. Soc. 2016, 138, 5731. [18] a) D. E. Jiang, J. Z. Wu, J Phys Chem Lett 2013, 4, 1260; b) C. Merlet, B. Rotenberg, P. A. Madden, P. L. Taberna, P. Simon, Y. Gogotsi, M. Salanne, Nat. Mater. 2012, 11, 306; c) S. Kondrat, C. R. Perez, V. Presser, Y. Gogotsi, A. A. Kornyshev, Energ Environ Sci 2012, 5, 6474; d) Y. Shim, H. J. Kim, ACS Nano 2010, 4, 2345; e) C. Largeot, C. Portet, J. Chmiola, P.-L. Taberna, Y. Gogotsi, P. Simon, J. Am. Chem. Soc. 2008, 130, 2730. [19] a) N. Fechler, T. P. Fellinger, M. Antonietti, Adv. Mater. 2013, 25, 75; b) N. Fechler, S.-A. Wohlgemuth, P. Jäker, M. Antonietti, J. Mater. Chem. A 2013, 1, 9418. [20] J. Zhong, J. J. Deng, B. H. Mao, T. Xie, X. H. Sun, Z. G. Mou, C. H. Hong, P. Yang, S. D. Wang, Carbon 2012, 50, 335. [21] M. Li, W. Li, S. X. Liu, Carbohydr. Res. 2011, 346, 999. [22] a) M. Oschatz, P. Pré, S. Dörfler, W. Nickel, P. Beaunier, J.-N. Rouzaud, C. Fischer, E. Brunner, S. Kaskel, Carbon 2016, 105, 314; b) S. Osswald, J. Chmiola, Y. Gogotsi, Carbon 2012, 50, 4880. [23] M. Pawlyta, J.-N. Rouzaud, S. Duber, Carbon 2015, 84, 479. [24] J. Yang, H. Wu, M. Zhu, W. Ren, Y. Lin, H. Chen, F. Pan, Nano Energy 2017, 33, 453. [25] D. Weingarth, H. Noh, A. Foelske-Schmitz, A. Wokaun, R. Kötz, Electrochim. Acta 2013, 103, 119. [26] Y. Zhou, J. H. Schattka, M. Antonietti, Nano Lett. 2004, 4, 477.

Max Pla
nck Ins
titute of
Colloid
s and In
terfaces
· Author
Manus
cript
25
[27] D. Weingarth, M. Zeiger, N. Jackel, M. Aslan, G. Feng, V. Presser, Adv. Energy Mater. 2014, 4, 1400316.