Embed Size (px)
Citation preview

SELECTED TOPICS TOWARD THE EXPERIMENTAL DESIGN OF A
WAVEGUIDE CONFINED RAMAN LASER WAVELENGTH
CONVERSION SYSTEM
by
Michael Ryan Hintzman
A professional paper submitted in partial fulfillment of the requirements for the degree
of
Master of Science
in
Electrical Engineering
MONTANA STATE UNIVERSITY Bozeman, Montana
November 2011

©COPYRIGHT
By
Michael Ryan Hintzman
2011
All Rights Reserved
ii
APPROVAL
of a professional paper submitted by
Michael Ryan Hintzman
This professional paper has been read by each member of the thesis committee and has been found to be satisfactory regarding content, English usage, format, citation,
bibliographic style, and consistency and is ready for submission to The Graduate School.
Dr. Joseph Shaw
Approved for the Department of Electrical & Computer Engineering
Dr. Robert Maher
Approved for The Graduate School
Dr. Carl A. Fox

iii
STATEMENT OF PERMISSION TO USE
In presenting this thesis in partial fulfillment of the requirements for a master’s
degree at Montana State University, I agree that the Library shall make it available to
borrowers under rules of the Library.
If I have indicated my intention to copyright this professional paper by including
a copyright notice page, copying is allowable only for scholarly purposes, consistent with
“fair use” as prescribed in the U.S. Copyright Law. Requests for permission for extended
quotation from or reproduction of this thesis in whole or in parts may be granted only by
the copyright holder.
Michael Ryan Hintzman November 2011

iv
ACKNOWLEDGMENTS
I would like to acknowledge my advisor, Dr. Joseph Shaw, who guided me in my
classes, and my project advisor, Dr. Zeb Barber, who allowed me to work on the project
and assisted me with understanding the project goals. I would also like to acknowledge
Dr. Randy Reibel for guiding me and helping me with growing my laboratory skill set. I
would finally like to acknowledge Christoffer Renner, who has been a valuable source of
knowledge with experimental setups and techniques that greatly helped me.

v
TABLE OF CONTENTS
1. INTRODUCTION ...........................................................................................................1
Problem and Motivation ..................................................................................................1 Role in Project and Other Proposed Solutions .................................................................3
2. EXPERIMENTAL SETUP AND LASER DESIGN .......................................................5
Introduction ......................................................................................................................5 Experimental Setup ..........................................................................................................5
3. COUPLING A LASER BEAM INTO A HOLLOW CORE CAPILLARY ...................9 Introduction ......................................................................................................................9 Theory ..............................................................................................................................9 Experimental Setup ........................................................................................................12 Results ............................................................................................................................15 Discussion ......................................................................................................................16 Conclusion .....................................................................................................................18
4. SECOND HARMONIC GENERATION USING A KTP CRYSTAL .........................20
Introduction ....................................................................................................................20 Theory ............................................................................................................................20 Experimental Setup ........................................................................................................22 Results ............................................................................................................................24 Discussion ......................................................................................................................25 Conclusion .....................................................................................................................26
5. DIFFRACTION GRATING TO SEPARATE THE LASER WAVELENGTHS .........28
Introduction ....................................................................................................................28 Theory ............................................................................................................................28 Experimental Setup ........................................................................................................29 Results ............................................................................................................................30 Discussion ......................................................................................................................31 Conclusion .....................................................................................................................32
6. RAMAN CONVERSION ..............................................................................................34
Background ....................................................................................................................34 Results and Discussion ..................................................................................................35

vi
TABLE OF CONTENTS - CONTINUED 7. CONCLUSION ..............................................................................................................37 REFERENCES CITED ......................................................................................................38

vii
LIST OF TABLES
Table Page
3.1 Y-Int (%) and Alpha for Data Sets ..................................................................16
4.1 Incident Power from 1064-nm Laser onto KTP Crystal ..................................25
5.1 Calculated Angles off a 600 Lines/mm Grating ..............................................29
5.2 Measured Reflected Angles off Diffraction Grating for 1064 nm ...................31

viii
LIST OF FIGURES
Figure Page
1.1 Experimental Flow Chart ...................................................................................4
2.1 Laser Amplification Setup .................................................................................6
2.2 Laser Coupling Setup .........................................................................................7
3.1 Theoretical Transmission vs. Waveguide Length for light propagating through an optical waveguide.. ...........................................12
3.2 Lab Bench Setup to Couple into a Glass Capillary. ........................................13
3.3 Custom V-Block Mounts on Pedestals. ..........................................................14
3.4 Plot of Transmittance vs. Capillary Length. ...................................................15
4.1 Entrance Angle vs. Normalized Intensity. ......................................................22
4.2 Lab Bench Setup for Frequency Doubling. ....................................................23
4.3 Entrance Angle vs. Normalized Intensity with Fit. .........................................24
5.1 Lab Bench Setup for Diffraction Grating Experiment for Incident Angle 0°. .....................................................................................30
5.2 Graphical Display of Angle Sign Convention. ...............................................31
6.1 Raman Conversion Energy Levels. .................................................................34
6.2 Visible Camera anti-Stokes Conversion Wavelengths. ..................................35
6.3 Infrared Camera anti-Stokes Conversion Wavelengths. .................................36

ix
ABSTRACT
As an alternative to current visible variable-wavelength lasers, a Raman conversion laser system was studied using a hollow-core capillary. A pulsed Nd:YAG laser is frequency doubled to 532 nm using a KTP crystal prior to coupling into the capillary that is pressurized from 0 PSI to 100 PSI with either CO2 or H2 gas. The KTP crystal is then removed and found that the 1064 nm laser light is phase-matched when coupled into the capillary. The phase-matched coupled light produces observable third anti-Stokes light, while suppressing the higher Stokes conversion light. The methods used to couple a laser beam into a hollow-core glass capillary, examination of the acceptance angle of a KTP crystal, and the Raman conversion wavelengths due to 1064 nm laser pulses are documented in this paper.

1
CHAPTER 1 – INTRODUCTION
Problem and Motivation
A need recently arose at the Montana State University (MSU) Spectrum Lab for a
laser system that is capable of producing high-energy laser pulses, with a top hat
temporal pulse profile, at adjustable visible wavelengths. The emphasis is on the need for
high-energy laser pulses with a variable visible wavelength. The United States Navy has
asked for solutions to this problem to be used for on-board ship defense against incoming
missiles and reconnaissance drones. The idea is that the laser pulses will disrupt and/or
destroy the imaging sensor that the missile uses for targeting, or that the laser pulses will
blind the imaging sensor used by the drone for reconnaissance. In order to prevent the
image sensor from easily negating the laser pulse by inserting a band-rejection filter, the
Navy has also requested that the laser system be able to generate a variety of wavelengths
in the visible spectrum. The Navy requested a laser to be developed that produces a
visible laser pulse outside of the 510 nm to 550 nm wavelength band, with power in
excess of 50 mJ per pulse, a pulse duration in the range of 100 to 200 ns, and with
excellent spatial beam quality (M2<2) [1].
To achieve the high power and variable wavelength goals, several different laser
systems could have been considered before the Raman scattering system was selected by
MSU-Spectrum Lab. These laser systems include dye lasers, second harmonic generation
of a tunable near infrared laser, free electron lasers, and an optical parametric oscillator
(OPO) laser based on the 3rd harmonic of the common 1064 nm Nd:YAG laser. The dye

2
laser is not an attractive option because the laser medium is a known carcinogen, causing
extra hazards that would need to be accounted for. Another drawback of the dye laser is
that the system is bulky and messy, as the dye must be poured into a reservoir in the laser
system.
The use of a tunable near infrared laser that is frequency doubled could also be
considered as a potential laser system. However, these systems are less desirable because
of the limited number of visible wavelengths that it is capable of obtaining. There have
been tunable laser systems developed using this technique capable of a wavelength range
from 300 nm to 970 nm; however, these systems have low energy per pulse, for example,
870 nJ at 14 fs pulse duration [2].
Another solution to the problem pursued by the Navy is the free electron laser.
This type of laser is capable of producing the desired energy levels at a wide range of
wavelengths. The laser requires a large area to propel the electrons such that photons are
produced at the designed wavelength. This results in excessive physical size and
complexity, which makes it totally inappropriate for this application. Recent
developments have decreased the physical size of free-electron lasers, the other laser
system choices still possess a significantly smaller bench footprint.
An OPO that is pumped with a frequency tripled NIR source could possibly be the
best laser system to use for this study. One OPO system is capable of producing 1.2 mJ in
the 245 to 260 nm range, 4.8 mJ at 355 nm, and 8.8 mJ at 532 nm at pulse lengths of
4 ns [3]. This system also exceeded the beam quality factor specification with an M2
value of 1.5. However, Spectrum Lab experience led to the decision to instead pursue a

3
Raman conversion laser system as a research study into the efficiency that could be
achieved with this new approach.
A primary motivation for investigating a laser solution based on Raman
conversion is that this approach will allow for the variable visible wavelength selection. It
has been shown that this laser system is capable of producing multiple wavelengths (1st
and 2nd Stokes conversion and 1st Anti-Stokes conversion) in the Raman medium [4]. The
Raman gas will take the stabilized pulse laser output (1064 nm or 532 nm if the beam is
frequency doubled) and convert it to a wide wavelength range depending on the pressure
of the gas, polarization, and the gas chosen.
The proposed laser system also could have other nonmilitary use in atmospheric
studies for light detection and ranging (LIDAR). Using the Raman conversion with
specific gases, the laser wavelength is able to reach from the ultraviolet to the mid-wave
infrared (~5 microns). This allows for the laser to be used in a LIDAR system that can be
operated at eye-safe wavelengths (typically > 1.5 m) for detecting a wide range of gases
in the atmosphere.
Role in Project and Other Proposed Solutions
My role in this project was to assist the program manager and Spectrum Lab
personnel with setting up the laboratory bench and running experiments. The experiments
consist of: operating and optimizing the laser source, coupling into a Raman conversion
waveguide, and separating the generated wavelengths from the source wavelength. Each

4
experiment provided me with improved skills to conduct the next experiment in the order
shown in Figure 1.1.
Figure 1.1: Experimental Flow Chart
The experiments were in line with the goals of the Navy contract and consist of me,
under the guidance of a more senior researcher, optimizing and operating the 1064 nm
laser source, coupling the laser into the capillary such that the propagating mode was the
TE01 mode for optimal Raman conversion, conducting experiments to understand the
acceptance angle of a second harmonic generation crystal, and observing the Raman
converted wavelengths using a reflection diffraction grating.

5
CHAPTER 2 – EXPERIMENTAL SETUP AND LASER DESIGN
Introduction
The laser system utilized is documented in the MSU Physics Master’s Thesis by
Stephen Scott Wagemann [5]. The laser is designed to produce a pulsed beam of 1064 nm
light. A potassium titanyl phosphate (KTP) crystal is used to double the frequency of the
light to 532 nm, which allows for Raman conversion in the visible spectrum using
hydrogen and carbon dioxide gases as the Raman medium. The beam is then spatially
filtered and the polarization is set prior to coupling into the hollow-core capillary. This
chapter discusses the lab bench setup of the laser system, as well as the experimental
setup for coupling into the hollow-core capillary.
Experimental Setup
The laser is seeded with a diode-pumped solid state laser, with the output passing
through a half-wave plate and a polarizer to control the beam power. A beam-splitter
cube is placed before an acousto-optic modulator (AOM) that is driven by a waveform
generator. The AOM and waveform generator is used to create the desired waveform
pulse. An optical isolator is used to prevent reflected light from proceeding into the seed
laser and causing unwanted feedback. The laser pulse is then double passed through a
pre-amplifier followed by two main amplifiers. An additional optical isolator is placed
before each of the main amplifiers to suppress pre-lasing in the main amplifiers. The laser
pulse is then directed into the KTP crystal, in which the pulse undergoes Second

6
Harmonic Generation to produce a wavelength of 532 nm [5]. The laser system layout is
shown in Figure 2.1 with Figure 2.2 showing the spatial filtering and coupling portion of
the setup.
Figure 2.1: Laser Amplification Setup
After second harmonic generation the laser pulse is passed through a prism to
separate the pump (1064 nm) wavelength from the Second Harmonic Generation
(532 nm) wavelength. The pulse is then passed through two spatial frequency filters to
remove energy that is present in the edges of the spatial mode. This is to ensure that the
capillary is protected from light that is not able to be coupled into the hollow core. The
light pulse, if not properly coupled into the core, can damage the glass cladding. Once the

7
Figure 2.2: Laser Coupling Setup
cladding is damaged, the coupling efficiency drops significantly and conversion in the
hollow core capillary goes to zero.
A half-wave plate is used to rotate the polarization of the light that is incident on
the polarizing beam splitter (PBS) to provide control of the power of the beam incident
on the capillary, and the quarter wave-plate controls the ellipticity of the beam coupling
into the capillary. By changing this polarization, the Raman conversion can be changed
between the vibrational (linear polarization) and rotational (circular polarization)
conversion wavelengths. To ensure that the pulse is properly coupled into the capillary,
two cameras are used and the laser is set to CW mode. One camera is used to observe the
coupling from the front of the capillary and a second camera is used to monitor the
coupling from the back of the capillary. The laser beam is steered using two beam

8
steering mirrors until a single mode is observed, indicating that the laser beam is being
efficiency coupled into the capillary for Raman conversion.
The capillary is mounted in a custom gas cell block that was designed and
machined by Spectrum Lab research associate Christopher Renner. The cell block is
constructed from aluminum, and consists of a v-block that holds the capillary in space.
The capillary is capped with an aluminum block that has a glass window on each end,
with one end having a valve to pressurize the capillary. A second gas cell is also utilized.
This gas cell pressurizes the capillary itself and the volume around the capillary. This
design reduces the strain that the custom gas cell block puts on the glass capillary. The
laser pulse is then directed onto a grating, which diffracts the seed wavelength from the
Raman converted light. An observation screen with a camera directed on it is used to
observe and record the output.

9
CHAPTER 3 – COUPLING A LASER BEAM INTO A HOLLOW CORE CAPILLARY
Introduction
The ability to control the direction of propagation for a laser beam is a unique
ability of waveguides. Most waveguides are optical fibers with solid cores, yet
waveguides can also be hollow-core capillaries, which are used in this experiment. As a
light wave couples into a waveguide, the light can propagate through the waveguide in a
variety of resonance modes determined by the waveguide geometry and optical
wavelength. Typically propagation entirely within the fundamental or lowest order mode
is desired, as this mode allows for the maximum amount of energy to be propagated
through the waveguide. This experiment will focus on how to couple a laser beam into a
hollow-core capillary and the energy loss associated with the transmission through the
waveguide.
Theory
The ability to couple a laser beam into a waveguide in the desired optical mode is
dependent upon a few key parameters. These parameters include the diameter of the
waveguide itself, the diameter of the laser beam spot, and the desired propagating mode.
In order to determine the optimal size of the beam spot, and thus which focusing optic to
use, the optimal beam waist is calculated using the ratio of the beam waist, ω, and the
core radius, a. For a minimum loss through the waveguide, the ratio ω a⁄ is desired to be
0.64 as this is the point when the propagating mode of a Gaussian laser beam mode

10
closely matches with the waveguide [6]. When the laser beam is mode matched with the
waveguide, the maximum amount of power is coupled into the waveguide.
Coupling the laser beam into the waveguide such that it is mode matched requires
a lens with a focal length chosen to match the Gaussian beam focusing size according to
Eq. 3.1 (it also requires a diffraction-limited lens).
. (3.1)
To calculate the required coupling lens focal length, the diameter of the
waveguide, d, is multiplied with the diameter of the collimated laser beam, Dc. This
product is divided by 1.22 multiplied by the wavelength of the laser beam, λ.
Equation 3.1 can be used twice to derive the relationship shown in Eq. 3.2 relating
the distances from the lenses to an opening, d1for lens 1 and d2 for lens 2, and the focal
lengths of the lenses, f1 for lens 1 and f2 for lens 2.
(3.2)
Equation 3.2 is also used to guide the choice of the size of the pinhole that is used to
clean up the beam and ensure that only the light propagating through the core is
measured. The pinhole is chosen to be approximately 30% larger than the core. This will
decrease the likelihood that the fundamental mode will be clipped at the pinhole, yet still
stop the light that propagates in the cladding of the capillary.
In order to quantify the experimental results, a model was written in MATLAB to
calculate and plot the transmission through a waveguide. The loss in transmission is

11
exponential with respect to length; with an attenuation constant of α which is defined in
units of loss per length [7],
√ (3.3)
where unm is the propagating mode, n is the index of refraction of the waveguide
cladding, a is the radius of the waveguide, and λ is the wavelength of the laser light. Due
to the propagating mode being the fundamental mode unm is equal to 2.405 the first zero
crossing of a 1st order Bessel function, the wavelength is λ=532 nm, and n is
approximately to 1.5 for glass. The value of the attenuation constant, for a 25 µm
diameter hollow-core capillary using this values in Eq. 3.3, is calculated to be α11 = 0.041
1/cm.
For uniformly distributed attenuation, the loss in the propagating intensity due to
transmission through the waveguide can be modeled as the initial intensity, Io, multiplied
with the exponential of the attenuation constant multiplied by the length of the
waveguide, L.
(3.4)
Figure 3.1 displays the theoretical intensity through a capillary. Note that this graph
assumes a theoretical maximum transmission of 80% [7], with low bending and coupling
losses.

12
Figure 3.1: Theoretical Transmission vs. Waveguide Length for light propagating through
an optical waveguide.
Experimental Setup
The experimental setup consists of the laser beam from the Verdi V-10 laser with
wavelength 532 nm, coupled into a single-mode fiber to ensure that the coupling beam
into the glass capillary consists of only the fundamental mode. A second fiber coupler is
utilized to collimate the laser beam out of the single-mode fiber. Using the ratio of ⁄ ,
the required beam spot size in the 50 m capillary is calculated to be 32 microns in
diameter, and requires a lens that will focus to a spot of the same diameter. Using
Equation 3.1, the lens focal length is calculated to be 75.6 mm. The laser beam is then
directed into the hollow core of the glass capillary via the 75.6 mm coupling lens. In

13
order to accurately steer the beam into the core of the capillary, a Z-fold mirror
arrangement is used, as depicted in Figure 3.2.
Figure 3.2: Lab Bench Setup to Couple laser light into a Glass Capillary
The glass capillary requires a mounting system that constrains the capillary in
XYZ space at the coupling face, holds the output face to minimize the bend in the
capillary, and allows for the capillary’s length to be decreased while maintaining the
coupling position. A rail is utilized to maintain the Y position of the pedestals to prevent
the glass capillary from bending horizontally as the rear pedestal is moved closer to the
coupling pedestal. The mounting system consists of two pedestal mounts and two custom
machined v-blocks, one for each pedestal. The pedestal mounts are shown in Figure 3.3
to allow the reader to better understand the custom mounts.

14
Figure 3.3: Custom V-Block Mounts on Pedestals
Once the laser beam is passed through the capillary, the beam is collimated using a
second 75.6 mm lens. A flip mirror is used to redirect the laser beam through a 300 mm
focusing lens and onto a camera. The camera is used to monitor the output from the
capillary, allowing for the laser beam to be coupled into the fundamental mode.
Once the laser beam is coupled into the fundamental mode, the flip mirror is
flipped down, allowing the laser beam to be directed into a pinhole. The display from the
camera is a monitor which has a marker point on it indicating the location of the capillary
core. This point allows for the pinhole to be quickly aligned when the capillary is cut
down. A second Z-fold is used to make fine adjustments in the beam path to direct the
spot into the pinhole and maximize the output, which images the mode exiting the
capillary. A 101.6 micron pinhole is used, and the laser beam is focused through it via a
100 mm lens. The use of the pinhole allows for the measurement of the energy that is
propagating in the fundamental mode in the capillary while blocking the light that
propagates through the glass portion of the hollow core capillary. Once the beam passes

15
through the pinhole, it is imaged on a target screen. The target screen is used to verify
that the mode is passing through the pinhole without clipping prior to taking a power
measurement.
Results
A total of four experimental data sets were taken, with a coupling efficiency into
the capillary of 11.4%, a 50 m core diameter capillary, and the dual-pedestal capillary
mounting system. The data gathered from the experiments are displayed in Figure 3.4,
showing an exponential decay in the amount of transmitted power as the length of the
capillary is decreased.
Figure 3.4: Plot of Transmittance vs. Capillary Length
0
2
4
6
8
10
12
14
0 10 20 30 40
% Transm
itted
Capillary Length (cm)
Transmittance vs. Capillary Length
First Run
Second Run
Third Run
Fourth Run
16
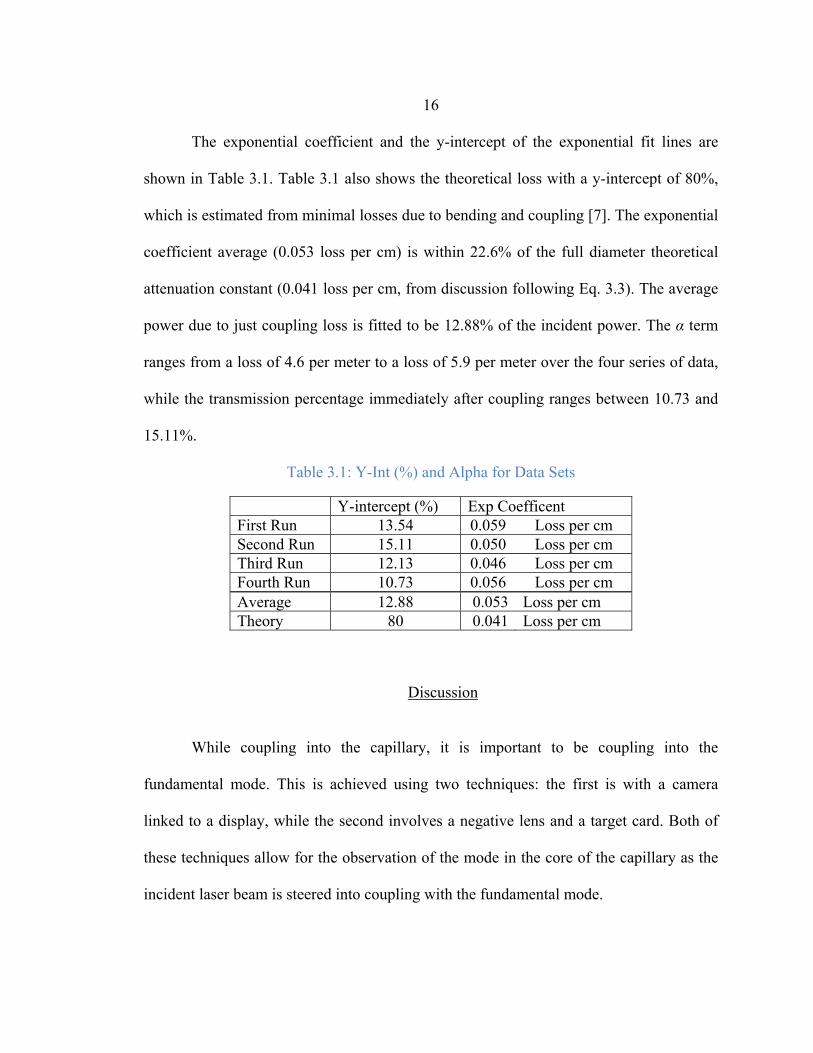
The exponential coefficient and the y-intercept of the exponential fit lines are
shown in Table 3.1. Table 3.1 also shows the theoretical loss with a y-intercept of 80%,
which is estimated from minimal losses due to bending and coupling [7]. The exponential
coefficient average (0.053 loss per cm) is within 22.6% of the full diameter theoretical
attenuation constant (0.041 loss per cm, from discussion following Eq. 3.3). The average
power due to just coupling loss is fitted to be 12.88% of the incident power. The α term
ranges from a loss of 4.6 per meter to a loss of 5.9 per meter over the four series of data,
while the transmission percentage immediately after coupling ranges between 10.73 and
15.11%.
Table 3.1: Y-Int (%) and Alpha for Data Sets
Discussion
While coupling into the capillary, it is important to be coupling into the
fundamental mode. This is achieved using two techniques: the first is with a camera
linked to a display, while the second involves a negative lens and a target card. Both of
these techniques allow for the observation of the mode in the core of the capillary as the
incident laser beam is steered into coupling with the fundamental mode.
Y-intercept (%) Exp Coefficent First Run 13.54 0.059 Loss per cm Second Run 15.11 0.050 Loss per cm Third Run 12.13 0.046 Loss per cm Fourth Run 10.73 0.056 Loss per cm Average 12.88 0.053 Loss per cm Theory 80 0.041 Loss per cm
17
With the 532-nm laser light that is used, it is possible to observe the fine
impurities in the core-to-cladding interface of the capillary. Light scatters out of the
capillary at these points, and provides a location as to where the extra losses are occurring
in the capillary. These impurities are sources of the excess loss that is experienced, and
this knowledge will assist in determining the quality of glass capillaries that will be used
in future experiments.
The coupling loss in the glass capillaries immediately after coupling (capillary
length ≈ 0 cm) is significant, as it was experimentally measured to be over 85%. Not all
of this loss is directly attributed to the coupling loss alone. Other areas that account for
loss are in the lenses and mirrors that are used, as neither type of component is perfectly
designed to contain absolutely no losses, yet the loss in these areas totals ~4% and does
not explain all of the loss. Another area that contributes to the losses is at the pinhole,
which is designed to block the light. The losses at the pinhole are theoretically
insignificant as the size of the pinhole was chosen to be 30% larger than the beam spot at
the location of the pinhole. Even considering all of these areas of loss in the system, there
should be a greater amount of light that is propagated through the core. The large
coupling loss may be due to the laser beam not perfectly mode matching with the
capillary.
The attenuation constants that were experimentally found are within 37% of the
theoretical value. This deviation may be due to a combination of two points of
inconsistency in the system. These include: 1) the fluctuations of the laser itself, which
required all measurements to be taken twice to average out changes in output power from

18
the laser; 2) the potential for errors in the power meter itself. The power head was
observed to have been scored in portions of the active sensing area, which caused the
power readings to be diminished if the laser beam became incident in the damaged areas.
Fitting the experimental data yields an exponential curve fit to the data, as shown
in Figure 3.4; with the experimental α 20% larger than the theoretical α. A reason for this
is the possibility that the coupling face is not perfectly perpendicular with the core. It is
not known how this can be resolved, as current cleaving techniques do not provide a
perfect perpendicular face and may cause the core to not have a perfectly round face.
A second source of the deviation is in a slight bend in the capillary itself. All
precautions were taken in the execution of the measuring process, yet the need for a
capillary stand that can support the entire capillary while allowing for the capillary to be
cut down provided only one solution, a multi pedestal mounting system. The downside to
this system is the opportunity for a slight bend in the capillary that is not noticeable or
apparent during the experiment. The slight bend may attribute to the overall losses
observed via the addition of bending losses, leading to poor mode matching in the
capillary.
Conclusion
The experimental data of the losses through a hollow-core glass capillary match
up to within 23% of the theoretical losses once the unknown experimental losses (i.e.
coupling loss) are taken into account. The experimental data did produce the exponential
decay line shapes that are expected, just to a less than desirable degree. An interesting
observation regarding the hollow core glass capillaries is that it is possible to observe the

19
impurities at the core-cladding interface. The light scatters out of the capillary at the
points of impurity, and provides a guide as to the location of large impurities in the
capillary that cause extra transmission loss.

20
CHAPTER 4 – SECOND HARMONIC GENERATION USING A KTP CRYSTAL
Introduction
Second Harmonic Generation (SHG) allows for an output wavelength that is half
the length of the incident wavelength via photon conversion. Photon conversion is when
two photons of the same wavelength propagate through a medium and exit the medium as
one photon of a new wavelength. The usefulness of SHG is that a desired wavelength,
which is difficult to produce by conventional stimulated emission, is able to be created
with readily available materials. In order for light to undergo SHG, two items are needed:
1) light that is uniquely polarized; 2) a special crystal. The uniquely polarized light passes
into the special crystal, which is grown and cleaved in such a way that when the incident
beam passes into the crystal, the exiting light becomes phased-matched and efficiently
produces a new photon through photon conversion.
Theory
There are two main types of SHG phase matching and both rely on passing the
incident laser beam through a birefringent crystal that affects the speed at which the light
propagates in the crystal differently for different polarizations. Type I phase matching
takes two incident photons with identical polarization, and produces an output photon
that has a polarization that is perpendicular to the incident photons. The second method
of SHG is Type II phase matching, in which one of the incident photons is polarized
along the ordinary crystal axis and the second incident photon is polarized along the

21
extraordinary crystal axis. This combination produces a photon polarized in the
extraordinary-index crystal plane [8].
To accurately calculate the phase matching condition, Δk, the angular frequency
of the incident beam, ω, the speed of light, c, along with the index of refraction at ω and
2ω must be known to complete the calculation. When Eq. 4.1 reaches zero, the maximum
amount of incident light is being converted and the two incident photons are perfectly
phase matched (see section 8.3 in [9]).
2 (4.1)
With the knowledge of the index of refraction at the two wavelengths and the phase
matching condition, the intensity of the SHG light can be calculated from Eq. 4.2 [9]
2 2 , (4.2)
where I(ω) is the initial intensity at the fundamental angular frequency ω, L is the length
of the crystal, n is the index of refraction of the crystal, d is the beam diameter, µ is the
permeability of the crystal, ε is the permittivity of the crystal, and Δk is the phase
matching condition. It should be noted that the second harmonic intensity is dependent
upon the crystal properties and increases quadratically as the input intensity increases.
Figure 4.1 displays the normalized result of Eq. 4.2 when θ is swept between -10° to 10°
and illustrates the sinc2 function that is expected. At an entrance angle of 0 radians, the
maximum intensity occurs and is shown as a value of 1 in Figure 4.1.

22
Figure 4.1: Entrance Angle vs. Normalized Intensity
Experimental Setup
The experiment utilizes a continuous wave 1064 nm Nd:YAG laser as the source,
which is focused into a single mode fiber via an Optical Fiber Port (OFR) and is
collimated using a second OFR. An OFR is a coupler that contains a lens and a fiber
connector. The lens either collimates the light exiting an optical fiber which is connected
to the fiber connector, or focuses the light into the fiber. Figure 4.2 illustrates the layout
of the optical components.

23
Figure 4.2: Lab Bench Setup for Frequency Doubling
The 1064 nm light is passed through a polarizing beam splitter and a 1064 nm λ/2
plate rotated by 22.5° to ensure that the light is correctly polarized prior to the KTP
crystal. The 1064 nm is then focused through a KTP crystal with dimensions of 8 mm x 8
mm x 5.5 mm on a rotational stage via a 50.0 mm lens. The crystal is placed in the center
of the rotational stage with the beam passing through the 5.5 mm side of the KTP crystal.
Once the beam exits the crystal, the beam passes through a prism which is used to
separate the 1064 nm light from the 532 nm light. To further ensure that the only light
being measured has a wavelength of 532 nm light, a band pass 532 nm filter is placed in
the beam path prior to the photodetector. The 532-nm light is then focused onto a
Thorlabs Det210 Photodetector by a 75 mm lens.
24
Results
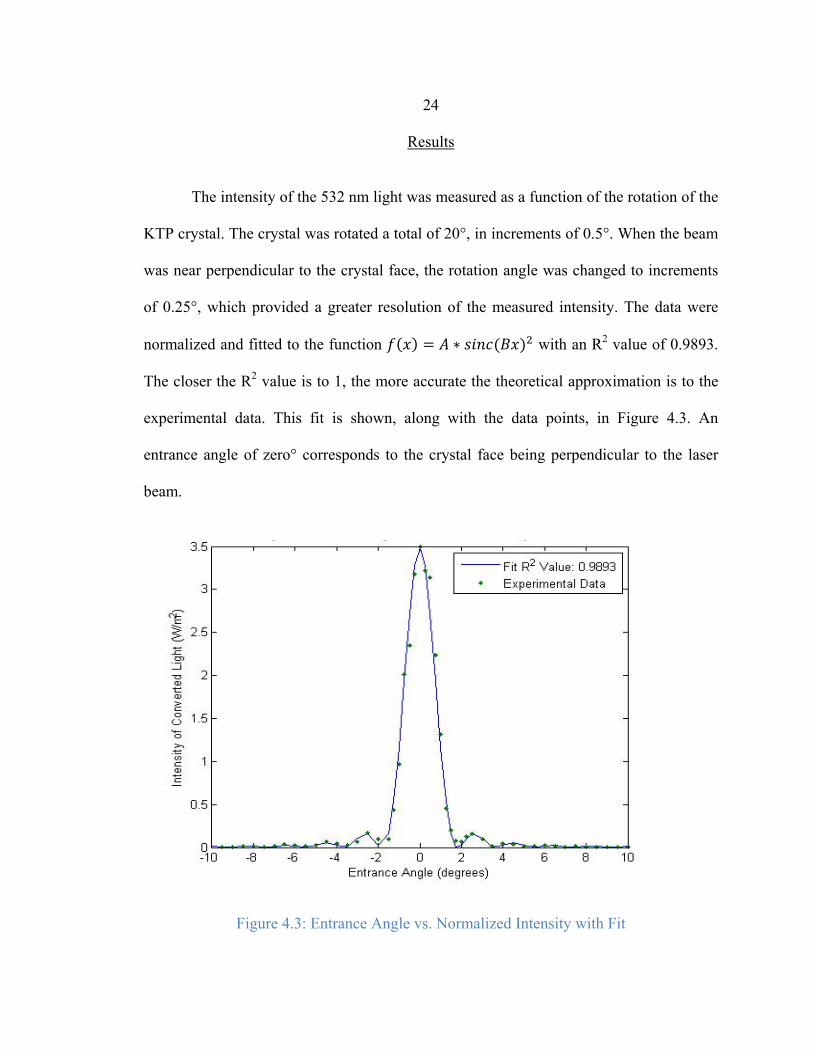
The intensity of the 532 nm light was measured as a function of the rotation of the
KTP crystal. The crystal was rotated a total of 20°, in increments of 0.5°. When the beam
was near perpendicular to the crystal face, the rotation angle was changed to increments
of 0.25°, which provided a greater resolution of the measured intensity. The data were
normalized and fitted to the function with an R2 value of 0.9893.
The closer the R2 value is to 1, the more accurate the theoretical approximation is to the
experimental data. This fit is shown, along with the data points, in Figure 4.3. An
entrance angle of zero° corresponds to the crystal face being perpendicular to the laser
beam.
Figure 4.3: Entrance Angle vs. Normalized Intensity with Fit

25
The initial power from the 1064 nm laser is measured five times and averaged, as
shown in Table 4.1. The average is used to calculate the efficiency of the KTP crystal
when the maximum amount of light is converted. The maximum converted light, with an
input beam power of 183 mW, is recorded to be 11 µW, giving the crystal an efficiency
of 0.006%. The SHG light intensity will increase quadratically as the intensity of the
input beam increases, resulting in an increase in the conversion efficiency.
Table 4.1: Incident Power from 1064-nm Laser onto KTP Crystal
Reading 1 Reading 2 Reading 3 Reading 4 Reading 5 Average Reading
Power (mW)
179 178 178 179 180 178.8
Noise in Detector
(mW) .258 .251 .248 .247 .246 .250
Power Without Noise (mW)
178.74 177.75 177.75 178.75 179.75 178.55
Discussion
It is expected from Figure 4.1 that the amount of light converted versus entrance
angle into the crystal will follow a sinc2 fit. The angular acceptance of the KTP crystal
from the data sheet is 1.6272°. Angular acceptance, which is also known as acceptance
angle and crystal angular tolerance, is defined as the crystal tilt away from the phase
matching direction in which Δk*L=2π [10], which is the first null in a sinc2 function. The

26
experimental data has a measured angular acceptance of 1.8329°. The experimental data
has an error of 12.6% from the KTP crystal data sheet.
The beam waist is measured utilizing the knife-edge technique. This technique
was performed to verify two items: 1) the laser beam is not larger than the crystal, 2) and
the crystal is placed in the tightest portion of the beam waist. The position of the knife-
edge is recorded at two points, when the laser power is measured to be 84% and 16% of
the initial power. At the 84% of initial power point is the leading edge of the beam spot
and at 16% of the initial power is the trailing edge of beam spot. The distance between
these two points is measured to be 139 microns. Using the Rayleigh range equation
solved for the beam waist, and ZR is the focal length of the focusing lens. The
calculated diffraction limited beam spot size is then 130 microns. The measured beam
spot is approximately 7% larger than the calculated size, and is due to the lack of
accurately measuring the location of the knife edge and the amount of beam power being
measured. The Thorlabs PM100 detector does not allow for accurate measurement at low
power levels. The difference in the beam spot measured to calculate represents one of
two possibilities; the knife-edge was not positioned at the same point as the KTP crystal
face, or the KTP crystal face was not positioned at the exact focal point of the lens.
Conclusion
By utilizing a KTP crystal, it is possible to convert 1064-nm laser light to 532-nm
light by the process known as photon conversion. The amount of 532-nm light that is
produced by photon conversion in the KTP depends strongly on the incident angle into

27
the crystal. As the incident angle changes, the intensity of light converted into 532-nm
light follows Equation 4.2. The advantage of using the photon conversion technique is
quite evident in being able to create a laser beam of a new wavelength that is not
reachable by a laser.

28
CHAPTER 5 – DIFFRACTION GRATING TO SEPARATE
THE LASER WAVELENGTHS
Introduction
A diffraction grating consists of a periodic structure of lines, spaced by a distance
on the order of the wavelength of incident light on a substrate. Examples of diffraction
gratings can be found in CDs, DVDs, and holograms on credit cards. There are two types
of diffraction gratings, reflection and transmission. As the incident light interacts with the
grating, it is diffracted to a new angle depending upon the wavelength, incident angle of
the light, period of the grating, and the diffraction order. This property allows for a
diffraction grating to display the wavelength spectrum of the incident light onto an
observation plane.
Theory
Due to the properties of the diffraction grating, the Huygens-Fresnel Principle can
be implemented. This principle states that every point on the incident wavefront will
generate a spherical wave [11]. The strips of material create a path difference between the
spherical waves. This path difference induces a phase shift in each of the spherical waves.
When the strips of material are at a spacing that provides optical path difference equal to
the wavelength, λ, of the incident light, the phase matches up, allowing for constructive
interference. The constructive interference will have maxima at specific angles, θm . This
angle can be calculated using the grating equation [12]
(5.1)

29
where G is the number of lines per mm on the grating and λ is the optical wavelength, in
this case 1064 nm. The angle of incident θi is used with the diffraction order, m, to
calculate the precise diffraction angle. Multiple wavelengths are able to be diffracted off
the same grating simultaneously from the same angle of incidence. The grating equation
is used to calculate the reflected angles for a range of diffraction orders from -3 to 3
1064 nm incident light, which are shown in Table 5.1 for a 600 line per mm grating.
Table 5.1: Calculated Angles off a 600 Lines/mm Grating for 1064 nm
Incident Angle
(Degrees) ‐3 Order (Degrees)
‐2 Order (Degrees)
‐1 Order (Degrees)
0th Order (Degrees)
+1 Order (Degrees)
+2 Order (Degrees)
+3 Order (Degrees)
0 ‐ ‐ ‐39.67 0 39.67 ‐ ‐
15 ‐ ‐ ‐22.31 15 63.79 ‐ ‐
30 ‐ ‐50.96 ‐7.95 30 ‐ ‐ ‐
45 ‐ ‐34.72 3.93 45 ‐ ‐ ‐
Experimental Setup
The experimental setup to measure the diffraction grating consists of a 1064 nm
continuous wave laser source projecting the collimated beam through free space. The
beam is incident onto the desired diffraction grating which is mounted to a rotational
stage. The diffraction grating is positioned such that the collimated beam strikes the
diffraction grating on the center of the grating.

30
Figure 5.1: Lab Bench Setup for Diffraction Grating Experiment for Incident Angle 0°
An infrared card attached to a target card is used to identify the position of the
diffracted beams. Once a diffracted beam is located, a protractor is used to measure the
angle between the grating normal and the diffraction order. The grating is then rotated
and the angle is measured and recorded. The process is repeated from 0° to 45° angle of
incidence in steps of 15°.
Results
The incident light is diffracted off of the grating at various angles dependent upon
the incident angle, wavelength, and diffraction order. A negative sign indicates that the
diffracted angle is to the left of the diffraction grating normal when observing from above
the grating. A positive sign indicates that the diffracted angle is on the same side of the
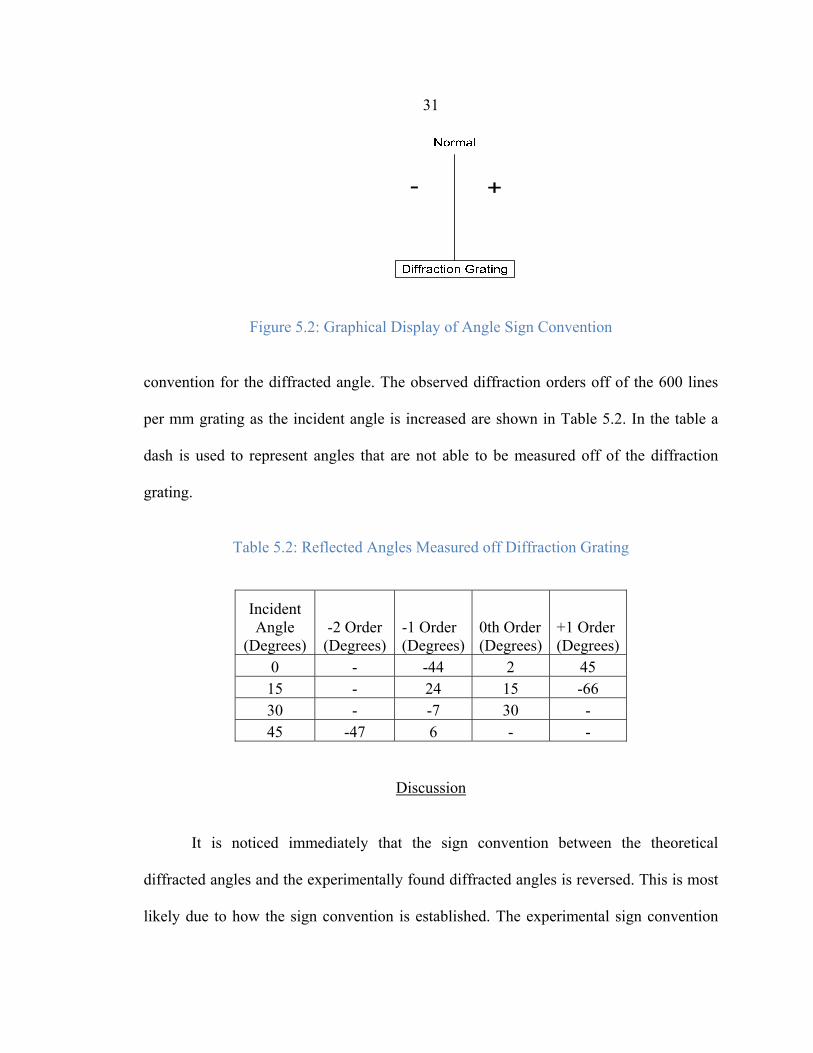
normal as the 0th order. Figure 5.2 displays a graphical representation for the sign
31
Figure 5.2: Graphical Display of Angle Sign Convention
convention for the diffracted angle. The observed diffraction orders off of the 600 lines
per mm grating as the incident angle is increased are shown in Table 5.2. In the table a
dash is used to represent angles that are not able to be measured off of the diffraction
grating.
Table 5.2: Reflected Angles Measured off Diffraction Grating
Incident Angle
(Degrees) -2 Order
(Degrees) -1 Order (Degrees)
0th Order (Degrees)
+1 Order (Degrees)
0 - -44 2 45 15 - 24 15 -66 30 - -7 30 - 45 -47 6 - -
Discussion
It is noticed immediately that the sign convention between the theoretical
diffracted angles and the experimentally found diffracted angles is reversed. This is most
likely due to how the sign convention is established. The experimental sign convention

32
was established from a top down point of view, with a positive sign for all angles to the
right of the normal, and a negative sign for all angles to the left of the normal. The
theoretical sign convention is established from Eq. 5.1, and a positive sign is used for all
angles to that are on the same side of the normal as the 0th order, while a negative sign is
used for all angles on the opposite side of the normal as the 0th order.
The measured angle for the light diffracted off of the diffraction grating has an
error uncertainty of approximately ±4° due to the nature of the measuring technique. The
technique involves using a protractor with an arm and an infrared viewing card. Due to
the nature of the infrared viewing card, which fluoresces under near infrared light a larger
spot then the actual beam spot, the precise location of the beam center is only
approximated. The experimental angles for the location of the diffracted orders are within
the estimated measurement error for the -1 and +1 diffraction orders once the sign of the
angle is switched to the sign convention of Eq. 5.1. At the higher diffraction order for the
higher angle of incident, the -2 order was not measured and measurement error doubled
for the angles of incident 30° and 45°, respectively.
Conclusion
It is shown that by utilizing the diffraction grating equation, a set of expected
diffraction angles is obtained for a given grating, wavelength, and incident angle. The
benefit of a diffraction grating is that the diffraction angle is dependent upon the incident
wavelength. This is a benefit in that a diffraction grating can be used to separate the
incident light into the separate wavelengths, much like a prism. The advantage over a

33
prism is that the grating has a smaller footprint (i.e. takes up less space) due to the larger
diffraction power. In addition to taking up less space, it is also possible for a diffraction
grating to be reflective. This allows for a specific order to be guided through an optical
system with fewer components than a prism.

34
CHAPTER 6 – RAMAN CONVERSION
Background
Raman conversion, also known as Raman scattering, occurs when a photon is
scattered off of an atom or molecule inelastically. If the molecule is excited by the
passing laser pulse, the molecule either vibrates or rotates and releases a photon. There
are two types of Raman scattering, Stokes and anti-Stokes, depending on if the molecule
absorbs or releases energy [13]. The wavelength of the released photon is dependent upon
the change in energy, and is shown in Figure 6.1.
Figure 6.1: Raman Conversion Energy Levels
35
Results and Discussion
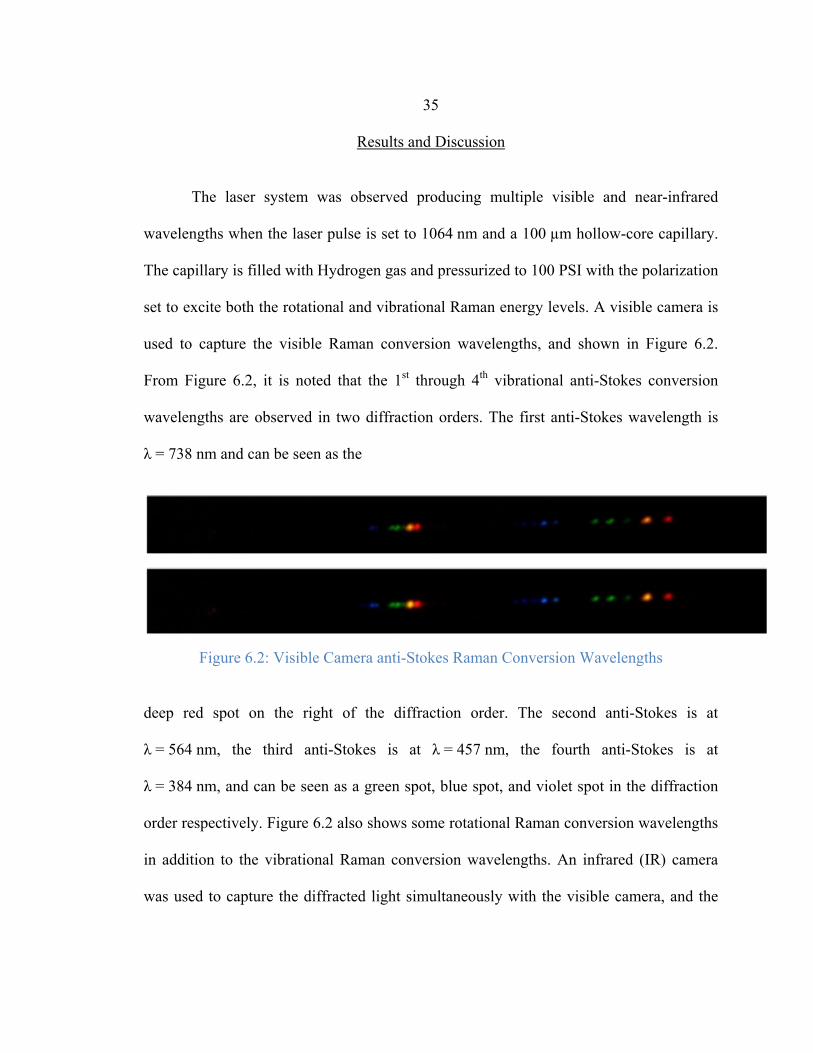
The laser system was observed producing multiple visible and near-infrared
wavelengths when the laser pulse is set to 1064 nm and a 100 µm hollow-core capillary.
The capillary is filled with Hydrogen gas and pressurized to 100 PSI with the polarization
set to excite both the rotational and vibrational Raman energy levels. A visible camera is
used to capture the visible Raman conversion wavelengths, and shown in Figure 6.2.
From Figure 6.2, it is noted that the 1st through 4th vibrational anti-Stokes conversion
wavelengths are observed in two diffraction orders. The first anti-Stokes wavelength is
λ = 738 nm and can be seen as the
Figure 6.2: Visible Camera anti-Stokes Raman Conversion Wavelengths
deep red spot on the right of the diffraction order. The second anti-Stokes is at
λ = 564 nm, the third anti-Stokes is at λ = 457 nm, the fourth anti-Stokes is at
λ = 384 nm, and can be seen as a green spot, blue spot, and violet spot in the diffraction
order respectively. Figure 6.2 also shows some rotational Raman conversion wavelengths
in addition to the vibrational Raman conversion wavelengths. An infrared (IR) camera
was used to capture the diffracted light simultaneously with the visible camera, and the

36
IR image is shown in Figure 6.3 with an arrow to designate the location of the pump
1064 nm light. The 1064 nm spot is of low intensity due to the use of a 1064 nm filter to
Figure 6.3: Infrared Camera anti-Stokes Raman Conversion Wavelengths
prevent the IR camera from being saturated. Figure 6.3 also shows that near-IR rotational
wavelengths from the 1064 nm pump pulse are produced.
The Raman conversion results demonstrate that a 1064 nm beam pulse, when
mode matched, is capable of producing visible light down into the violet portion of the
light spectrum. Further experiments are needed to measure the amount of power that is
produced in each of the anti-stoke wavelengths. The conversion efficiency can then be
calculated and compared with the wavelength conversion efficiency of an OPO laser
system.

37
CHAPTER 7 - CONCLUSION
By efficiently coupling into a hollow-core glass capillary, it was experimentally
shown that the capillary behaved as a waveguide that was capable of propagating the
lowest order mode effectively. This allowed the use of gas as the Raman conversion
medium in a confined waveguide and the transmission losses are based largely on the
bending of the capillary. The pump wavelength was able to be frequency doubled using a
KTP crystal, with the acceptance angle experimentally measured and found to correlate
with the theoretical acceptance angle. A diffraction grating was used to separate the
Raman converted wavelengths onto an observation screen with the location of the
diffraction orders calculated.
The Raman conversion laser system has proven to be a way to not only generate
the 1st and 2nd, but also the 1st through 4th anti-stokes wavelengths when a 1064 nm laser
pulse is mode matched with the capillary. This means that the light exiting the capillary
will be a “rainbow” comprising of the pump wavelength, Stokes wavelength, and anti-
Stokes wavelength all propagating in the same direction as shown in Figure 6.2. The
rainbow of wavelengths propagating from the end of the capillary causes a problem for
any counter measures that an imaging system may attempt to employ. Further
developments in the system will optimize the amount of energy that is transferred into the
Stokes and anti-Stokes wavelengths, allowing for more energy to bypass the optical
filters placed in front of an imaging sensor.

38
REFERENCES CITED
[1] Personal communication, Dr. Zeb Barber, Montana State University Spectrum Lab (Tel. 406-994-5925). [2] Schriever, Christian, Stefan Lochbrunner, Patrizia Krok, and Eberhard Riedle. "Tunable Pulses from below 300 to 970 Nm with Durations down to 14 Fs Based on a 2 MHz Ytterbium-doped Fiber Sytem." Optics Letters 33.2 (2008): 192-94. [3] Peuser, Peter, Willi Platz, Gerhard Ehret, Alexander Meister, Matthias Haag, and Paul Zolichowski. "Compact, Passively Q-switched, All-solid-state Master Oscillator–power Amplifier-optical Parametric Oscillator (MOPA-OPO) System Pumped by a Fiber-coupled Diode Laser Generating High-brightness, Tunable, Ultraviolet Radiation." Applied Optics 48.19 (2009): 3839-845.
[4] Barber, Zeb, Christoffer Renner, Randy Reibel, Stephen Wagemann, Randall Babbitt, and Peter Roos. "Conditions for Highly Efficient Anti-Stokes Conversion in Gas-filled Hollow Core Waveguides." Optics Express 18.7 (2010): 7131-137.
[5] Wagemann, S. S. (2009). Building a Raman Laser Pump Source Capable of Generating Flexible Pulse Durations while Maintaining High Spatial Quality. Montana State University. http://etd.lib.montana.edu/etd/2009/wagemann/WagemannS0509.pdf
[6] R. Nubling and J. Harrington, “Launch conditions and mode coupling hi hollow-glass waveguides,” Opt. Eng. 37(9), 2454-2458 (September 1998). [7] E.A.J. Marcatili and R.A. Schmeltzer, “Hollow metallic and dielectric waveguides for long distance optical transmission and lasers,” The Bell System Technical Journal, 1783-1809 (July 1964). [8] P.M. Petersen, “Frequency Doubling and Second Order Nonlinear Optics”, Tutorial, DTU Fotonik, http://www.ist-brighter.eu/tuto11/CONF2/Cambridge_Petersen.pdf, last visited 11/6/2011. [9] Yariv, Amnon. Optical Electronics. 4th ed. Saunders College, 1991. Print. [10] SNLO Software, “Help File”, http://www.as-photonics.com/SNLO.html, last visited 11/6/2011. [11] B.E.A. Saleh and M.C. Teich, “Fundamentals of Photonics”, 2nd ED. [12] Newport, “Diffraction Grating Handbook” 6th Ed.

39
[13] F. Benabid, G. Bouwmans, J. C. Knight and P.St. J. Russell, “Ultrahigh Energy Laser Wavelength Conversion in a Gas-Filled Hollow Core Photonics Crystal Fiber by Pure Stimulated Rotational Raman Scattering in Molecular Hydrogen” PRL 93 (2004) 123903