Embed Size (px)
Citation preview
Total Lung Capacity with the MiniBoxTM:
Clinical Results in Obstructed, Restrictive, and
Healthy Adults
White Paper
2014 Dec

2
Total Lung Capacity with the MiniBoxTM: Clinical Results in Obstructed, Restrictive, and Healthy Adults
INTRODUCTION
The most common test of pulmonary function is spirometry, in which the volume of air flowing into and out of the respiratory system is directly measured. Spirometry can quantify volume differentials such as tidal volume (Vt), vital capacity (VC), or expiratory reserve volume (ERV), but cannot measure absolute volumes such as residual volume (RV), functional residual capacity (FRC), or total lung capacity (TLC). Although absolute thoracic gas volumes (TGV), such as RV, FRC, and TLC, are useful in the diagnosis, management and monitoring of respiratory system diseases, their measurement requires technologies that are more complex, costly and labor intensive than spirometry. Accordingly, RV, FRC, and TLC are sometimes not available in adult or pediatric office practices.
To measure absolute lung volumes, the ATS/ERS Consensus Statement identifies five methods: whole body plethysmography, multi-breath helium dilution, nitrogen wash-out, computed tomography, and chest radiography.1 Among these, body plethysmography is used most
commonly and is widely regarded as being the “gold standard”.1-8 Since its inception by Dubois in 19569, body plethysmography has remained elegantly simple in principle but inherently complex, capital intensive, and physically large in practice. The plethysmograph can be uncomfortable or intimidating for the patient enclosed within it and, moreover, is dependent upon a skilled technician for calibration and operation. Gas dilution or washout present different, but equally complex, challenges in test administration, including the inherently complicated logistics of maintaining and utilizing an external gas source.
Investigators have explored alternative avenues to determine TGV without success. For example, data obtained from respiratory system impedance, even when extended to a wide range of forcing frequencies, have been shown to be inadequate to infer absolute lung volumes in individual subjects.9-16 Similarly, data obtained from forced expiratory maneuvers have been shown to be inadequate.17 Although both methods had been reasoned to be sensitive to TGV, neither is able to determine TGV. This failure may be attributable in part to the fact that the
Total Lung Capacity with the MiniBoxTM:
Clinical Results in Obstructed, Restrictive, and Healthy Adults
ABSTRACT
Among the most basic measures of respiratory function is the total lung capacity (TLC). Defined as the pulmonary gas volume at maximal lung inflation, TLC is the sum of the volume of gas that can be exhaled – the vital capacity (VC) – and the volume of gas that cannot – the residual volume (RV). Determination of VC requires only spirometry whereas determination of RV or TLC requires body plethysmography, helium gas dilution or nitrogen washout, or thoracic imaging. These techniques share the limitation of being complex and requiring a high level of patient cooperation and technical expertise to administer. We describe heretofore a new approach to determine TLC by applying an unbiased statistical model generated by data mining to flow-interruption transients and spirometry. In a heterogeneous population of 434 volunteers (265 male, 169 female; 201 healthy, 170 with mild to severe airflow obstruction, and 63 with mild to severe ventilatory restriction), we determined TLC by conventional plethysmography (TLCpleth) and also by our statistical data mining approach (TLCMiniBox). For the combined heterogeneous population, we found TLCpleth = 1.02TLCMiniBox -0.091 L, adjusted r2=0.824. The coefficient of variation for repeated measurements in 26 healthy subjects on different days was 3.3% for TLCPLETH versus 1.6% for TLCMiniBox. These results establish the validity and potential utility of this new method for rapid, accurate, and repeatable determination of TLC in a heterogeneous patient population.

3
Total Lung Capacity with the MiniBoxTM: Clinical Results in Obstructed, Restrictive, and Healthy Adults
dynamics of gas distribution within the human lungs are complex, and especially so in obstructive lung disease. However, this failure may also be attributable in part to the fact that data interpretation often rests upon fitting respiratory impedance data to idealized mathematical models wherein there exists a wide range of TGVs that fit the data equally well. When this happens, no useful estimate of TGV can be calculated.
We utilize a completely different methodology to arrive at the TGV. We consider multiple measures of respiratory flow dynamics, all of which are restrictive to the airway opening and thus do not require body plethysmography. We then frame these multiple measures, taken together, within the context of unbiased statistical modeling. Unlike all methods described previously, many of which rest upon idealized models of respiratory system mechanics, this new approach is more akin to data mining and therefore does not require theoretical models or idealized assumptions. Herein we demonstrate that this statistical approach estimates plethysmographic TLC so closely as to comprise an accurate and repeatable stand-alone measurement of TLC without the need for body plethysmography.
METHODS
The study comprised three parts. First, in a heterogeneous population of 300 volunteers, as described below, we measured TLC in the conventional manner using body plethysmography (TLCpleth). In those same volunteers we measured conventional spirometry and flow-interruption transients using the MiniBoxTM (PulmOne Advanced Medical Devices, Ltd., Ra’anana, Israel). Based upon these data, we used a statistical algorithm – the LASSO18,19 – to find the strongest set of statistical predictors of TLCpleth. We arrived at a final statistical model with which to calculate TLC from the statistical predictors (TLCMiniBox). Second, we validated this statistical prediction using N-fold cross-validation. Lastly, to evaluate this statistical model still further, we compared TLCMiniBox against TLCpleth in a prospective heterogeneous cohort of 134 volunteers.
Subject population. We recruited volunteers at 6 institutions (Soroka University Medical Center, Beer Sheva, Israel; Rambam University Medical Center, Haifa, Israel; Maccabi HaShalom, Tel-Aviv, Israel; Maccabi HaSharon,
Kefar-Saba, Israel; Assaf HaRofeh Hospital, Tzrifin, Israel; Tel Aviv Medical Center, Tel-Aviv, Israel) under a research protocol approved by the Ethical Review Board of each. The prospective clinical study was registered with ClinicalTrials.gov (NCT 01952431).
The population comprised three groups (Table 1): 1) healthy subjects; 2) subjects with airflow obstruction, such as chronic obstructive lung disease (COPD) or asthma and with varying severity level (mild, moderate, severe and very severe); and 3) subjects with restrictive ventilatory disorders. Patients were recruited from the Lung Function Laboratory at each institution. In each case, disease severity was defined by the criteria in ATS/ERS guidelines.20
Subjects were considered eligible if they: a) provided informed consent; b) were at least 18 years of age; and c) were cooperative and capable of following instructions. Healthy subjects were eligible if they: a) never smoked; b) had no known history of respiratory, cardiovascular, hepatic, renal or metabolic disease; c) had a BMI < 35 kg/m2; d) had no persistent (lasting greater than 3 days) respiratory symptoms during the last 12 months (e.g., dyspnea, chronic cough, wheezing or phlegm); and e) had no history suggesting upper respiratory infection during the three weeks prior to testing. Non-healthy subjects were eligible if they had a documented obstructive or restrictive respiratory disorder. Subjects were excluded from the study if they: a) were pregnant at the time of the study; b) had performed any significant physical activity that has resulted in breathlessness during 1 hour prior to the study; c) had a tracheostomy; d) were unable to satisfactorily perform routine, full lung function testing including body plethysmography (e.g., due to non-compliance or claustrophobia); e) were unable or unwilling to give informed consent; or f) were unable to complete the protocol.
For each subject, all measurements were made in the same laboratory, by the same technician, and were competed within two hours. The technician also recorded the subject's gender, date of birth, height, weight, and medical history.
Body plethysmography. Different commercial body plethysmographs were used at the different study sites: a) ZAN 500 (nSpire Health, Inc) - Soroka University Medical Center, Rambam University Medical Center, Maccabi

4
Total Lung Capacity with the MiniBoxTM: Clinical Results in Obstructed, Restrictive, and Healthy Adults
HaSharon; b) Platinum Elite-Series (MedGraphics) – Maccabi HaShalom; c) MasterScreen Lab (Erich Jaegar, CareFusion) – Tel Aviv University Medical Center, Assaf
HaRofeh Hospital. Associated transducers were calibrated in accordance with the manufacturers’ user manuals.
Device calibration and device agreement between institutions were verified using manually operated isothermal containers (3 L and 5 L) filled with copper wool, as well as by measuring a healthy control subject with a known TLC.
Body plethysmography measurements were performed in accordance with manufacturer recommendations and ATS/ERS guidelines.1 Subjects panted at 0.5 to 1 Hz against a closed valve and then inhaled to TLC followed by slow exhalation to RV. The final thoracic gas volume (TGV) was calculated as the mean of the first 3 individual TGVs that were within 5% of each other in which the 2 highest inspiratory capacity (IC) measurements were within 10%
(or 0.15 L) of each other. TLCpleth was calculated by adding the largest of the three ICs to the mean TGV.
MiniBoxTM. The MiniBoxTM (PulmOne Advanced Medical Devices, Ltd., Ra’anana, Israel) is a table-top unit that includes a spirometer and a flow-interruption device. The flow-interruption device (Figure 1A) consists of a rigid 16.3L container, a rapidly closing valve (<10 msec), and a hotwire anemometer-type flowmeter (working range +/- 5 L/s) (Figure 1B). The calibration of the MiniBoxTM flowmeters were confirmed daily using a standard 3L syringe. No external gas source is utilized with the MiniBoxTM.
Table 1: Basic Subject Characteristics.
Characteristic Entire
Dataset
Initial Model
Development
Prospective
Validation
(N = 434) (N = 300) (N = 134)
Male265
(61.1%)
185
(61.7%)
80
(59.7%)
Female169
(38.9%)
115
(38.3%)
54
(40.3%)
Age (years)* 45.8 ± 19.2 45.0 ± 20.1 47.8 ± 17.0
Height (cm)* 168.6 ± 9.9 168.2 ± 9.7 169.6 ± 10.4
Weight (kg)* 75.0 ± 17.3 73.6 ± 16.5 78.1 ± 18.8
Plethysmographic TLC (L)* 5.6 ± 1.4 5.6 ± 1.3 5.6 ± 1.5
Respiratory Condition: †
Healthy201
(46.3%)
150
(50.0%)
51
(38.1%)
Obstructed170
(39.2%)
114
(38.0%)
56
(41.8%)
Restrictive63
(14.5%)
36
(12.0%)
27
(20.1%)
Obstruction Severity: †
Mild29
(17.1%)
16
(14.0%)
13
(23.2%)
Moderate94
(55.3%)
68
(59.7%)
26
(46.4%)
Severe47
(27.6%)
30
(26.3%)
17
(30.4%)
* Values are means ± SD.
† Defined according to ATS standards.20
5
Total Lung Capacity with the MiniBoxTM: Clinical Results in Obstructed, Restrictive, and Healthy Adults
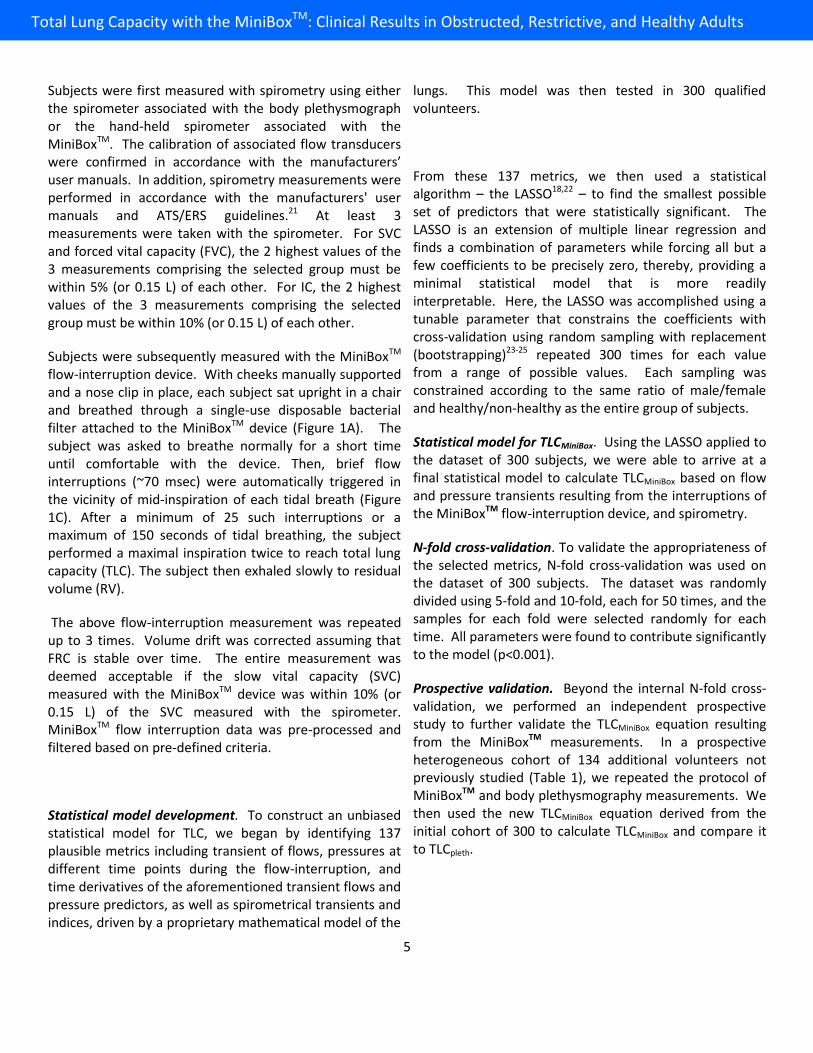
Subjects were first measured with spirometry using either the spirometer associated with the body plethysmograph or the hand-held spirometer associated with the MiniBoxTM. The calibration of associated flow transducers were confirmed in accordance with the manufacturers’ user manuals. In addition, spirometry measurements were performed in accordance with the manufacturers' user manuals and ATS/ERS guidelines.21 At least 3 measurements were taken with the spirometer. For SVC and forced vital capacity (FVC), the 2 highest values of the 3 measurements comprising the selected group must be within 5% (or 0.15 L) of each other. For IC, the 2 highest values of the 3 measurements comprising the selected group must be within 10% (or 0.15 L) of each other.
Subjects were subsequently measured with the MiniBoxTM flow-interruption device. With cheeks manually supported and a nose clip in place, each subject sat upright in a chair and breathed through a single-use disposable bacterial filter attached to the MiniBoxTM device (Figure 1A). The subject was asked to breathe normally for a short time until comfortable with the device. Then, brief flow interruptions (~70 msec) were automatically triggered in the vicinity of mid-inspiration of each tidal breath (Figure 1C). After a minimum of 25 such interruptions or a maximum of 150 seconds of tidal breathing, the subject performed a maximal inspiration twice to reach total lung capacity (TLC). The subject then exhaled slowly to residual volume (RV).
The above flow-interruption measurement was repeated up to 3 times. Volume drift was corrected assuming that FRC is stable over time. The entire measurement was deemed acceptable if the slow vital capacity (SVC) measured with the MiniBoxTM device was within 10% (or 0.15 L) of the SVC measured with the spirometer. MiniBoxTM flow interruption data was pre-processed and filtered based on pre-defined criteria.
Statistical model development. To construct an unbiased statistical model for TLC, we began by identifying 137 plausible metrics including transient of flows, pressures at different time points during the flow-interruption, and time derivatives of the aforementioned transient flows and pressure predictors, as well as spirometrical transients and indices, driven by a proprietary mathematical model of the
lungs. This model was then tested in 300 qualified volunteers.
From these 137 metrics, we then used a statistical algorithm – the LASSO18,22 – to find the smallest possible set of predictors that were statistically significant. The LASSO is an extension of multiple linear regression and finds a combination of parameters while forcing all but a few coefficients to be precisely zero, thereby, providing a minimal statistical model that is more readily interpretable. Here, the LASSO was accomplished using a tunable parameter that constrains the coefficients with cross-validation using random sampling with replacement (bootstrapping)23-25 repeated 300 times for each value from a range of possible values. Each sampling was constrained according to the same ratio of male/female and healthy/non-healthy as the entire group of subjects.
Statistical model for TLCMiniBox. Using the LASSO applied to the dataset of 300 subjects, we were able to arrive at a final statistical model to calculate TLCMiniBox based on flow and pressure transients resulting from the interruptions of the MiniBoxTM flow-interruption device, and spirometry.
N-fold cross-validation. To validate the appropriateness of the selected metrics, N-fold cross-validation was used on the dataset of 300 subjects. The dataset was randomly divided using 5-fold and 10-fold, each for 50 times, and the samples for each fold were selected randomly for each time. All parameters were found to contribute significantly to the model (p<0.001).
Prospective validation. Beyond the internal N-fold cross-validation, we performed an independent prospective study to further validate the TLCMiniBox equation resulting from the MiniBoxTM measurements. In a prospective heterogeneous cohort of 134 additional volunteers not previously studied (Table 1), we repeated the protocol of MiniBoxTM and body plethysmography measurements. We then used the new TLCMiniBox equation derived from the initial cohort of 300 to calculate TLCMiniBox and compare it to TLCpleth.

6
Total Lung Capacity with the MiniBoxTM: Clinical Results in Obstructed, Restrictive, and Healthy Adults
Figure 1: Overview of the MiniBoxTM flow-interruption device and associated measurement procedure. a) Photograph of the MiniBoxTM flow-interruption device during operation. The device sits on a table-top and the subject breathes tidally through a viral bacterial filter. b) Schematic illustration of the components of the MiniBoxTM flow-interruption device, depicting the relative positions of the cylindrical container, valve, and flowmeter. Arrows indicate the direction of flow during inspiration. c) Schematic illustration of the standard breathing pattern during a MiniBoxTM flow-interruption measurement. Increasing lung volume is shown on the vertical axis and time increases to the right. During tidal breathing, brief interruptions are triggered in the vicinity of mid-inspiration (dots). After a minimum of 25 such interruptions or a maximum of 150 seconds, the subject then inhales maximally to TLC twice (double inspiratory capacity) and then exhales slowly to RV (slow expiratory vital capacity).
7
Total Lung Capacity with the MiniBoxTM: Clinical Results in Obstructed, Restrictive, and Healthy Adults
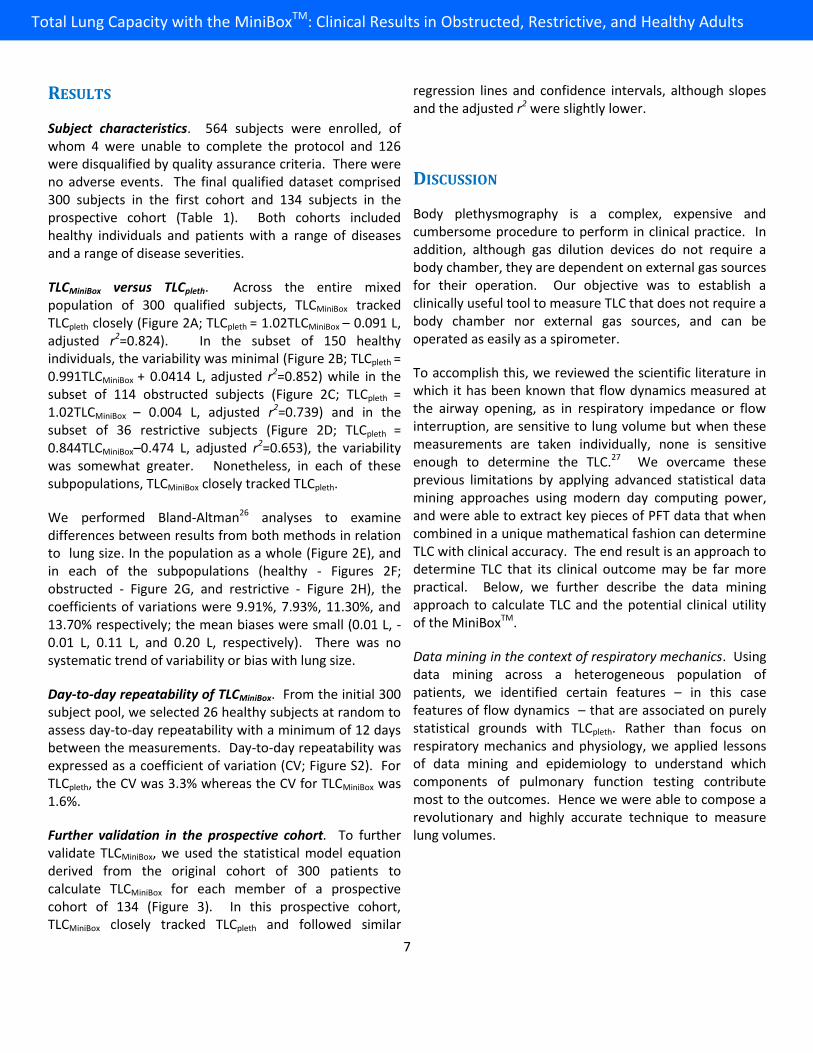
RESULTS
Subject characteristics. 564 subjects were enrolled, of whom 4 were unable to complete the protocol and 126 were disqualified by quality assurance criteria. There were no adverse events. The final qualified dataset comprised 300 subjects in the first cohort and 134 subjects in the prospective cohort (Table 1). Both cohorts included healthy individuals and patients with a range of diseases and a range of disease severities.
TLCMiniBox versus TLCpleth. Across the entire mixed population of 300 qualified subjects, TLCMiniBox tracked TLCpleth closely (Figure 2A; TLCpleth = 1.02TLCMiniBox – 0.091 L, adjusted r2=0.824). In the subset of 150 healthy individuals, the variability was minimal (Figure 2B; TLCpleth = 0.991TLCMiniBox + 0.0414 L, adjusted r2=0.852) while in the subset of 114 obstructed subjects (Figure 2C; TLCpleth = 1.02TLCMiniBox – 0.004 L, adjusted r2=0.739) and in the subset of 36 restrictive subjects (Figure 2D; TLCpleth = 0.844TLCMiniBox–0.474 L, adjusted r2=0.653), the variability was somewhat greater. Nonetheless, in each of these subpopulations, TLCMiniBox closely tracked TLCpleth.
We performed Bland-Altman26 analyses to examine differences between results from both methods in relation to lung size. In the population as a whole (Figure 2E), and in each of the subpopulations (healthy - Figures 2F; obstructed - Figure 2G, and restrictive - Figure 2H), the coefficients of variations were 9.91%, 7.93%, 11.30%, and 13.70% respectively; the mean biases were small (0.01 L, -0.01 L, 0.11 L, and 0.20 L, respectively). There was no systematic trend of variability or bias with lung size.
Day-to-day repeatability of TLCMiniBox. From the initial 300 subject pool, we selected 26 healthy subjects at random to assess day-to-day repeatability with a minimum of 12 days between the measurements. Day-to-day repeatability was expressed as a coefficient of variation (CV; Figure S2). For TLCpleth, the CV was 3.3% whereas the CV for TLCMiniBox was 1.6%.
Further validation in the prospective cohort. To further validate TLCMiniBox, we used the statistical model equation derived from the original cohort of 300 patients to calculate TLCMiniBox for each member of a prospective cohort of 134 (Figure 3). In this prospective cohort, TLCMiniBox closely tracked TLCpleth and followed similar
regression lines and confidence intervals, although slopes and the adjusted r2 were slightly lower.
DISCUSSION
Body plethysmography is a complex, expensive and cumbersome procedure to perform in clinical practice. In addition, although gas dilution devices do not require a body chamber, they are dependent on external gas sources for their operation. Our objective was to establish a clinically useful tool to measure TLC that does not require a body chamber nor external gas sources, and can be operated as easily as a spirometer.
To accomplish this, we reviewed the scientific literature in which it has been known that flow dynamics measured at the airway opening, as in respiratory impedance or flow interruption, are sensitive to lung volume but when these measurements are taken individually, none is sensitive enough to determine the TLC.27 We overcame these previous limitations by applying advanced statistical data mining approaches using modern day computing power, and were able to extract key pieces of PFT data that when combined in a unique mathematical fashion can determine TLC with clinical accuracy. The end result is an approach to determine TLC that its clinical outcome may be far more practical. Below, we further describe the data mining approach to calculate TLC and the potential clinical utility of the MiniBoxTM.
Data mining in the context of respiratory mechanics. Using data mining across a heterogeneous population of patients, we identified certain features – in this case features of flow dynamics – that are associated on purely statistical grounds with TLCpleth. Rather than focus on respiratory mechanics and physiology, we applied lessons of data mining and epidemiology to understand which components of pulmonary function testing contribute most to the outcomes. Hence we were able to compose a revolutionary and highly accurate technique to measure lung volumes.

8
Total Lung Capacity with the MiniBoxTM: Clinical Results in Healthy, Restricted, and Obstructed Adults
2 4 6 8 10
2
4
6
8
10
TLCMB
[L]
TLC
PLE
TH [
L]
adj. R2=0.824TLC
PLETH=1.02*TLC
MB - 0.091
All
Male
Female
2 4 6 8 10-3
-2
-1
0
1
2
3
(TLCPLETH
+ TLCMB
)/2 [L]
TLC
PLE
TH -
TLC
MB [
L]
CV: 9.91%
-1.08
0.01
1.11
2 4 6 8 10
2
4
6
8
10
TLCMB
[L]
adj. R2=0.852TLC
PLETH=0.991*TLC
MB + 0.0414
Healthy
2 4 6 8 10
(TLCPLETH
+ TLCMB
)/2 [L]
CV: 7.93%
-0.92
-0.01
0.9
2 4 6 8 10
2
4
6
8
10
TLCMB
[L]
adj. R2=0.739TLC
PLETH=1.02*TLC
MB - 0.00398
Obstructed
2 4 6 8 10
(TLCPLETH
+ TLCMB
)/2 [L]
CV: 11.3%
-1.18
0.11
1.4
2 4 6 8 10
2
4
6
8
10
TLCMB
[L]
adj. R2=0.653TLC
PLETH=0.844*TLC
MB + 0.474
Restrictive
2 4 6 8 10
(TLCPLETH
+ TLCMB
)/2 [L]
CV: 13.7%
-1.24
-0.2
0.85
A B C D
E F G H
Figure 2: Initial validation of MiniBox’s TLCMiniBox or TLCMB (300 subjects). (Top: A, B, C, D) Scatter plots of plethysmographic TLC (TLCPLETH) vs. MiniBoxTM TLC (TLCMB) for all subjects, healthy subjects only, obstructed subjects only, and restrictive subjects only. Males are represented by closed circles and females are represented by open circles. For subjects that were measured more than once on the device, the TLC is presented as the average value of all measurements. The dashed lines represent the unity line and the dotted lines represent the confidence intervals. The linear regression equation and the adjusted R2 are displayed within each graph. (Bottom: E, F, G, H) Associated Bland-Altman plots comparing MiniBoxTM TLC to plethysmographic TLC for all subjects, healthy subjects only, obstructed subjects only, and restrictive subjects only. The solid lines represent the mean bias while the dashed lines represent the upper and lower limits (±1.96*SD). The mean coefficient of variation (CV) is displayed within each graph.

9
Total Lung Capacity with the MiniBoxTM: Clinical Results in Healthy, Restricted, and Obstructed Adults
Figure 3: Independent, prospective validation of MiniBox TLC (134 subjects). (Top: A, B, C, D) Scatter plots of plethysmographic TLC (TLCPLETH) vs. MiniBoxTM TLC (TLCMB) for all subjects, healthy subjects only, obstructed subjects only, and restrictive subjects only. Males are represented by closed circles and females are represented by open circles. For subjects that were measured more than once on the device, the TLC is presented as the average value of all measurements. The dashed lines represent the unity line and the dotted lines represent the confidence intervals. The linear regression equation and the adjusted R2 are displayed within each graph. (Bottom: E, F, G, H) Associated Bland-Altman plots comparing MiniBoxTM TLC to plethysmographic TLC for all subjects, healthy subjects only, obstructed subjects only, and restrictive subjects only. The solid lines represent the mean bias while the dashed lines represent the upper and lower limits (±1.96*SD). The mean coefficient of variation (CV) is displayed within each graph.
2 4 6 8 10
2
4
6
8
10
TLCMB
[L]
TLC
PLE
TH [
L]
adj. R2=0.795TLC
PLETH=0.977*TLC
MB + 0.141
AllMale
Female
2 4 6 8 10-3
-2
-1
0
1
2
3
(TLCPLETH
+ TLCMB
)/2 [L]
TLC
PLE
TH -
TLC
MB [
L]
CV: 12.3%
-1.34
0.01
1.37
2 4 6 8 10
2
4
6
8
10
TLCMB
[L]
adj. R2=0.786TLC
PLETH=0.915*TLC
MB + 0.673
Healthy
2 4 6 8 10
(TLCPLETH
+ TLCMB
)/2 [L]
CV: 10.6%
-1.02
0.18
1.38
2 4 6 8 10
2
4
6
8
10
TLCMB
[L]
adj. R2=0.66TLC
PLETH=0.928*TLC
MB + 0.4
Obstructed
2 4 6 8 10
(TLCPLETH
+ TLCMB
)/2 [L]
CV: 12.9%
-1.6
-0.04
1.52
2 4 6 8 10
2
4
6
8
10
TLCMB
[L]
adj. R2=0.541TLC
PLETH=0.856*TLC
MB + 0.397
Restrictive
2 4 6 8 10
(TLCPLETH
+ TLCMB
)/2 [L]
CV: 14.1%
-1.2
-0.19
0.83
A B C D
E F G H

10
Total Lung Capacity with the MiniBoxTM: Clinical Results in Healthy, Restricted, and Obstructed Adults
Summary of clinical results. Our results show that TLCMiniBox is remarkably accurate compared to TLCpleth across the entire population studied and across specific patient subgroups. Among our prospective cohort of 134 subjects, who were healthy or had varying severities of obstructive and restrictive diseases, TLCMiniBox correlated well with TLCpleth (adjusted r2 = 0.795) with a slope close to unity (slope = 0.977) (Figure 3). Furthermore, in a subset of healthy subjects, TLCMiniBox was appreciably more repeatable from day-to-day than was TLCpleth (Figure 4), suggesting that TLCMiniBox may likely be useful in longitudinal clinical management.
Comparison to helium dilution and CT imaging. It is also important to understand how the MiniBoxTM compares to other alternative technologies to measure absolute lung volumes, namely helium dilution and computed tomography (CT). In a cohort of healthy, obstructive, and restrictive subjects, O’Donnell et al. performed Bland-Altman analyses to compare TLC measured using both helium dilution (TLCHe) and CT imaging (TLCCT) to TLC measured using plethysmography (TLCpleth).6 For TLCHe and TLCCT, the analysis showed coefficients of variation of 18.9% and 15.6%, respectively, together with systematic biases and trends for increasing error in subjects with larger TLCs (Figure 5B and 5C). Although we studied a different cohort, and results may therefore not be strictly comparable, Bland-Altman analysis of TLCMiniBox showed a coefficient of variation of 12.1% in our prospective cohort (N = 134 subjects), no systematic bias, and no trend of
1 2
4
6
8
Measurement Number
TLC
(L)
MiniBox
1 2
4
6
8
Measurement NumberT
LC
(L)
Body Plethysmograph
1 2
90
100
110
Measurement Number
TLC
(%
of
#1)
CV = 1.6 %
1 2
90
100
110
Measurement Number
TLC
(%
of
#1)
CV = 3.3 %
A B
C D
Figure 4: Repeatability of MiniBoxTM and Plethysmographic TLCs measured on two different days. (Top: A, B) TLC measured on day 1 and day 2 with the MiniBoxTM and the body plethysmograph. (Top: C, D) TLC normalized to the day 1 value. In 26 healthy subjects, the MiniBoxTM day-to-day repeatability was 1.6% compared to 3.3% for body plethysmograph.
Figure 5: Bland-Altman Plots for MiniBoxTM TLC, CT TLC, and Helium TLC compared to Plethysmographic TLC. In comparison to plethysmographic TLC, the absolute errors in MiniBoxTM TLC are smaller than the errors in CT TLC and Helium TLC.
0 5 10-4
-2
0
2
4
(TLC pleth + TLC CT)/2
TLC
ple
th -
TLC
CT
Pleth vs. ODonnell CT
N = 149 CV = 15.6 %
0 5 10-4
-2
0
2
4
(TLC pleth + TLC He)/2
TLC
ple
th -
TLC
He
Pleth vs. ODonnell He
N = 149 CV = 18.9 %
0 5 10-4
-2
0
2
4
(TLC pleth + TLC MB)/2
TLC
ple
th -
TLC
MB
Pleth vs. MiniBoxPFT
N = 134 CV = 12.1 %

11
Total Lung Capacity with the MiniBoxTM: Clinical Results in Healthy, Restricted, and Obstructed Adults
increasing error with increasing TLC (Figure 5A). While each of these technologies is based on a different mechanism-of-action, and thus, is not expected to mimic plethysmographic TLC faithfully in all subjects, TLCMiniBox values had the smallest deviations from those of TLCpleth.
Potential clinical utility. While the NHLBI, ATS, and ERS have encouraged innovation in technologies to measure absolute lung volumes28, these organizations recommend rigorous testing of new technologies to ensure they do not differ substantially from standard techniques, as well as to show that the new technologies offer advantages specifically in terms of improved accuracy, ease of use, and rapidity of testing. As evidenced by our data, the MiniBoxTM performs quite similarly to body plethysmography in all measured sub-populations. Also, the MiniBoxTM outperforms helium dilution and CT imaging approaches and surpasses body plethysmography on day-to-day repeatability, which may be particularly useful for longitudinal chronic pulmonary disease management. Lastly, as it requires no external gas source and does not require a subject to sit within an airtight chamber, the MiniBoxTM may provide the clinician with a faster and easier-to-use tool to determine TLC. This may be particularly useful for lung volume measurements in routine office practice. The current standard for monitoring obstructed patients is with spirometry alone, whereasthe MiniBoxTM will permit the clinician to trend lung volumes and identify hyperinflation earlier on in the disease process.
Conclusions. This study establishes the validity of TLCMiniBox measured with the MiniBoxTM for rapid, accurate, and repeatable determination of TLC in a heterogeneous population of healthy adults and those with respiratory system diseases.
REFERENCES
1. Wanger J, Clausen JL, Coates A, et al. Standardisation of the measurement of lung volumes. The European respiratory journal 2005;26:511-22.
2. Brown MS, Kim HJ, Abtin F, et al. Reproducibility of lung and lobar volume measurements using computed tomography. Acad Radiol 2010;17:316-22.
3. Coates AL, Peslin R, Rodenstein D, Stocks J. Measurement of lung volumes by plethysmography. The European respiratory journal 1997;10:1415-27.
4. Garcia-Rio F, Dorgham A, Pino JM, Villasante C, Garcia-Quero C, Alvarez-Sala R. Lung volume reference values for women and men 65 to 85 years of age. Am J Respir Crit Care Med 2009;180:1083-91.
5. Hankinson JL, Stocks J, Peslin R. Reproducibility of lung volume measurements. The European respiratory journal 1998;11:787-90.
6. O'Donnell CR, Bankier AA, Stiebellehner L, Reilly JJ, Brown R, Loring SH. Comparison of plethysmographic and helium dilution lung volumes: which is best for COPD? Chest 2010;137:1108-15.
7. Quanjer PH, Stocks J, Polgar G, Wise M, Karlberg J, Borsboom G. Compilation of reference values for lung function measurements in children. Eur Respir J Suppl 1989;4:184S-261S.
8. Stocks J, Quanjer PH. Reference values for residual volume, functional residual capacity and total lung capacity. ATS Workshop on Lung Volume Measurements. Official Statement of The European Respiratory Society. The European respiratory journal 1995;8:492-506.
9. Jackson AC, Neff KM, Dorkin HL, Lutchen KR. Interpretation of respiratory input impedance in healthy infants. Pediatr Pulmonol 1996;22:364-75.
10. Farre R, Peslin R, Rotger M, Barbera JA, Navajas D. Forced oscillation total respiratory resistance and spontaneous breathing lung resistance in COPD patients. The European respiratory journal 1999;14:172-8.
11. Lutchen KR, Jackson AC. statistical measures of parameter estimates from models fit to respiratory impedance data: emphasis on joint variabilities. IEEE Trans Biomed Eng 1986;33:1000-9.
12. Jackson AC, Lutchen KR, Dorkin HL. Inverse modeling of dog airway and respiratory system impedances. J Appl Physiol 1987;62:2273-82.

12
Total Lung Capacity with the MiniBoxTM: Clinical Results in Healthy, Restricted, and Obstructed Adults
13. Lutchen KR, Jackson AC. Reliability of parameter estimates from models applied to respiratory impedance data. J Appl Physiol 1987;62:403-13.
14. Dorkin HL, Lutchen KR, Jackson AC. Human respiratory input impedance from 4 to 200 Hz: physiological and modeling considerations. J Appl Physiol 1988;64:823-31.
15. Chalker RB, Celli BR, Habib RH, Jackson AC. Respiratory input impedance from 4 to 256 Hz in normals and chronic airflow obstruction: comparisons and correlations with spirometry. Am Rev Respir Dis 1992;146:570-6.
16. Frey U, Suki B, Kraemer R, Jackson AC. Human respiratory input impedance between 32 and 800 Hz, measured by interrupter technique and forced oscillations. J Appl Physiol 1997;82:1018-23.
17. Cliff IJ, Evans AH, Pantin CF, Baldwin DR. Comparison of two new methods for the measurement of lung volumes with two standard methods. Thorax 1999;54:329-33.
18. Fu WJ. Penalized Regressions: The Bridge versus the Lasso. Journal of Computational and Graphical Statistics 1998;7:397-416.
19. Tibshirani R. Regression shrinkage and selection via the Lasso. J R Statist Soc B 1996;58:267-88.
20. Pellegrino R, Viegi G, Brusasco V, et al. Interpretative strategies for lung function tests. The European respiratory journal 2005;26:948-68.
21. Miller MR, Hankinson J, Brusasco V, et al. Standardisation of spirometry. The European respiratory journal 2005;26:319-38.
22. Tibshirani R. Regression shrinkage and selection via the lasso: a retrospective. Journal of the Royal statistical Society: Series B (statistical Methodology) 2011;73:273-82.
23. Bickel P, Freedman D. Some Asymptotic Theory for the Bootstrap. The Annals of Statistics 1981;9:1196-217.
24. Efron B. Bootstrap Methods: Another Look at the Jackknife. The Annals of Statistics 1979;7:1-26.
25. Singh K. On the Asymptotic Accuracy of Efron's Bootstrap. The Annals of Statistics 1981;9:1187-95.
26. Bland JM, Altman DG. Statistical methods for assessing agreement between two methods of clinical measurement. Lancet 1986;1:307-10.
27. Farre R, Peslin R, Oostveen E, Suki B, Duvivier C, Navajas D. Human respiratory impedance from 8 to 256 Hz corrected for upper airway shunt. J Appl Physiol 1989;67:1973-81.
28. Consensus statement on measurement of lung volumes in humans. In: Clausen JL, Wanger JS, eds. NHLBI

13
Total Lung Capacity with the MiniBoxTM: Clinical Results in Healthy, Restricted, and Obstructed Adults
PulmOne USA Tel: 1-844-PulmOne (1-844-785-6663) PulmOne International Tel: +972 77 510 0938
www.pulm-one.com [email protected]
About PulmOne: PulmOne is a global medical technology company dedicated to providing innovative solutions for pulmonary function testing (PFT) in the point of care setting. At PulmOne, we develop patient-friendly, hassle-free, and budget-conscious devices that deliver a wide range of accurate measurements for the diagnosis, treatment and monitoring of respiratory diseases.
Copyright © PulmOne Advanced Medical Devices, Ltd., 2014. All rights reserved.