Embed Size (px)
Citation preview

Torsional Vibration Measurement and Analysis

2LMS International | [email protected] | www.lmsintl.com
1. Torsional vibration analysis 3 a) What are torsional vibrations? 3 b) Where do torsional vibrations occur? 3
2. Torsional quantities 4 c) Angular position, velocity and acceleration 4 Angular position or angular displacement 4 Angular velocity 4 Angular acceleration 4 d) Torque 4 Torsional stress / Shear stress method 4 Twist angle method 4 e) Twist angle and twist RPM 4 f) Transmission error 5
3. Measurement sensors for torsional vibration 5 a) Direct measurements 5 Linear accelerometers 6 Angular accelerometers 6 Strain gauges 6 Dual-beam laser interferometers 6 b) Coder-based techniques 7 Magnetic pick-ups 7 Missing pulse correction 8 Optical sensors 8 Zebra tapes 8 Incremental encoders 9 c) Pulse signal conditioning 9 Analog Tacho 9 Digital Tacho – TTL 9 Digital Tacho – Differential TTL 9 d) RPM and angle reconstruction methods 9 e) Number of pulse per rotation 10 Nyquist-Shannon sampling theorem 10 Response bandwidth of mechanical systems 10 Relation order bandwidth for rotating machinery 10 Optimal number of pulses per rotation 10
4. Processing and analysis 11 a) Torsional resonances and torsional orders 11 Torsional orders 11 Torsional resonances 11 b) Processing 11 Fourier analysis 11 Angle domain analysis 11 c) Torsional animation 11
Annex 1: Tips and tricks for proper installation of zebra tape. 12
Annex 2: Pulse detection techniques 13Digital Tacho (Counter) 13Analog Tacho 13
Annex 3:Tacho reconstruction algorithm 14

3LMS International | [email protected] | www.lmsintl.com
1. Torsional vibration analysis
With eco-engineering comes a new range of issues to solve. New powertrain designs like start-stop systems, downsized engines, advanced torque lock-up strategies or the generic trend for weight reduction of the powertrain raise the importance of an in-depth understanding of torsional vibrations as they negatively impact comfort and ultimately engine and driveline efficiency. It is in general a concern in case of power transmission systems using rotating shafts and couplings, and thus equally important e.g. Turbo machinery manufacturers and integrators or for the marine drivelines.
This document provides an overview of the instrumentation and challenges related to torsional vibration testing, and gives practical guidelines to efficiently quantify and qualify torsional vibrations and their root-causes.
a) What are torsional vibrations?
Torsional vibrations are angular vibrations of an object, typically a shaft along its axis of rotation. As mainly rotational speeds are measured, torsional vibrations are assessed as the variation of rotational speed
within a rotation cycle. These RPM variations are typically induced by a non-smooth driving torque or a varying load. Structural sensitive frequencies along a driveline may then amplify and transfer these phenomena leading to comfort, durability or efficiency problems. The level of torsional vibration is influenced by a number of parameters, such as material properties, operating conditions like temperature, load, rpm… and will need to be taken into account.
Despite tremendous progress in modeling accuracy, overall system complexity still necessitates accurate qualification and quantification of these torsional vibrations, under controlled or real-life operating conditions, in order to better understand and refine counter measures.
b) Where do torsional vibrations occur?
Torsional vibrations are of importance whenever power need to be transmitted using rotating shaft or couplings, like is the case, e.g. automotive, truck and bus drivelines, recreation vehicles, marine drivelines or power-generation turbines. Below figure provides an overview of the different components that can generate torsional vibrations in ground vehicle drivelines. Similar figures can be made for marine drivelines or power transmission in the turbo machinery industry.
Root-causes analysis linking torsional and structural responses to the torsional sources.
Source System Transfer Receiverx =

4LMS International | [email protected] | www.lmsintl.com
2. Torsional quantities
c) Angular position, velocity and acceleration
Angular position or angular displacement
in [rad] or [°] (1)
Angular velocity
in [rad/s] or [°/s] or [RPM] (2)
Angular acceleration
in [rad/s2] or [°/s2] (3)
All three quantities are directly linked to each other, and can be derived by integration and differentiation. The choice of measurement quantity depends mainly on the type of sensors used. The most common quantity used to measure torsional vibrations is the angular velocity or RPM.
d) Torque
Torque quantifies the source of excitation. The angular velocity and displacement as discussed before, quantify the response of the applied torque. Torque and angular velocity are linked to each other. Basic formulation of a shaft in free conditions is:
(4)
With T [Nm] is the torque,Jz [m4] is the torsion constant or the polar moment of inertia
This formulation is similar to the formulation of Newton’s law, which links the force acting on a mass to the acceleration of that mass.
Different techniques exist to measure the torque. Two methods based on the shear stress measurement and the twist angle measurement are described here:
Torsional stress / Shear stress methodMost torque sensors are based on the measured shear stress at the outer surface of the shaft, which can be converted into torque by means of:
(5)
WhereT [Nm] is the torque,τ is the maximum shear stress at the outer surface (torsional stress),Jz [m4] is the torsion constant or the polar moment of inertia,R [m] is the outer section of the shaft.
For a circular section of the shaft,
R is the radius of the shaft and
(6)
Twist angle methodAn easiest instrumentation is based on the measurement of the relative angle deformation between two separate locations on the shaft.
(7)
WhereT [Nm] is the torque,GJz is the torsional stiffness (G [GPa] is the shear modulus, Jz [m4] is the torsion constant or the polar moment of inertia),Δα [rad] is the angle of twist, or twist angleL [m] is the length of the shaft.
For homogeneous isotropic materials, the shear modulus can be derived from the Young’s modulus and the Poisson’s ratio.
(8)
WhereE [GPa] is the Young’s modulus,ν is Poisson’s ratio
e) Twist angle and twist RPM
The twist rpm is the difference in rpm between the two extremities of a shaft. This difference in RPM between the two locations, the so called twist, is a measure for the torsional vibration on the shaft.
Twist angle = Angleposition2 – Angleposition1 (9)
Twist rpm = Rpmposition2 – Rpmposition1 (10)
Shaft torsion is estimated by measuring angular position or velocity on both extremities of the shaft.

5LMS International | [email protected] | www.lmsintl.com
f) Transmission error
On mechanical transmissions where rotating energy is transmitted from one rotating shaft to another, such as e.g. gearboxes or belt inter-connected shafts, transmission errors may occur.
The transmission error is the difference between the measured and theoretical angular position or velocity of the output shaft. It can be expressed as an absolute or relative value and can be expressed in relation to the driving or the driven shaft.
In other words, the transmission error quantifies the difference between the actual power transmission and the ideal power transmission. As such it quantifies the imperfectness of the device in transmitting its power or quantifies the dynamics that are added or loosed by the transmitting device to the input power.
Classical reasons for having a transmission error would be gear eccentricity, gear tooth bending, gear teeth not being constant in thickness, belt resonances…
Different mathematical or physical formulations of the transmission error are:
or or or
or or (11)
Where Te is the transmission error, α1 and α2 are respectively the angle measured on input and output shaft, rpm1 and rpm2 are respectively the angular velocity measured on input and output shaft, Tr is the transmission (gear) ratio
A value of 0 for transmission error would indicate a perfect transmission.
3. Measurement sensors for torsional vibration
Various measurement techniques are available for torsional vibration. The best sensor can be selected for each individual case based on the quantity to be measured, the type of analysis, the accessibility of the shaft, the ease of instrumentation and the required accuracy or level of detail.
a) Direct measurements
Linear accelerometersTwo linear accelerometers are fixed in parallel on the rotating shaft as shown on Figure 1. The two accelerometers will measure the tangential acceleration. As they have opposite direction in the fixed system of the rotation axis, any translational acceleration of the shaft is cancelled by taking the average of both accelerometers. The angular displacement, velocity and acceleration can be computed according to equations fromfigure 1.
Figure 1: Linear accelerometers configuration.
Classically for NVH analysis we will prefer the rpm quantity (equation 11).
(12)
Advantages: - High dynamic range directly determined by the dynamic range of the
used accelerometers. - Low sensitivity to the shaft translational vibrations when the two
accelerometers are properly aligned.
Disadvantages: - Expensive telemetry system or sensitive slip rings are needed to
transfer the acceleration signals from the rotating shaft to the measurement hardware.
- Mass loading for relatively small shafts influencing the structural behavior of the shaft, e.g. causing torsional resonances to shift in frequency or shaft unbalance.
- Bigger shafts at relatively high rpm cause centrifugal force that may lead to dangerous loss of accelerometers and measurement equipment when not sufficiently well glued.
- Since acceleration is measured, and angle and speed can only be derived by integration, no absolute angular position is available. Angle domain processing for example will not be possible.

6LMS International | [email protected] | www.lmsintl.com
Angular accelerometersSensor manufacturers propose fully integrated angular accelerometers to be fixed on shaft extremities including the sensors and the slip ring. Some are based on linear accelerometers applying the method described in previous paragraph. Other techniques like torsional springs can also be used.
Strain gaugesStrain gauges are glued on the shaft to measure the torsional elongation or stress (shear stress). As the stress is directly measured, this method is often used in durability tests to estimate the torsional fatigue.
Torsional vibration is mostly measured in half-bridge configuration, with two strain gauges positioned at a 45 degree angle on the shaft. For a full-bridge configuration, four strain gauges are placed, two on the shaft’s front side and two are on the shaft’s back side. The symmetric configuration compensates for unwanted measured quantities like bending stress (Figure 2).
Figure 2: Half bridge and full bridge configuration applied to torsional measurement.
Advantages: - Direct measurement of the torsional elongation of shear stress. - Low sensitivities to other deformation than torsional.
Disadvantages: - Expensive telemetry system or sensitive slip rings are needed to
transfer the acceleration signals from the rotating shaft to the measurement hardware. These systems may influence the structural behavior of the shaft due to mass loading.
- Bigger shafts at relatively high rpm cause centrifugal force that may lead to dangerous loss of accelerometers and measurement equipment when not sufficiently well glued.
- Exact angular speed and position are not known. Since acceleration is measured, and angle and speed can only be derived by integration, no absolute position is available. Angle domain processing for example will not be possible.
Dual-beam laser interferometersLaser interferometers can be used as well to measure torsional vibration. Laser manufacturers typically proposed specific systems for rotating measurement based on dual beam techniques to cancel the effect of translational movement of the shaft.
The angular velocity is computed from the velocity measured in the direction of the laser beams on the two pointed areas. Figure 3 illustrates the technique principle.
Figure 3: Torsional laser principle based on Doppler Effect.
Advantages: - Contactless measurement - Low sensitivity to shaft translation vibration - Low sensitivity to the shape of the shaft - Easy instrumentation
Disadvantages: - Expensive device. Since it is often required to measure torsional
vibrations at different shaft locations simultaneously, this is often a very large drawback.
- Exact angular speed and position are not known. Since velocity is measured, angle can only be derived by integration, no absolute position is available. Angle domain processing for example will not be possible.
- The size of the device does not allow using it in confined environment. Its use in real-life mobile conditions is very difficult or nearly impossible.
Figure 4: Torsional laser setup.

7LMS International | [email protected] | www.lmsintl.com
b) Coder-based techniques
Figure 5: Examples of coder-based setup.
Coder-based techniques make use of equidistantly spaced markers on the shaft or rotating part. The sensor measures every time a marker passes in front of a sensor and the time difference between two markers is used to estimate the angular velocity.
Figure 6: Coder-based measurement principle.
The coder-based techniques have the advantage to deliver rpm and discrete angle position. The data resolution is determined by a number of markers: the more markers, the more accurate information although for low speeds, one will need more markers than for high speeds.
Different types of set-ups to provide markers (coder) are used, for example, stripes drawn on the shaft or the teeth of the gears. Also different sensors are available to detect the markers, such as electro-magnetic pick-up or optical sensors. Incremental encoders are devices combining the coder and the sensor in a single hardware.
Magnetic pick-upsMagnetic pick-ups detect changes in the magnetic field or magnetic flux, typically resulting from metallic teeth passing the sensor. They are often used in industrial applications because of their robustness and low sensitivity to ambient dust. Set-ups for this are often very practical as well, since existing gear sets on the machine can be used as coder, e.g. gear-teeth on flywheels of transmissions. Resulting from that, magnetic pick-ups are very popular to measure torsional vibration, as they are easy to set up and, as they work very well with existing gear teeth, and as they are very robust. Most combustion engines today by default already, are equipped with them to transfer the different shaft positions to the engine or gearbox controllers.
Passive sensors like the Magneto-resistive or the Magneto-inductive are the most popular and most cost effective. The measured voltage from the sensor is generated by the changing flux, given by Faraday’s law:
(13)
With V generated magnetic voltageN number of wires in coil of the sensorΦ magnetic flux
As the change of the magnetic flux comes from the rotation of the shaft, the sensor does not need to be powered. The amplitude and the shape of the delivered signal however varies with the speed of the shaft (as this affects the differential of the magnetic flux) and may affect the accuracy of the teeth detection, mostly at low rotational speeds.
Figure 7: Influence of the rotational speed on the pulse level.
Other magnetic sensors are based on the Hall-effect. Often those sensors are equipped with miniaturized electronic circuit to condition the output to deliver a TTL type of output signal. They will also need to be powered.
Advantages: - Price. Mass production of magnetic pick-up for automotive or
industrial application has a very positive influence on their end-user price.
- Simplicity of instrumentation. The sensor is typically fixed on non-rotating components, which removes the need, e.g. telemetry. Coders are mostly generated by existing gear sets.
Disadvantages: - The number of teeth on the gear set limits the number of pulses per
rotation which could be insufficient to capture all torsional content. - Accuracy of the measurement will be very much dependent on the
machining accuracy and the deformation of the gear teeth. - The sensor must be fixed very close to the rotating shaft (less than
0.5 cm) which is sometimes difficult, e.g. when the shaft has an important translational movement.
- Relative displacement between the magnetic pick-up and the shaft, due to shaft bending, or due to displacement of the sensor, attached on a too soft mounting, will influence the quality of the measured pulses and generate a fictive torsional vibration.

8LMS International | [email protected] | www.lmsintl.com
Missing pulse correctionCoder wheels sometimes come with one or two consecutive missing teeth to generate an absolute angular reference position per rotation. Engine manufacturers use this possibility to synchronize the equipment linked to the coder with the cylinders’ top death center (TDC).
However, when such setup is used to provide coder pulses for torsional vibration analysis, missing pulse correction algorithms are needed. If not, the missing coder pulse would generate a spike into the rpm or angle estimation.
Although it’s clear that such coder will never be as accurate for torsional vibration measurements as the ones without missing pulses, they are often used when doing measurements on engines because of their advantage of providing the TDC reference and of being present on most engines.
Figure 8: Missing pulses correction algorithm. An interpolation method is used to re-generate the missing pulse. The next pulse directly after the missing one is used as absolute angle reference.
This configuration requires special care for the magnetic pick-up sensor. The hysteresis of the sensor does not always allow a good and accurate detection of the pulse located directly after the missing one.
Optical sensorsMany types of optical sensors can be found on the market, however most of them are designed for object detection. To measure torsional vibrations, the sensor not only needs to be able to detect a high rate of events per second, also the timing accuracy of that detection is very important and this accuracy is often insufficient.
Optical sensors generate an electric signal proportional to the received versus light intensity. Optical fibers are used to conduct the light from the emitter to the sensor head, and back from the sensor head to the receptor. They can be configured in reflection or transmission configuration.
Figure 9: Examples of optical sensor setups.
Optical sensors can be used with much different type of coders as soon as the visible contrast between the stripes can be sufficient. Most optical sensors deliver TTL output signal.
Advantages: - The instrumentation can be extremely simple as the sensor is
typically fixed on non-rotating components. Only the coder needs to rotate.
- Optical sensors can be directly instrumented on gears as we would do with magnetic pick-ups, under condition that the reflection of the material gear surface is sufficient
- Coders can easily be implemented on the shaft with contrasted paint or ‘Zebra’ tapes.
- Quick response and good phase accuracy of good quality optical sensor allow the measurement of very high pulse rate.
Disadvantages: - The sensitivity to ambient the light and/or the quality of the
material reflection complicate the direct instrumentation of the gears in gearboxes.
- The sensor must be fixed very closely to the rotating shaft (less than 0.5 cm) which is sometimes difficult when the access is limited or when the shaft has some important translational movement.
- Relative displacement between the magnetic pick up and the shaft, due to shaft bending, or due to displacement of the sensor, attached on a too soft mounting, will influence the quality of the measured pulses and generate a fictive torsional vibration.
Zebra tapesBlack and white tapes are more and more used to quickly implement a coder on a shaft. It can be used to create a coder where no gear wheel is available or when a higher number of pulses per rotation are needed. There are two families of tape depending if it must be glued around the shaft (zebra tape) or on the extremity (zebra disc). Zebra tapes and discs exist in multiple stripe width to adapt the number of pulses per revolution in function of the shaft diameter.
Although zebra tape is very easy to instrument, an error will be introduced onto the measurement at the location where two zebra tape endings come together. When this point passes the optical sensor it will introduce a discontinuity in the rpm signal. The automatic correction method detailed in the paper ‘Zebra Tape Butt Joint Algorithm for Torsional Vibrations’ must be applied before analysis of the measured signal. Guidelines to obtain optimal results with zebra tapes are developed in annexes.
Figure 10: Zebra tape instrumentation and LMS automatic correction.
Zebra discs do not suffer for the inherent butt joint issue, however proper care needs to be taken to properly centering the disc. Since perfect centering is never possible, harmonic or order 1 is typically not reliable when using this coder set up.

9LMS International | [email protected] | www.lmsintl.com
Incremental encodersIncremental encoders are devices typically used in automat or robotic applications for accurate detection of shaft positions. Their high accuracy makes them very attractive for torsional vibration analysis applications as well. Often based on optical technology, incremental encoders combine the coder and the sensor in one single device. This means in practice it consists of both a rotating (rotor) and a static (stator) component and the full sensor needs to be mounted on the set up. Incremental encoders come in many different shapes and sizes, to cover all required applications.
Figure 11: Examples of incremental encoders.
The incremental encoder makes use of three embedded coders: one detecting one single pulse/revolution, called index, as absolute angle reference and two more high resolution encoders called A and B. The A and B signals have the exact same number of pulses but the B signal is phase shifted with a quarter of a pulse cycle (90 degrees) compared to A. Combination of these two coder signals allows detection of the sense of rotation of the coder.
Figure 12: A, B and Index signals from an incremental encoder.
Advantages: - The fully integrated approach allows developing accurate coders
with potentially very high pulse rate. Incremental encoders can be delivered with the appropriate number of pulses, depending on the application and desired accuracy (typically 50 to 500).
- The sense of rotation can be a great advantage i.e. for the investigation of start/stop behavior on engines.
- The integrated index signal by definition allows duty cycle related analysis with accurate TDC identification (e.g. engine combustion analysis).
Disadvantages: - The relative complex instrumentation limits their usage for in-vehicle
or mobile measurements. Incremental encoders are mainly used when working on test benches where the instrumentation makes part of the test bench equipment.
Figure 13: Incremental encoder instrumentation.
c) Pulse signal conditioning
Magnetic pick-ups, optical sensors and incremental encoders all output periodic signals to be processed into angular velocity and/or position by acquisition hardware. Some sensors have dedicated circuit to pre-process or pre-condition the signal into a standardized type of output signal like TTL or RS422/485.
The torsional vibration measurement system must detect accurately the time stamps, named tacho moments, at which a predefined level is crossed by the periodic sensor signal assuming a fixed angle increment between pulses. The required hardware signal conditioning, depends of the type of sensor being used and its’ corresponding signal type.
Figure 14: Pulse signal conditioning.
Analog TachoThe output signal is delivered as measured by the sensor, which means in practice that it can have any shape. A user defined trigger level is used to identify the tacho moments.
Digital Tacho – TTLMost optical sensors and some magnetic pick-ups are equipped with dedicated level detection circuit delivering a standardized digital signal (TTL), which allows clear and accurate detection of the tacho moments at higher pulse rates than the classical analog tacho.
Digital Tacho – Differential TTLSingle ended signals are more sensitive to electrical noise than differential signals, especially when longer cable lengths are needed. That is why the differential standards RS422/485 are recommended for incremental encoders, where the distance between the emitter and the sensor head cannot be changed.
d) Rpm and angle reconstruction methods
When using coder based sensors, each pulse detection moment corresponds to a known increase in angular position, i.e. at each tacho moment the angular position with respect to the first tacho moment is known.
Figure 15: Each pulse corresponds to a known increase in angular position. The difference in time between two pulses can be used to estimate the rotational speed.

10LMS International | [email protected] | www.lmsintl.com
To process the data in time or frequency domain, interpolation techniques must be used to estimate the position or the speed between two detected tacho moments and to generate a time-equidistant rpm or angle trace at the desired sampling frequency.
The interpolation method used can have an important impact on the quality of the analysis. Best techniques use digital reconstruction filters to avoid aliasing.
Figure 16 shows the difference in results, when looking at an rpm color map with (on the left) and without (on the right) appropriate digital reconstruction filters. Frequencies above 500 Hz are aliased to lower frequencies and affect the order cuts.
Figure 16: RPM reconstruction with (left) and without (right) digital reconstruction filter.
e) Number of pulse per rotation
The quality of coder based torsional measurements is heavily impacted by a correct selection of minimum number of pulses per rotation. In case too few markers per revolution are available, this will add an error, known as angle domain aliasing to the measured data. The minimum coder resolution can be identified following the three following principles, summarized in the picture below.
Figure 17: Number of pulses per revolution.
Nyquist-Shannon sampling theoremIn principal, the number of pulses per revolution required is determined by the Nyquist theorem applied to an angle domain acquisition:
If a angular function x(α) contains no order higher than Omax, it is completely determined by giving its ordinates at a series of points spaced 2π/(2Omax) radians apart.
In other words, the number of pulses per rotation must be at least two time higher than the maximum order.
ppr > 2 Omax (14)
Response bandwidth of mechanical systemsMechanical system responses to a certain excitation are band limited in frequency. The relevant frequency range for torsional vibrations is limited to a maximum and this maximum depends of the structural dynamics of the mechanical system (shaft, or component being analyzed). It also means that once for a specific overall RPM the order exceeds the bandwidth, this order is no longer of interest.Relation order bandwidth for rotating machineryThe maximum order observed is function of the bandwidth of the system and the rotational speed. For varying speeds (run-ups, run downs…), the minimum rpm determines this maximum observed order.
Omax = Bandwidth . 60 / Rpmmin (15)
Optimal number of pulses per rotationBased on those three principals, the optimal coder resolution can be estimated as follow:
ppr = 2. Omax = 120 . Bandwidth / Rpmmin (16)
As the bandwidth of the system cannot always easily be estimated, a safety factor of 2 or 4 is often applied.
In many cases, test engineers do not have the luxury of selecting the optimal coder for their test. When using coders available as part of the structure, like for example teeth in gearboxes, it’s always important to estimate the error made with too few pulses. The reversed equation 16 can be used to estimate the bandwidth of the coder for specific rpm conditions.
Bandwidth = ppr . Rpmmin / 120 (17)
Figure 18 illustrates the risk of angle domain aliasing.
Figure 18: Angle domain aliasing. The same torsional vibration is measured with a 60-ppr coder (left display) and a 20-ppr coder (right display). Orders 1 and 2 are perfectly measured with both coders. With the 20-ppr coder order 17 could not have been measured as expressed by the Nyquist-Shannon theorem and even more dramatically this order is aliased to order 3.

11LMS International | [email protected] | www.lmsintl.com
4. Processing and analysis
Once the measurements are done properly, specific processing techniques are used to quantify the torsional vibration phenomena or to correlate them with other acoustic or vibration responses of the structure.
a) Torsional resonances and torsional orders
Like for other translational vibration analysis, we can distinguish the torsional orders from the torsional resonances.
Torsional ordersTorsional orders are forced responses induced by the cyclic excitation of the rotating source. Fourier analysis of this irregular torque/rpm at a certain moment will show the different harmonics and their relative importance at that moment, thus related to the operating condition at that moment. The waterfall or color map of a combustion engine provides a global overview of the torsional frequency behavior, and thus also of the dominant torsional orders.
Torsional resonancesTorsional resonances, which are related to the structural properties of the system under investigation, are independent of the operating condition. Since, when excited, they very often amplify the torsional vibration phenomena, it is important to identify and quantify them.
As torsional excitation under operating conditions is mainly limited to the harmonics of the forcing Torque, torsional resonance levels can be small compared to the orders. A good measurement dynamic range will be important to avoid the torsional resonances being masked by the orders. Often the twist angle or the twist RPM is analyzed, since they remove most of the torsional orders and more clearly highlight the torsional resonances.
Accurate assessment of Torsional Resonances and Torsional Damping can be done via experimental modal analysis using often a torsional excitation signal, and measuring the torsional FRF’s between the torsional excitation and multiple rotational response Dofs.
b) Processing
Fourier analysisStationary or tracked Fourier analysis helps to identify torsional orders and torsional resonances. Correlation analysis between torsional quantities and other response signals like vibration or acoustic response is possible as the exact same processing can be applied on both types of signal.
Figure 19: Rpm tracking for time domain Fourier analysis.
Figure 20: Rpm tracking for angle domain Fourier analysis.
Angle domain analysisFor the detailed analysis of events occurring at a particular phase of the system cycle, like for example the combustion ignition timing in combustion engine, angle domain analysis aligns all measured signal to the same angle reference axis.
Figure 21: Alignment of the combustion pressure and the valve displacement to the angle position of the crank shaft versus rpm.
c) Torsional animation
The interpretation of the measurement can be simplified with a good visualization of the deformation on o 3D geometry of the test object. Animating the deformation at a fixed frequency or according to measured torsional orders allows to better qualify the importance of the phase relation between the different shafts or sections of shaft and vibration or acoustic responses. For transient phenomena, it’s often preferred to animate directly the measured time domain data.
Figure 22: Torsional Animation
12LMS International | [email protected] | www.lmsintl.com
Annex 1
Tips and tricks for proper installation of zebra tape
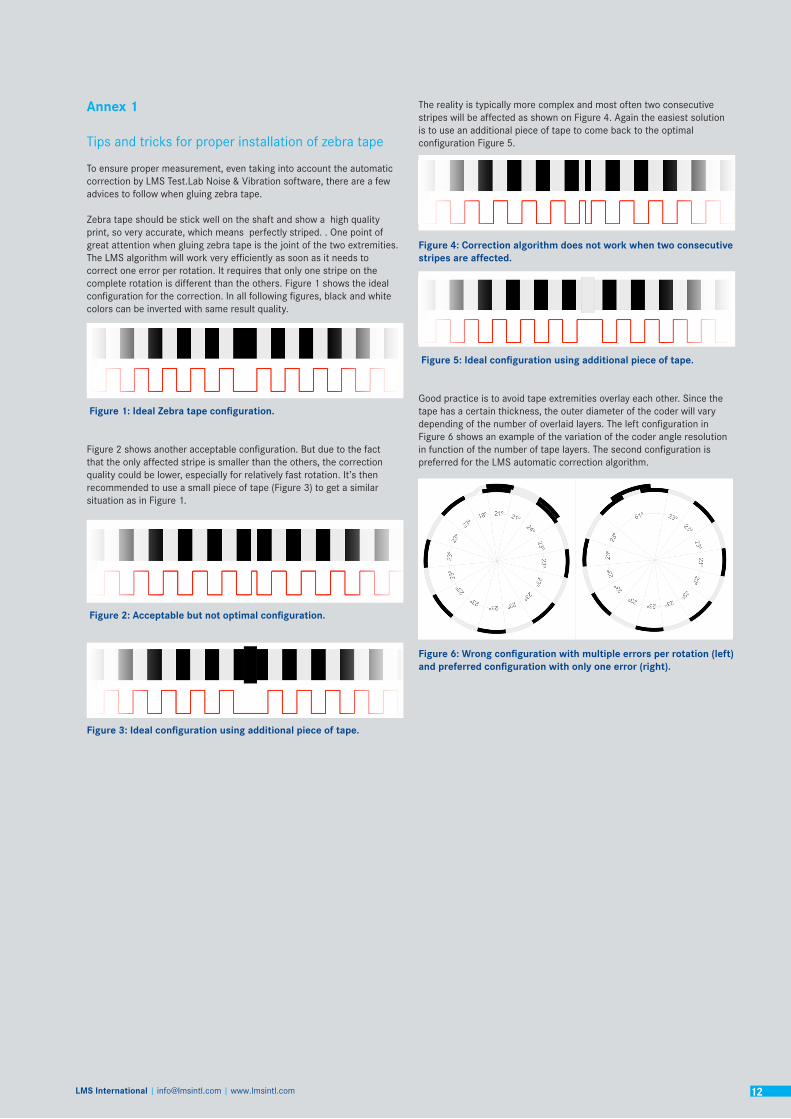
To ensure proper measurement, even taking into account the automatic correction by LMS Test.Lab Noise & Vibration software, there are a few advices to follow when gluing zebra tape.
Zebra tape should be stick well on the shaft and show a high quality print, so very accurate, which means perfectly striped. . One point of great attention when gluing zebra tape is the joint of the two extremities. The LMS algorithm will work very efficiently as soon as it needs to correct one error per rotation. It requires that only one stripe on the complete rotation is different than the others. Figure 1 shows the ideal configuration for the correction. In all following figures, black and white colors can be inverted with same result quality.
Figure 1: Ideal Zebra tape configuration.
Figure 2 shows another acceptable configuration. But due to the fact that the only affected stripe is smaller than the others, the correction quality could be lower, especially for relatively fast rotation. It’s then recommended to use a small piece of tape (Figure 3) to get a similar situation as in Figure 1.
Figure 2: Acceptable but not optimal configuration.
Figure 3: Ideal configuration using additional piece of tape.
The reality is typically more complex and most often two consecutive stripes will be affected as shown on Figure 4. Again the easiest solution is to use an additional piece of tape to come back to the optimal configuration Figure 5.
Figure 4: Correction algorithm does not work when two consecutive stripes are affected.
Figure 5: Ideal configuration using additional piece of tape.
Good practice is to avoid tape extremities overlay each other. Since the tape has a certain thickness, the outer diameter of the coder will vary depending of the number of overlaid layers. The left configuration in Figure 6 shows an example of the variation of the coder angle resolution in function of the number of tape layers. The second configuration is preferred for the LMS automatic correction algorithm.
Figure 6: Wrong configuration with multiple errors per rotation (left) and preferred configuration with only one error (right).

13LMS International | [email protected] | www.lmsintl.com
Annex 2
Pulse detection techniques
Accurate torsional analysis based on coders requires accurate estimation measurements of the pulse timing or tacho moments. The pulse detection techniques must be adapted to the signal generated by the sensor.
Digital Tacho (Counter)
When the torsional sensor delivers a well-conditioned signal (TTL / RS422 / RS485), the usage of a high rate digital counter allows to detect high pulse rate. This technique checks the signal level at fix clock rates and identifies a new pulse when the signal goes from low to high level between two consecutive samples. The pulses accuracy is equal to the inverse of the clock frequency.
Figure 1: Digital and Analog pulse detection technique.
Analog Tacho
Many sensors deliver a non-conditioned signal. The shape depends on the sensor technology used. Technology based on counters does not give sufficiently accurate results anymore. LMS developed a technology based on advanced digital signal processing. The technology limits the pulse rate to 40,000 pulses per seconds but with the same accuracy as a digital counter applied on a well-conditioned signal.
Figure 2: Pulse detection base on advanced curve-fitting for analog tacho.
13LMS International | [email protected] | www.lmsintl.com

14LMS International | [email protected] | www.lmsintl.com
Annex 3
Tacho reconstruction algorithm
The reconstruction algorithm converting the coder signal to a time equidistant rpm or angle curve is determinant in the quality of the Fourier analysis of the torsional vibrations.
1. A coder is used to get the timing of fixed angle position. Each time stamp or Tacho Moments gives the angular position at a measured time. The exact angular position between two taco moments is unknown. The average rotational speed between two tacho moments can be derived from the angular positions. The reconstruction algorithm will assume that the number of pulses per rotation is sufficient to capture the complete signal behavior according to the Nyquist-Shannon theorem applied to angle domain sampling.
2. A linear interpolation is used to estimate the rpm between the known samples. The linear interpolation preserves the angle increments between two tacho moments.
3. The interpolated curve is sampled at a frequency which is higher than the maximum frequency theoretically measurable by the coder for the complete rpm range.
4. A low pass filter is applied to remove all content generated by the interpolation and could not have been measured by the coder.
5. The signal is finally down sampled to the desired frequency for processing.
14LMS International | [email protected] | www.lmsintl.com