Embed Size (px)
Citation preview
10/19/2015
1
Tomatoes: Surprisingly difficult to describe
Dr Siân Astley
Training & Communications Manager
Rue Washington, 1050 Brussels, Belgium
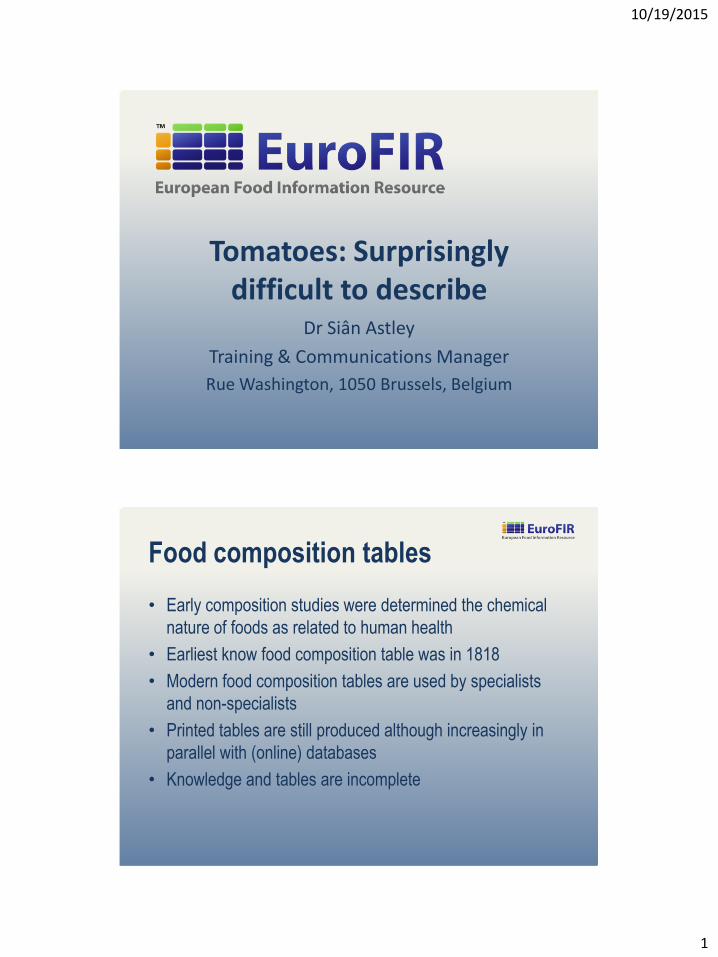
Food composition tables
• Early composition studies were determined the chemical
nature of foods as related to human health
• Earliest know food composition table was in 1818
• Modern food composition tables are used by specialists
and non-specialists
• Printed tables are still produced although increasingly in
parallel with (online) databases
• Knowledge and tables are incomplete
10/19/2015
2
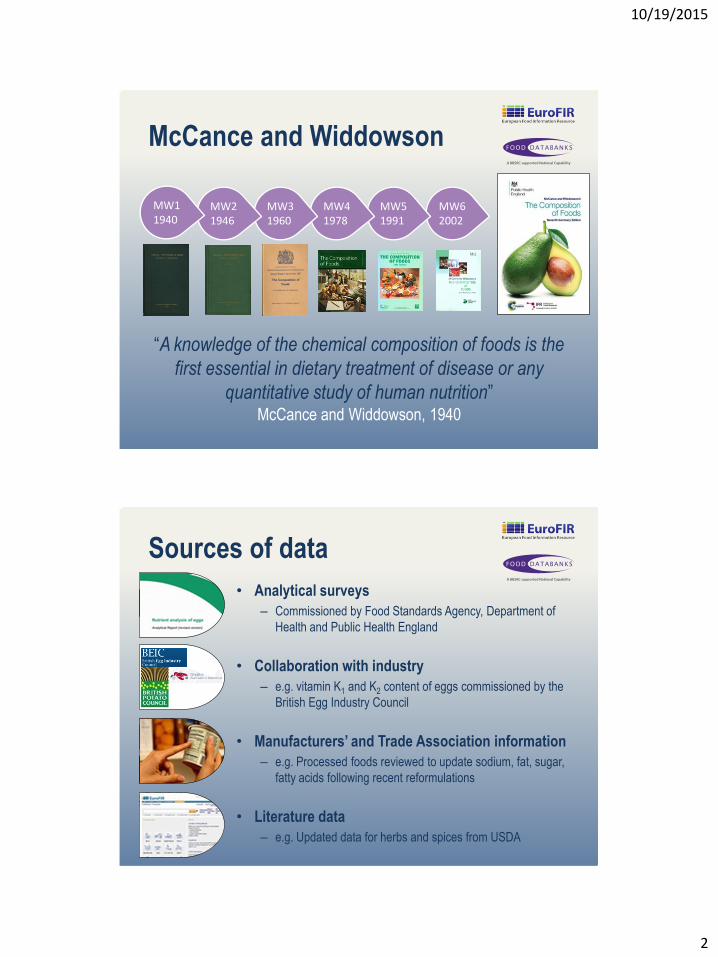
McCance and Widdowson
“A knowledge of the chemical composition of foods is the
first essential in dietary treatment of disease or any
quantitative study of human nutrition” McCance and Widdowson, 1940
MW6 2002
MW5 1991
MW4 1978
MW3 1960
MW2 1946
MW1 1940
Sources of data
• Analytical surveys
– Commissioned by Food Standards Agency, Department of
Health and Public Health England
• Collaboration with industry
– e.g. vitamin K1 and K2 content of eggs commissioned by the
British Egg Industry Council
• Manufacturers’ and Trade Association information
– e.g. Processed foods reviewed to update sodium, fat, sugar,
fatty acids following recent reformulations
• Literature data
– e.g. Updated data for herbs and spices from USDA
10/19/2015
3
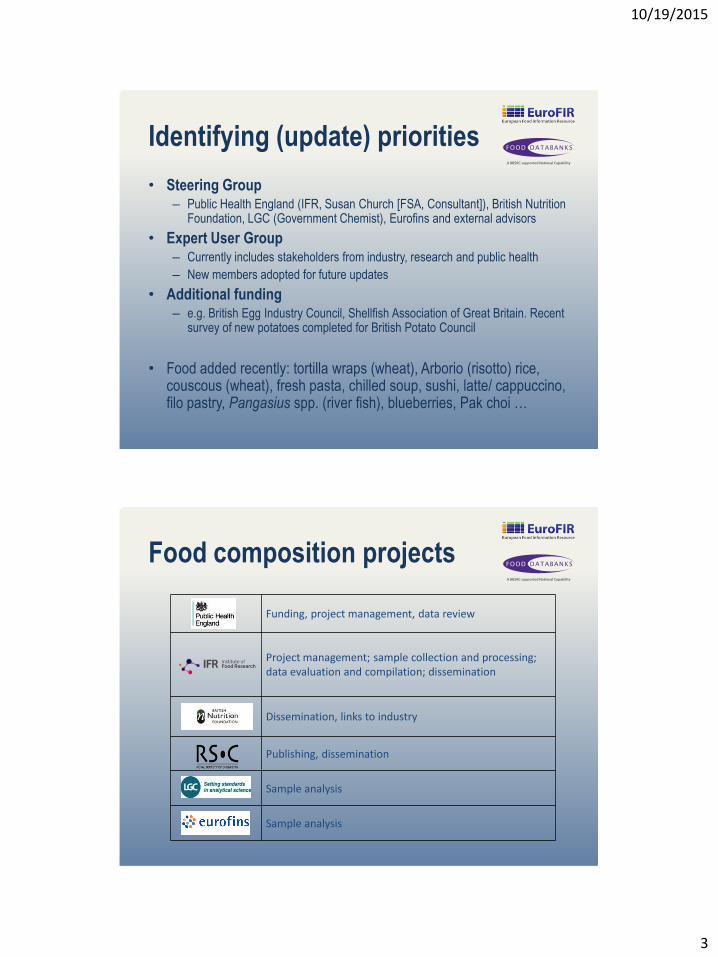
Identifying (update) priorities
• Steering Group – Public Health England (IFR, Susan Church [FSA, Consultant]), British Nutrition
Foundation, LGC (Government Chemist), Eurofins and external advisors
• Expert User Group – Currently includes stakeholders from industry, research and public health
– New members adopted for future updates
• Additional funding – e.g. British Egg Industry Council, Shellfish Association of Great Britain. Recent
survey of new potatoes completed for British Potato Council
• Food added recently: tortilla wraps (wheat), Arborio (risotto) rice, couscous (wheat), fresh pasta, chilled soup, sushi, latte/ cappuccino, filo pastry, Pangasius spp. (river fish), blueberries, Pak choi …
Food composition projects
Funding, project management, data review
Project management; sample collection and processing; data evaluation and compilation; dissemination
Dissemination, links to industry
Publishing, dissemination
Sample analysis
Sample analysis
10/19/2015
4
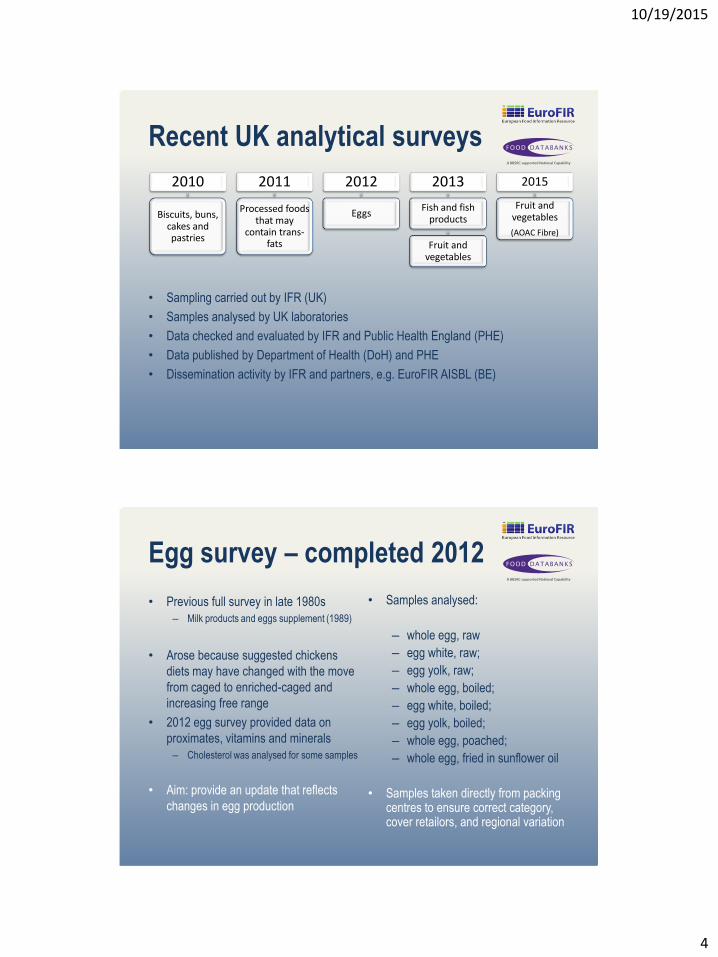
Recent UK analytical surveys
• Sampling carried out by IFR (UK)
• Samples analysed by UK laboratories
• Data checked and evaluated by IFR and Public Health England (PHE)
• Data published by Department of Health (DoH) and PHE
• Dissemination activity by IFR and partners, e.g. EuroFIR AISBL (BE)
2010
Biscuits, buns, cakes and pastries
2011
Processed foods that may
contain trans-fats
2012
Eggs
2013
Fish and fish products
Fruit and vegetables
2015
Fruit and vegetables
(AOAC Fibre)
Egg survey – completed 2012
• Previous full survey in late 1980s
– Milk products and eggs supplement (1989)
• Arose because suggested chickens
diets may have changed with the move
from caged to enriched-caged and
increasing free range
• 2012 egg survey provided data on
proximates, vitamins and minerals
– Cholesterol was analysed for some samples
• Aim: provide an update that reflects
changes in egg production
• Samples analysed:
– whole egg, raw
– egg white, raw;
– egg yolk, raw;
– whole egg, boiled;
– egg white, boiled;
– egg yolk, boiled;
– whole egg, poached;
– whole egg, fried in sunflower oil
• Samples taken directly from packing centres to ensure correct category, cover retailors, and regional variation
10/19/2015
5
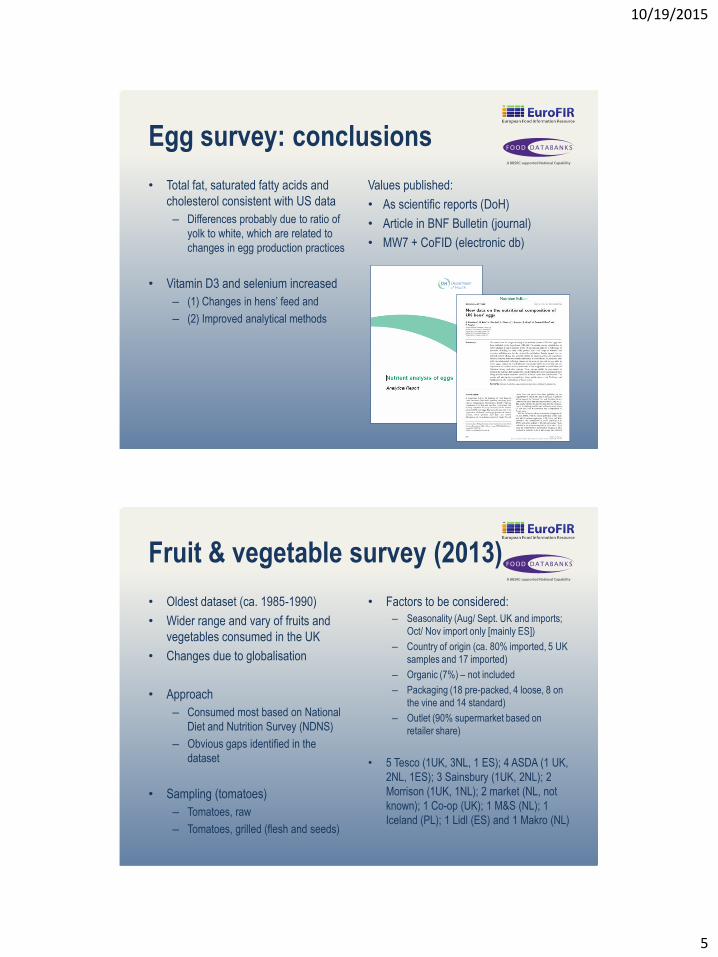
Egg survey: conclusions
• Total fat, saturated fatty acids and
cholesterol consistent with US data
– Differences probably due to ratio of
yolk to white, which are related to
changes in egg production practices
• Vitamin D3 and selenium increased
– (1) Changes in hens’ feed and
– (2) Improved analytical methods
Values published:
• As scientific reports (DoH)
• Article in BNF Bulletin (journal)
• MW7 + CoFID (electronic db)
Fruit & vegetable survey (2013)
• Oldest dataset (ca. 1985-1990)
• Wider range and vary of fruits and
vegetables consumed in the UK
• Changes due to globalisation
• Approach
– Consumed most based on National
Diet and Nutrition Survey (NDNS)
– Obvious gaps identified in the
dataset
• Sampling (tomatoes)
– Tomatoes, raw
– Tomatoes, grilled (flesh and seeds)
• Factors to be considered:
– Seasonality (Aug/ Sept. UK and imports;
Oct/ Nov import only [mainly ES])
– Country of origin (ca. 80% imported, 5 UK
samples and 17 imported)
– Organic (7%) – not included
– Packaging (18 pre-packed, 4 loose, 8 on
the vine and 14 standard)
– Outlet (90% supermarket based on
retailer share)
• 5 Tesco (1UK, 3NL, 1 ES); 4 ASDA (1 UK,
2NL, 1ES); 3 Sainsbury (1UK, 2NL); 2
Morrison (1UK, 1NL); 2 market (NL, not
known); 1 Co-op (UK); 1 M&S (NL); 1
Iceland (PL); 1 Lidl (ES) and 1 Makro (NL)
10/19/2015
6
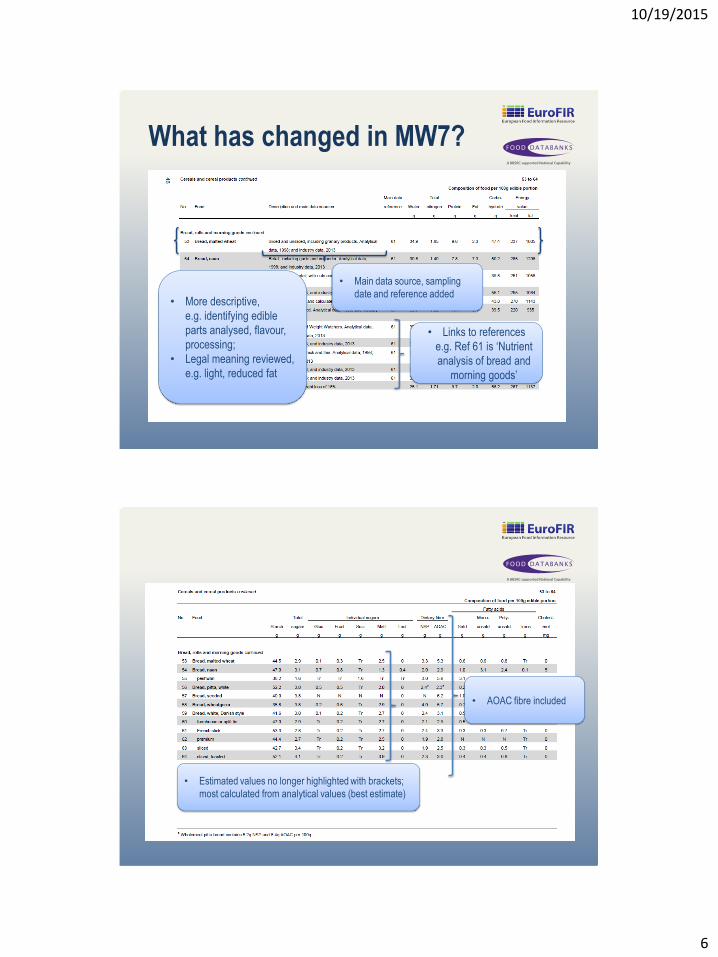
What has changed in MW7?
• Main data source, sampling
date and reference added • More descriptive,
e.g. identifying edible
parts analysed, flavour,
processing;
• Legal meaning reviewed,
e.g. light, reduced fat
• Links to references
e.g. Ref 61 is ‘Nutrient
analysis of bread and
morning goods’
• AOAC fibre included
• Estimated values no longer highlighted with brackets;
most calculated from analytical values (best estimate)
10/19/2015
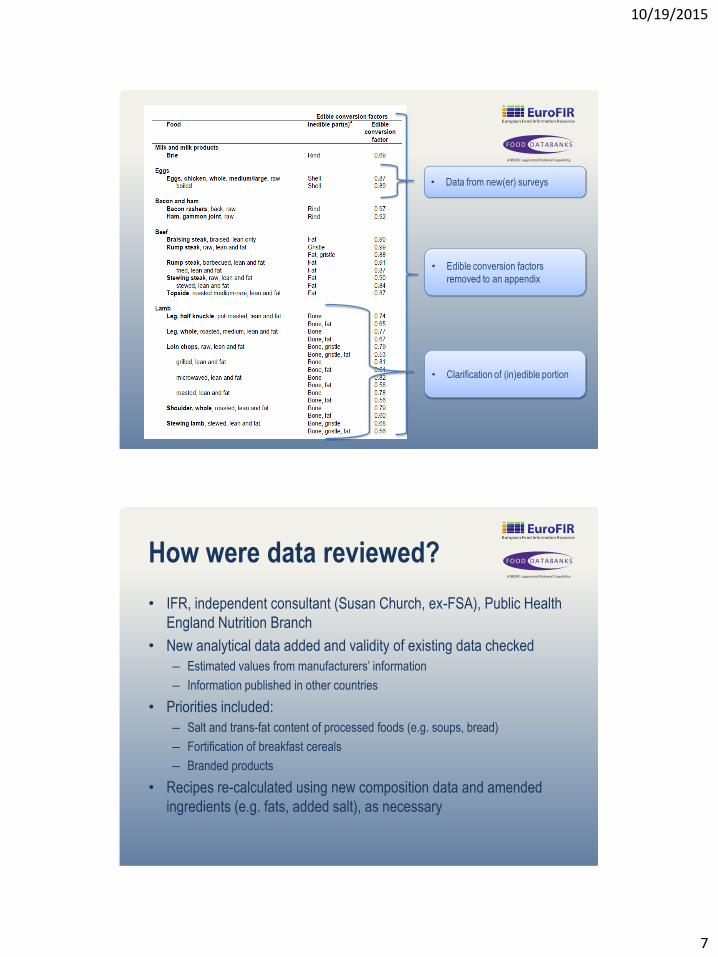
7
• Edible conversion factors
removed to an appendix
• Data from new(er) surveys
• Clarification of (in)edible portion
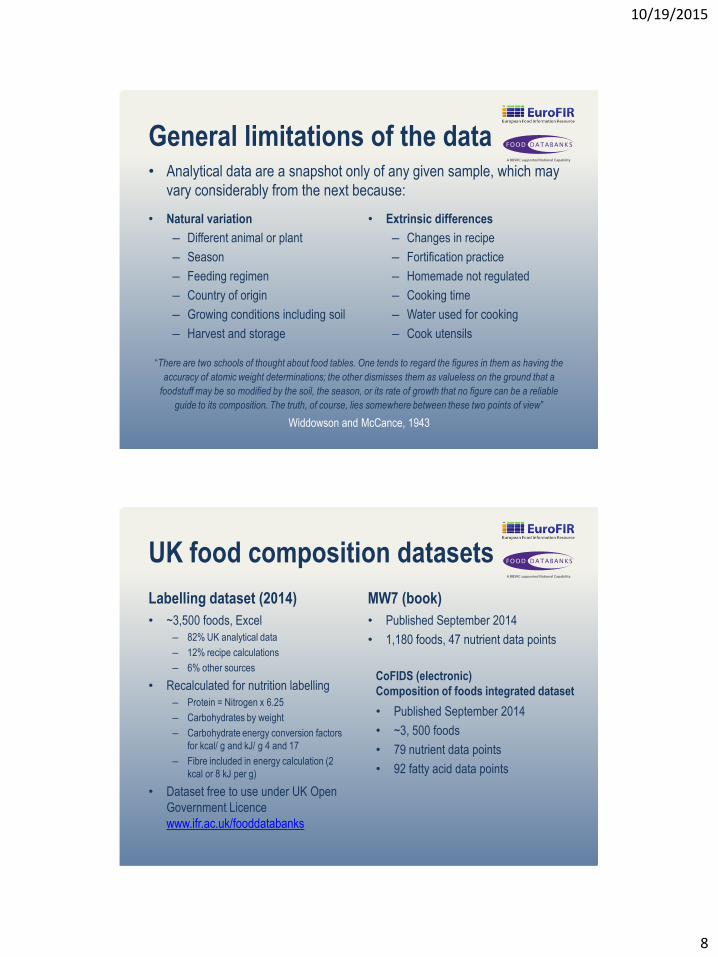
How were data reviewed?
• IFR, independent consultant (Susan Church, ex-FSA), Public Health
England Nutrition Branch
• New analytical data added and validity of existing data checked
– Estimated values from manufacturers’ information
– Information published in other countries
• Priorities included:
– Salt and trans-fat content of processed foods (e.g. soups, bread)
– Fortification of breakfast cereals
– Branded products
• Recipes re-calculated using new composition data and amended
ingredients (e.g. fats, added salt), as necessary
10/19/2015
8
General limitations of the data
• Natural variation
– Different animal or plant
– Season
– Feeding regimen
– Country of origin
– Growing conditions including soil
– Harvest and storage
• Extrinsic differences
– Changes in recipe
– Fortification practice
– Homemade not regulated
– Cooking time
– Water used for cooking
– Cook utensils
• Analytical data are a snapshot only of any given sample, which may
vary considerably from the next because:
“There are two schools of thought about food tables. One tends to regard the figures in them as having the
accuracy of atomic weight determinations; the other dismisses them as valueless on the ground that a
foodstuff may be so modified by the soil, the season, or its rate of growth that no figure can be a reliable
guide to its composition. The truth, of course, lies somewhere between these two points of view”
Widdowson and McCance, 1943
UK food composition datasets
Labelling dataset (2014)
• ~3,500 foods, Excel
– 82% UK analytical data
– 12% recipe calculations
– 6% other sources
• Recalculated for nutrition labelling
– Protein = Nitrogen x 6.25
– Carbohydrates by weight
– Carbohydrate energy conversion factors
for kcal/ g and kJ/ g 4 and 17
– Fibre included in energy calculation (2
kcal or 8 kJ per g)
• Dataset free to use under UK Open
Government Licence
www.ifr.ac.uk/fooddatabanks
MW7 (book)
• Published September 2014
• 1,180 foods, 47 nutrient data points
CoFIDS (electronic)
Composition of foods integrated dataset
• Published September 2014
• ~3, 500 foods
• 79 nutrient data points
• 92 fatty acid data points
10/19/2015
9
French food composition dataset
Labelling dataset (AFSSA)
• ~ 1 300 foods / 57 components
• ~ 150 recipes
• Regulation EU No 1169/2011
– "Protein, crude, N x 6.25" values
calculated for all foods
– Energy has been calculated
according to the Regulation
– Defines 'carbohydrate' as any
carbohydrate that is metabolized in
man including polyols
• Run by CIQUAL in the Observatory of
Food Nutritional Quality, ANSES
• Data may be used under the terms
and conditions of the Open Licence
Data structure (2013)
• ANSES/ CIQUAL food composition
database has two superposed levels:
– Initial data, as described originally
– Aggregated and consolidated data,
i.e. a selected value (usually the
average) and statistics (minimum
and maximum found in the initial
sources, total number of samples)
• Confidence code for average values,
characterising reliability of the value
[very reliable (A) to low reliability (D)]
• About 30 baby foods easily retrieved in
a new dedicated food group
• Vitamins K1 and K2
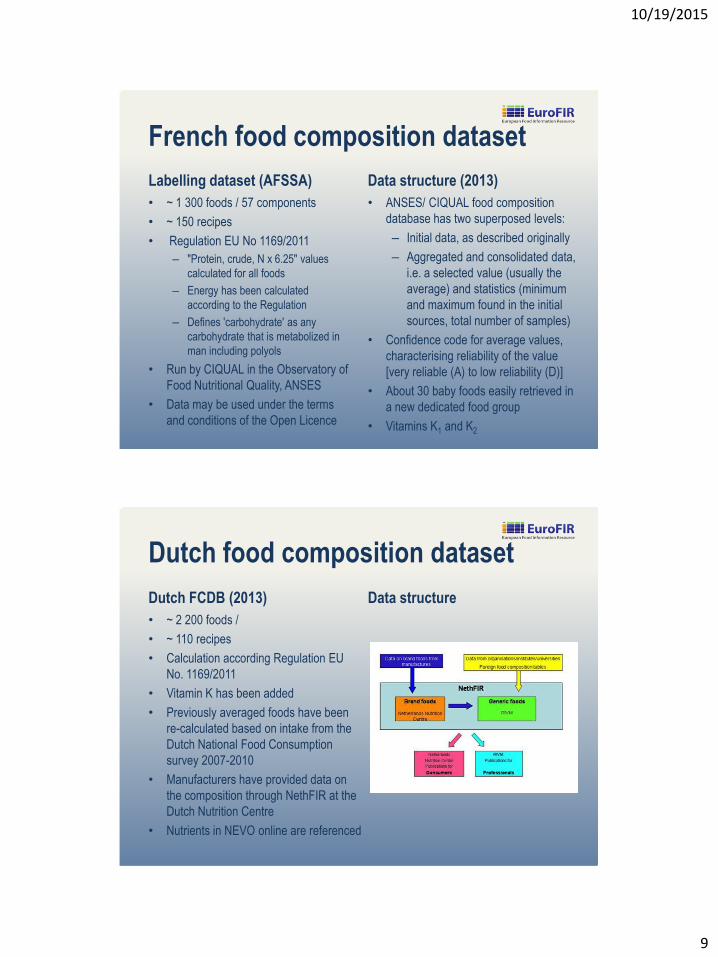
Dutch food composition dataset
Dutch FCDB (2013)
• ~ 2 200 foods /
• ~ 110 recipes
• Calculation according Regulation EU
No. 1169/2011
• Vitamin K has been added
• Previously averaged foods have been
re-calculated based on intake from the
Dutch National Food Consumption
survey 2007-2010
• Manufacturers have provided data on
the composition through NethFIR at the
Dutch Nutrition Centre
• Nutrients in NEVO online are referenced
Data structure
10/19/2015
10
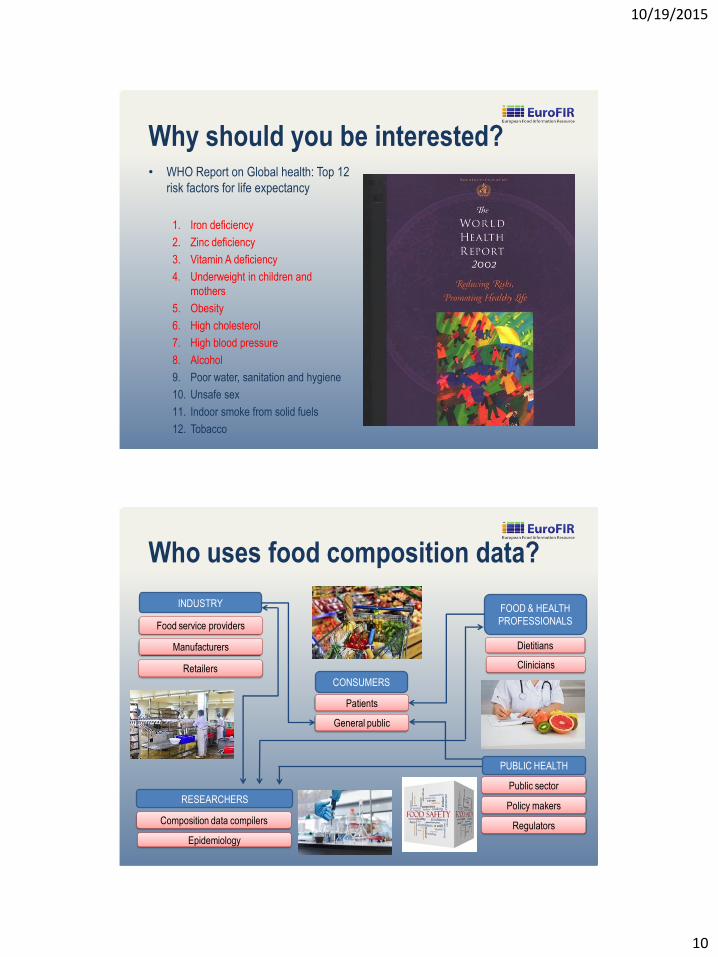
Why should you be interested? • WHO Report on Global health: Top 12
risk factors for life expectancy
1. Iron deficiency
2. Zinc deficiency
3. Vitamin A deficiency
4. Underweight in children and
mothers
5. Obesity
6. High cholesterol
7. High blood pressure
8. Alcohol
9. Poor water, sanitation and hygiene
10. Unsafe sex
11. Indoor smoke from solid fuels
12. Tobacco
Who uses food composition data?
INDUSTRY
Manufacturers
Retailers
Food service providers
FOOD & HEALTH
PROFESSIONALS
Dietitians
Clinicians
CONSUMERS
Patients
General public
RESEARCHERS
Epidemiology
Composition data compilers
PUBLIC HEALTH
Regulators
Public sector
Policy makers
10/19/2015
11
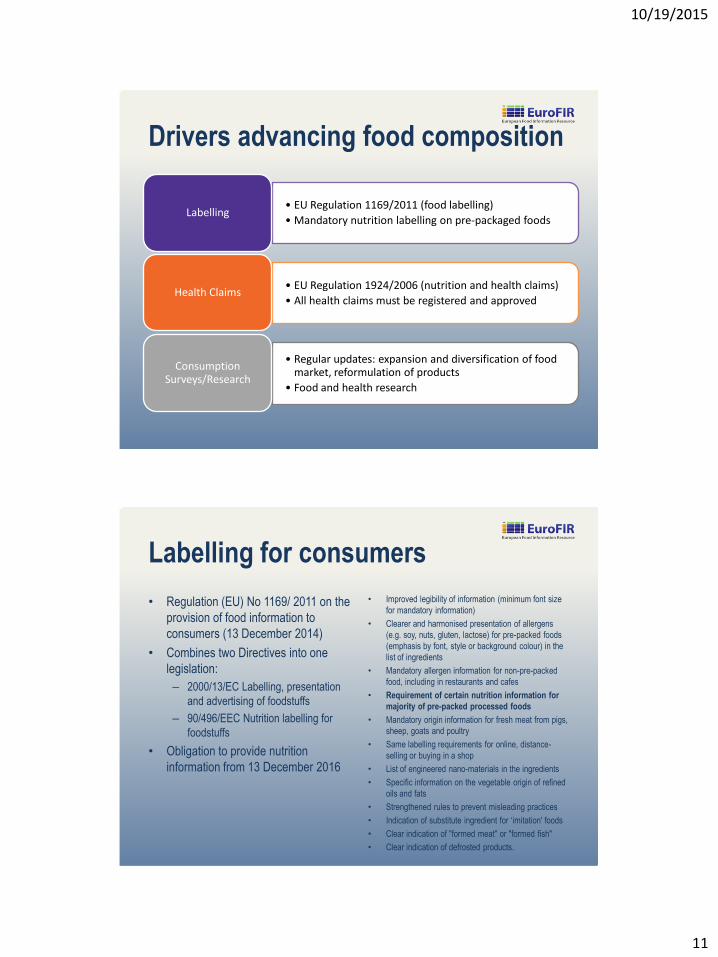
Drivers advancing food composition
• EU Regulation 1169/2011 (food labelling)
• Mandatory nutrition labelling on pre-packaged foods Labelling
• EU Regulation 1924/2006 (nutrition and health claims)
• All health claims must be registered and approved Health Claims
• Regular updates: expansion and diversification of food market, reformulation of products
• Food and health research
Consumption Surveys/Research
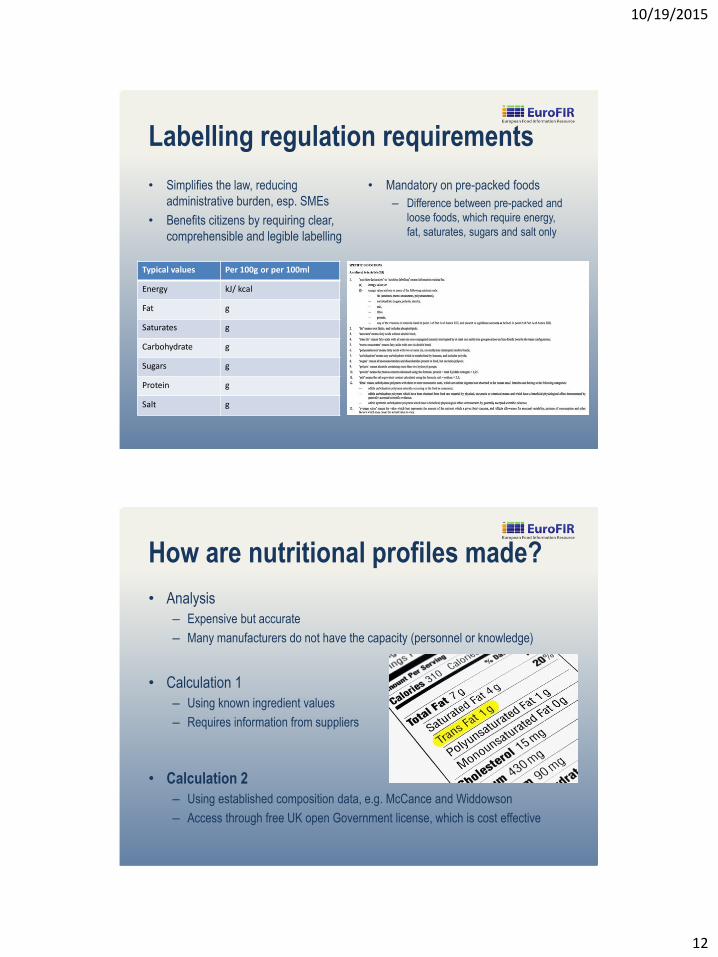
Labelling for consumers
• Regulation (EU) No 1169/ 2011 on the
provision of food information to
consumers (13 December 2014)
• Combines two Directives into one
legislation:
– 2000/13/EC Labelling, presentation
and advertising of foodstuffs
– 90/496/EEC Nutrition labelling for
foodstuffs
• Obligation to provide nutrition
information from 13 December 2016
• Improved legibility of information (minimum font size
for mandatory information)
• Clearer and harmonised presentation of allergens
(e.g. soy, nuts, gluten, lactose) for pre-packed foods
(emphasis by font, style or background colour) in the
list of ingredients
• Mandatory allergen information for non-pre-packed
food, including in restaurants and cafes
• Requirement of certain nutrition information for
majority of pre-packed processed foods
• Mandatory origin information for fresh meat from pigs,
sheep, goats and poultry
• Same labelling requirements for online, distance-
selling or buying in a shop
• List of engineered nano-materials in the ingredients
• Specific information on the vegetable origin of refined
oils and fats
• Strengthened rules to prevent misleading practices
• Indication of substitute ingredient for ‘imitation' foods
• Clear indication of "formed meat" or "formed fish"
• Clear indication of defrosted products.
10/19/2015
12
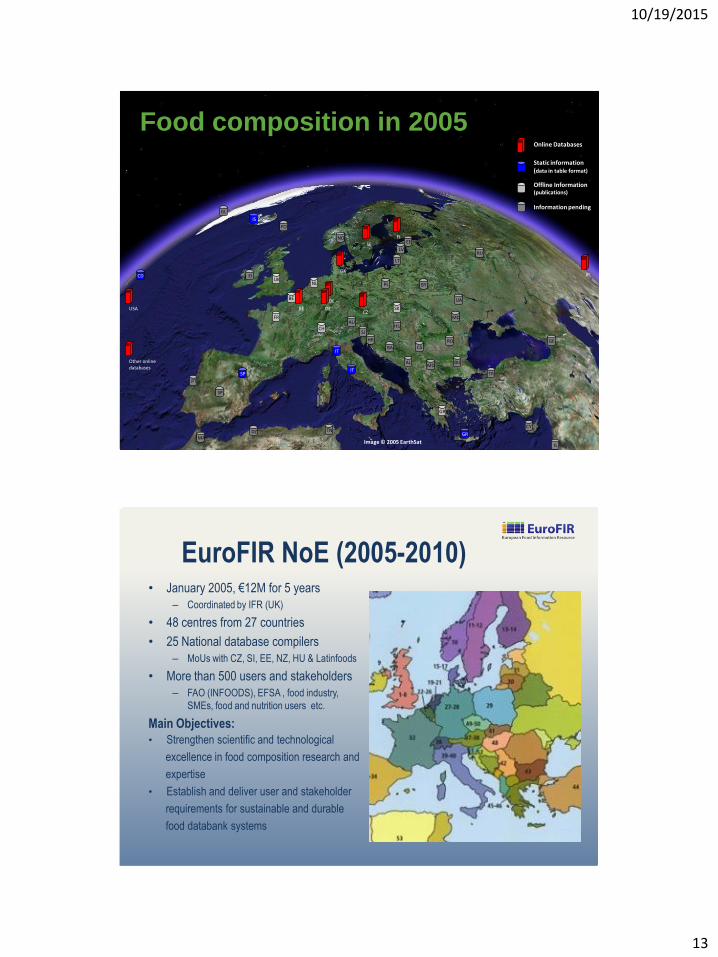
Labelling regulation requirements
• Simplifies the law, reducing
administrative burden, esp. SMEs
• Benefits citizens by requiring clear,
comprehensible and legible labelling
• Mandatory on pre-packed foods
– Difference between pre-packed and
loose foods, which require energy,
fat, saturates, sugars and salt only
Typical values Per 100g or per 100ml
Energy kJ/ kcal
Fat g
Saturates g
Carbohydrate g
Sugars g
Protein g
Salt g
How are nutritional profiles made?
• Analysis
– Expensive but accurate
– Many manufacturers do not have the capacity (personnel or knowledge)
• Calculation 1
– Using known ingredient values
– Requires information from suppliers
• Calculation 2
– Using established composition data, e.g. McCance and Widdowson
– Access through free UK open Government license, which is cost effective
10/19/2015
13
EuroFIR AISBL - www.eurofir.org
DK
SE
FI
DE
DE CZ
CD
FR
BE
NL
PT
SP
GL
IT
IT
SP
FO
IS
USA BE
UK
GR
GR
CY
IL
LV
EE
TR
PL
CH
LT
EI
MA
RO
DZ TN
NO
AU
SK
BA
HR
SI
AL
UA
BU
BY
MD
MD
GE CS
HU
RU
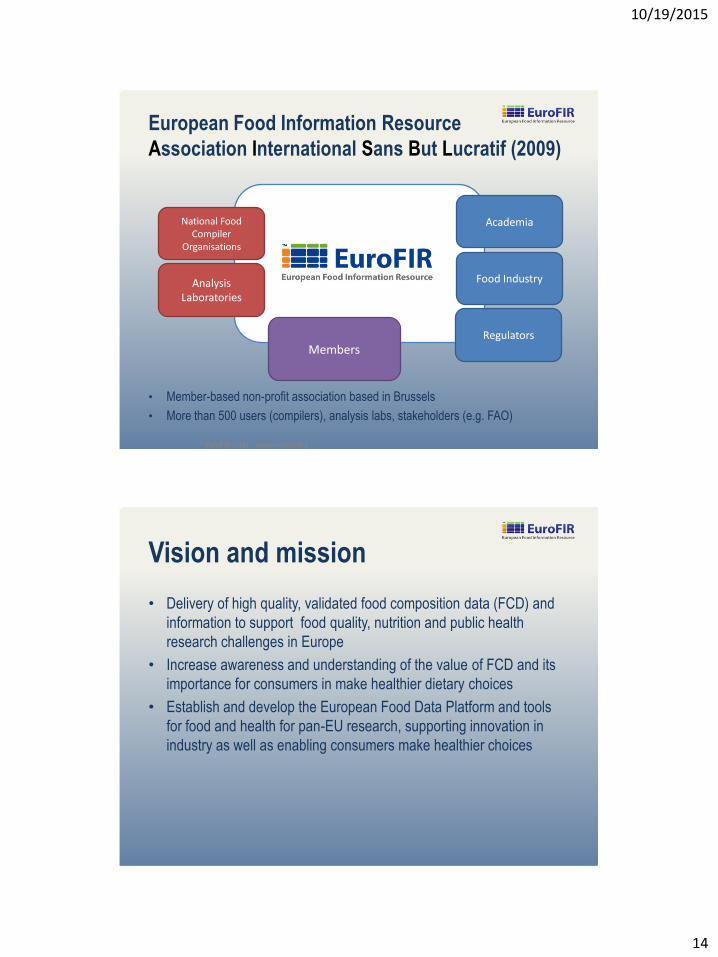
Online Databases
Static information (data in table format)
Offline Information (publications)
Information pending
Image © 2005 EarthSat
Other online databases
JP
Food composition in 2005
EuroFIR NoE (2005-2010) • January 2005, €12M for 5 years
– Coordinated by IFR (UK)
• 48 centres from 27 countries
• 25 National database compilers
– MoUs with CZ, SI, EE, NZ, HU & Latinfoods
• More than 500 users and stakeholders
– FAO (INFOODS), EFSA , food industry,
SMEs, food and nutrition users etc.
Main Objectives:
• Strengthen scientific and technological
excellence in food composition research and
expertise
• Establish and deliver user and stakeholder
requirements for sustainable and durable
food databank systems
10/19/2015
14
European Food Information Resource
Association International Sans But Lucratif (2009)
• Member-based non-profit association based in Brussels
• More than 500 users (compilers), analysis labs, stakeholders (e.g. FAO)
EuroFIR AISBL - www.eurofir.org
Academia
Regulators
Food Industry
National Food Compiler
Organisations
Analysis Laboratories
Members
Vision and mission
• Delivery of high quality, validated food composition data (FCD) and
information to support food quality, nutrition and public health
research challenges in Europe
• Increase awareness and understanding of the value of FCD and its
importance for consumers in make healthier dietary choices
• Establish and develop the European Food Data Platform and tools
for food and health for pan-EU research, supporting innovation in
industry as well as enabling consumers make healthier choices
10/19/2015
15
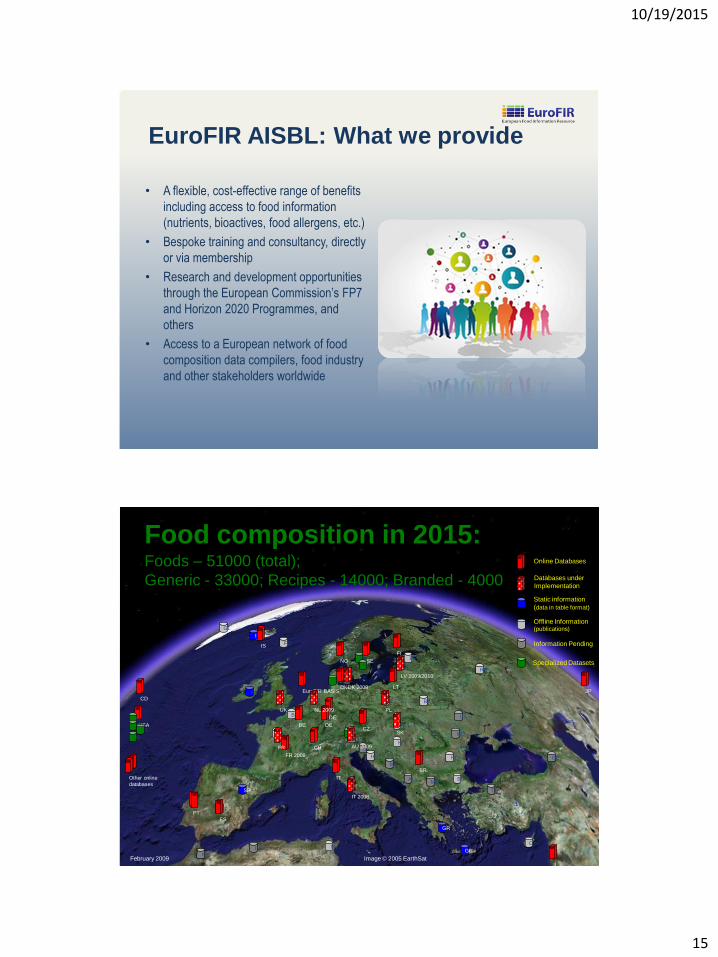
EuroFIR AISBL: What we provide
• A flexible, cost-effective range of benefits
including access to food information
(nutrients, bioactives, food allergens, etc.)
• Bespoke training and consultancy, directly
or via membership
• Research and development opportunities
through the European Commission’s FP7
and Horizon 2020 Programmes, and
others
• Access to a European network of food
composition data compilers, food industry
and other stakeholders worldwide
DK
SE
FI
DE
DE CZ
FR
BE
NL
SP
GL
IT SP
FO
IS
USA BE
GR
GR
CY
LV
EE
TR
PL
EI
MA
RO
DZ TN
AU
SK
BA
HR
SI
AL
UA
BU
BY
MD
MD
GE
HU
RU
Online Databases
Static information
(data in table format)
Offline Information (publications)
Information Pending
Image © 2005 EarthSat February 2009
JP
IS
FR 2008
FR
CD
IL
US
AU
US US
US
Specialized Datasets
EuroFIR BASIS
CH
SE
SE
DK
IT
NL 2009
ES
Databases under
Implementation
UK
SR
NO
Other online
databases
LT
IT 2008
PL
AU 2009
LV 2009/2010
DK 2008
GR
SK
PT
Food composition in 2015: Foods – 51000 (total);
Generic - 33000; Recipes - 14000; Branded - 4000
10/19/2015
16
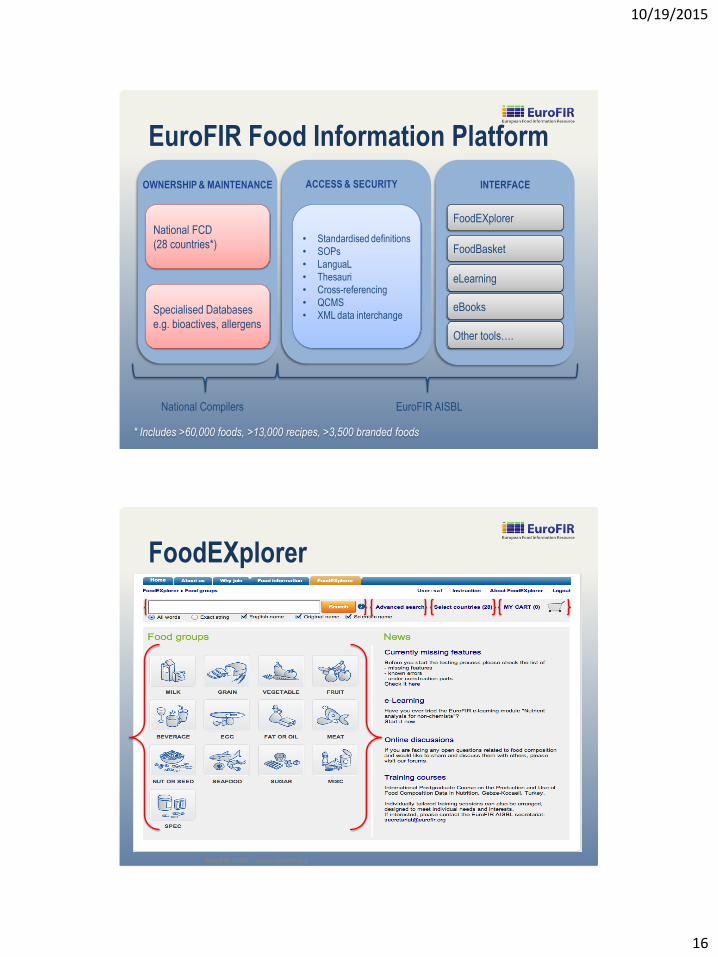
EuroFIR Food Information Platform
OWNERSHIP & MAINTENANCE ACCESS & SECURITY INTERFACE
National FCD
(28 countries*)
Specialised Databases
e.g. bioactives, allergens
• Standardised definitions
• SOPs
• LanguaL
• Thesauri
• Cross-referencing
• QCMS
• XML data interchange
FoodEXplorer
FoodBasket
eLearning
eBooks
Other tools….
National Compilers EuroFIR AISBL
* Includes >60,000 foods, >13,000 recipes, >3,500 branded foods
FoodEXplorer
EuroFIR AISBL - www.eurofir.org
10/19/2015
17
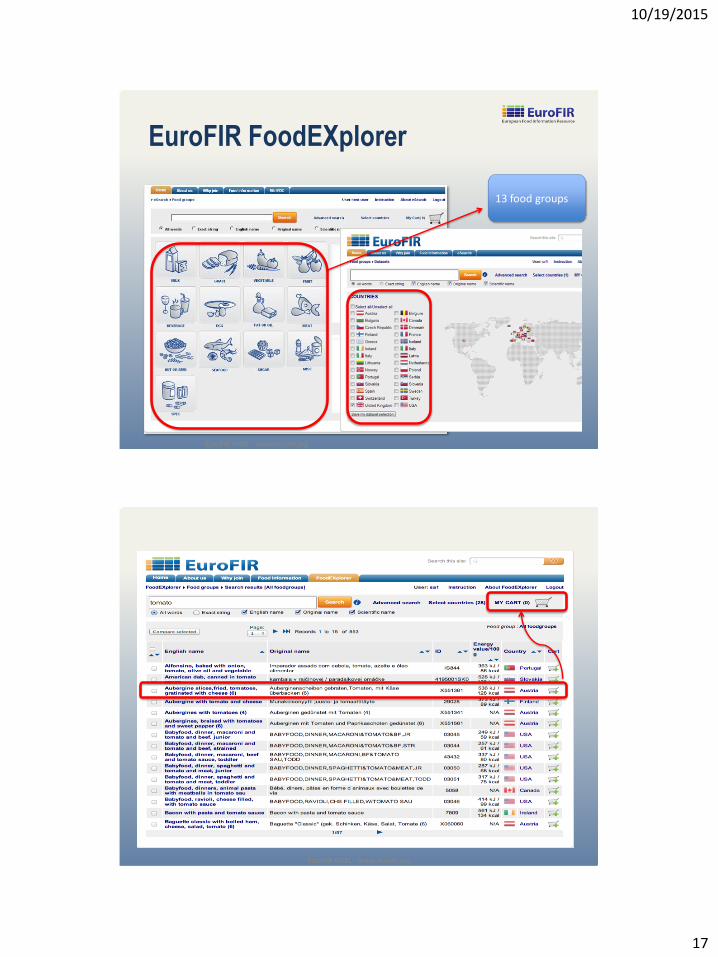
EuroFIR FoodEXplorer
EuroFIR AISBL - www.eurofir.org
13 food groups
EuroFIR AISBL - www.eurofir.org
10/19/2015
18
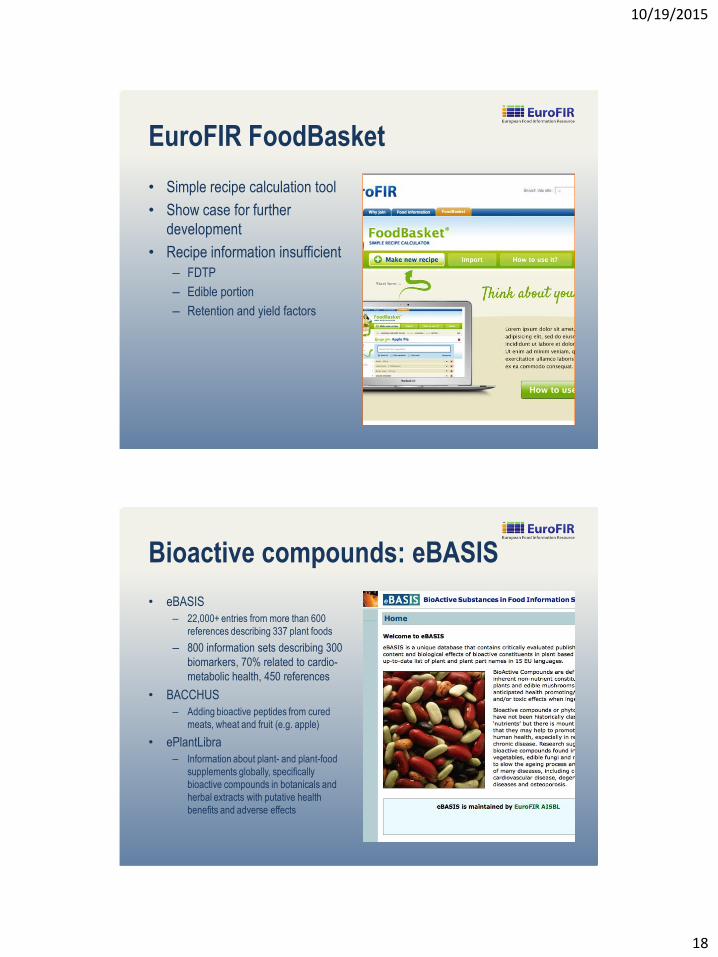
EuroFIR FoodBasket
• Simple recipe calculation tool
• Show case for further
development
• Recipe information insufficient
– FDTP
– Edible portion
– Retention and yield factors
Bioactive compounds: eBASIS
• eBASIS
– 22,000+ entries from more than 600
references describing 337 plant foods
– 800 information sets describing 300
biomarkers, 70% related to cardio-
metabolic health, 450 references
• BACCHUS
– Adding bioactive peptides from cured
meats, wheat and fruit (e.g. apple)
• ePlantLibra
– Information about plant- and plant-food
supplements globally, specifically
bioactive compounds in botanicals and
herbal extracts with putative health
benefits and adverse effects
10/19/2015
19
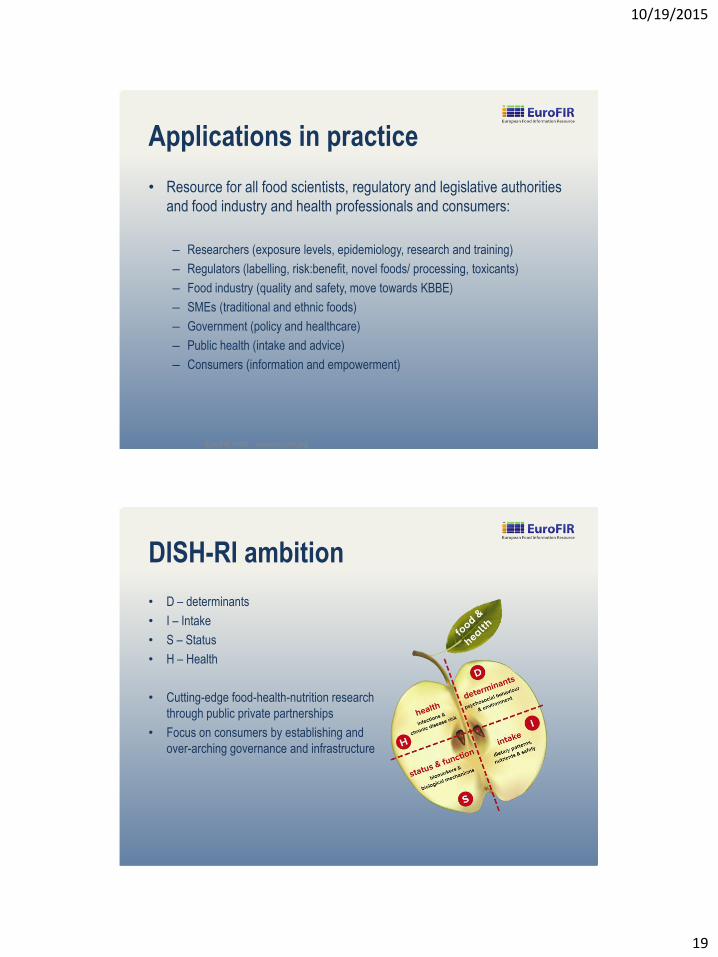
Applications in practice
• Resource for all food scientists, regulatory and legislative authorities
and food industry and health professionals and consumers:
– Researchers (exposure levels, epidemiology, research and training)
– Regulators (labelling, risk:benefit, novel foods/ processing, toxicants)
– Food industry (quality and safety, move towards KBBE)
– SMEs (traditional and ethnic foods)
– Government (policy and healthcare)
– Public health (intake and advice)
– Consumers (information and empowerment)
EuroFIR AISBL - www.eurofir.org
DISH-RI ambition
• D – determinants
• I – Intake
• S – Status
• H – Health
• Cutting-edge food-health-nutrition research
through public private partnerships
• Focus on consumers by establishing and
over-arching governance and infrastructure
10/19/2015
20
Conclusions
• Food composition tables are essential in:
– Manufacturing and retail
– Treatment of diet-related illness
– Prevention of chronic disease
• Food composition tables are incredible complex
– Identifying and recording foods
– Sampling and analysis
• Food composition tables are out-of-date (constantly)
– Knowledge and content, e.g. what we are eating (national diet surveys),
changing food habits, sampling and analysis methods, optimal health
• Food composition tables remain, however, central to understanding diet
and human health, and supporting consumers in making healthy choices