Embed Size (px)
Citation preview
2012 Meeting of the Technical Support Project Oklahoma City
Tomasz Kuder University of Oklahoma, Norman OK
1. Stable Isotopes: Basic Concepts and Definitions
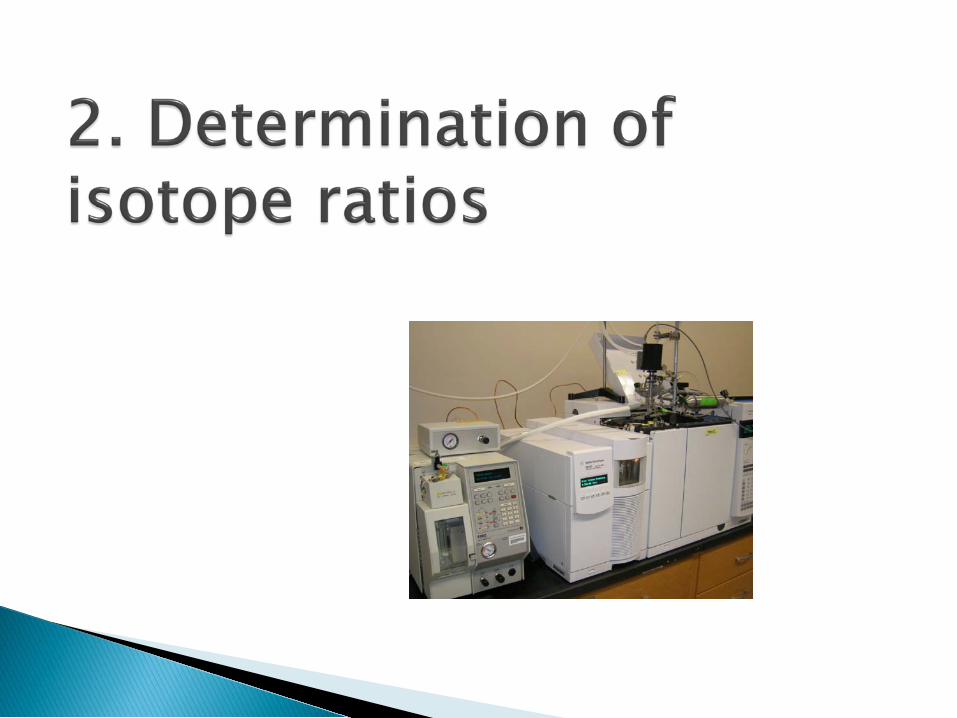
2. Determination of the Isotope Ratios 3. Isotope Composition of Env.
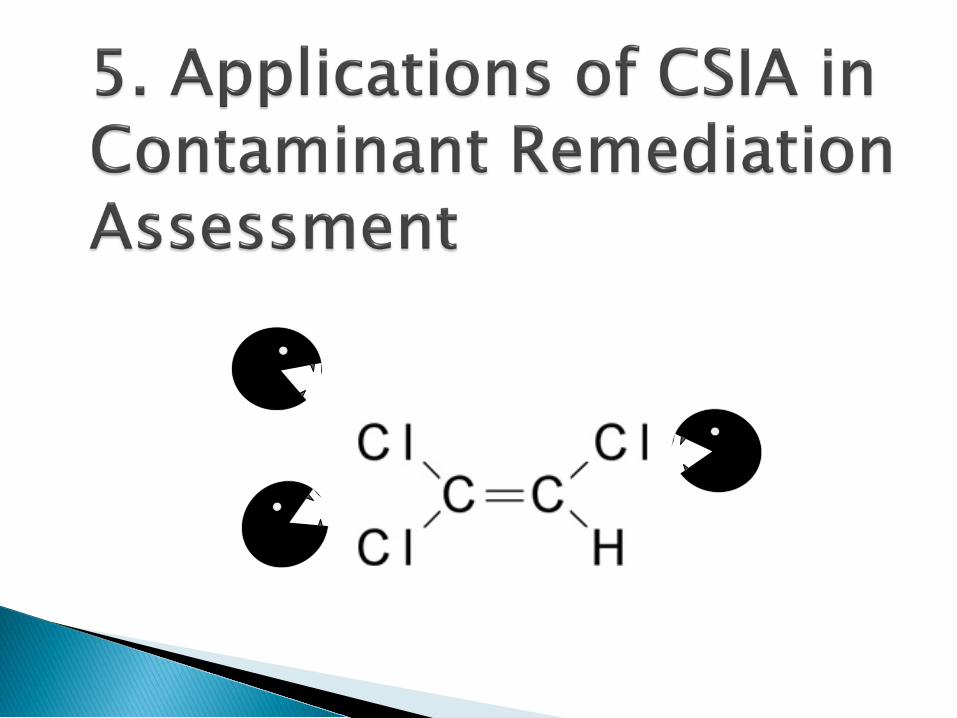
Contaminants 4. Applications: Source ID 5. Applications: Degradation assessment
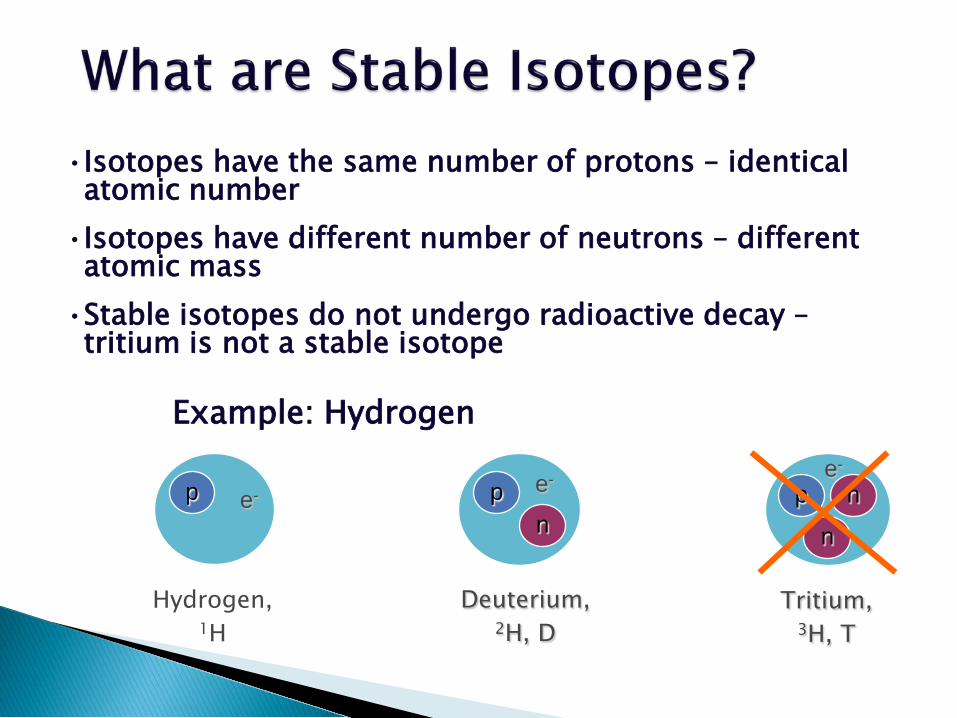
•Isotopes have the same number of protons – identical atomic number
•Isotopes have different number of neutrons – different atomic mass
•Stable isotopes do not undergo radioactive decay – tritium is not a stable isotope
p e-
Hydrogen, 1H
n p e-
Deuterium, 2H, D
Example: Hydrogen
n
p n e-
Tritium, 3H, T
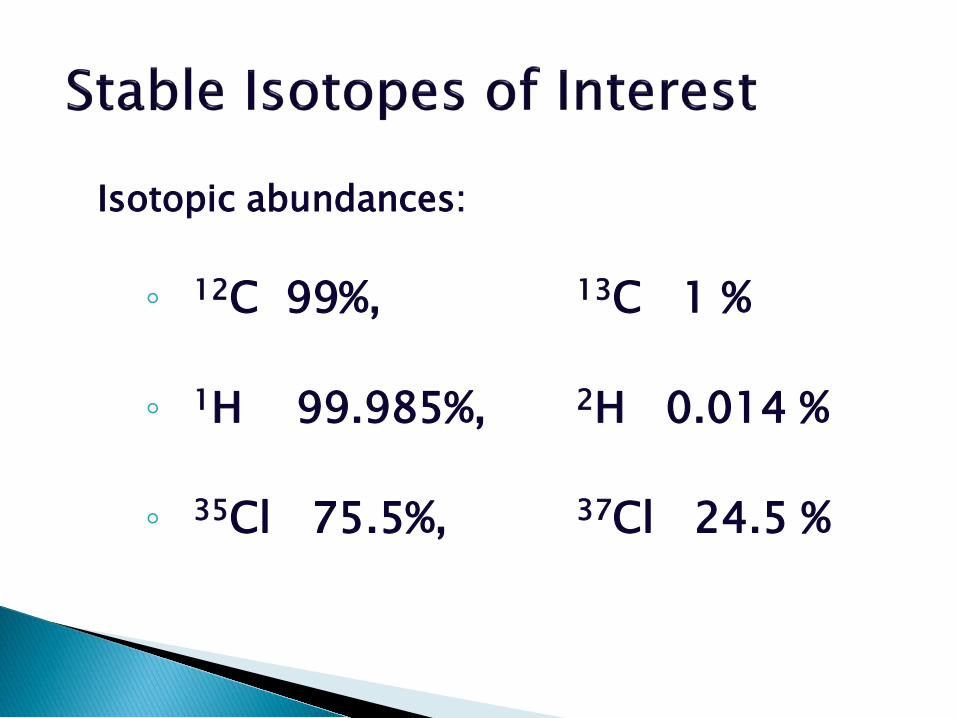
Isotopic abundances: ◦ 12C 99%, 13C 1 %
◦ 1H 99.985%, 2H 0.014 %
◦ 35Cl 75.5%, 37Cl 24.5 %
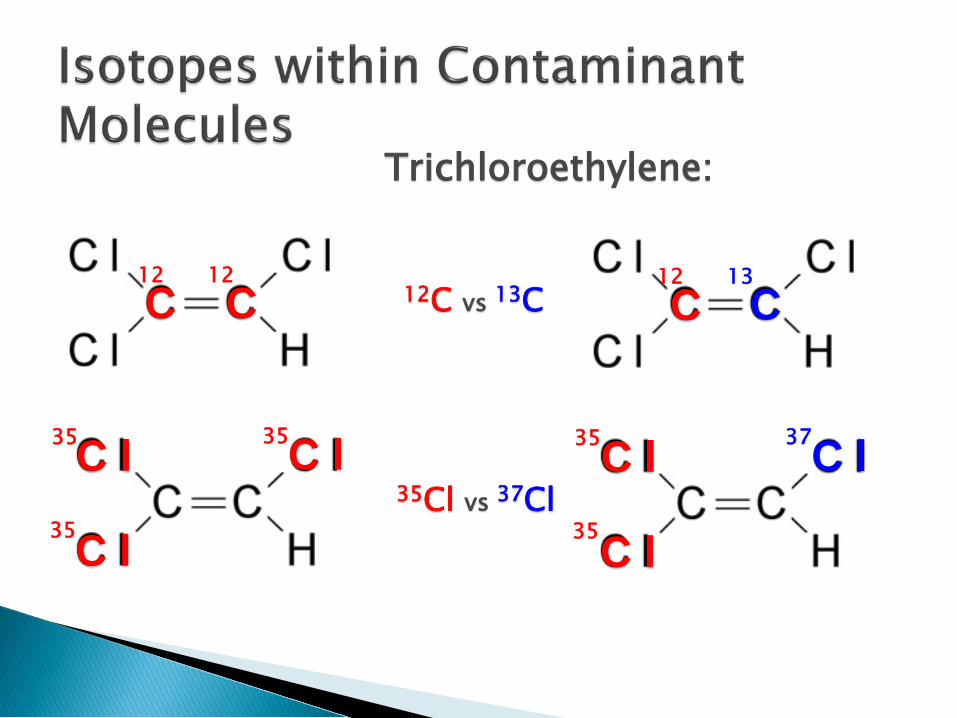
Trichloroethylene:
12 12 12 13
35
35
35 35
35
37
12C vs 13C
35Cl vs 37Cl
C C C
C l
C l
C l
C
C l
C l
C l
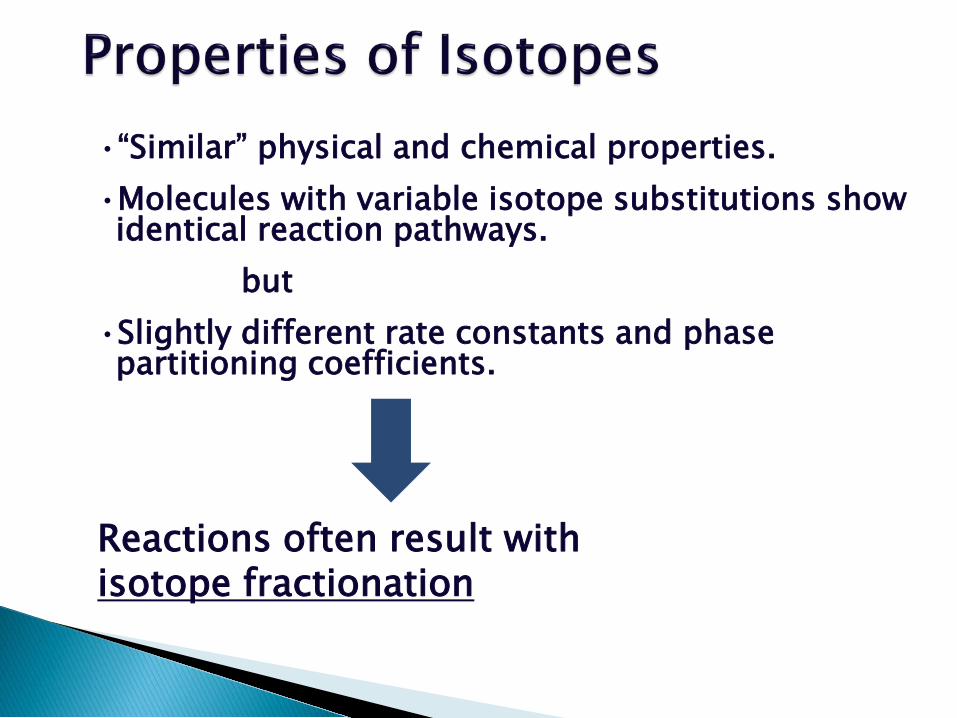
•“Similar” physical and chemical properties. •Molecules with variable isotope substitutions show identical reaction pathways.
but •Slightly different rate constants and phase partitioning coefficients.
Reactions often result with isotope fractionation
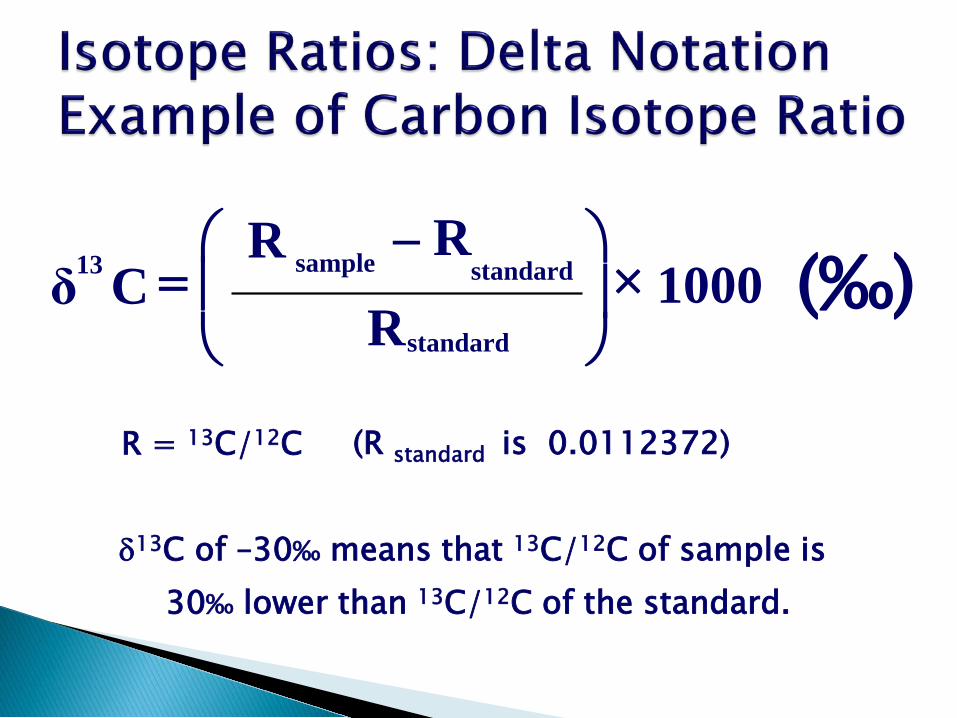
R = 13C/12C
δ13C of –30‰ means that 13C/12C of sample is 30‰ lower than 13C/12C of the standard.
(R standard is 0.0112372)
1000 R
R C δ
standard
sample 13 ×
=
– R standard (‰)
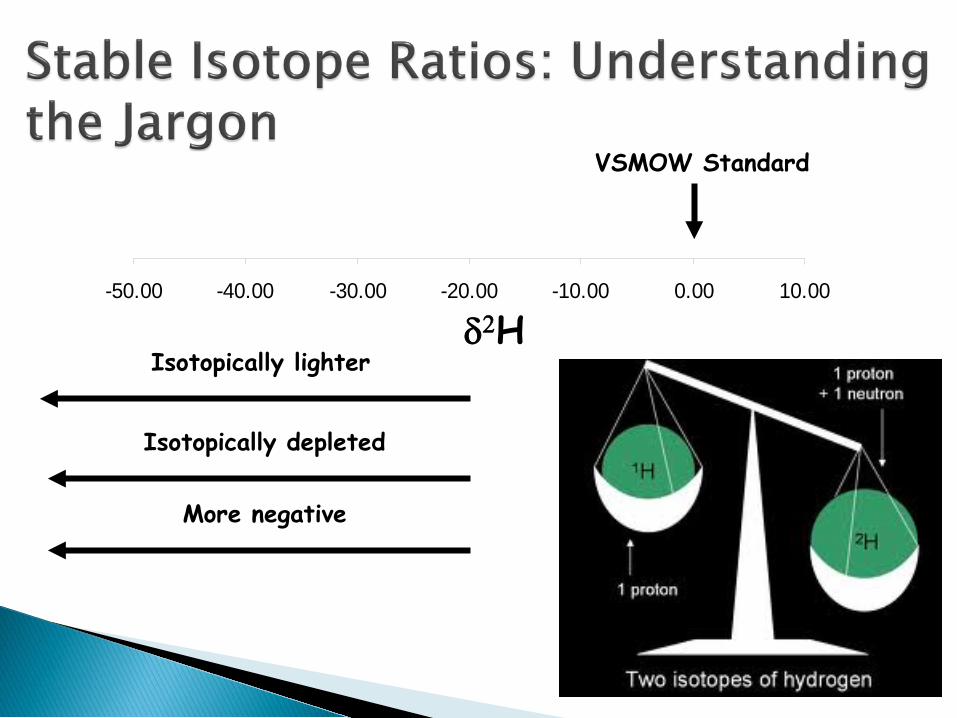
-50.00 -40.00 -30.00 -20.00 -10.00 0.00 10.00
VSMOW Standard
δ2H Isotopically lighter
Isotopically depleted
More negative
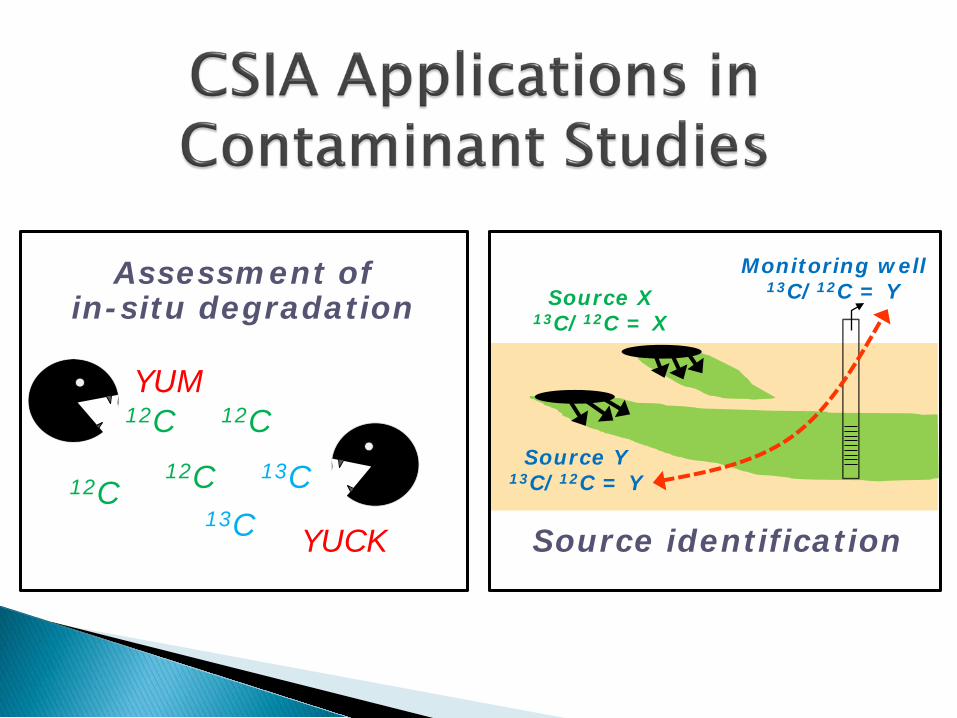
Assessment of in-situ degradation
Source identification
12C 13C 12C 12C
12C YUM
YUCK 13C
Source X 13C/12C = X
Source Y 13C/12C = Y
Monitoring well 13C/12C = Y
“Currently, CSIA is in transition from a research tool to an applied method that is well integrated into comprehensive plans for management of contaminated sites”
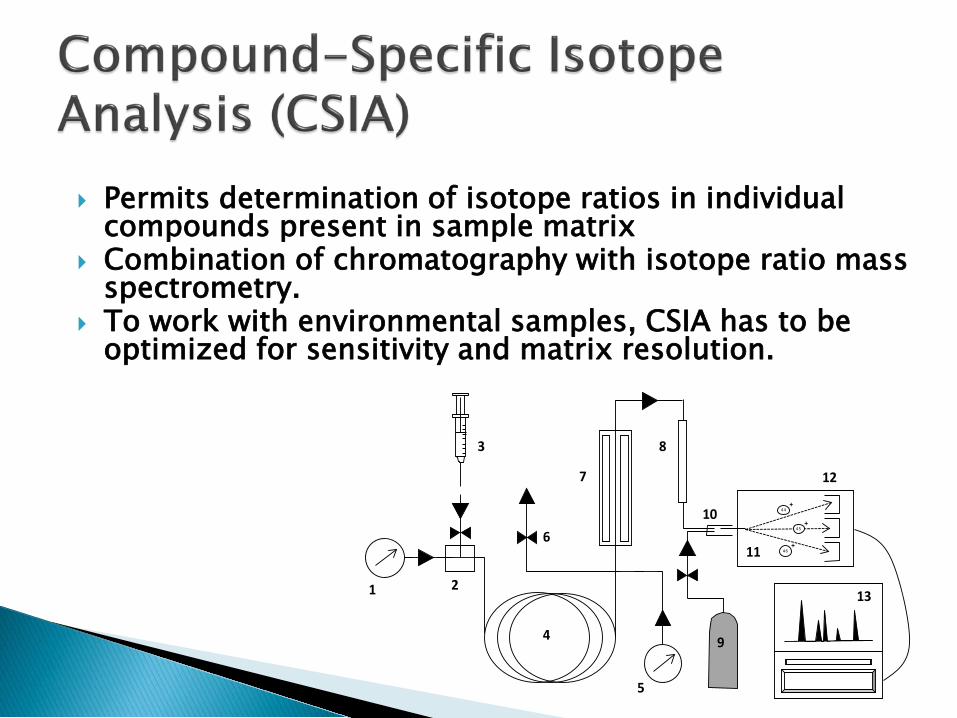
Permits determination of isotope ratios in individual compounds present in sample matrix
Combination of chromatography with isotope ratio mass spectrometry.
To work with environmental samples, CSIA has to be optimized for sensitivity and matrix resolution.
45+
46+
44+
4
1 2
5
6
7
8
9
10
11
12
13
3
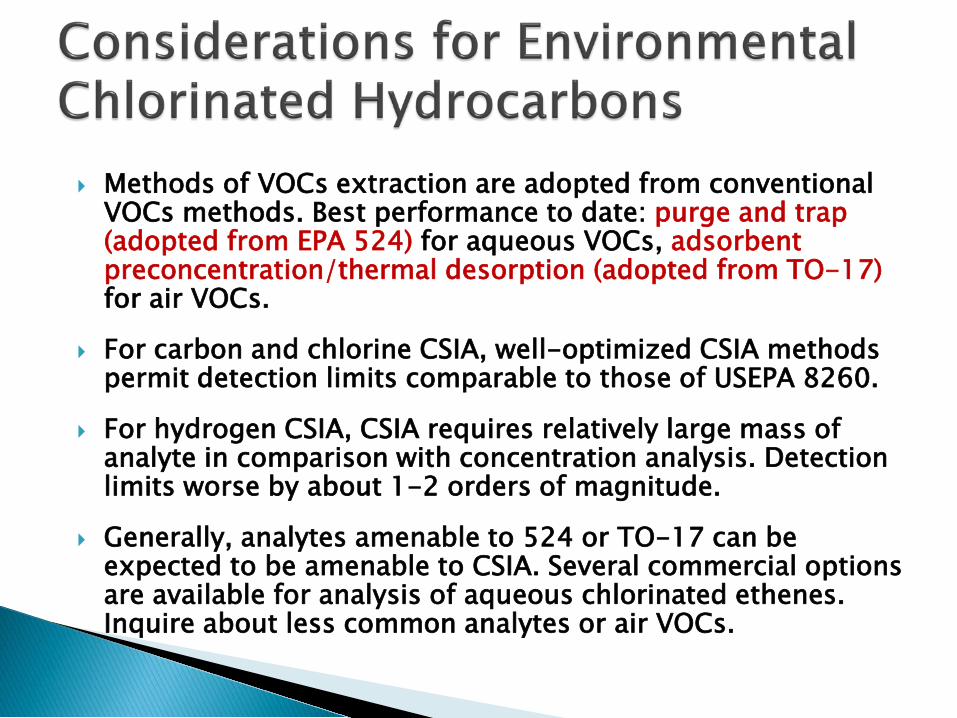
Methods of VOCs extraction are adopted from conventional VOCs methods. Best performance to date: purge and trap (adopted from EPA 524) for aqueous VOCs, adsorbent preconcentration/thermal desorption (adopted from TO-17) for air VOCs.
For carbon and chlorine CSIA, well-optimized CSIA methods permit detection limits comparable to those of USEPA 8260.
For hydrogen CSIA, CSIA requires relatively large mass of analyte in comparison with concentration analysis. Detection limits worse by about 1-2 orders of magnitude.
Generally, analytes amenable to 524 or TO-17 can be expected to be amenable to CSIA. Several commercial options are available for analysis of aqueous chlorinated ethenes. Inquire about less common analytes or air VOCs.
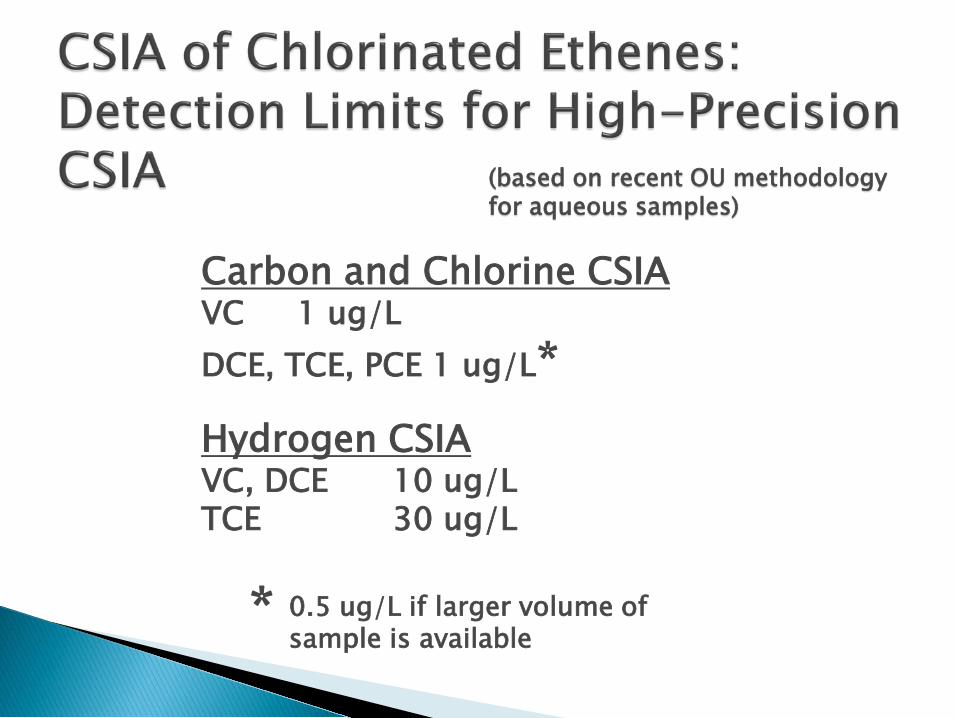
(based on recent OU methodology for aqueous samples)
Carbon and Chlorine CSIA VC 1 ug/L DCE, TCE, PCE 1 ug/L*
*
Hydrogen CSIA VC, DCE 10 ug/L TCE 30 ug/L
0.5 ug/L if larger volume of sample is available
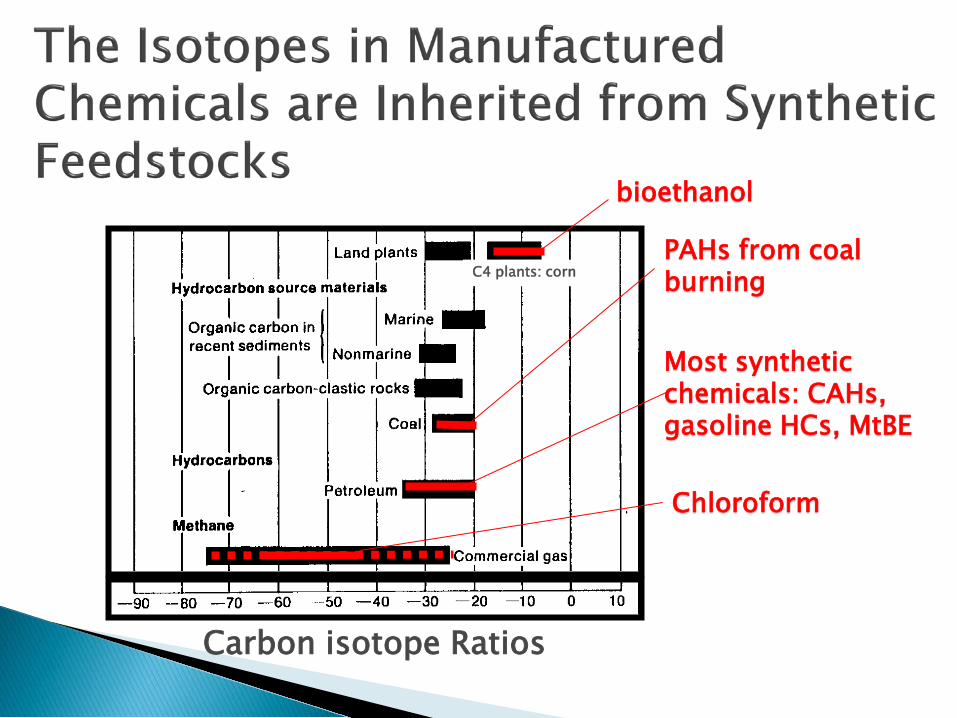
Carbon isotope Ratios
bioethanol
PAHs from coal burning
Most synthetic chemicals: CAHs, gasoline HCs, MtBE
Chloroform
C4 plants: corn
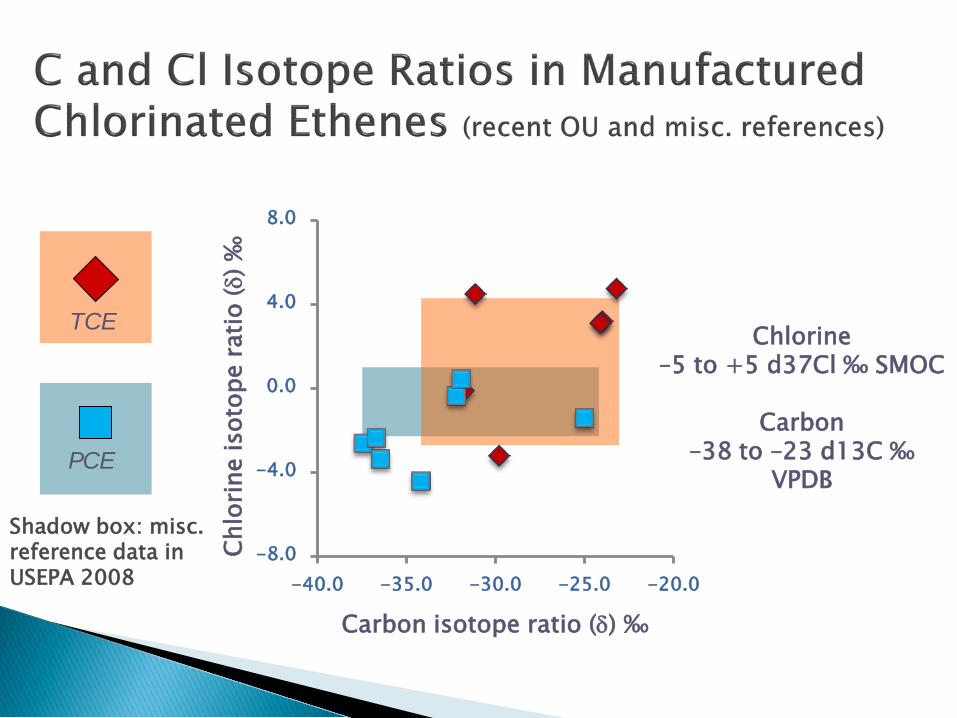
-8.0
-4.0
0.0
4.0
8.0
-40.0 -35.0 -30.0 -25.0 -20.0
Chlorine –5 to +5 d37Cl ‰ SMOC
Carbon
–38 to –23 d13C ‰ VPDB
Carbon isotope ratio (δ) ‰
Chlo
rine
isot
ope
ratio
(δ) ‰
TCE
PCE
Shadow box: misc. reference data in USEPA 2008
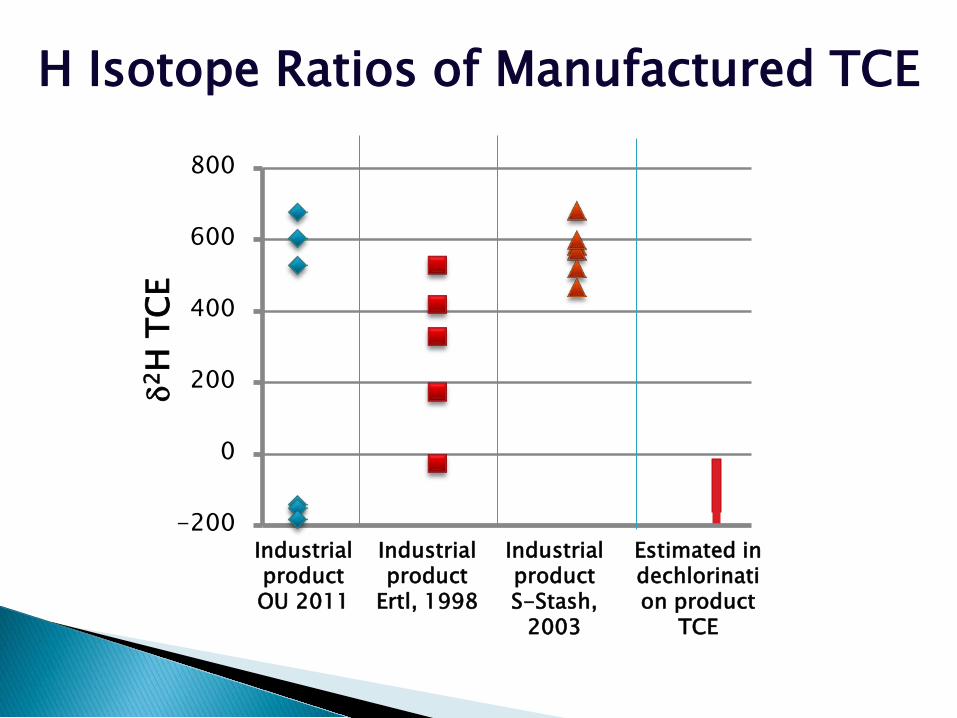
-200
0
200
400
600
800
Industrial product S-Stash,
2003
Industrial product OU 2011
Industrial product
Ertl, 1998
Estimated in dechlorination product
TCE
δ2H
TCE
H Isotope Ratios of Manufactured TCE
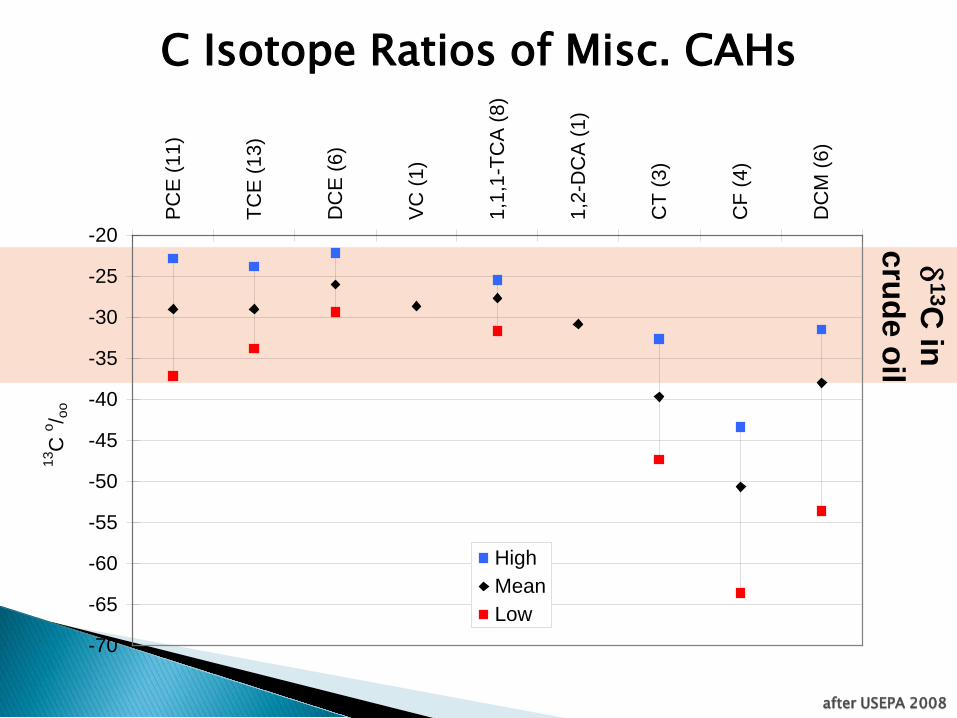
-70
-65
-60
-55
-50
-45
-40
-35
-30
-25
-20
PCE
(11)
TCE
(13)
DC
E (6
)
VC (1
)
1,1,
1-TC
A (8
)
1,2-
DC
A (1
)
CT
(3)
CF
(4)
DC
M (6
)
HighMeanLow
13C
o / ooC Isotope Ratios of Misc. CAHs
δ13C
in crude oil
after USEPA 2008
?
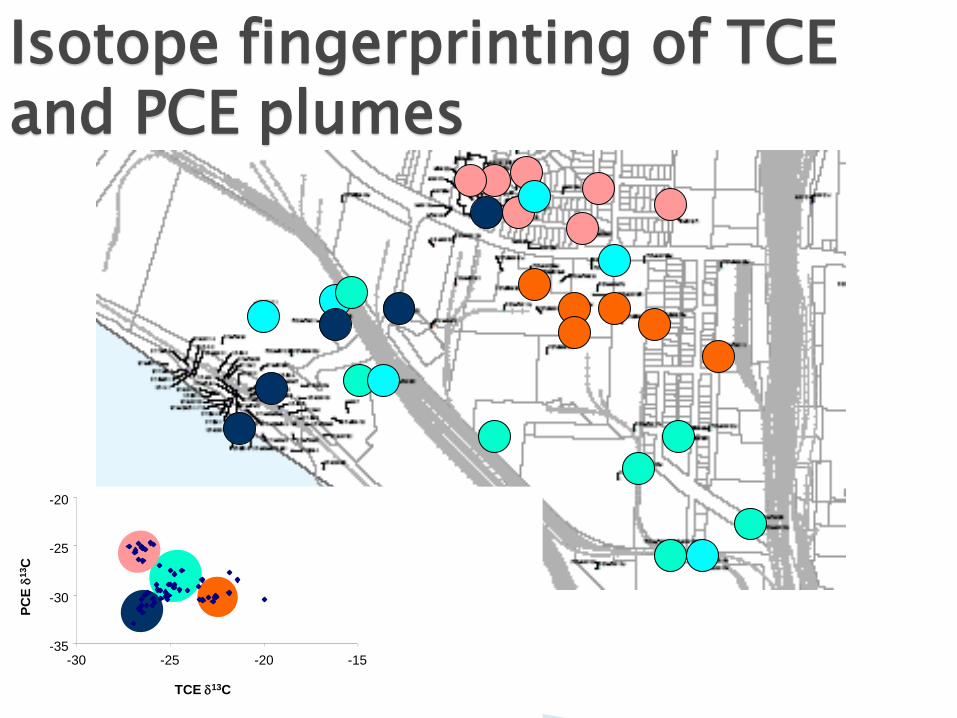
TCE δ13C
PCE
δ13C
-35
-30
-25
-20
-30 -25 -20 -15
Isotope fingerprinting of TCE and PCE plumes
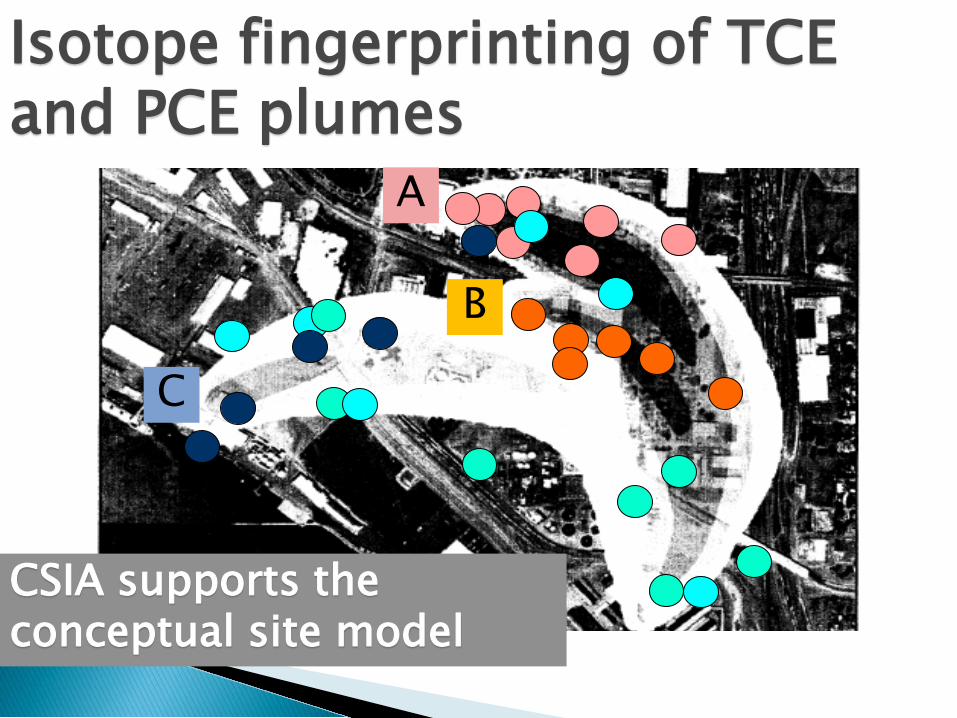
Isotope fingerprinting of TCE and PCE plumes
A
B
C
CSIA supports the conceptual site model
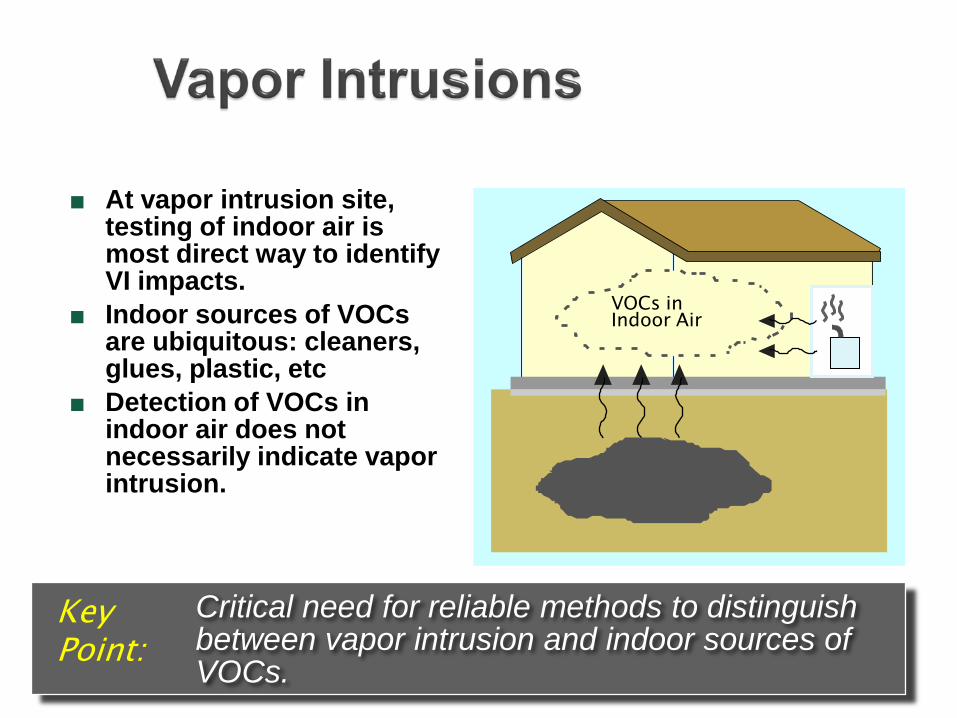
■ At vapor intrusion site, testing of indoor air is most direct way to identify VI impacts.
■ Indoor sources of VOCs are ubiquitous: cleaners, glues, plastic, etc
■ Detection of VOCs in indoor air does not necessarily indicate vapor intrusion.
Critical need for reliable methods to distinguish between vapor intrusion and indoor sources of VOCs.
Key Point:
VOCs in Indoor Air
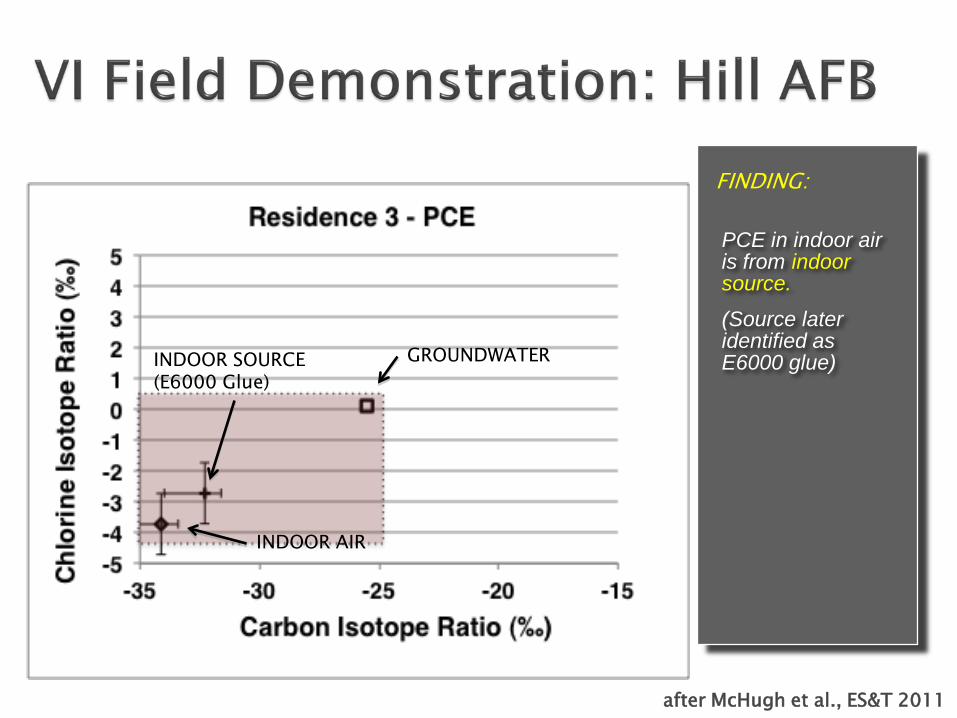
PCE in indoor air is from indoor source.
(Source later identified as E6000 glue)
FINDING:
GROUNDWATER
INDOOR AIR
INDOOR SOURCE (E6000 Glue)
after McHugh et al., ES&T 2011
Isotope fractionation is an enrichment of one isotope relative to another in a chemical or physical process. There are two categories of isotope effects: kinetic and equilibrium.
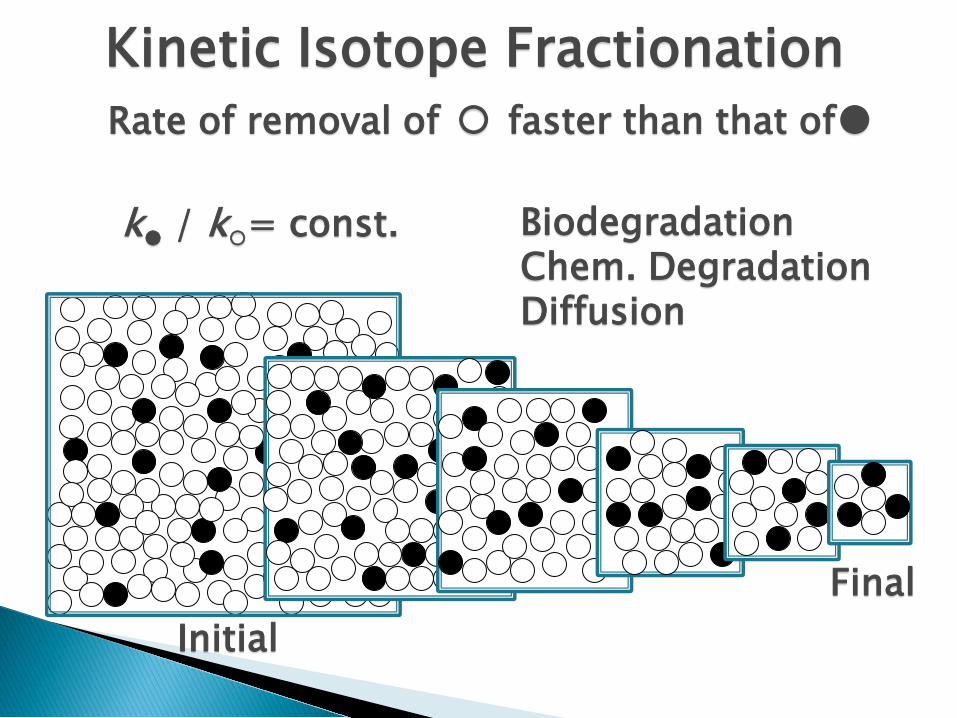
Kinetic Isotope Fractionation Rate of removal of ○ faster than that of●
k● / k○= const.
Initial Final
Biodegradation Chem. Degradation Diffusion
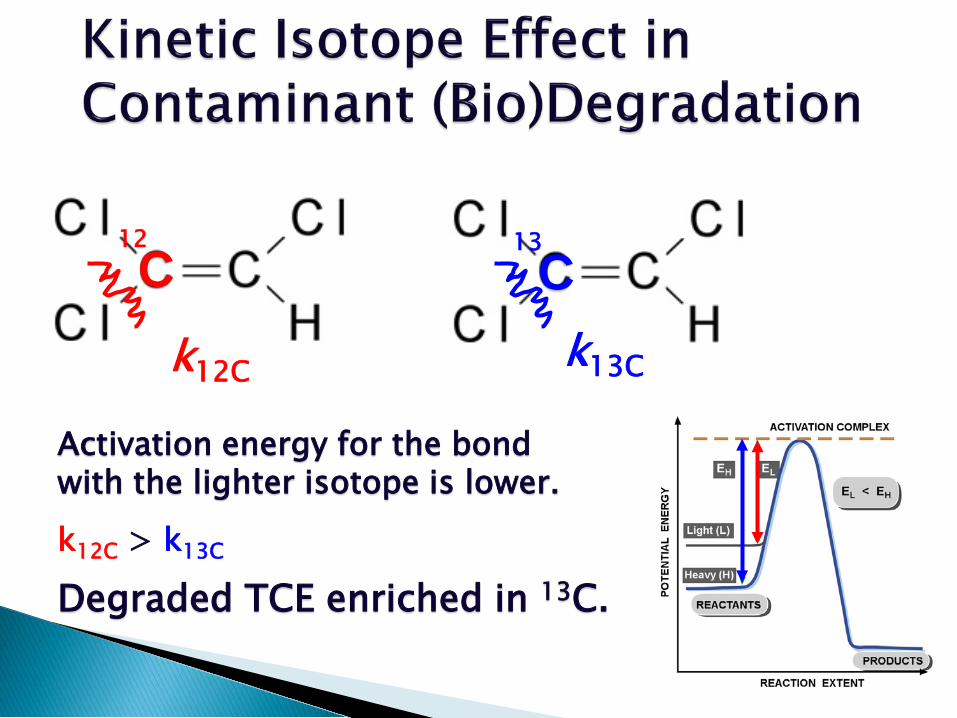
12 13 C C
k12C > k13C
Activation energy for the bond with the lighter isotope is lower.
Degraded TCE enriched in 13C.
k12C k13C
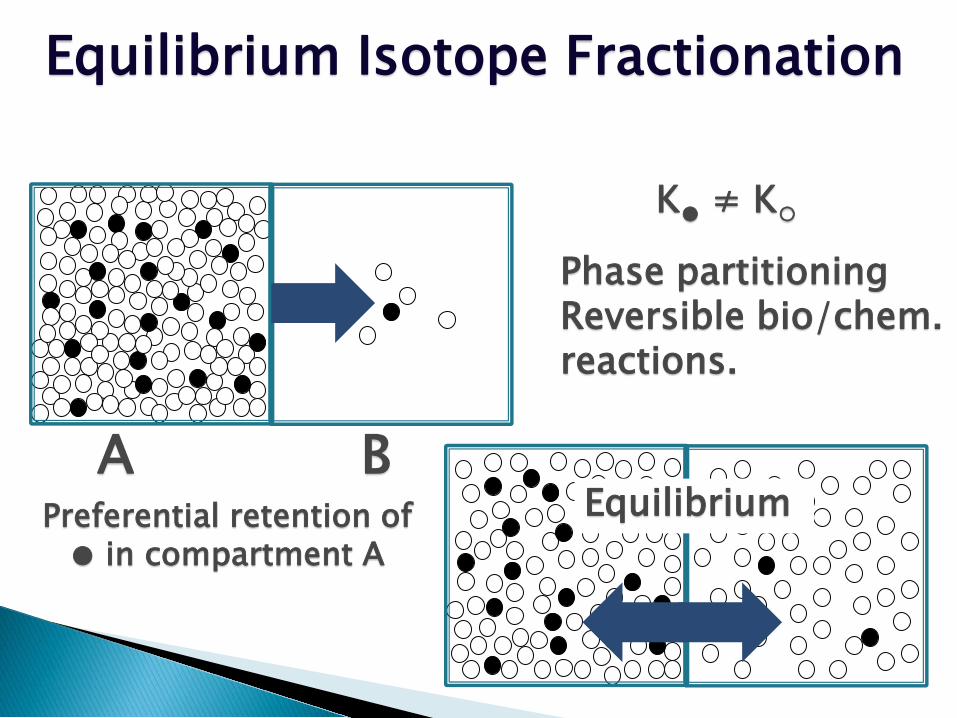
Equilibrium Isotope Fractionation
Preferential retention of ● in compartment A
Equilibrium A B
K● ≠ K○
Phase partitioning Reversible bio/chem. reactions.
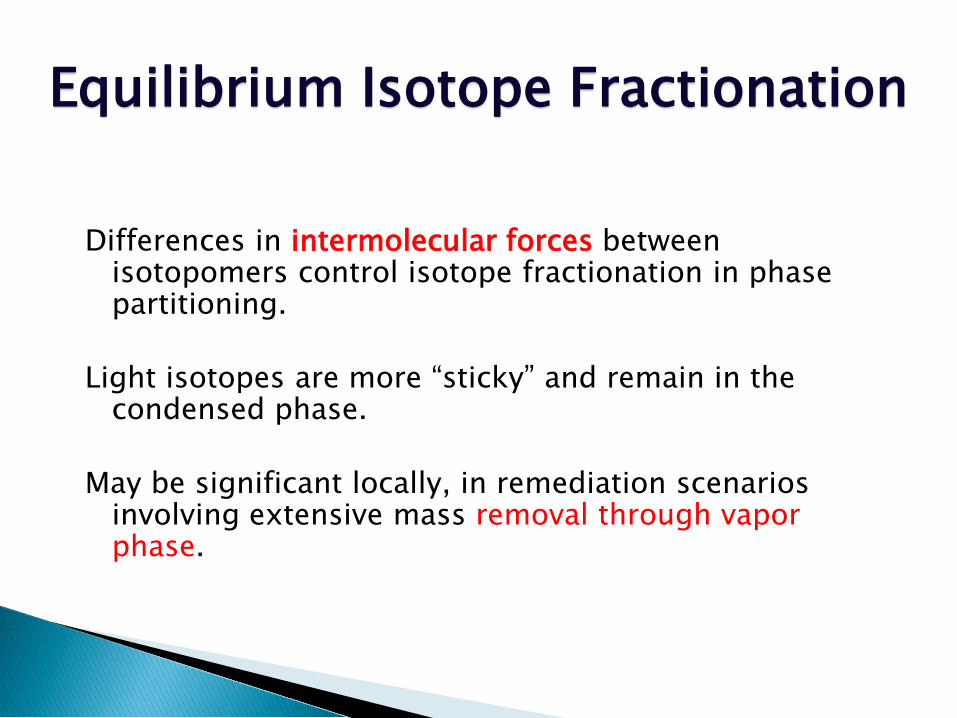
Equilibrium Isotope Fractionation
Differences in intermolecular forces between isotopomers control isotope fractionation in phase partitioning.
Light isotopes are more “sticky” and remain in the
condensed phase. May be significant locally, in remediation scenarios
involving extensive mass removal through vapor phase.
Rayleigh Model of Kinetic Fractionation (Lord Rayleigh, 1896)
Mathematical description of isotope fractionation Provides functional approximation for subsurface degradation Permits calculation of reactant mass destruction
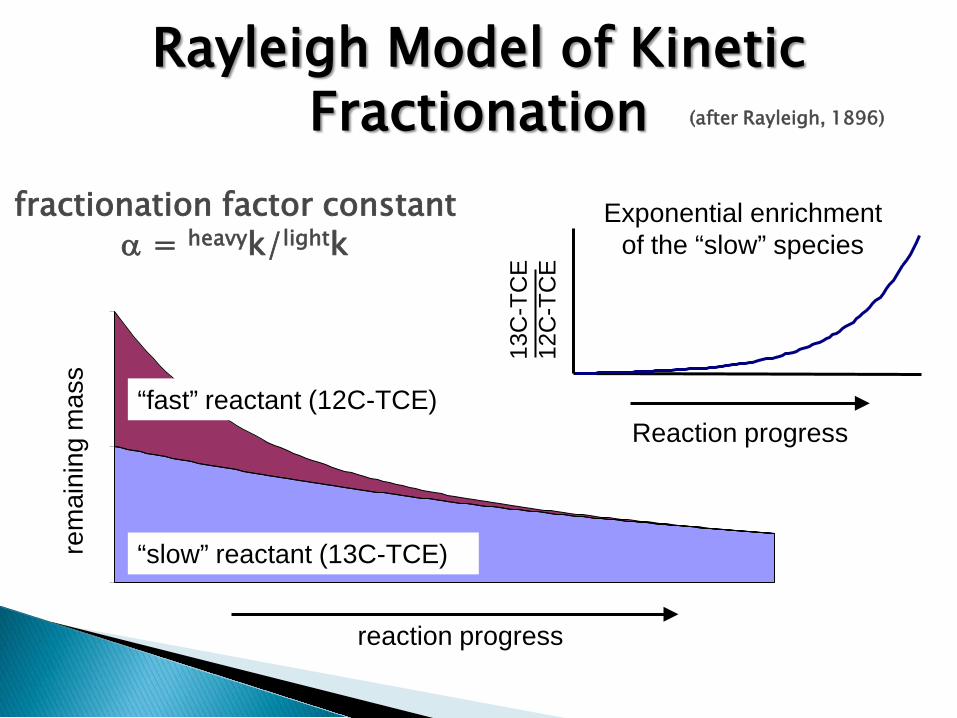
reaction progress
“slow” reactant (13C-TCE)
“fast” reactant (12C-TCE)
rem
aini
ng m
ass
Rayleigh Model of Kinetic Fractionation
13C
-TC
E
12C
-TC
E
Reaction progress
Exponential enrichment of the “slow” species
fractionation factor constant α = heavyk/lightk
(after Rayleigh, 1896)
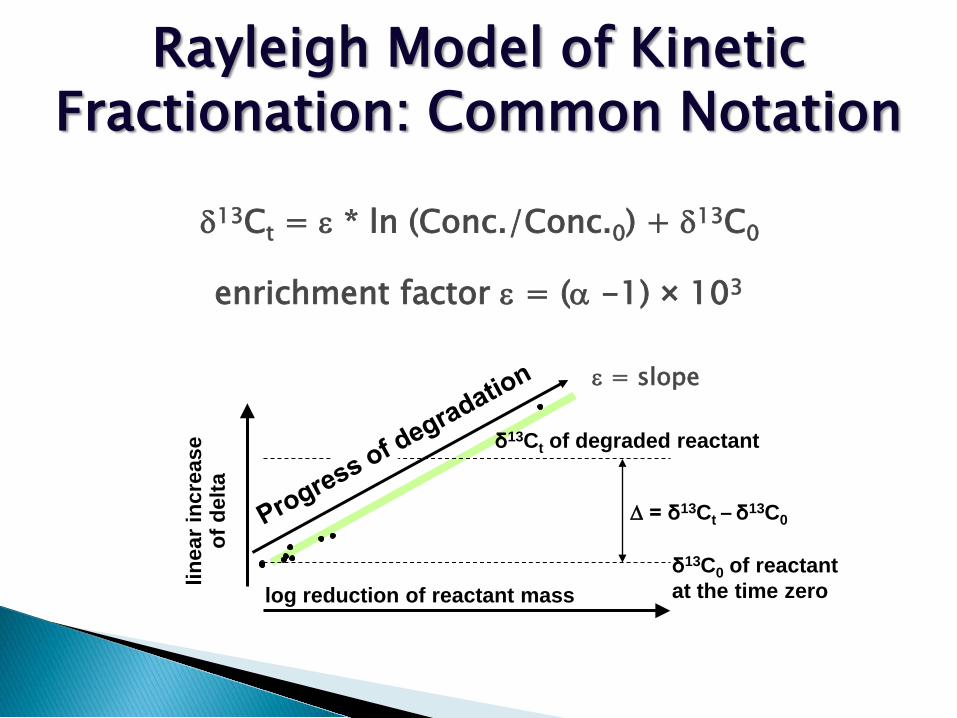
δ13Ct of degraded reactant
∆ = δ13Ct – δ13C0
δ13C0 of reactant at the time zero log reduction of reactant mass
linea
r inc
reas
e of
del
ta
δ13Ct = ε * ln (Conc./Conc.0) + δ13C0
enrichment factor ε = (α -1) × 103
ε = slope
Rayleigh Model of Kinetic Fractionation: Common Notation
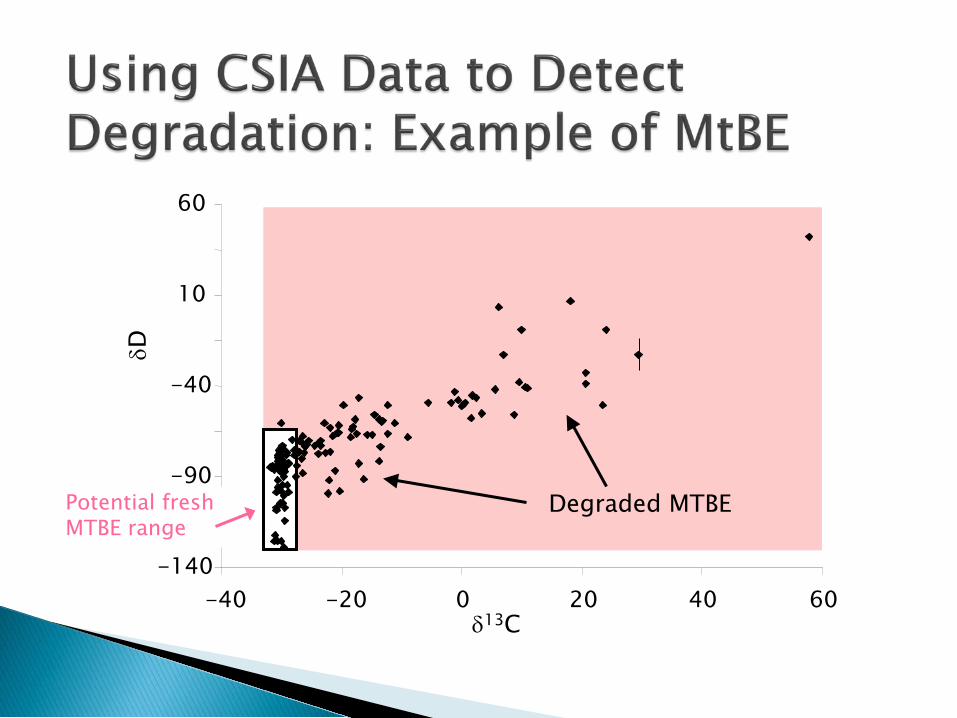
-140
-90
-40
10
60
-40
Potential fresh MTBE range
δD
-20 0 20 40 60 δ13C
Degraded MTBE
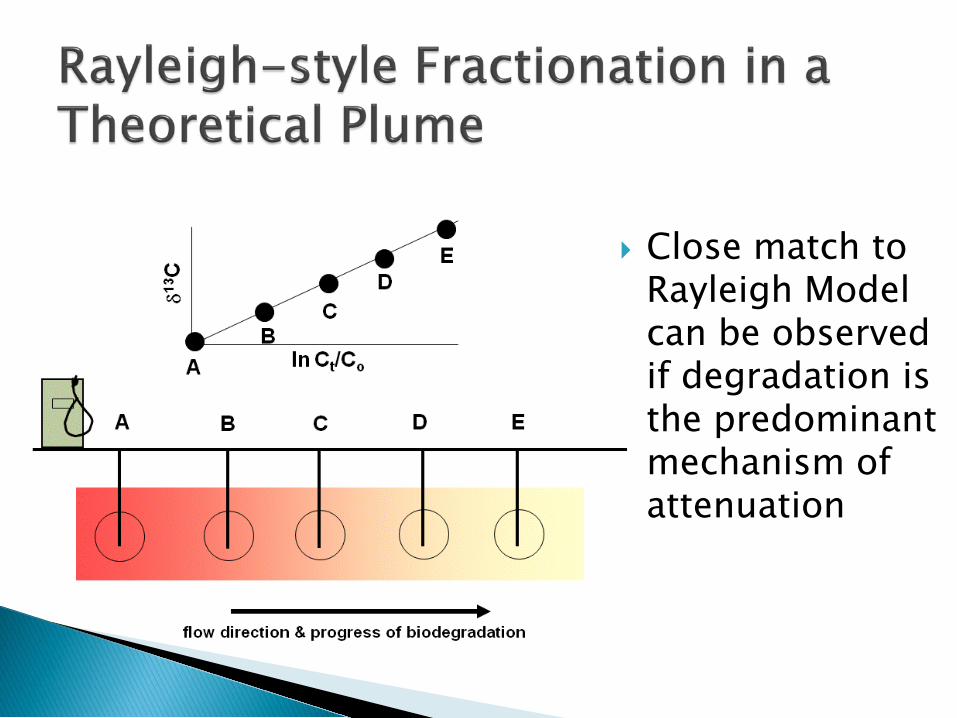
Close match to Rayleigh Model can be observed if degradation is the predominant mechanism of attenuation
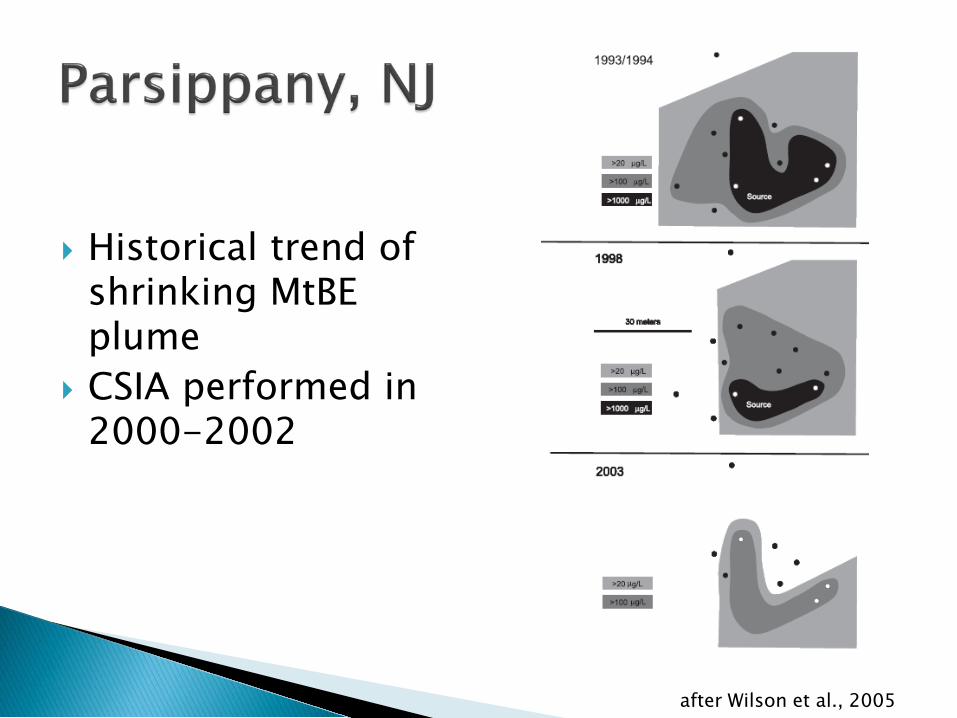
Historical trend of shrinking MtBE plume
CSIA performed in 2000-2002
after Wilson et al., 2005
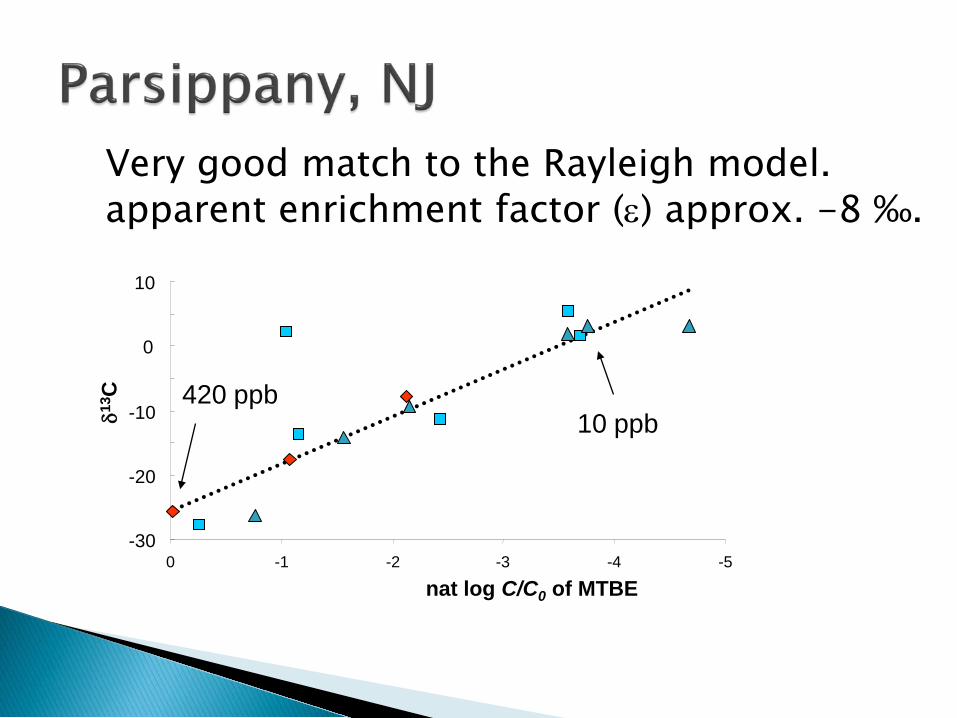
420 ppb 10 ppb
-30
-20
-10
0
10
-5 -4 -3 -2 -1 0
nat log C/C0 of MTBE
δ13C
Very good match to the Rayleigh model. apparent enrichment factor (ε) approx. -8 ‰.
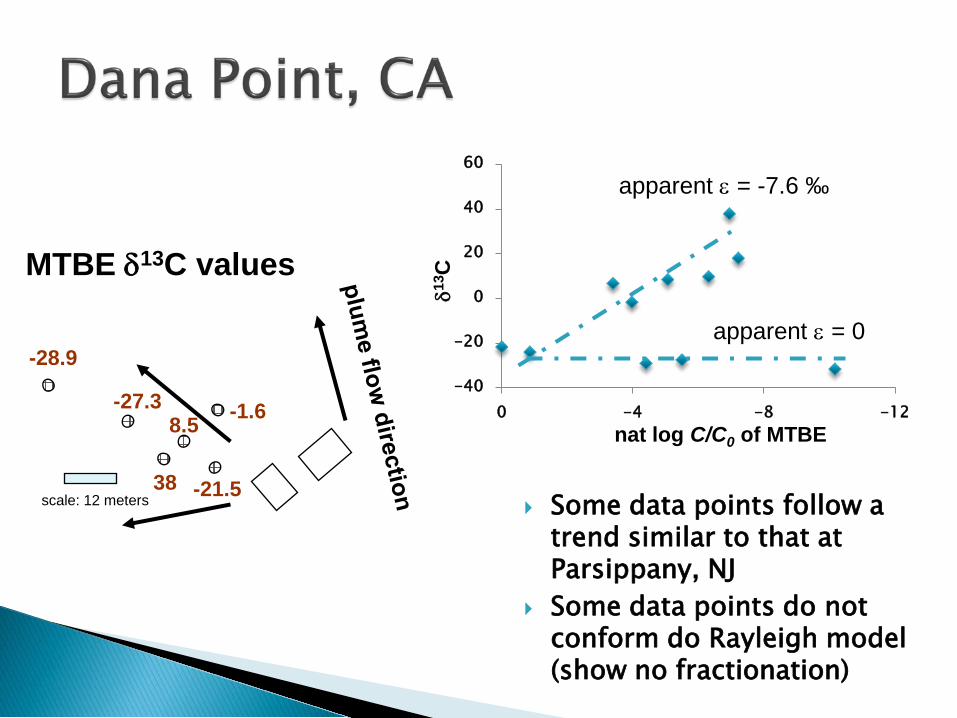
Some data points follow a trend similar to that at Parsippany, NJ
Some data points do not conform do Rayleigh model (show no fractionation)
MTBE δ13C values
scale: 12 meters
-28.9
-27.3
38
8.5 -1.6
-21.5
-40
-20
0
20
40
60
-12 -8 -4 0
apparent ε = -7.6 ‰
nat log C/C0 of MTBE δ13
C
apparent ε = 0
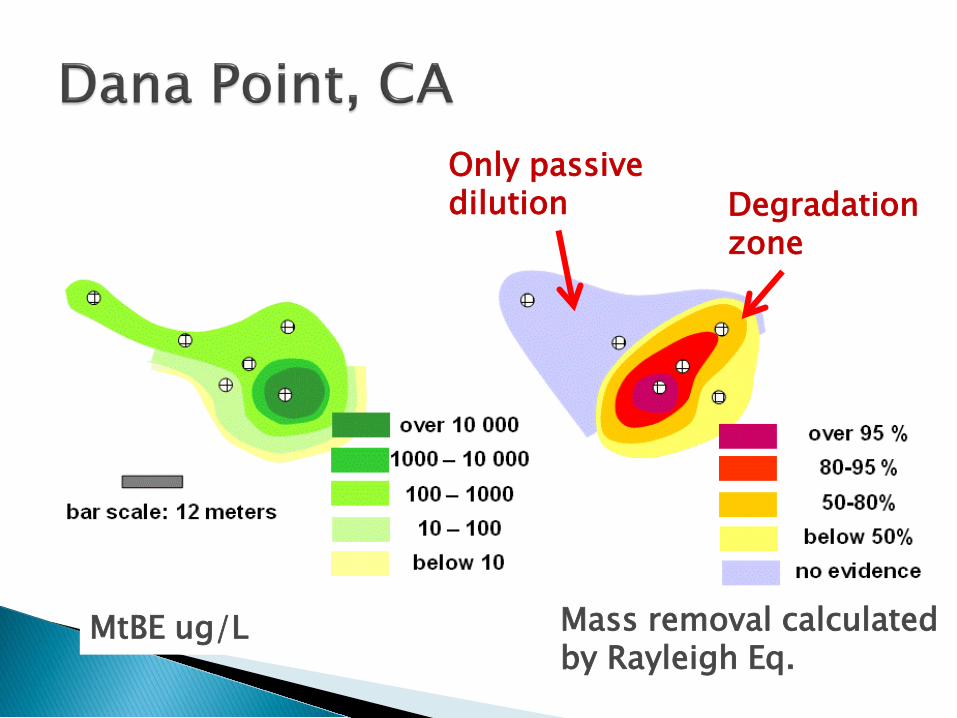
Mass removal calculated by Rayleigh Eq.
MtBE ug/L
Degradation zone
Only passive dilution
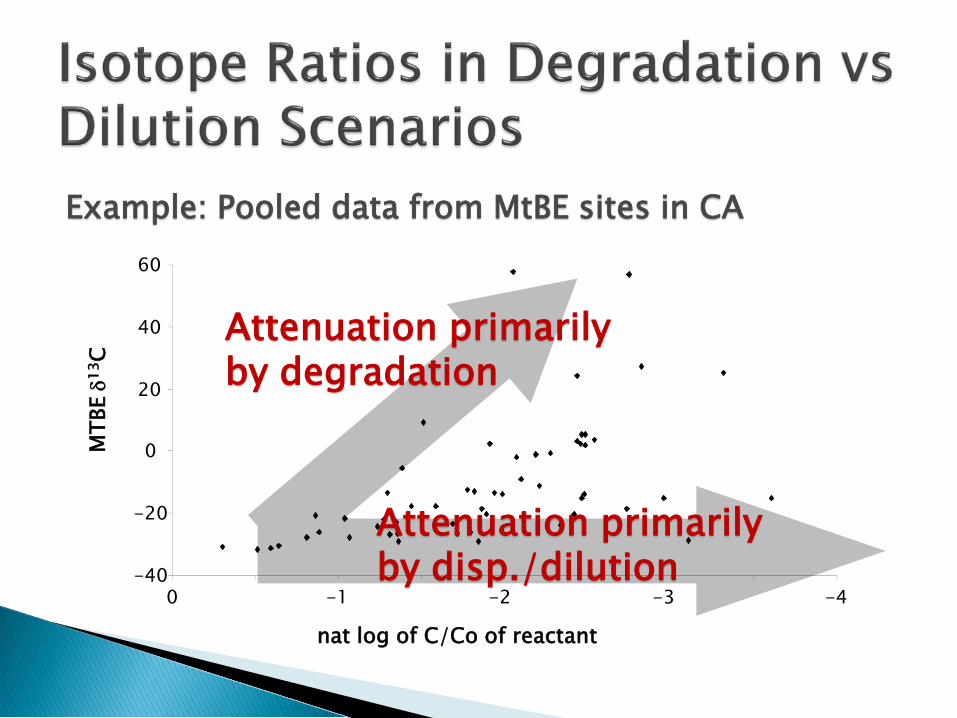
-40
-20
0
20
40
60
-4 -3 -2 -1 0
nat log of C/Co of reactant
MTB
E δ1
3 C Attenuation primarily
by degradation
Attenuation primarily by disp./dilution
Example: Pooled data from MtBE sites in CA
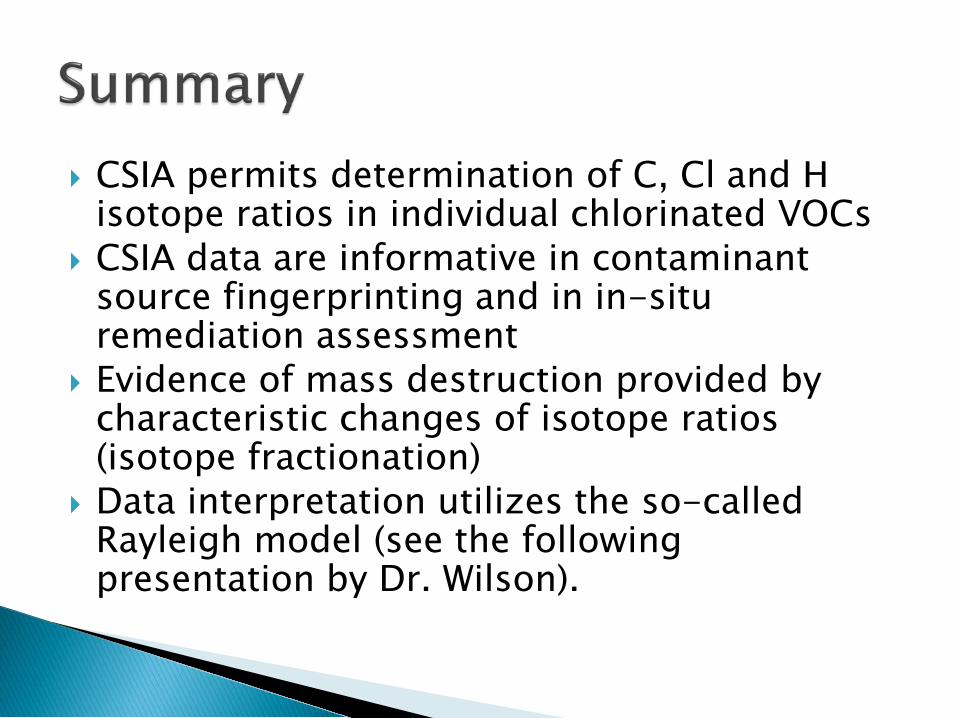
CSIA permits determination of C, Cl and H isotope ratios in individual chlorinated VOCs
CSIA data are informative in contaminant source fingerprinting and in in-situ remediation assessment
Evidence of mass destruction provided by characteristic changes of isotope ratios (isotope fractionation)
Data interpretation utilizes the so-called Rayleigh model (see the following presentation by Dr. Wilson).

Contact: Tomasz Kuder Univ. Oklahoma, Norman [email protected]
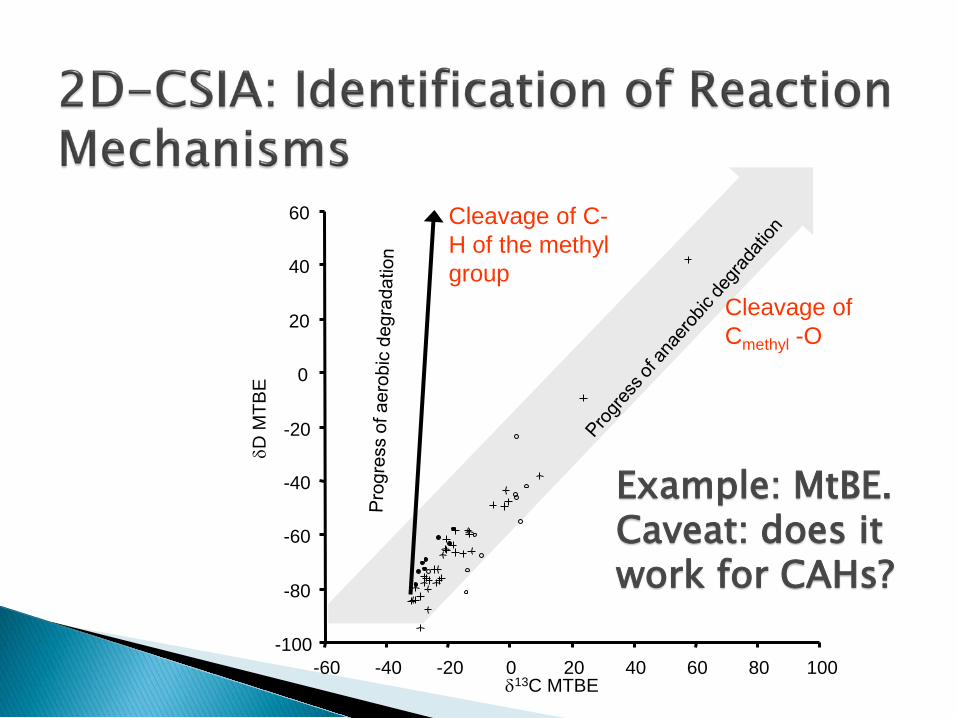
Cleavage of C-H of the methyl group
-100
-80
-60
-40
-20
0
20
40
60
-60 -40 -20 0 20 40 60 80 100 δ13C MTBE
δD M
TBE
Cleavage of Cmethyl -O
Example: MtBE. Caveat: does it work for CAHs?