Embed Size (px)
Citation preview

This paper presents preliminary findings and is being distributed to economists
and other interested readers solely to stimulate discussion and elicit comments.
The views expressed in this paper are those of the authors and do not necessarily
reflect the position of the Federal Reserve Bank of New York or the Federal
Reserve System. Any errors or omissions are the responsibility of the authors.
Federal Reserve Bank of New York
Staff Reports
An Index of
Treasury Market Liquidity: 1991-2017
Tobias Adrian
Michael Fleming
Erik Vogt
Staff Report No. 827
October 2017
An Index of Treasury Market Liquidity: 1991-2017
Tobias Adrian, Michael Fleming, and Erik Vogt
Federal Reserve Bank of New York Staff Reports, no. 827
November 2017
JEL classification: G12
Abstract
Order book and transactions data from the U.S. Treasury securities market are used to calculate
daily measures of bid-ask spreads, depth, and price impact for a twenty-six-year sample period
(1991-2017). From these measures, a daily index of Treasury market liquidity is constructed,
reflecting the fact that the varying measures capture different aspects of market liquidity. The
liquidity index is then correlated with various metrics of funding liquidity, volatility, and
macroeconomic conditions. The liquidity index points to poor liquidity during the 2007-09
financial crisis and around the near failure of Long-Term Capital Management, but suggests that
current liquidity is good by historical standards. Market liquidity tends to be strongly correlated
with funding liquidity at times of market stress, but otherwise exhibits little correlation.
Key words: Treasury securities, market liquidity, funding liquidity, volatility, index
_________________
Fleming: Federal Reserve Bank of New York (email: [email protected]). Adrian: International Monetary Fund (email: [email protected]). The paper is based on work that was conducted while Adrian and Vogt were with the Federal Reserve Bank of New York. The authors thank Jim Hamilton and Domenico Giannone for helpful suggestions and Collin Jones for excellent research assistance. The views expressed in this paper are those of the authors and do not necessarily reflect the position of the Federal Reserve Bank of New York, the Federal Reserve System, the International Monetary Fund (IMF), the IMF’s executive directors, or the IMF’s management.
1 Introduction
U.S. Treasury securities occupy a central role in global financial markets. As widely recognized
safe and liquid benchmark assets, Treasuries are used as reserve assets by central banks, as a
store of value by investors, as a source of funding through repurchase agreements, as collateral
in a variety of asset markets, and as a hedge against market volatility (International Monetary
Fund (2012), Gorton and Ordoñez (2011), Adrian, Crump, and Vogt (2016)). This safety
and liquidity is priced in the form of extraordinarily low yields, as investors willingly pay a
premium to hold securities with money-like features (Krishnamurthy and Vissing-Jorgensen
(2012)). Liquidity is a key attribute that is inextricably linked to the pricing and widespread
use of U.S. Treasuries.
In recent years, Treasury market liquidity has taken on special interest because of its
behavior during the 2007-09 financial crisis, because of post-crisis regulatory changes, and
because of the increasing role of high-frequency trading firms (HFTs) in the market. Engle,
Fleming, Ghysels, and Nguyen (2012) document the liquidity disruptions in the most actively
traded Treasury securities during the crisis and Musto, Nini, and Schwarz (2016) explore the
unusual pricing discrepancies that arose among less actively traded securities. Adrian, Fleming,
Shachar, and Vogt (2017) describe the post-crisis regulatory changes and how they may have
affected liquidity in dealer-intermediated markets such as the Treasury market. The Joint Staff
Report (2015) examines the October 2014 flash rally in the Treasury market and shows that
HFTs now account for the majority of activity in the so-called interdealer market.
Despite its importance, no studies have used order book and transactions data to assess
Treasury market liquidity over an extended period. Some studies have examined liquidity
using order book data over relatively short time spans (e.g., Fleming (2003), Engle, Fleming,
Ghysels, and Nguyen (2012), and Adrian, Fleming, Shachar, and Vogt (2017)). Other studies
have taken a longer-term focus relying on liquidity proxies, such as the yields on Refcorp bonds
relative to Treasuries (Longstaff (2004)) or the dispersion of Treasury security yields around a
smooth yield curve (Hu, Pan, and Wang (2013)). Other studies, such as Goyenko and Ukhov
(2009) and Goyenko, Subrahmanyam, and Ukhov (2011), have used bid-ask spread data from
the Center for Research in Security Prices (CRSP). As explained in Duffee (1996), CRSP bid-
1
ask spreads have at times been based on a maturity-dependent “spread curve” that does not
change from day to day (that is, the spreads are indicative and seemingly do not change with
market conditions), calling into question the information content of such spreads.
In this paper, we assess Treasury market liquidity over a 26-year sample period using order
book and transactions data from the interdealer market. In particular, we look at GovPX data
from the voice interdealer brokers for the 1991 to 2000 period and data from the BrokerTec
electronic trading platform for the 2001 to 2017 period. The measures we focus on are bid-ask
spreads, depth, and price impact, although we also examine trading volume, trade frequency,
trade size, and volatility.
Interestingly, we find little correlation between our bid-ask spread series and those of CRSP.
Moreover, the CRSP series remain unchanged for years at a time, including through the depths
of the 2007-09 financial crisis. Further investigation suggests that CRSP relies on indicative
end-of-day quotations, whereas our bid-ask spreads are based on actual order book data. The
evidence suggests that the CRSP bid-ask spread series have little informational value over our
sample period.
The paper also develops a daily index of Treasury market liquidity. We do this by combining
our bid-ask spread, depth, and price impact measures, reflecting the fact that the measures
capture different aspects of market liquidity. The index points to poor liquidity during the
financial crisis and around the near-failure of Long-Term Capital Management (LTCM), and
suggests that current liquidity is quite good by historical standards.
Lastly, the paper explores how our liquidity index correlates with measures of funding liq-
uidity, volatility, and macroeconomic conditions. We show that market liquidity and funding
liquidity are strongly correlated during times of crises or market disruption, including the
financial market turmoil in fall 1998 around the near-failure of LTCM, the 2007-09 financial
crisis, and, to some extent around the September 11, 2001 attacks and the 2013 taper tantrum.
This finding supports theories that link market liquidity to funding liquidity (e.g., Brunner-
meier and Pedersen (2009)) and complements the finding of Adrian, Etula, and Muir (2014)
that dealer balance sheet leverage is priced in the cross-section of stocks and bonds. That said,
market liquidity and funding liquidity exhibit little correlation during more normal times, sug-
2
gesting that funding constraints in the Treasury market only impact market liquidity under
unusual circumstances.
The paper proceeds as follows. Section 2 describes the structure of the secondary Treasury
market, focusing on the interdealer market in which dealers trade with one another. Section 3
discusses the order book and transactions data used in the study, and the additional variables
used to better understand liquidity. Section 4 presents our main empirical findings, including
time series measures of market liquidity, a comparison of GovPX/BrokerTec bid-ask spreads to
CRSP bid-ask spreads, our Treasury liquidity index, and the relationship of market liquidity
to our funding liquidity, volatility, and macroeconomic variables. Section 5 concludes.
2 Treasury Market
The secondary market for U.S. Treasury securities is a multiple dealer, over-the-counter market.
Traditionally, the predominant market makers were the primary government securities dealers,
those dealers with a trading relationship with the Federal Reserve Bank of New York. The
dealers trade with the Fed, their customers, and one another. The core of the market is the
interdealer broker (IDB) market, which accounts for nearly all interdealer trading. Trading in
the IDB market takes place 22-23 hours per day during the week, although the vast majority of
trading occurs during New York hours, roughly 07:00 to 17:30 Eastern time (Fleming (1997)).
Until 1999, nearly all trading in the IDB market occurred over the phone via voice-assisted
brokers. Voice-assisted brokers provide dealers with proprietary electronic screens that post
the best bid and offer prices called in by the dealers, along with the associated quantities.
Quotes are binding until and unless withdrawn. Dealers execute trades by calling the brokers,
who post the resulting trade price and size on their screens. The brokers thus match buyers
and sellers, while ensuring anonymity, even after a trade. In compensation for their services,
brokers charge a fee.
Most previous research on the microstructure of the Treasury market has used data from
voice-assisted brokers, as reported by GovPX, Inc.1 GovPX receives market information from1See, for example, Fleming and Remolona (1999), Brandt and Kavajecz (2004), and Pasquariello
and Vega (2007).
3

IDBs and re-disseminates the information in real time via the internet and data vendors.
Information provided includes the best bid and offer prices, the quantity available at those
quotes, and trade prices and volumes. In addition to the real-time data, GovPX sells historical
tick data, which provides a record of the real-time data feed for use by researchers and others.
When GovPX started operations in June 1991, five major IDBs provided it with data,
but Cantor Fitzgerald did not, so that GovPX covered about two-thirds of the interdealer
market. The migration from voice-assisted to fully electronic trading in the IDB market began
in March 1999 when Cantor Fitzgerald introduced its eSpeed electronic trading platform.2 In
June 2000, BrokerTec Global LLC, a rival electronic trading platform, began operations.3 As
trading of on-the-run securities migrated to these two electronic platforms, and the number
of brokers declined due to mergers, GovPX’s data coverage dwindled. By the end of 2004,
GovPX was receiving data from only three voice-assisted brokers. After ICAP’s purchase of
GovPX in January 2005, ICAP’s voice brokerage unit was the only brokerage entity reporting
through GovPX.
BrokerTec and eSpeed are fully automated electronic trading platforms on which buyers
are matched to sellers without human intervention. Both brokers provide electronic screens
that display the best bid and offer prices and associated quantities. On BrokerTec, a manual
trader can see five price tiers and corresponding total size for each tier on each side of the book,
plus individual order sizes for the best 10 bids and offers. For computer-based traders, the
complete order book information is available. Traders enter limit orders (minimum order size
is $1 million par value) or hit/take existing orders electronically, with priority of execution of
limit orders based on price and time. As with the voice brokers, the electronic brokers ensure
trader anonymity, even after a trade, and charge a small fee for their services.
The BrokerTec platform allows iceberg orders, whereby a trader can choose to show only
part of the amount he is willing to trade. As trading takes away the displayed portion of an2Cantor spun eSpeed off in a December 1999 public offering. After many ownership changes,
eSpeed merged with BGC Partners, an offshoot of the original Cantor Fitzgerald. In 2013, eSpeed waspurchased by NASDAQ OMX Group.
3BrokerTec had been formed the previous year as a joint venture of seven large fixed income dealers.BrokerTec was acquired in May 2003 by ICAP PLC. ICAP changed its name to NEX Group PLC inDecember 2016.
4
iceberg order, the next installment of hidden depth equal to the pre-specified display size is
shown. This process continues until trading completely exhausts the iceberg order. It is not
possible to enter iceberg orders with zero displayed quantity; that is, limit orders cannot be
completely hidden.
Beside iceberg orders, the electronic brokers have retained the workup feature similar to
the expandable limit order protocol of the voice-assisted brokers, but with some important
modifications.4 On BrokerTec, the most important difference is that the right-of-first-refusal
previously given to the original parties to the transaction has been eliminated, giving all
market participants immediate access to workups. All trades consummated during a workup
are assigned the same aggressive side as the original market order.5
In the early days of BrokerTec, platform participants were limited to government securi-
ties dealers. However, since 2004, BrokerTec has opened access to non-dealer participants,
including hedge funds and HFTs. Table 3.3 (p. 59) in the recent Joint Staff Report (2015) on
the U.S. Treasury market shows that HFTs account for 56% of trading volume in the on-the-
run 10-year note, compared to bank-dealers’ share of 35%. The remaining 9% is split among
non-bank dealers and hedge funds.6 These statistics show that the interdealer market for U.S.
Treasury securities, despite the name, is no longer solely for dealers.
3 Data
3.1 Order Book and Transactions Data
We rely on order book and transactions data from GovPX and BrokerTec to analyze Treasury
market liquidity. The GovPX database contains information for when-issued, on-the-run,
and off-the-run Treasury bills, notes, and bonds, whereas the BrokerTec database contains4Boni and Leach (2004) provide a thorough explanation of this feature in the voice-assisted trading
system. The protocol allows a Treasury market trader whose order has been executed to have theright-of-first-refusal to trade additional volume at the same price. As a result, the trader might be ableto have his market order fulfilled even though the original quoted depth is not sufficient. That is, thequoted depth is expandable.
5For a detailed analysis of workup activity in this market, see Fleming and Nguyen (2013).6The mentioned statistics are based on trading activity on the BrokerTec platform from April 2-17,
2014.
5
information for on-the-run Treasury notes and bonds only. The GovPX database, which starts
June 17, 1991, contains information on prices and (since July 1994) depth at the inside tier of
the limit order book, as well as trade prices and (until April 2001) volume. In contrast, our
BrokerTec database, which starts January 2, 2001, contains a complete record of every order
placed on the platform.7 We generate prices and depth at the inside tier by fully reconstructing
the limit order book.
We limit our analysis to the on-the-run 2-, 5-, and 10-year notes. On-the-run securities are
the most recently auctioned securities of a given maturity. As mentioned, we only have access
to BrokerTec data for the on-the-run notes and bonds, and the 2-, 5-, and 10-year notes are
the only coupon-bearing securities that were continuously issued over our sample period.8
Because trading activity has migrated in recent years from the voice-assisted brokers to the
electronic platforms, the representativeness of the databases changes over time. In particular,
GovPX coverage is high early in the sample, but falls sharply in 1999 and 2000. Fleming (2003)
thus finds that GovPX coverage of the interdealer market is 57% in 1998, but 52% in 1999,
and just 42% in the first quarter of 2000. In contrast, BrokerTec coverage starts modestly in
2001, but has high coverage for recent years. Fleming and Nguyen (2013) compare BrokerTec
trading activity with that of eSpeed reported in Luo (2010) and Dungey, Henry, and McKenzie
(2013) and finds that BrokerTec accounts for 57-60% of electronic interdealer trading in the
on-the-run 2-, 5-, and 10-year notes over the January 2005 to May 2008 sample period.
In our analysis, we use GovPX data from June 1991 to December 2000 and BrokerTec data
from January 2001 to June 2017. This provides good coverage of the interdealer market for
most of our 26-year sample period, but limited coverage for roughly the 1999 to 2004 period,
first when GovPX coverage was declining and then when BrokerTec activity was increasing.
The limited coverage for the 1999 to 2004 period would tend to bias our liquidity measures
and suggest historically poor liquidity at that time despite the absence of financial crises. It
is for this reason that we choose to adjust the liquidity measures over this period.9
7Although indicators showing which side initiated each trade are only available from January 2002.8While the Treasury currently also issues 3-, 7-, and 30-year coupon securities, issuance of the 3-year
note was suspended between May 2007 and November 2008, issuance of the 7-year note was suspendedbetween April 1993 and February 2009, and issuance of the 30-year bond was suspended between August2001 and February 2006.
9Specifically, we adjust our raw liquidity measures, discussed in the next section, by scaling them to
6
Daily trading activity over time is plotted in Figure 1, and daily trading activity summary
statistics are reported in Table 1, with statistics for the GovPX sample period in Panel A,
the BrokerTec sample period in Panel B, and the full sample period in Panel C. For the full
sample period, daily trading volume averages roughly $16-21 billion per note, average number
of trades per day ranges from about 640 to 1560, and average trade size range from about $9.6
million to $23.9 million.10
Figure 1 and Table 1 further show a significant upward trend in trading activity over the
period from 1991 to 2017. For the GovPX sample period, daily trading volume averages about
$3-5 billion per note. This average grows to about $23-31 billion in the BrokerTec sample, or
about a four- to eight-fold increase, with the greatest increase occurring in the 10-year note.
Trade frequency also rapidly expanded in the BrokerTec period: for instance, trading in the
10-year note increased from roughly 570 trades per day to over two thousand trades per day.
Meanwhile, the average trade size more than doubled.
3.2 Funding Liquidity and Volatility Measures
The funding liquidity measures we employ are as follows:
1. The Aaa spread, calculated as the yield on Moody’s Aaa corporate bond index less
the yield of the on-the-run 10-year Treasury note, which Krishnamurthy and Vissing-
Jorgensen (2012) cite as a funding liquidity indicator (source: Federal Reserve Bank of
St. Louis).
2. Dealer leverage, calculated quarterly as total assets of security brokers and dealers divided
the roughly 57-60% coverage levels of 1998 and 2005. For the 1998 to 2000 sample period, in which werely on GovPX data, we first regress each of our liquidity measures on the share of weekly interdealertrading accounted for by GovPX for the 2-, 5-, and 10-year notes. (Overall interdealer trading isreported weekly by the Federal Reserve Bank of New York via its FR 2004 statistical release.) We usethe regression results to scale the measures for 1999 and 2000 to the 1998 level of coverage. A similarapproach is followed with the BrokerTec data, in which the measures for 2001 to 2004 are scaled to the2005 level of coverage. The trading activity measures are not adjusted (because our analysis of thoseis mostly descriptive) and the liquidity measures are not adjusted outside of the 1999 to 2004 period.
10In calculating the number of trades per day and trade size, every order match within a given workupis counted as part of the same trade. This is the most reliable way to calculate trade size using GovPXdata because the volume field in the dataset used to uniquely identify trades only changes when aworkup is complete (and reflecting the full size of the workup). We follow the same trade definitionwith the BrokerTec data for consistency.
7
by equity capital (source: Board of Governors of the Federal Reserve).11
3. The on-the-run/off-the-run spread, which captures the yield investors forego in order to
hold the most recently-issued 10-year Treasury note (Krishnamurthy (2002)). The spread
is calculated (using parameters from the Nelson-Siegel-Svensson model of Gurkaynak,
Sack, and Wright (2007) as the yield of a hypothetical security with the same cash
flows as the on-the-run 10-year note less the actual yield of the note (source: Board of
Governors of the Federal Reserve System, BrokerTec, GovPX).
4. The Refcorp spread, calculated as the yield spread between a 10-year Resolution Fund-
ing Corporation zero-coupon bond and a 10-year zero-coupon Treasury bond (source:
Bloomberg). Refcorp is a government-sponsored enterprise that provided funds to the
Resolution Trust Corporation, which was established to finance the bailout of savings
and loan associations in the wake of the savings and loan crisis of the 1980s in the United
States. Longstaff (2004) argues that since Refcorp bonds and Treasury securities are
equally creditworthy, but Refcorp bonds are much less liquid, the Refcorp spread solely
reflects the value of the liquidity difference.
5. The spline error, calculated as the average absolute yield curve fitting error from the
Nelson-Siegel-Svensson model of Gurkaynak, Sack, and Wright (2007), a measure of deal-
ers’ risk bearing capacity (see Hu, Pan, and Wang (2013); source: Board of Governors of
the Federal Reserve System).
6. The swap spread, calculated as the average spread between the 2-, 5-, and 10-year interest
rate swap rate and the yield on the coresponding on-the-run Treasury note (source:
Bloomberg).
7. The TED (Treasury-eurodollar) spread, a measure of financial market stress, calculated as
the spread between 3-month LIBOR and the 3-month Treasury bill rate (source: Federal
Reserve Bank of St. Louis).11Both total assets and equity capital are from the underlying data of the Financial Accounts of
the United States, which are available from the data download program of the Federal Reserve athttps://www.federalreserve.gov/datadownload/Choose.aspx?rel=Z1.
8

The volatility measures we use are:
1. The Merrill Lynch Option Volatility Estimate index (MOVE), a measure of implied
Treasury volatility (source: Haver Analytics),
2. The Chicago Board Options Exchange Volatility Index (VIX), a measure of implied equity
volatility (source: Haver Analytics),
3. Realized volatility, calculated as the inverse maturity-weighted average of realized volatil-
ity for each of the 2-, 5-, and 10-year notes, calculated for each note as the sum of squared
five-minute log differences in the bid-ask midpoint, annualized by multiplying by 252
(sources: BrokerTec, GovPX).
These funding liquidity and volatility measures are summarized in the top two panels of Table 2.
The third panel shows an additional set of variables designed to capture shocks to the real
economy, which include the output gap and core PCE inflation. The panel also includes the
Baa/Aaa credit spread, a proxy for the aggregate credit cycle.12
4 Treasury Market Liquidity
4.1 Liquidity Measures
To assess Treasury market liquidity, we calculate bid-ask spreads, depth, and price impact.
The bid-ask spread is one of the most direct measures of market liquidity as it directly measures
the cost of trade execution (albeit only a single trade of limited size). The bid-ask spread is
calculated for each security and day as the average spread between the best bid and the best
offer in the limit order book, as reported by GovPX or BrokerTec. In calculating the average,
we limit our analysis to New York trading hours (07:00 to 17:00 Eastern time) and weight all
ticks (changes in the order book at any of the inside 10 tiers) equally, implicitly giving greater
weight to more active times of day.
Average daily bid-ask spreads are plotted in the top panel of Figure 2, and summary
statistics are reported in Table 3. Spreads are quite narrow, with full sample averages of 0.812The output gap and inflation series are obtained from Haver Analytics, and the credit spread is
from the Federal Reserve Bank of St. Louis.
9

basis points for the 2-year note, 1.0 basis points for the 5-year note, and 2.0 basis points for
the 10-year note. Over time, the spreads are relatively wide and variable over the GovPX and
early BrokerTec periods and narrow and stable since 2005, except for an increase during the
2007-09 financial crisis.
While the bid-ask spread directly measures transaction costs and hence liquidity, it does
not account for the depth of the market and hence how costs might vary for multiple trades or
trades larger than the minimum size. Another limitation of the measure is that the minimum
tick size is frequently constraining, which may explain the limited variation in the spread after
2005.13
The quantity of securities that can be traded at the various bid and offer prices helps
account for the depth of the market and complements the bid-ask spread as a measure of
market liquidity. Depth is calculated for each security and day as the average quantity sought
at the best bid price plus the average quantity offered at the best ask price. The quantities only
include shown amounts in the limit order book and hence exclude quantities hidden through
iceberg orders as well as latent depth that gets revealed through the workup process. As
with the bid-ask spread, we limit our analysis to New York trading hours and weight all ticks
equally. Moreover, because of the long time span covered by the study, we inflation-adjust
depth to 2016 dollars using the GDP deflator (obtained from Haver Analytics).
Average daily depths are plotted in the second panel in Figure 2, and summary statistics
are reported in Table 3.14 Average depth at the inside tier is far and away greatest for the
2-year note, averaging $490 million for the full sample period, versus $81 million for the 5-
year note and $69 million for the 10-year note. Depth is much greater on BrokerTec than
it was on GovPX, with the 2-year note showing a ten-fold increase. Moreover, depth shows
tremendous variation on BrokerTec, plunging during the 2007-09 financial crisis and again
dropping during the 2013 taper tantrum and around the time of the October 2014 flash rally.
By contrast, bid-ask spreads show a more muted response to these episodes.13The minimum tick size is 1/2 of a 32nd of a point for the 10-year note (where a point equals one
percent of par) and 1/4 of a 32nd for the 2- and 5-year notes. Using BrokerTec tick data for 2010-2011,Fleming, Mizrach, and Nguyen (2017) find that 97% of quotes for the on-the-run 2-year note are at theminimum tick size.
14As noted earlier, GovPX depth is only available from July 1994.
10

One key limitation of depth is that it does not consider the spread between quoted price
tiers, including the inside bid-ask spread, and as such does not directly capture the cost aspect
of liquidity. Another drawback is that market participants often do not reveal the full quantities
they are willing to transact at a given price, so that measured depth may underestimate true
depth. Conversely, because of the speed with which orders can be withdrawn from the market,
actual depth may instead be lower than what is posted in the limit order book.
A popular liquidity measure, suggested by Kyle (1985) considers the rise (fall) in price
that typically occurs with a buyer-initiated (seller-initiated) trade. The “kyle lambda”, or
price impact, is defined as the slope of the line that relates the price change to trade size
and is often estimated by regressing price changes on net signed trading volume (positive for
buyer-initiated volume and negative for seller-initiated volume) for intervals of fixed time. The
measure is relevant to those executing large trades or a series of trades and, together with the
bid-ask spread and depth measures, provides a fairly complete picture of market liquidity.
We calculate price impact for each security and day as the coefficient from a regression
of five-minute price changes on contemporaneous net order flow. Price changes are calculated
using the midpoint of the last bid and offer quotes posted in a five-minute interval and net order
flow is calculated as the number of buyer-initiated trades less the number of seller-initiated
trades.15 Since trade direction is included in the GovPX and BrokerTec databases, we can sign
trades unambiguously.16 As with the bid-ask spreads and depth, the measure is calculated for
New York trading hours only.
Daily price impact coefficients are plotted in the bottom panel of Figure 2, and summary
statistics are reported in Table 3. Average price impact coefficients for the full sample are 10.8
basis points per 100 hundred net trades for the 2-year note, 24.2 for the 5-year note, and 41.8
for the 10-year note. Price impact tends to be higher during the GovPX sample period than
during the BrokerTec sample period, especially in 1999 and 2000 when GovPX data coverage15The regressions using net trading frequency tend to have greater explanatory power than those
using net trading volume. This may reflect the fact that trade size is exogenous – depending on tradingconditions – and that the informativeness of amounts executed during workups tends to be less thanthat of initial trades, as shown in Fleming and Nguyen (2013).
16As noted earlier, we do not have trade sign for BrokerTec data in 2001 so we do not calculate priceimpact for that year.
11
is limited. For the BrokerTec sample period, price impact rises sharply during the 2007-09
financial crisis, and to a lesser extent during the 2013 taper tantrum and around the October
2014 flash rally.
We report the correlation coefficients of each liquidity measure across the 2-, 5-, and 10-
year notes in Table 4. The table shows that better liquidity in one security tends to be
associated with better liquidity in another. The association is strongest between the 5- and
10-year notes. For these two maturities, correlations range from 78-89% for bid-ask spreads,
depth, and price impact. By contrast, the correlations between the 2- and 10-year notes for
these variables range from 50-64%, suggesting that liquidity dynamics for the 2-year note are
somewhat separate from those for the longer maturities. A similar distinction appears to hold
for trading frequency and volume.
We also report correlations across our various liquidity measures in Table 5. The corre-
lations are of daily averages across the 2-, 5-, and 10-year notes. The analysis reveals that
better liquidity by one measure tends to be associated with better liquidity in another, so bid-
ask spreads and price impact are positively correlated with one another, and both negatively
correlated with depth. Increases in the trading activity measures, and especially trade size,
also tend to be associated with better liquidity. Interestingly, the correlations between bid-ask
spreads and the depth and price impact measures are smaller in magnitude in the latter half
of the sample, perhaps reflecting the spread’s limited variation over this period.
4.2 Comparison with CRSP
Existing longer-term studies of Treasury transaction costs have used CRSP bid-ask spreads.
Until 1996, CRSP’s source for Treasury price quotes was the “Composite 3:30 P.M. Quotations
for US Government Securities” compiled by the Federal Reserve Bank of New York. Starting in
October of 1996, CRSP’s source for Treasury price quotes switched to GovPX, which provides
a daily 5 p.m. aggregation of intra-day bids, offers, and transactions.17
Figure 3 plots CRSP bid-ask spreads for the 2-, 5-, and 10-year notes. Each panel in the
figure shows that the GovPX/BrokerTec and CRSP bid-ask spread series have very little in17See http://www.crsp.com/files/treasury_guide_0.pdf.
12

common. For the period from late June 1998 to early February 2009, the CRSP series are
nearly constant. The CRSP series actually narrow in late June 1998, right before liquidity
worsened with the near-failure of LTCM. The spreads then remained steady during the LTCM
episode, the September 11 attacks, and the late 2008 peak of the 2007-09 financial crisis. CRSP
bid-ask spread variation resumed in February 2009, but even then bears little resemblance to
our BrokerTec series.
Table 6 confirms the lack of clearly signed correlation between our GovPX/BrokerTec bid-
ask spreads and the CRSP spreads. Not only are the correlations not close to one, but they
are frequently close to zero or negative, with 17 of the 36 coefficients in the table less than
zero. The weak correlations occur regardless of estimation approach, be it daily levels, daily
changes, or monthly changes of exponentially-weighted moving averages.
In terms of magnitudes, the CRSP bid-ask spreads imply significantly higher costs to
execute trades. The 2-, 5-, and 10-year notes all show CRSP spreads to frequently be two
32nds of a point in the early- to mid-1990s, almost four times wider than the spreads we record
from the intraday GovPX data over the same period. CRSP spreads during the BrokerTec era
are somewhat narrower, albeit still multiples of the BrokerTec spreads. That said, spreads may
vary across different parts of the market (be it the interdealer market or the dealer-to-customer
market), so it is probably the lack of positive correlation in the spreads discussed earlier which
is most surprising.
It turns out that an important reason for the spread differences is that CRSP seems to
be relying on indicative bid-ask spreads from GovPX, whereas our analysis relies on market
spreads. That is, the GovPX database contains both market quotes, which reflect actual quotes
submitted by market participants, and indicative quotes, which reflect model-based estimates
of prices. When we instead pull end-of-day (5 p.m.) indicative quotes from GovPX, our series
matches the CRSP series perfectly for much of the sample.18
Another possible reason for the divergences in the spread series could be time-of-day differ-
ences. CRSP reports end-of-day spreads, whereas we report averages based on quotes through-
out the day. However, if we instead pull end-of-day market quotes from GovPX and BrokerTec,18Specifically, the quotes match on nearly every day from October 1996 to May 2005. After May
2005, there is variation in the CRSP series that does not match our indicative GovPX quotes.
13
we essentially get a noiser and more discrete version of our average series and not anything
looking like the CRSP series. Overall, our findings cast doubt on the value of the information
contained in CRSP bid-ask spreads over our sample period.
In an earlier paper, Duffee (1996) reports that CRSP bid-ask spreads have at times been
based on a maturity-dependent “spread curve” that does not change from day to day. That
paper was written at a time when CRSP spreads came from the Federal Reserve Bank of New
York. Our findings show that the spreads in CRSP since it switched to GovPX in October
1996 exhibit similar behavior.
4.3 Liquidity Index
To summarize the evolution of Treasury market liquidity from 1991 to 2017, we construct
a liquidity index, combining the bid-ask spread, depth, and price impact measures. The
rationale for combining the measures is that no single measure suitably measures liquidity
by itself because each captures a different aspect of liquidity. Bid-ask spreads thus measure
the cost aspect of liquidity (for single trades of limited size), order book depth the quantity
of securities that can be transacted (at the inside spread), and price impact the extent to
which prices move in response to trades, thereby measuring both cost and quantity aspects of
liquidity.
To facilitate combining the measures into a single index, it is convenient to first invert
depth. The transformed depth measure has better statistical properties. Moreover, in periods
of illiquidity, bid-ask spreads, price impact, and 1/depth will all tend to rise, which allows us
to use positive index weights for all index components.
Before creating the index, we impute the measures for dates those variables are missing
because of data limitations, primarily depth before July 1994 and price impact in 2001, but
also occasional days for any of the measures. To do this, for each security (2-, 5-, and 10-year
note) and sub-sample (GovPX and BrokerTec), we first project each measure onto the MOVE
Index and the VIX Index, excluding the 1999-2004 period of limited data coverage. With
three securities, two subsamples, and three liquidity measures, this amounts to running 18
14
separate regressions.19 Then, for any dates with missing data, we use the results from the
aforementioned models to predict each of the measures.
The next step in index construction is to standardize each of the measures for each security
to have mean zero and variance one. We then construct an index for each note through a simple
averaging of the three liquidity measures. We then further aggregate the three individual
security indexes into an overall Treasury liquidity index by simple averaging. As a final step,
we exponentially smooth each liquidity index. Smoothing helps us construct an average that
is more reflective of fundamental liquidity for a given day by dampening the influence of
announcements, calendar effects, or noise in the estimation process.20
The liquidity indexes for the 2-, 5-, and 10-year notes are plotted in the top panel of
Figure 4. The indexes, which are highly correlated across securities, tend to be lower during
the BrokerTec sample period, likely reflecting the liquidity benefits of electronic trading and
expanded competition in the interdealer market. Aside from some spikes in the early 1990s,
the indexes are marked by sharp increases in the fall of 1998 around the near-failure of LTCM,
and in late 2008 after the bankruptcy of Lehman Brothers. More recently, the indexes point
to increases in illiquidity during the 2013 taper tantrum and around the October 2014 flash
rally.
The high correlation across the 2-, 5-, and 10-year indexes suggests a common factor struc-
ture, which we aim to capture by simple averaging. The bottom panel of Figure 4 plots the
resulting aggregate liquidity index. Over the extended sample period from 1991 to 2017, the
aggregate liquidity index reveals a significant downward trend, reflecting the combined com-
pression of bid-ask spreads, price impact, and 1/depth over the last 26 years. The data suggest
that liquidity in 2017 is good by historical standards.19These regression results are excluded from the paper for brevity but are available from the authors
on request.20Compared to a simple moving average, exponentially declining weights prevent observations from
the more distant past of having undue influence when they drop out of the simple moving averagewindow. For our liquidity indices, we set the smoothing parameter to ensure that 95% of the weightscover observations in the previous 21 days.
15
4.4 Explaining Liquidity Index Variation
Market liquidity is a function of the market structure that allows buyers and sellers of se-
curities to come to a market clearing price. Dealers and HFTs play a crucial role, as these
institutions intermediate between buyers and sellers. The ability of the market making sector
to intermediate in turn depends on its ability to obtain funding. For example, during times
of market turmoil or crisis, one would expect market makers to have difficulty raising funds,
which in turn affects their ability to make markets.
In fact, economic theory suggests that there might be a close link between market liquidity
and funding liquidity (see Brunnermeier and Pedersen (2009)). When a volatility shock occurs,
lenders may tighten their terms of funding in the form of higher haircuts and repo rates. As
funding becomes scarce, market makers find it more difficult to obtain leverage to finance
their inventories. Market liquidity can therefore decline, which leads to higher price impact
and higher volatility. There is therefore a self reinforcing feedback mechanism linking volatility
shocks, funding liquidity, and market liquidity. Consistent with such theories, Adrian, Etula,
and Muir (2014) document that the risk premia across stocks and bonds is systematically
related to dealer leverage shocks, which the authors use as a proxy for the availability of
funding liquidity (as more ample funding liquidity allow dealers to increase leverage).
While these theories can potentially be applied in a variety of asset classes, we argue that
the link between volatility, funding liquidity, and market liquidity may be especially strong for
Treasuries. Because of their extraordinary safety, demand for Treasuries rises during a flight-
to-quality or “risk-off” episode, which can potentially increase the demand for immediacy.
The increased demand for immediacy, in turn, puts strains on the market making sector,
and hence on market liquidity. Furthermore, Treasuries are used extensively as collateral
and may therefore be used for funding in repo markets. The twin uses of Treasuries as a
safe haven during times of stress and as a source of immediate funding imply that Treasuries
as an asset class should display especially tight links between volatility, funding liquidity, and
market liquidity. We investigate this conjecture by studying the link between volatility, funding
liquidity, and our market liquidity index empirically.
Figure 5 shows strong contractions in the funding liquidity measures during both the LTCM
16
episode and the financial crisis. The top left panel, for example, reveals sharp widenings of the
Aaa/Treasury spread, which can be interpreted as increases in the convenience yield offered by
Treasuries over securities with similar credit quality (Krishnamurthy and Vissing-Jorgensen
(2012)). The top right panel of Figure 5 shows the Treasury liquidity index together with dealer
leverage. The figure clearly shows that periods of sharp dealer deleveraging are associated with
sharp increases in the index, indicating that market liquidity dissipated, consistent with the
theory of Brunnermeier and Pedersen (2009). Over the period since 1991, the two episodes
of dealer deleveraging correspond to the 1998 LTCM episode and the 2007-09 financial crisis,
when both market and funding liquidity contracted sharply. That said, there is other high
frequency variation in market liquidity that is not directly associated with variation in dealer
leverage.
The second row of Figure 5 shows that the on-the-run/off-the-run spread underwent similar
crisis dynamics as the market liquidity index, with heightened illiquidity also occurring in the
late 1990s and early 2000s. The second row also plots the liquidity index together with the
Refcorp-Treasury spread, which is advocated by Longstaff (2004) as an indicator of funding
liquidity. The time series plot shows strong covariation between market and funding liquidity,
though the Refcorp spread exhibits a low frequency upward trend over the sample period while
the market liquidity index shows a low frequency downward trend.
Additional measures of funding liquidity include Treasury spline errors, the swap spread,
and the TED spread, also shown in Figure 5. The Treasury spline error has been advocated
as a funding liquidity measure by Hu, Pan, and Wang (2013) (also see Fleming (2000)). In
an arbitrage-free yield curve, Treasuries with neighboring maturities have similar cash flows
and must therefore command similar prices. Dispersion around a smooth curve is therefore
interpreted as an arbitrage opportunity which may not be realized when arbitrage capital is
scarce. The fit errors mainly show a correlation to market liquidity during the 2007-09 crisis,
and to some extent during the fall 1998 financial market turmoil, around the September 11
attacks, and during the 2013 taper tantrum, but otherwise co-vary little with market liquidity.
The TED spread, the difference between unsecured short term funding and short-term
Treasury yields, also widens mainly in the fall 1998 and 2007-09 crises. The swap spread
17
(which is an average of the 2-, 5-, and 10-year swap spreads) widened sharply during the LTCM
episode and in late 2007 and much of 2008, but then narrowed in late 2008 and 2009. In fact,
the link between the swap spread and funding liquidity is ambiguous. A flight to quality leads
to a compression of Treasury yields, widening the spread, but a decline in funding liquidity
removes balance sheet capacity to arbitrage the interest rate basis, which can allow the spread
to narrow.
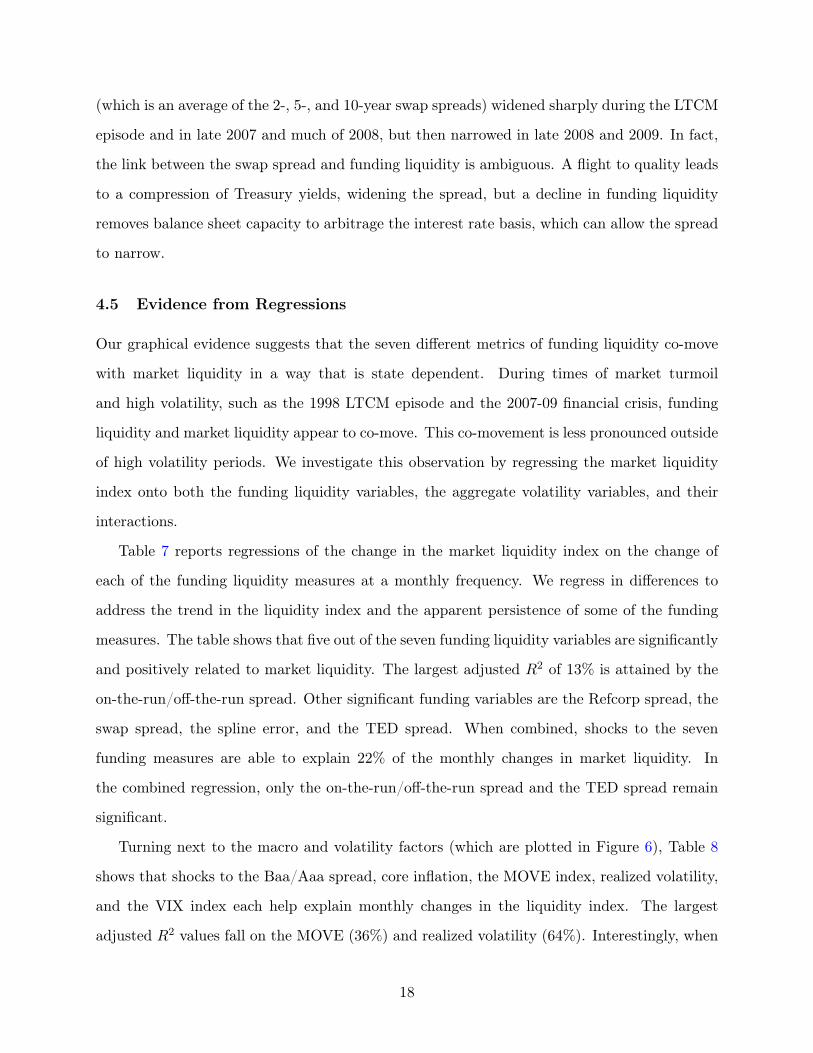
4.5 Evidence from Regressions
Our graphical evidence suggests that the seven different metrics of funding liquidity co-move
with market liquidity in a way that is state dependent. During times of market turmoil
and high volatility, such as the 1998 LTCM episode and the 2007-09 financial crisis, funding
liquidity and market liquidity appear to co-move. This co-movement is less pronounced outside
of high volatility periods. We investigate this observation by regressing the market liquidity
index onto both the funding liquidity variables, the aggregate volatility variables, and their
interactions.
Table 7 reports regressions of the change in the market liquidity index on the change of
each of the funding liquidity measures at a monthly frequency. We regress in differences to
address the trend in the liquidity index and the apparent persistence of some of the funding
measures. The table shows that five out of the seven funding liquidity variables are significantly
and positively related to market liquidity. The largest adjusted R2 of 13% is attained by the
on-the-run/off-the-run spread. Other significant funding variables are the Refcorp spread, the
swap spread, the spline error, and the TED spread. When combined, shocks to the seven
funding measures are able to explain 22% of the monthly changes in market liquidity. In
the combined regression, only the on-the-run/off-the-run spread and the TED spread remain
significant.
Turning next to the macro and volatility factors (which are plotted in Figure 6), Table 8
shows that shocks to the Baa/Aaa spread, core inflation, the MOVE index, realized volatility,
and the VIX index each help explain monthly changes in the liquidity index. The largest
adjusted R2 values fall on the MOVE (36%) and realized volatility (64%). Interestingly, when
18
all macro and volatility factors are combined, only the default spread and realized volatility
remain significant, contributing to a joint R2 of 65%.
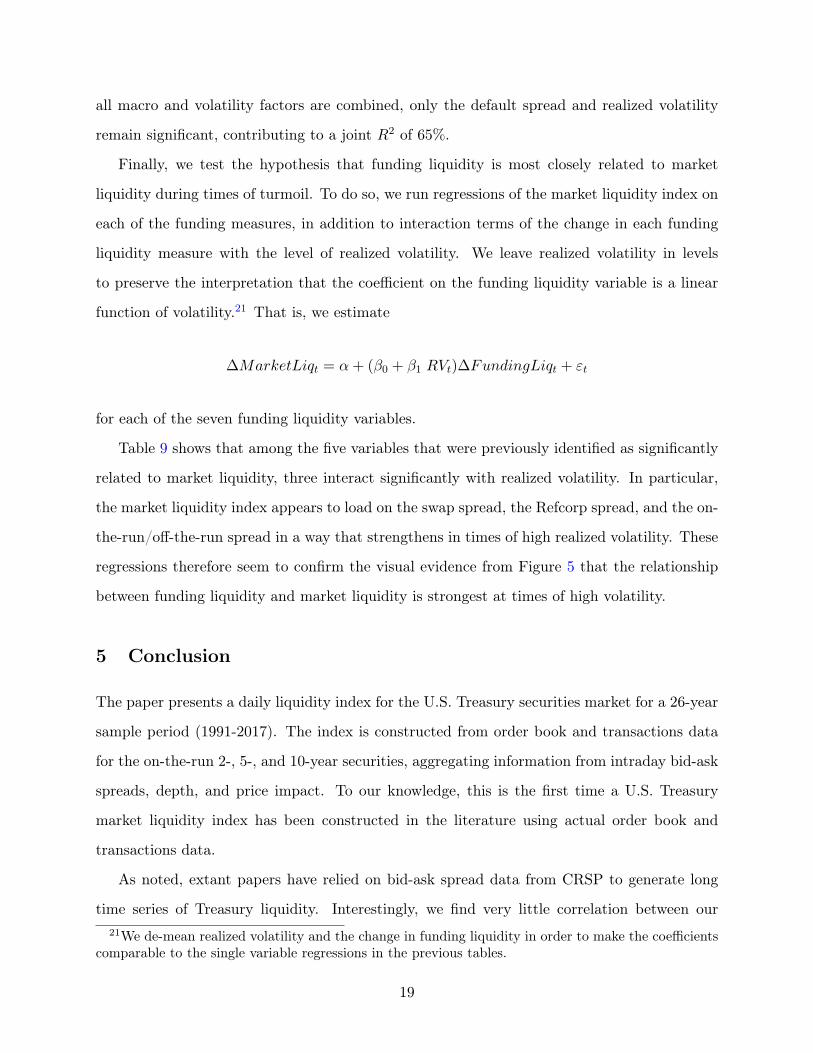
Finally, we test the hypothesis that funding liquidity is most closely related to market
liquidity during times of turmoil. To do so, we run regressions of the market liquidity index on
each of the funding measures, in addition to interaction terms of the change in each funding
liquidity measure with the level of realized volatility. We leave realized volatility in levels
to preserve the interpretation that the coefficient on the funding liquidity variable is a linear
function of volatility.21 That is, we estimate
∆MarketLiqt = α+ (β0 + β1 RVt)∆FundingLiqt + εt
for each of the seven funding liquidity variables.
Table 9 shows that among the five variables that were previously identified as significantly
related to market liquidity, three interact significantly with realized volatility. In particular,
the market liquidity index appears to load on the swap spread, the Refcorp spread, and the on-
the-run/off-the-run spread in a way that strengthens in times of high realized volatility. These
regressions therefore seem to confirm the visual evidence from Figure 5 that the relationship
between funding liquidity and market liquidity is strongest at times of high volatility.
5 Conclusion
The paper presents a daily liquidity index for the U.S. Treasury securities market for a 26-year
sample period (1991-2017). The index is constructed from order book and transactions data
for the on-the-run 2-, 5-, and 10-year securities, aggregating information from intraday bid-ask
spreads, depth, and price impact. To our knowledge, this is the first time a U.S. Treasury
market liquidity index has been constructed in the literature using actual order book and
transactions data.
As noted, extant papers have relied on bid-ask spread data from CRSP to generate long
time series of Treasury liquidity. Interestingly, we find very little correlation between our21We de-mean realized volatility and the change in funding liquidity in order to make the coefficients
comparable to the single variable regressions in the previous tables.
19

bid ask spread series and those of CRSP. Further investigation suggests that CRSP relies on
indicative end-of-day quotations, whereas our bid-ask spreads are based on actual order book
data. The fact that the CRSP series are largely uncorrelated with ours, and that they remained
unchanged for years through the depths of the 2007-09 financial crisis, suggests that they have
little informational value over our sample period.
We study the properties of our liquidity index by relating them to market volatility and
funding liquidity metrics. Treasury market liquidity is closely related to market volatility: in
times of high volatility, market liquidity tends to evaporate. Those are also the times when
funding liquidity metrics tend to be most closely correlated with market liquidity. In particular,
during the 1998 LTCM episode and the 2007-09 financial crisis, funding liquidity deteriorated
sharply at the same time as market liquidity evaporated. Some funding liquidity indicators
also deteriorated following the September 11, 2001 attacks and during the 2013 taper tantrum,
both times when market liquidity was poor.
20

References
Adrian, T., R. Crump, and E. Vogt (2016): “Nonlinearity and Flight to Safety in the Risk-Return Tradeoff for Stocks and Bonds,” Federal Reserve Bank of New York Staff Reports,723.
Adrian, T., E. Etula, and T. Muir (2014): “Financial Intermediaries and the Cross-Sectionof Asset Returns,” Journal of Finance, 69, 2557–2596.
Adrian, T., M. J. Fleming, O. Shachar, and E. Vogt (2017): “Market liquidity afterthe financial crisis,” Annual Review of Financial Economics, forthcoming.
Boni, L., and C. Leach (2004): “Expandable Limit Order Markets,” Journal of FinancialMarkets, 7, 145–185.
Brandt, M., and K. Kavajecz (2004): “Price Discovery in the U.S. Treasury Market: theImpact of Order Flow and Liquidity on the Yield Curve,” Journal of Finance, 59.
Brunnermeier, M. K., and L. H. Pedersen (2009): “Market Liquidity and Funding Liq-uidity,” Review of Financial Studies, 22, 2201–2238.
Duffee, G. R. (1996): “Idiosyncratic variation of Treasury bill yields,” The Journal of Fi-nance, 51(2), 527–551.
Dungey, M., O. Henry, and M. McKenzie (2013): “Modeling Trade Duration in U.S.Treasury Markets,” Quantitative Finance, 13, 1431–1442.
Engle, R. F., M. J. Fleming, E. Ghysels, and G. Nguyen (2012): “Liquidity, Volatility,and Flights to Safety in the U.S. Treasury Market: Evidence from a New Class of DynamicOrder Book Models,” Federal Reserve Bank of New York Staff Report 590, December 2012.
Fleming, M. (2000): “The Benchmark U.S. Treasury Market: Recent Performance and Pos-sible Alternatives,” Economic Policy Review, 6(1), 129–45.
(2003): “Measuring Treasury Market Liquidity,” Federal Reserve Bank of New YorkEconomic Policy Review, 9, 83–108.
Fleming, M., B. Mizrach, and G. Nguyen (2017): “The Microstructure of a U.S. TreasuryECN: The BrokerTec Platform,” Journal of Financial Markets, forthcoming.
Fleming, M. J. (1997): “The Round-the-Clock Market for U.S. Treasury Securities,” FederalReserve Bank of New York Economic Policy Review, 3, 9–32.
Fleming, M. J., and G. Nguyen (2013): “Order Flow Segmentation and the Role of DarkTrading in the Price Discovery of U.S. Treasuries,” Federal Reserve Bank of New York StaffReport 624, August 2013.
Fleming, M. J., and E. M. Remolona (1999): “Price Formation and Liquidity in the U.S.Treasury Market: The Response to Public Information,” Journal of Finance, 54, 1901–1915.
Gorton, G., and G. Ordoñez (2011): “The Supply and Demand for Safe Assets,” Journalof Financial and Quantitative Analysis, 46(01), 111–139.
21
Goyenko, R., A. Subrahmanyam, and A. Ukhov (2011): “The term structure of bondmarket liquidity and its implications for expected bond returns,” Journal of Financial andQuantitative Analysis, 46(01), 111–139.
Goyenko, R. Y., and A. D. Ukhov (2009): “Stock and bond market liquidity: A long-runempirical analysis,” Journal of Financial and Quantitative Analysis, 44(01), 189–212.
Gurkaynak, R. S., B. Sack, and J. H. Wright (2007): “The U.S. Treasury Yield Curve:1961 to the Present,” Journal of Monetary Economics, 54, 2291–2304.
Hu, G. X., J. Pan, and J. Wang (2013): “Noise as Information for Illiquidity,” The Journalof Finance, 68(6), 2341–2382.
International Monetary Fund (2012): “Global Financial Stability Report: The Quest forLasting Stability,” International Monetary Fund: Washington, D.C.
Joint Staff Report (2015): “The U.S. Treasury Market on October 15, 2014,” U.S. Depart-ment of the Treasury, Board of Governors of the Federal Reserve System, Federal ReserveBank of New York, U.S. Securities and Exchange Commission, and U.S. Commodity FuturesTrading Commission.
Krishnamurthy, A. (2002): “The Bond/Old-Bond Spread,” Journal of Financial Economics,66(2), 463–506.
Krishnamurthy, A., and A. Vissing-Jorgensen (2012): “The aggregate demand for trea-sury debt,” Journal of Political Economy, 120(2), 233–267.
Longstaff, F. (2004): “The Flight-to-Liquidity Premium in U.S. Treasury Bond Prices,”Journal of Business, 77, 511–526.
Luo, H. (2010): “Profitable Opportunities around Macroeconomic Announcements in the U.S.Treasury Market,” Brock University Thesis.
Musto, D. K., G. Nini, and K. Schwarz (2016): “Notes on Bonds: Illiquidity FeedbackDuring the Financial Crisis,” The Wharton School, University of Pennsylvania ResearchPaper Series.
Pasquariello, P., and C. Vega (2007): “Informed and Strategic Order Flow in the BondMarkets,” Review of Financial Studies, 20.
22

Table 1: Trading Activity Summary Statistics
Panel A: GovPX Sample (June 1991-Dec 2000)
2-Year 5-Year 10-Year
Trading volume 5.08 5.03 3.27(2.52) (2.41) (1.59)
Trade frequency 387.18 638.53 567.36(162.63) (268.46) (232.47)
Trade size 12.87 7.74 5.59(2.41) (1.26) (1.04)
Panel B: BrokerTec Sample (Jan 2001-June 2017)
2-Year 5-Year 10-Year
Trading volume 22.55 30.88 26.67(14.85) (18.12) (15.81)
Trade frequency 787.22 2095.76 2145.39(550.72) (1113.47) (1120.46)
Trade size 30.29 14.56 11.99(10.32) (4.75) (4.01)
Panel C: Full Sample (June 1991-June 2017)
2-Year 5-Year 10-Year
Trading volume 16.15 21.41 18.09(14.59) (19.11) (16.93)
Trade frequency 640.65 1561.87 1566.62(488.87) (1142.35) (1180.32)
Trade size 23.90 12.06 9.64(11.83) (5.07) (4.48)
Source: Authors’ calculations, based on data from BrokerTec and GovPX.Notes: The table reports means and standard deviations (in parentheses) of daily tradingvolume, daily trade frequency, and average daily trade size for the on-the-run 2-, 5-, and10-year Treasury notes from June 17, 1991 to June 30, 2017. Trading volume is in billionsof dollars (par value) and trade size is in millions of dollars (par value).
23
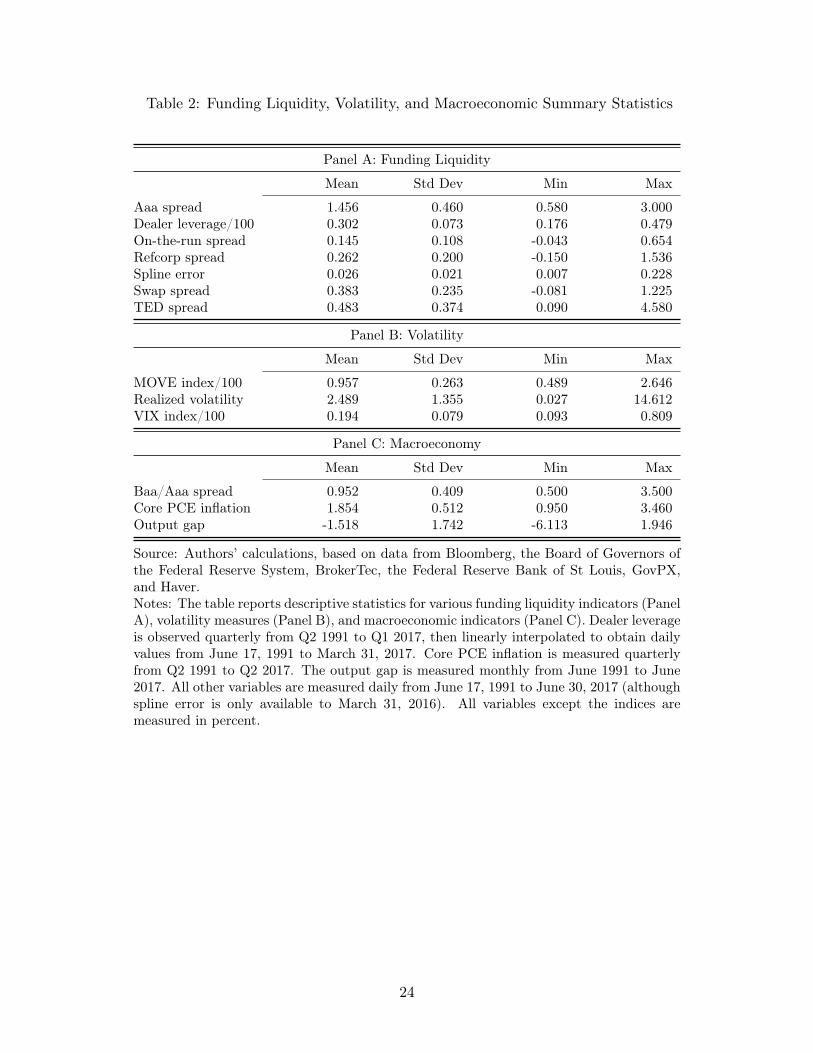
Table 2: Funding Liquidity, Volatility, and Macroeconomic Summary Statistics
Panel A: Funding Liquidity
Mean Std Dev Min Max
Aaa spread 1.456 0.460 0.580 3.000Dealer leverage/100 0.302 0.073 0.176 0.479On-the-run spread 0.145 0.108 -0.043 0.654Refcorp spread 0.262 0.200 -0.150 1.536Spline error 0.026 0.021 0.007 0.228Swap spread 0.383 0.235 -0.081 1.225TED spread 0.483 0.374 0.090 4.580
Panel B: Volatility
Mean Std Dev Min Max
MOVE index/100 0.957 0.263 0.489 2.646Realized volatility 2.489 1.355 0.027 14.612VIX index/100 0.194 0.079 0.093 0.809
Panel C: Macroeconomy
Mean Std Dev Min Max
Baa/Aaa spread 0.952 0.409 0.500 3.500Core PCE inflation 1.854 0.512 0.950 3.460Output gap -1.518 1.742 -6.113 1.946
Source: Authors’ calculations, based on data from Bloomberg, the Board of Governors ofthe Federal Reserve System, BrokerTec, the Federal Reserve Bank of St Louis, GovPX,and Haver.Notes: The table reports descriptive statistics for various funding liquidity indicators (PanelA), volatility measures (Panel B), and macroeconomic indicators (Panel C). Dealer leverageis observed quarterly from Q2 1991 to Q1 2017, then linearly interpolated to obtain dailyvalues from June 17, 1991 to March 31, 2017. Core PCE inflation is measured quarterlyfrom Q2 1991 to Q2 2017. The output gap is measured monthly from June 1991 to June2017. All other variables are measured daily from June 17, 1991 to June 30, 2017 (althoughspline error is only available to March 31, 2016). All variables except the indices aremeasured in percent.
24
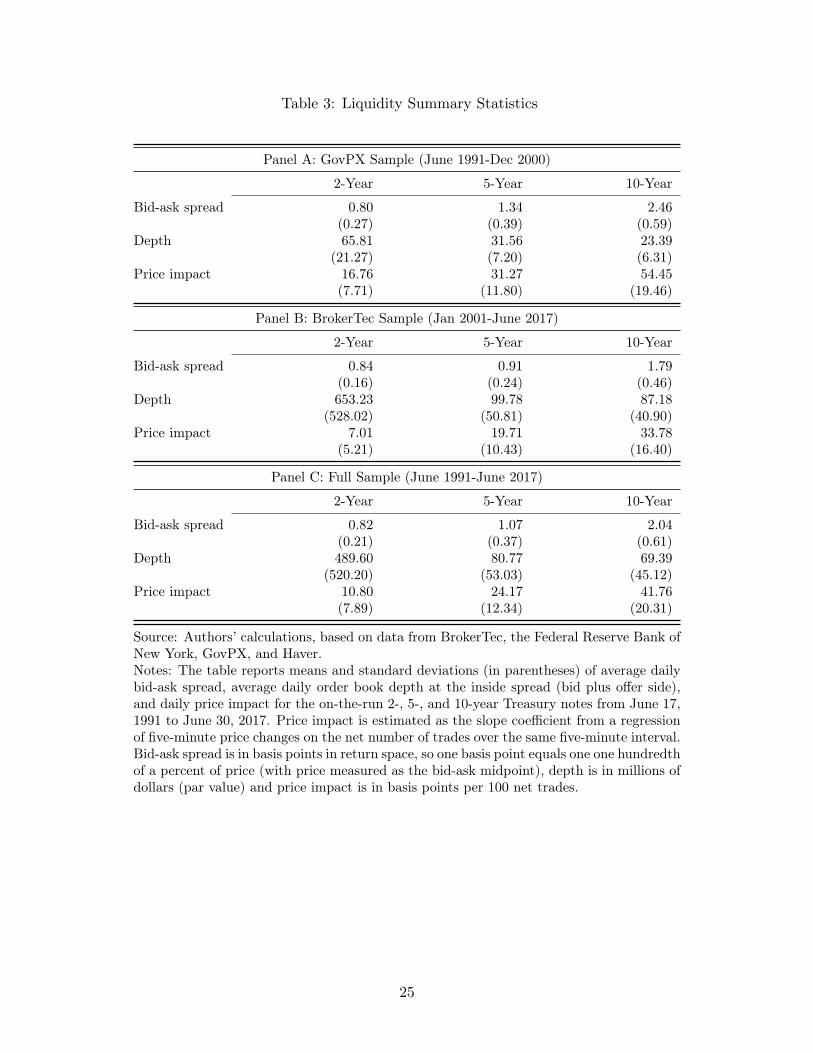
Table 3: Liquidity Summary Statistics
Panel A: GovPX Sample (June 1991-Dec 2000)
2-Year 5-Year 10-Year
Bid-ask spread 0.80 1.34 2.46(0.27) (0.39) (0.59)
Depth 65.81 31.56 23.39(21.27) (7.20) (6.31)
Price impact 16.76 31.27 54.45(7.71) (11.80) (19.46)
Panel B: BrokerTec Sample (Jan 2001-June 2017)
2-Year 5-Year 10-Year
Bid-ask spread 0.84 0.91 1.79(0.16) (0.24) (0.46)
Depth 653.23 99.78 87.18(528.02) (50.81) (40.90)
Price impact 7.01 19.71 33.78(5.21) (10.43) (16.40)
Panel C: Full Sample (June 1991-June 2017)
2-Year 5-Year 10-Year
Bid-ask spread 0.82 1.07 2.04(0.21) (0.37) (0.61)
Depth 489.60 80.77 69.39(520.20) (53.03) (45.12)
Price impact 10.80 24.17 41.76(7.89) (12.34) (20.31)
Source: Authors’ calculations, based on data from BrokerTec, the Federal Reserve Bank ofNew York, GovPX, and Haver.Notes: The table reports means and standard deviations (in parentheses) of average dailybid-ask spread, average daily order book depth at the inside spread (bid plus offer side),and daily price impact for the on-the-run 2-, 5-, and 10-year Treasury notes from June 17,1991 to June 30, 2017. Price impact is estimated as the slope coefficient from a regressionof five-minute price changes on the net number of trades over the same five-minute interval.Bid-ask spread is in basis points in return space, so one basis point equals one one hundredthof a percent of price (with price measured as the bid-ask midpoint), depth is in millions ofdollars (par value) and price impact is in basis points per 100 net trades.
25

Table 4: Correlations of Individual Liquidity/Activity Measures Across Securities
Panel A: Bid-Ask Spread
2-Year 5-Year 10-Year
2-year 1.000 0.590 0.5045-year 0.590 1.000 0.86710-year 0.504 0.867 1.000
Panel B: Depth
2-Year 5-Year 10-Year
2-year 1.000 0.813 0.6355-year 0.813 1.000 0.89410-year 0.635 0.894 1.000
Panel C: Price Impact
2-Year 5-Year 10-Year
2-year 1.000 0.758 0.6285-year 0.758 1.000 0.78110-year 0.628 0.781 1.000
Panel D: Trading Volume
2-Year 5-Year 10-Year
2-year 1.000 0.700 0.6625-year 0.700 1.000 0.97310-year 0.662 0.973 1.000
Panel E: Trade Frequency
2-Year 5-Year 10-Year
2-year 1.000 0.696 0.6145-year 0.696 1.000 0.97810-year 0.614 0.978 1.000
Panel F: Trade Size
2-Year 5-Year 10-Year
2-year 1.000 0.873 0.8905-year 0.873 1.000 0.94310-year 0.890 0.943 1.000
Source: Authors’ calculations, based on data from BrokerTec, the Federal Reserve Bank ofNew York, GovPX, and Haver.Notes: The table reports correlation coefficients of the levels of individual liquidity/activitymeasures across securities for the on-the-run 2-, 5-, and 10-year Treasury notes from June17, 1991 to June 30, 2017.
26

Table 5: Correlations Across Liquidity/Activity Measures
Panel A: GovPX Sample (June 1991-Dec 2000)
Bid-AskSpread
Depth PriceImpact
TradingVolume
TradeFre-
quency
TradeSize
Bid-ask spread 1.000 -0.730 0.793 -0.139 -0.059 -0.338Depth -0.730 1.000 -0.625 0.118 -0.012 0.551Price impact 0.793 -0.625 1.000 0.029 0.068 -0.224Trading volume -0.139 0.118 0.029 1.000 0.944 0.588Trade frequency -0.059 -0.012 0.068 0.944 1.000 0.338Trade size -0.338 0.551 -0.224 0.588 0.338 1.000
Panel B: BrokerTec Sample (Jan 2001-June 2017)
Bid-AskSpread
Depth PriceImpact
TradingVolume
TradeFre-
quency
TradeSize
Bid-ask spread 1.000 -0.262 0.381 -0.317 -0.214 -0.387Depth -0.262 1.000 -0.515 0.137 -0.087 0.612Price impact 0.381 -0.515 1.000 0.145 0.407 -0.454Trading volume -0.317 0.137 0.145 1.000 0.824 0.537Trade frequency -0.214 -0.087 0.407 0.824 1.000 0.052Trade size -0.387 0.612 -0.454 0.537 0.052 1.000
Panel C: Full Sample (June 1991-June 2017)
Bid-AskSpread
Depth PriceImpact
TradingVolume
TradeFre-
quency
TradeSize
Bid-ask spread 1.000 -0.360 0.736 -0.471 -0.401 -0.525Depth -0.360 1.000 -0.572 0.429 0.244 0.742Price impact 0.736 -0.572 1.000 -0.349 -0.189 -0.609Trading volume -0.471 0.429 -0.349 1.000 0.896 0.762Trade frequency -0.401 0.244 -0.189 0.896 1.000 0.478Trade size -0.525 0.742 -0.609 0.762 0.478 1.000
Source: Authors’ calculations, based on data from BrokerTec, the Federal Reserve Bank ofNew York, GovPX, and Haver.Notes: The table reports correlation coefficients across the levels of liquidity/activity mea-sures from June 17, 1991 to June 30, 2017. Daily liquidity/activity measures are averagesof those for the on-the-run 2-, 5-, and 10-year notes.
27
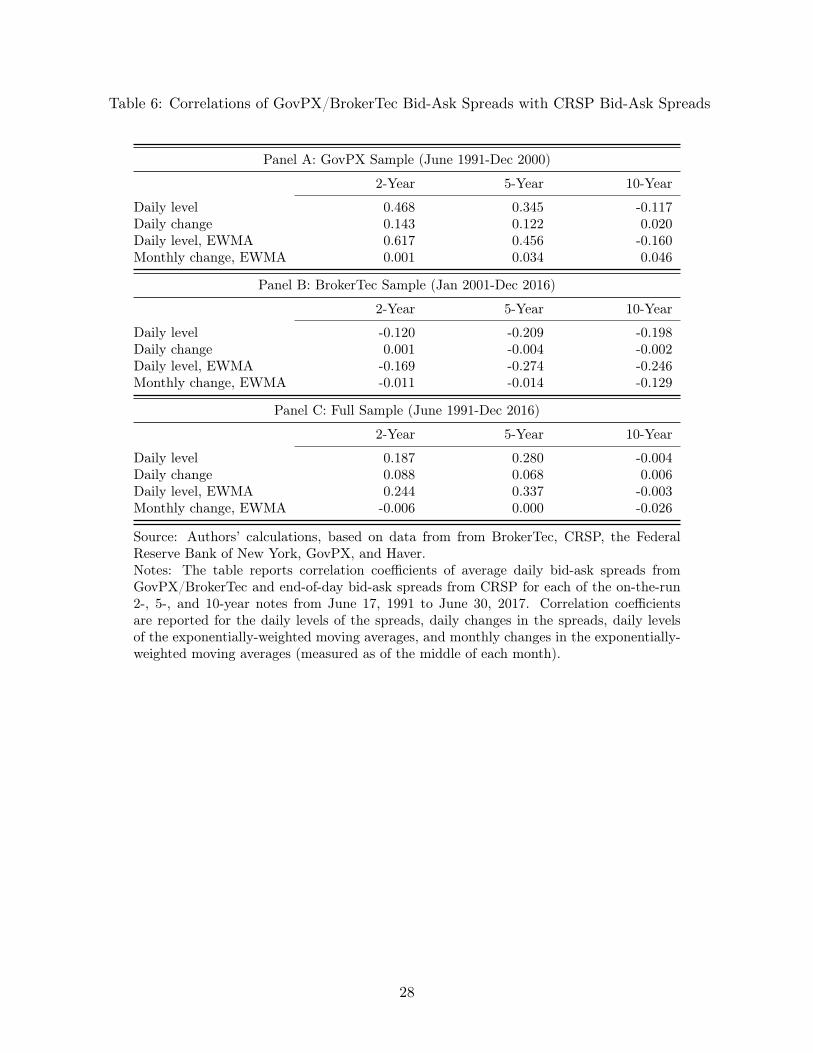
Table 6: Correlations of GovPX/BrokerTec Bid-Ask Spreads with CRSP Bid-Ask Spreads
Panel A: GovPX Sample (June 1991-Dec 2000)
2-Year 5-Year 10-Year
Daily level 0.468 0.345 -0.117Daily change 0.143 0.122 0.020Daily level, EWMA 0.617 0.456 -0.160Monthly change, EWMA 0.001 0.034 0.046
Panel B: BrokerTec Sample (Jan 2001-Dec 2016)
2-Year 5-Year 10-Year
Daily level -0.120 -0.209 -0.198Daily change 0.001 -0.004 -0.002Daily level, EWMA -0.169 -0.274 -0.246Monthly change, EWMA -0.011 -0.014 -0.129
Panel C: Full Sample (June 1991-Dec 2016)
2-Year 5-Year 10-Year
Daily level 0.187 0.280 -0.004Daily change 0.088 0.068 0.006Daily level, EWMA 0.244 0.337 -0.003Monthly change, EWMA -0.006 0.000 -0.026
Source: Authors’ calculations, based on data from from BrokerTec, CRSP, the FederalReserve Bank of New York, GovPX, and Haver.Notes: The table reports correlation coefficients of average daily bid-ask spreads fromGovPX/BrokerTec and end-of-day bid-ask spreads from CRSP for each of the on-the-run2-, 5-, and 10-year notes from June 17, 1991 to June 30, 2017. Correlation coefficientsare reported for the daily levels of the spreads, daily changes in the spreads, daily levelsof the exponentially-weighted moving averages, and monthly changes in the exponentially-weighted moving averages (measured as of the middle of each month).
28
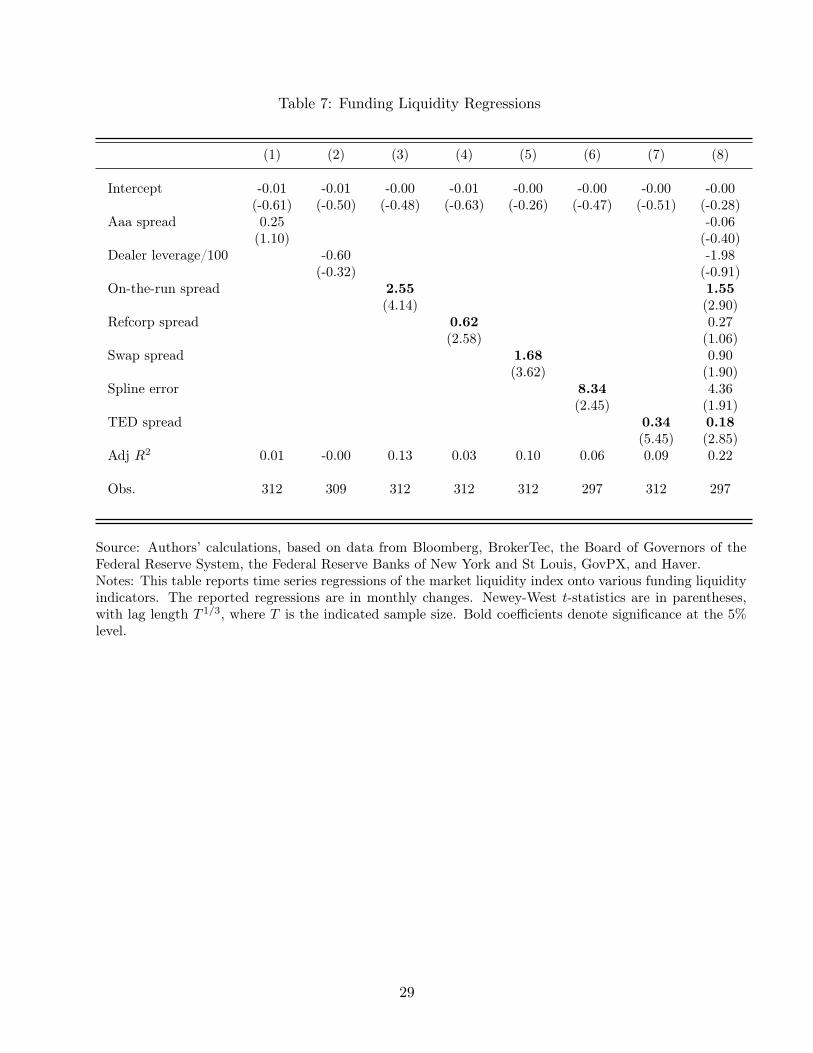
Table 7: Funding Liquidity Regressions
(1) (2) (3) (4) (5) (6) (7) (8)
Intercept -0.01 -0.01 -0.00 -0.01 -0.00 -0.00 -0.00 -0.00(-0.61) (-0.50) (-0.48) (-0.63) (-0.26) (-0.47) (-0.51) (-0.28)
Aaa spread 0.25 -0.06(1.10) (-0.40)
Dealer leverage/100 -0.60 -1.98(-0.32) (-0.91)
On-the-run spread 2.55 1.55(4.14) (2.90)
Refcorp spread 0.62 0.27(2.58) (1.06)
Swap spread 1.68 0.90(3.62) (1.90)
Spline error 8.34 4.36(2.45) (1.91)
TED spread 0.34 0.18(5.45) (2.85)
Adj R2 0.01 -0.00 0.13 0.03 0.10 0.06 0.09 0.22
Obs. 312 309 312 312 312 297 312 297
Source: Authors’ calculations, based on data from Bloomberg, BrokerTec, the Board of Governors of theFederal Reserve System, the Federal Reserve Banks of New York and St Louis, GovPX, and Haver.Notes: This table reports time series regressions of the market liquidity index onto various funding liquidityindicators. The reported regressions are in monthly changes. Newey-West t-statistics are in parentheses,with lag length T 1/3, where T is the indicated sample size. Bold coefficients denote significance at the 5%level.
29
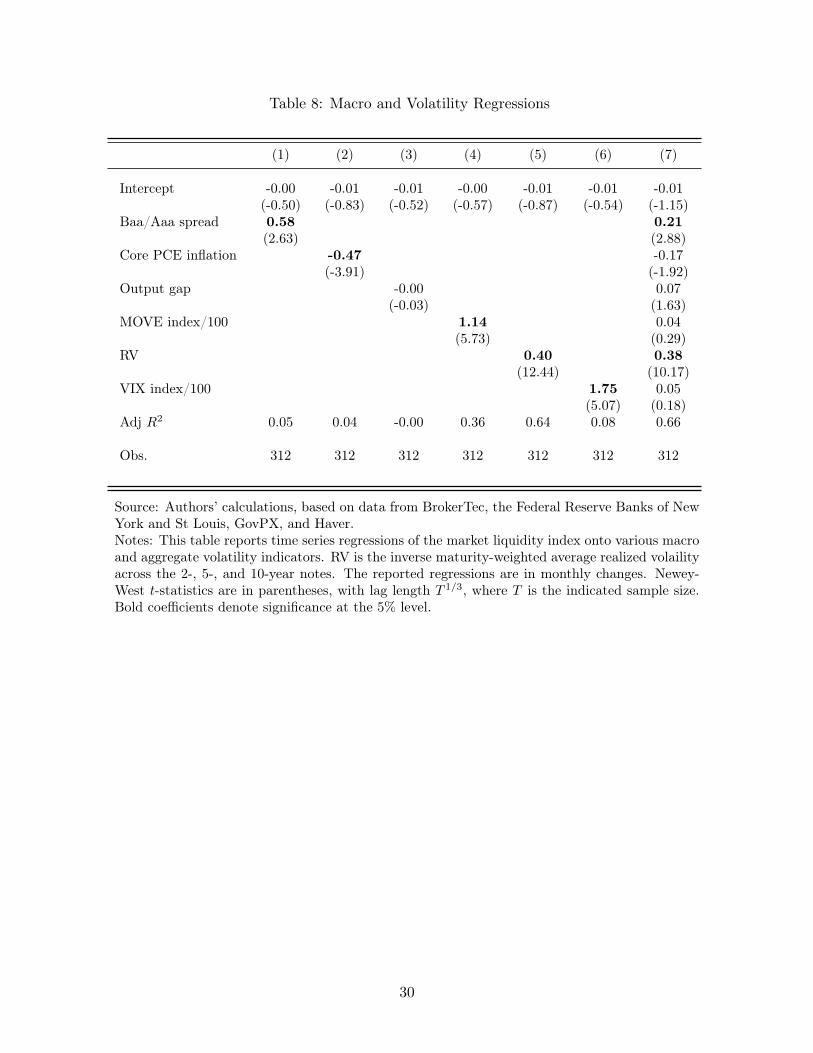
Table 8: Macro and Volatility Regressions
(1) (2) (3) (4) (5) (6) (7)
Intercept -0.00 -0.01 -0.01 -0.00 -0.01 -0.01 -0.01(-0.50) (-0.83) (-0.52) (-0.57) (-0.87) (-0.54) (-1.15)
Baa/Aaa spread 0.58 0.21(2.63) (2.88)
Core PCE inflation -0.47 -0.17(-3.91) (-1.92)
Output gap -0.00 0.07(-0.03) (1.63)
MOVE index/100 1.14 0.04(5.73) (0.29)
RV 0.40 0.38(12.44) (10.17)
VIX index/100 1.75 0.05(5.07) (0.18)
Adj R2 0.05 0.04 -0.00 0.36 0.64 0.08 0.66
Obs. 312 312 312 312 312 312 312
Source: Authors’ calculations, based on data from BrokerTec, the Federal Reserve Banks of NewYork and St Louis, GovPX, and Haver.Notes: This table reports time series regressions of the market liquidity index onto various macroand aggregate volatility indicators. RV is the inverse maturity-weighted average realized volailityacross the 2-, 5-, and 10-year notes. The reported regressions are in monthly changes. Newey-West t-statistics are in parentheses, with lag length T 1/3, where T is the indicated sample size.Bold coefficients denote significance at the 5% level.
30

Table 9: Funding Liquidity and Volatility Interactions
(1) (2) (3) (4) (5) (6) (7) (8)
Intercept -0.01 -0.01 -0.01 -0.01 -0.01 -0.01 -0.01 -0.00(-0.56) (-0.95) (-0.81) (-1.03) (-0.80) (-1.30) (-0.58) (-0.53)
Aaa spread 0.31 0.07(1.52) (0.48)
Aaa spread * RV -0.06 -0.13(-0.28) (-1.51)
Dealer leverage/100 5.17 -3.99(0.99) (-1.18)
Dealer leverage/100 * RV -4.47 2.62(-1.66) (1.54)
Swap spread 0.83 0.39(1.89) (0.89)
Swap spread * RV 0.91 0.39(3.04) (0.80)
Refcorp spread 0.44 0.33(1.86) (1.52)
Refcorp spread * RV 0.34 -0.06(4.15) (-0.35)
Spline error 5.57 3.43(1.43) (1.13)
Spline error * RV 1.83 0.49(1.13) (0.32)
On-the-run spread 1.86 1.33(3.43) (2.43)
On-the-run spread * RV 0.78 0.79(2.41) (1.36)
TED spread 0.30 0.30(2.61) (2.17)
TED spread * RV 0.02 -0.11(0.73) (-1.55)
Adj R2 0.01 0.00 0.15 0.05 0.06 0.16 0.09 0.23
Obs. 312 309 312 312 297 312 312 297
Source: Authors’ calculations, based on data from Bloomberg, BrokerTec, the Board of Governors ofthe Federal Reserve System, the Federal Reserve Banks of New York and St Louis, GovPX, and Haver.Notes: This table reports time series regressions of the market liquidity index onto various fundingliquidity measures interacted with realized volatility (RV) the inverse maturity-weighted average realizedvolatility across the 2-, 5-, and 10-year notes. The reported regressions are in monthly changes. Newey-West t-statistics are in parentheses, with lag length T 1/3, where T is the indicated sample size. Boldcoefficients denote significance at the 5% level.
31
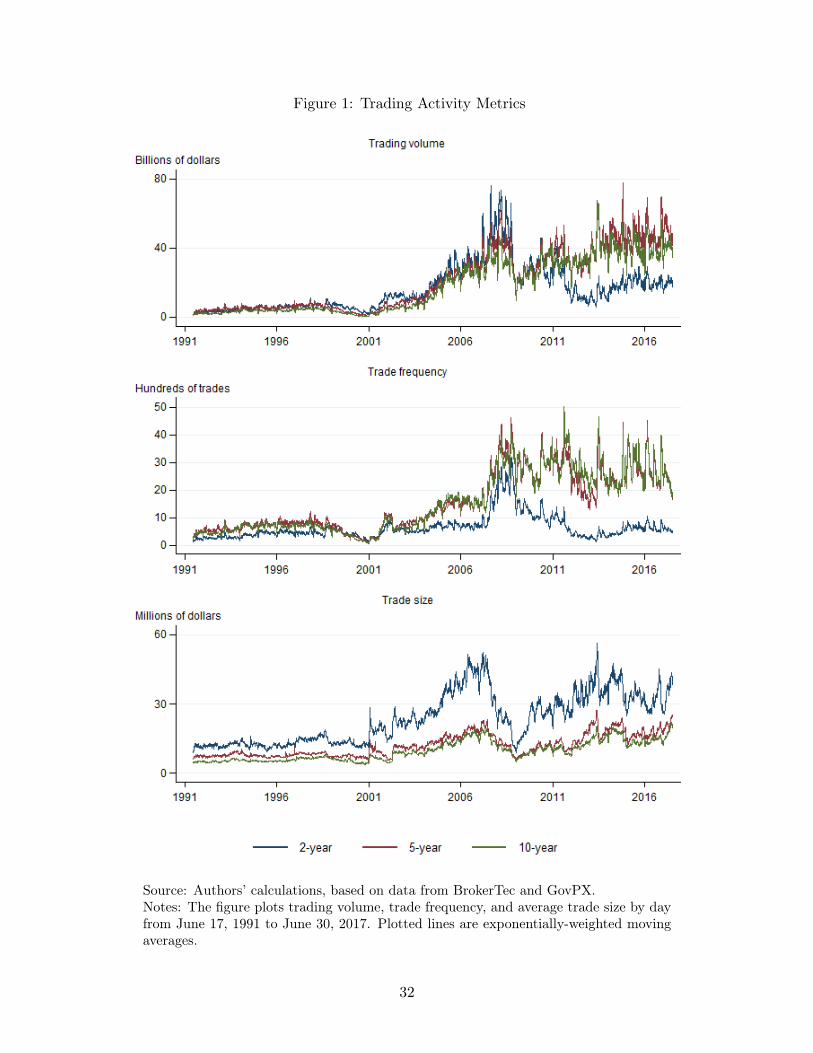
Figure 1: Trading Activity Metrics
Source: Authors’ calculations, based on data from BrokerTec and GovPX.Notes: The figure plots trading volume, trade frequency, and average trade size by dayfrom June 17, 1991 to June 30, 2017. Plotted lines are exponentially-weighted movingaverages.
32
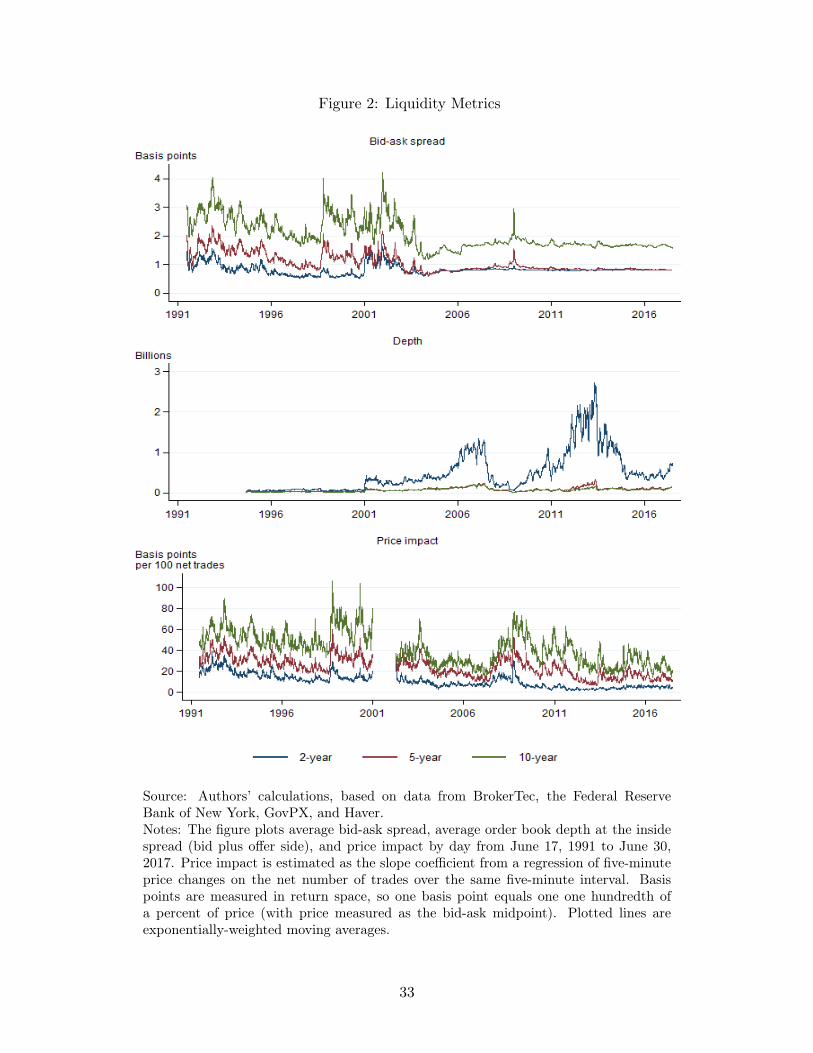
Figure 2: Liquidity Metrics
Source: Authors’ calculations, based on data from BrokerTec, the Federal ReserveBank of New York, GovPX, and Haver.Notes: The figure plots average bid-ask spread, average order book depth at the insidespread (bid plus offer side), and price impact by day from June 17, 1991 to June 30,2017. Price impact is estimated as the slope coefficient from a regression of five-minuteprice changes on the net number of trades over the same five-minute interval. Basispoints are measured in return space, so one basis point equals one one hundredth ofa percent of price (with price measured as the bid-ask midpoint). Plotted lines areexponentially-weighted moving averages.
33
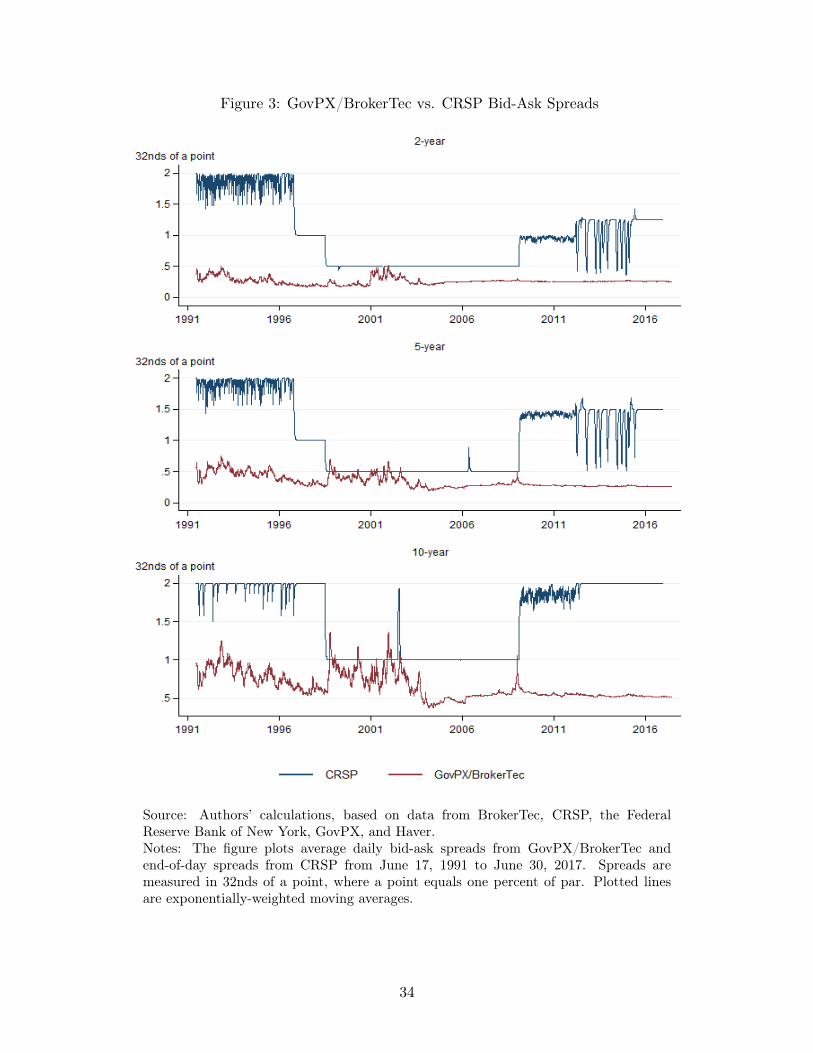
Figure 3: GovPX/BrokerTec vs. CRSP Bid-Ask Spreads
Source: Authors’ calculations, based on data from BrokerTec, CRSP, the FederalReserve Bank of New York, GovPX, and Haver.Notes: The figure plots average daily bid-ask spreads from GovPX/BrokerTec andend-of-day spreads from CRSP from June 17, 1991 to June 30, 2017. Spreads aremeasured in 32nds of a point, where a point equals one percent of par. Plotted linesare exponentially-weighted moving averages.
34
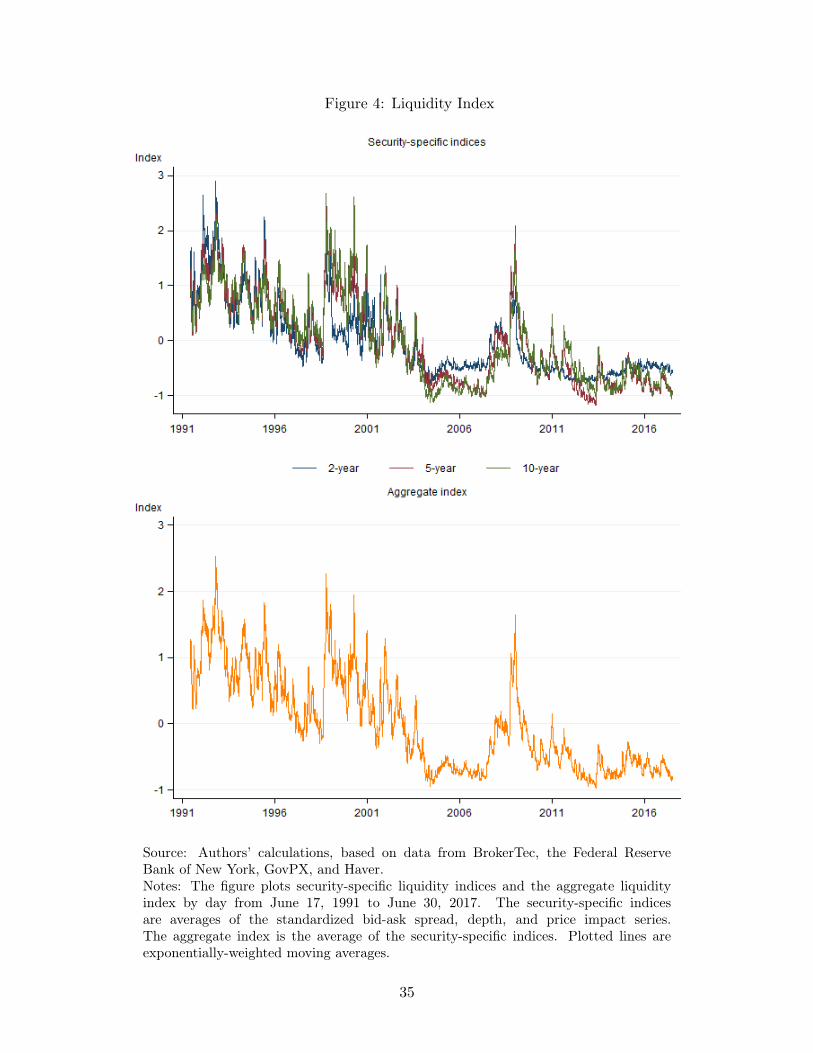
Figure 4: Liquidity Index
Source: Authors’ calculations, based on data from BrokerTec, the Federal ReserveBank of New York, GovPX, and Haver.Notes: The figure plots security-specific liquidity indices and the aggregate liquidityindex by day from June 17, 1991 to June 30, 2017. The security-specific indicesare averages of the standardized bid-ask spread, depth, and price impact series.The aggregate index is the average of the security-specific indices. Plotted lines areexponentially-weighted moving averages.
35
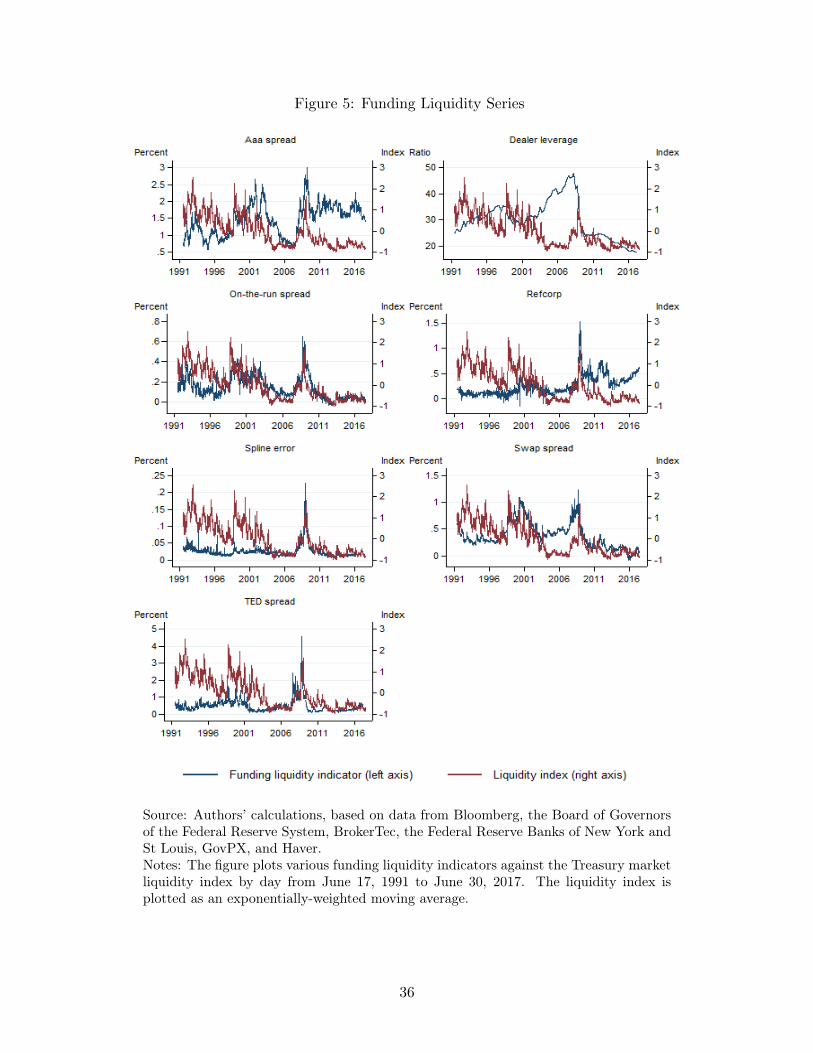
Figure 5: Funding Liquidity Series
Source: Authors’ calculations, based on data from Bloomberg, the Board of Governorsof the Federal Reserve System, BrokerTec, the Federal Reserve Banks of New York andSt Louis, GovPX, and Haver.Notes: The figure plots various funding liquidity indicators against the Treasury marketliquidity index by day from June 17, 1991 to June 30, 2017. The liquidity index isplotted as an exponentially-weighted moving average.
36
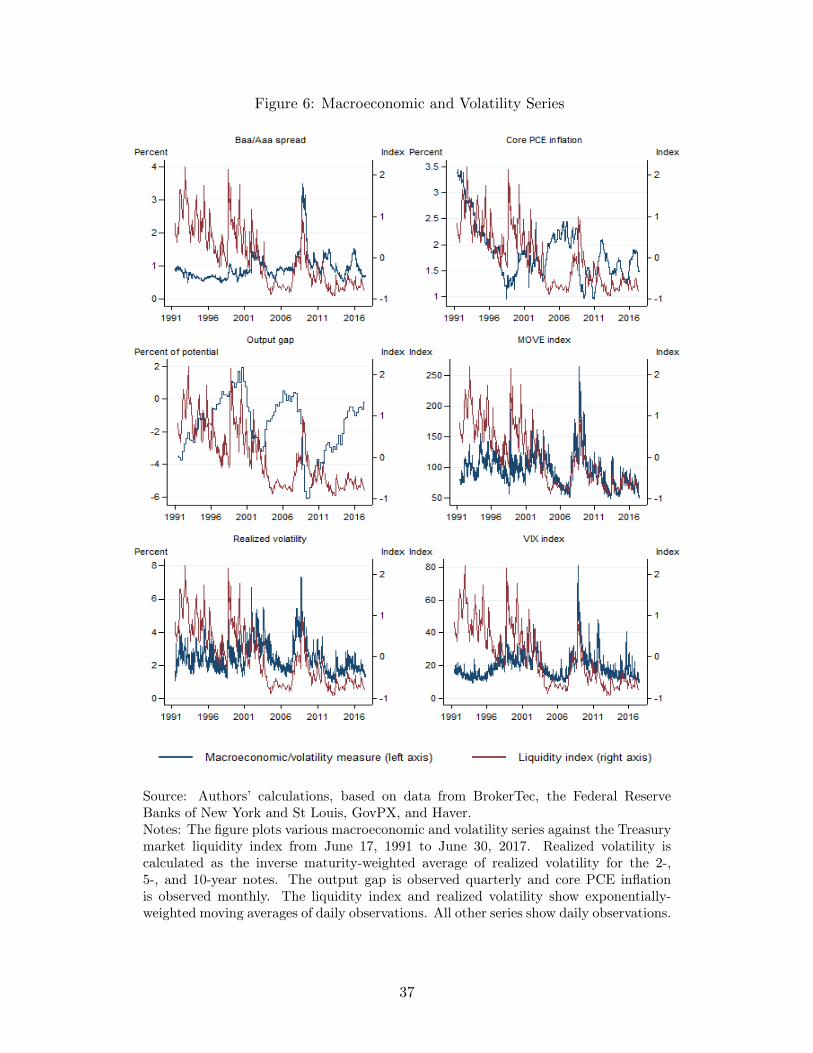
Figure 6: Macroeconomic and Volatility Series
Source: Authors’ calculations, based on data from BrokerTec, the Federal ReserveBanks of New York and St Louis, GovPX, and Haver.Notes: The figure plots various macroeconomic and volatility series against the Treasurymarket liquidity index from June 17, 1991 to June 30, 2017. Realized volatility iscalculated as the inverse maturity-weighted average of realized volatility for the 2-,5-, and 10-year notes. The output gap is observed quarterly and core PCE inflationis observed monthly. The liquidity index and realized volatility show exponentially-weighted moving averages of daily observations. All other series show daily observations.
37