Embed Size (px)
Citation preview

Title_Slide
Quality Controlling Wind Power Data forData Mining Applications
Gerry WienerResearch Applications Laboratory
Software Engineering Assembly, NCAR April 13, 2015
Photograph by Carlye Calvin, UCAR

Required Forecasts
Overview
• Overall goal• System• Data setting• Challenges in quality control• Interpercentile range filtering• Conversion of wind to power

Required Forecasts
Overall Goal
• Xcel Energy came to NCAR in 2009 looking for better power forecasts (not wind forecasts!)
• 57 wind farms in Colorado, Minnesota, New Mexico and Texas
• 3096 turbines• 4.25 gigawatts
• 5 kw -> 1 home• 1 mw -> 200 homes• 4.25 gw -> 850000 homes

Northern States Power

Required ForecastsPublic Service Company of Colorado

Required ForecastsSouthwestern Public Service
Required Forecasts
Overall Goal (cont.)
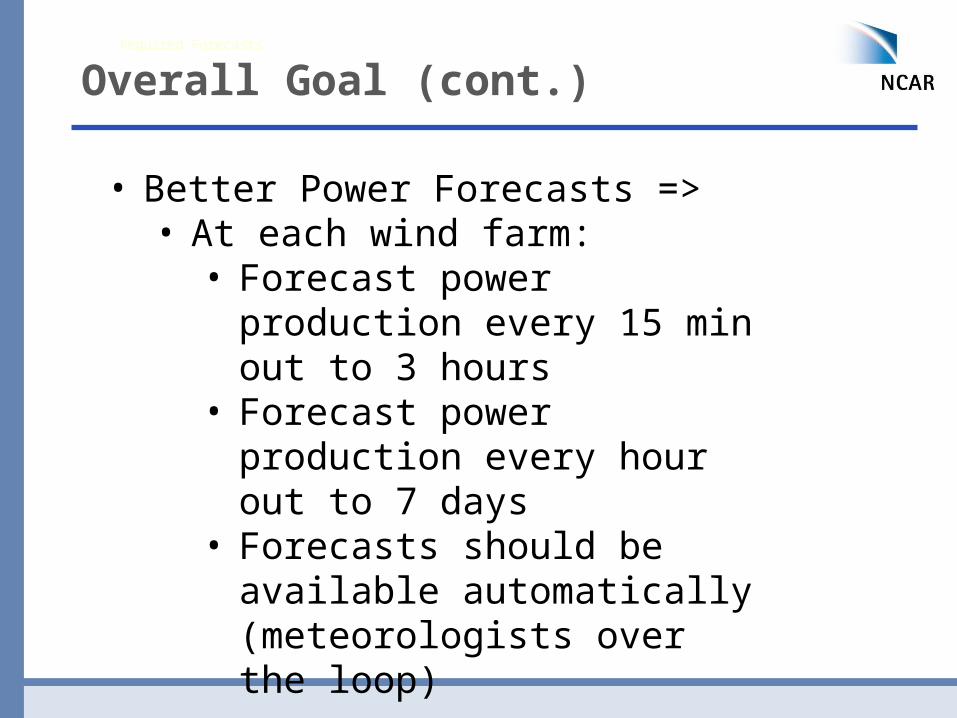
• Better Power Forecasts =>• At each wind farm:
• Forecast power production every 15 min out to 3 hours
• Forecast power production every hour out to 7 days
• Forecasts should be available automatically (meteorologists over the loop)

Forecast Types•1-3 hour forecasts - anticipate upcoming “ramp” adjustments•24 hour forecasts (energy trading & planning) •3-5 day forecasts (long term trading & planning)•7 day forecasts (account for weekends & holidays)
Required Forecasts
Overall Goal (cont.)

Required Forecasts
System
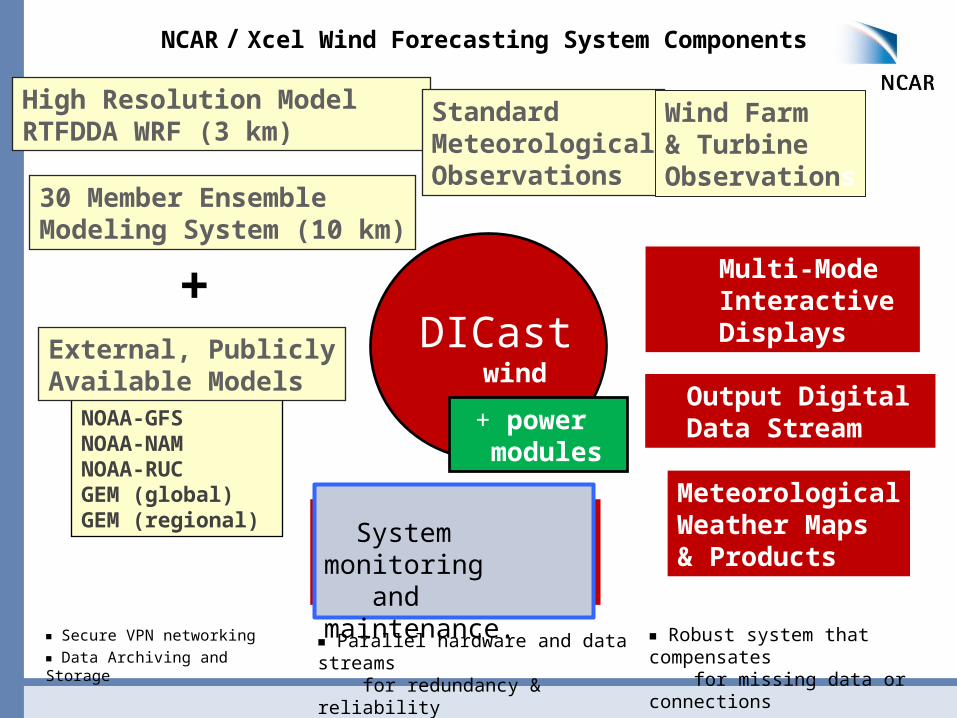
• Data ingest modules• Numerical model(s)• Model postprocessing• Power conversion • Output formatting• Displays• Monitoring• Implementation:
• Largely Fortran/C++/Python

NCAR / Xcel Wind Forecasting System Components
■ Secure VPN networking
■ Data Archiving and Storage
DICast wind
High Resolution Model RTFDDA WRF (3 km)
30 Member EnsembleModeling System (3 km)
External, PublicallyAvailable Models
StandardMeteorologicalObservations
Wind Farm & Turbine Observations
Multi-Mode Interactive Displays
Direct Digital Data Stream
MeteorologicalWeather Maps& Products
System Monitoringand MaintenanceCapabilities
+ power modules
■ Parallel hardware and data streams for redundancy & reliability
Customized NCAR model, optimized for wind energy forecasting applications.
Meteorological + power observations for model initialization, data mining and system optimization.
Customized output for both human users and for automatic processing.
WIND POWER FORECASTS
System monitoring and maintenance.
Publicly available output from external models.
■ Robust system that compensates for missing data or connections
+

NCAR / Xcel Wind Forecasting System Components
■ Secure VPN networking
■ Data Archiving and Storage
DICast wind
High Resolution Model RTFDDA WRF (3 km)
External, PubliclyAvailable Models
NOAA-GFSNOAA-NAMGEMECMWFHRRR
StandardMeteorologicalObservations
Wind Farm & Turbine Observations
Multi-Mode Interactive Displays
Direct Digital Data Stream
MeteorologicalWeather Maps& Products
System Monitoringand MaintenanceCapabilities
+ power modules
■ Parallel hardware and data streams for redundancy & reliability
Meteorological + power observations for model initialization, data mining and system optimization.
Customized output for both human users and for automatic processing.
WIND POWER FORECASTS
System monitoring and maintenance.
■ Robust system that compensates for missing data or connections
+

NCAR / Xcel Wind Forecasting System Components
■ Secure VPN networking
■ Data Archiving and Storage
DICast wind
High Resolution Model RTFDDA WRF (3 km)
30 Member EnsembleModeling System (10 km)
External, PublicallyAvailable Models
StandardMeteorologicalObservations
Wind Farm & Turbine Observations
Multi-Mode Interactive Displays
Direct Digital Data Stream
MeteorologicalWeather Maps& Products
System Monitoringand MaintenanceCapabilities
+ power modules
■ Parallel hardware and data streams for redundancy & reliability
Customized NCAR models, optimized for wind energy forecasting applications.
Meteorological observations for model initialization, data mining and system optimization.
Customized output for both human users and for automatic processing.
WIND POWER FORECASTS
System monitoring and maintenance.
Publically available output from external models.
■ Robust system that compensates for missing data or connections
+
DICast®
Dynamic Integrated Forecast System
A consensus point forecast system that integrates available meteorological data, including wind farm and turbine observations as well as numerical model output (from multiple models) using the DMOS linear regression-based statistical method. DMOS: Dynamic Model Output Statistics DICast® is a multi-faceted, robust, self-monitoring system “learns” as statistical weights from past performance are updated daily.
For this system, DICast® generates wind forecasts for every wind turbine in the Xcel domain (currently 3096 turbines distributed across 57 separate wind farms).
Fifteen minute forecasts are generated for the first three hours into the future, with hourly forecasts extending out to seven days, and updated every 15 minutes.

NCAR / Xcel Wind Forecasting System Components
■ Secure VPN networking
■ Data Archiving and Storage
DICast wind
High Resolution Model RTFDDA WRF (3 km)
30 Member EnsembleModeling System (10 km)
NOAA-GFSNOAA-NAMNOAA-RUCGEM (global)GEM (regional)
StandardMeteorologicalObservations
Wind Farm & Turbine Observations
Multi-Mode Interactive Displays
Direct Digital Data Stream
MeteorologicalWeather Maps& Products
System Monitoringand MaintenanceCapabilities
+ power modules
■ Parallel hardware and data streams for redundancy & reliability
Customized output for both human users and for automatic processing.
WIND POWER FORECASTS
System monitoring and maintenance.
■ Robust system that compensates for missing data or connections
+External, PubliclyAvailable Models
NCAR / Xcel Wind Forecasting System Components
■ Secure VPN networking
■ Data Archiving and Storage
DICast wind
High Resolution Model RTFDDA WRF (3 km)
30 Member EnsembleModeling System (10 km)
NOAA-GFSNOAA-NAMNOAA-RUCGEM (global)GEM (regional)
StandardMeteorologicalObservations
Wind Farm & Turbine Observations
Multi-Mode Interactive Displays
Output Digital Data Stream
MeteorologicalWeather Maps& Products
System Monitoringand MaintenanceCapabilities
+ power modules
■ Parallel hardware and data streams for redundancy & reliability
System monitoring and maintenance.
■ Robust system that compensates for missing data or connections
+External, PubliclyAvailable Models

NCAR / Xcel Wind Forecasting System Components
■ Secure VPN networking
■ Data Archiving and Storage
DICast wind
High Resolution Model RTFDDA WRF (3 km)
30 Member EnsembleModeling System (10 km)
NOAA-GFSNOAA-NAMNOAA-RUCGEM (global)GEM (regional)
StandardMeteorologicalObservations
Wind Farm & Turbine Observations
Multi-Mode Interactive Displays
Direct Digital Data Stream
MeteorologicalWeather Maps& Products
System Monitoringand MaintenanceCapabilities
+ power modules
■ Parallel hardware and data streams for redundancy & reliability
System monitoring and maintenance.
■ Robust system that compensates for missing data or connections
+External, PublicallyAvailable Models
AdjustableTimescale

NCAR / Xcel Wind Forecasting System Components
■ Secure VPN networking
■ Data Archiving and Storage
DICast wind
High Resolution Model RTFDDA WRF (3 km)
30 Member EnsembleModeling System (10 km)
NOAA-GFSNOAA-NAMNOAA-RUCGEM (global)GEM (regional)
StandardMeteorologicalObservations
Wind Farm & Turbine Observations
Multi-Mode Interactive Displays
Direct Digital Data Stream
MeteorologicalWeather Maps& Products
System Monitoringand MaintenanceCapabilities
+ power modules
■ Parallel hardware and data streams for redundancy & reliability
System monitoring and maintenance.
■ Robust system that compensates for missing data or connections
+External, PublicallyAvailable Models

Required Forecasts
Data Setting
Most Farms Provide:• Nacelle Anemometer Wind Speed• Turbine Power• Connection Node Power
Data Format:• Ascii• Site, Time, Data Value

Required Forecasts
Data Setting
Data Issues•Data for any given farm/connection node can go out at any time for irregular stretches of time•Data can be late•Data can be incorrect
• Stuck values• PI system issue
• Time zone and time stamp format problems
• Handle these using ad hoc QC techniques

Required Forecasts
Challenges in Quality Control

Required ForecastsIdealized Power Curves
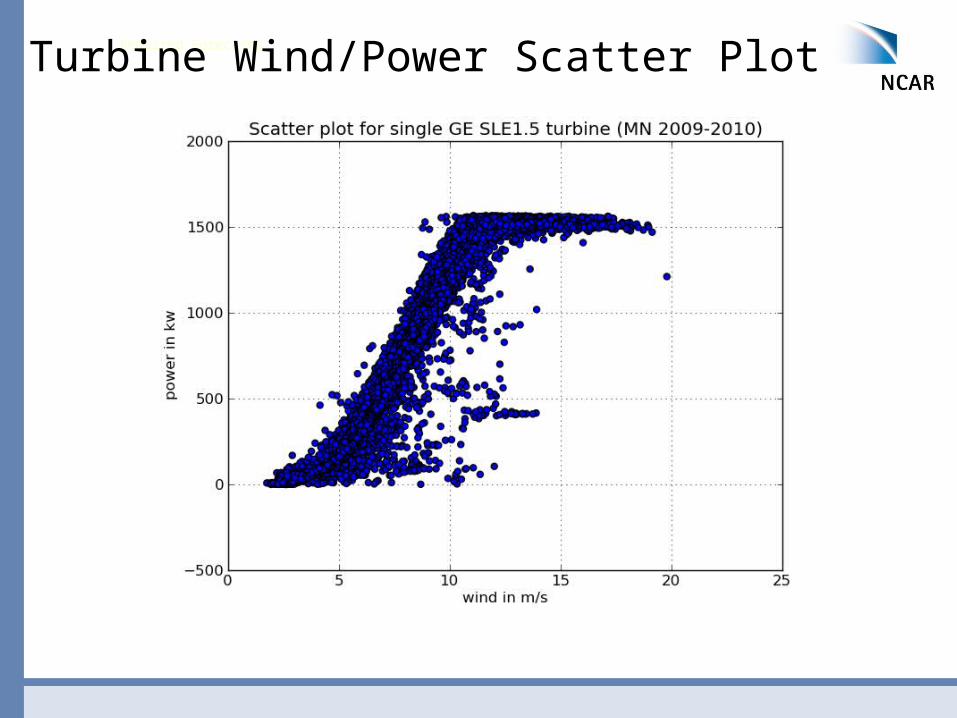
Required ForecastsTurbine Wind/Power Scatter Plot

Required ForecastsConnection Node Wind/Power Scatter Plot

Required Forecasts
Challenges in Quality Control
• Statistical modeling of the relationship of wind to potential power should exclude outlier power observations for given wind speeds Turbines produce reduced power when
curtailed (transmission issue) Turbines produce reduced power when
subject to icing (weather/turbine issue) Turbines produce reduced power after a high
wind speed cutout events (weather/turbine issue)

Required Forecasts
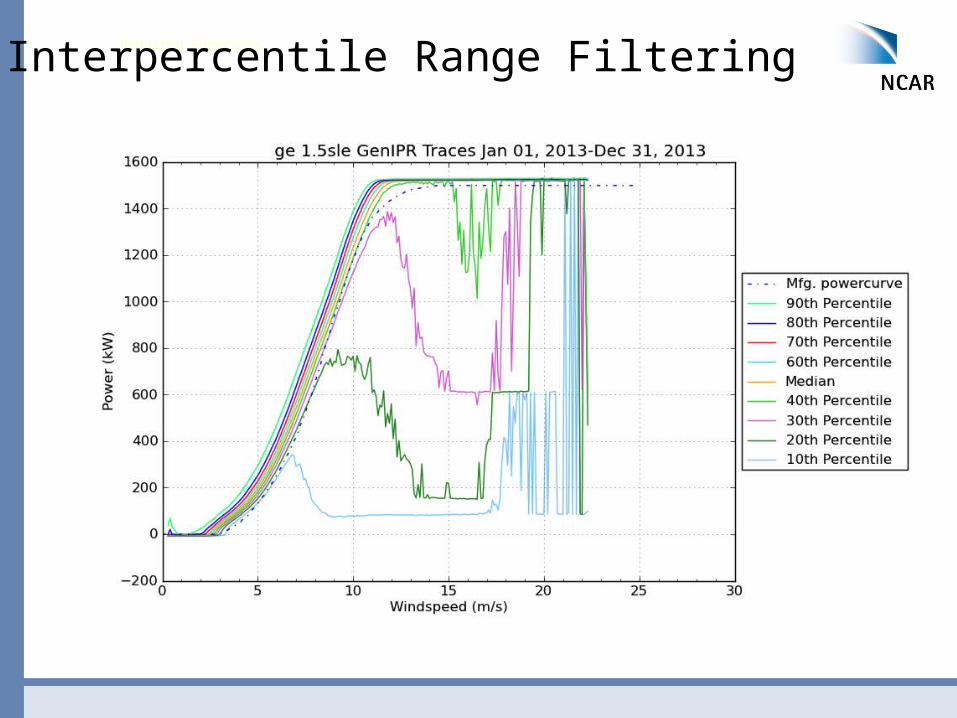
Interpercentile Range Filtering
Procedure:•Collect ~1 year of wind power observations at a given wind farm
• Observations are from all turbines of the same type (some farms have multiple turbine types)
•Divide the wind speed range into 0.1 m/s bins• 0-0.1• 0.1-0.2• …• 24.9-25

Required Forecasts
Interpercentile Range Filtering
Procedure:
•Place power values from wind, power pairs in appropriate m/s wind bins•Sort power values in each wind bin•Remove power values outside interpercentile range
• Options:• Interquartile range 25% - 75%• 15% - 95%
•Use remaining data set for data mining

Required Forecasts
Filtering adjustments
• Incorporate curtailment filtering• Curtailment information may be available• Perform filtering prior to interpercentile range filtering
• Power curve filtering• Shift the power curve sideways and up/down• This “blackens out a region”• Remove power values outside the region• Can be done prior to interpercentile range filtering

Required ForecastsInterpercentile Range Filtering

Required ForecastsInterpercentile Range Filtering
Required ForecastsInterpercentile Range Filtering

-200-100
0100200300400500600700800900
10001100120013001400150016001700
0 2 4 6 8 10 12 14 16 18 20
m/s
kW
Actual Manufacturer Power Curve
-200-100
0100200300400500600700800900
10001100120013001400150016001700
0 2 4 6 8 10 12 14 16 18 20
m/s
kW
Actual Manufacturer Power Curve
-200-100
0100200300400500600700800900
10001100120013001400150016001700
0 2 4 6 8 10 12 14 16 18 20
m/s
kW
Actual Manufacturer Power Curve-200-100
0100200300400500600700800900
10001100120013001400150016001700
0 2 4 6 8 10 12 14 16 18 20
m/s
kW
Actual Manufacturer Power Curve
Empirical Power Curve Optimization by Data Mining: An example of empirical power curves for turbines of the same model & manufacturer at different wind farms

Required Forecasts
Conversion of Wind to Power
• Predict power production for individual turbine types using per-farm data mining models
• Roll up power for turbines at farm• Predictors:
• Wind speed• Temperature• Atmospheric pressure
• Target:• Filtered turbine power

Required Forecasts
Data Mining Techniques
• Regression Tree • Cubist• Random Forest• Gradient Boosted Trees
• Errors:• 20-40 kw for a 1500 kw turbine• Can be reduced by
approximately 50% if previous power is used in data mining

Required Forecasts
Thank You!


![Visual Basic for Applications - schilk.at (Schilk).pdf · Visual Basic for Applications als Einstieg in das Programmieren [ARGE AINF HTL NÖ] LV-Nummer 351F4WWJ01 HTBLuVA Wiener Neustadt](https://img.pdfslide.us/doc/110x75/5a9dd6d17f8b9abd0a8dd16c/visual-basic-for-applications-schilkpdfvisual-basic-for-applications-als-einstieg.jpg)