Embed Size (px)
Citation preview
MEMORANDUM December 5, 2008 TO: School Board Members FROM: Abelardo Saavedra
Superintendent of Schools SUBJECT: TITLE V, PART A INNOVATIVE PROGRAMS EVALUATION CONTACT: Carla Stevens, 713-556-6700 Attached is the 2007–2008 Title V, Part A evaluation report. The report assessed the implementation of Innovative Programs in the Houston Independent School District (HISD) and their overall impact on student achievement. The 2007–2008 school year represents the final year that Title V, Part A funding was made available because its funding expired, and it was not reauthorized. Some of this year’s key findings are as follows: • Innovative Programs implemented during the 2007–2008 school year include Advancement
Via Individual Determination (AVID), Broad Candidates, Private School Share, and University Interscholastic League (UIL).
• A total of 1,516 students (856 high and 660 middle school) and approximately 73 college tutors participated in the AVID program.
• The Broad Resident, who began her first year of service in the Business Operations Department and the Strategic Partnerships Department, served her second year as a special assignment administrator in the office of the Chief Academic Officer.
• Forty-one private schools (Catholic, Jewish, Orthodox, and Protestant) received Innovative Programs funds to help provide educational resources for 11,598 students.
• A total of 32 HISD high schools, 26 middle schools, and 34 elementary schools participated in the UIL in 2007–2008 compared to just 28 high schools in 2006–2007. There were 3,747 students across the district competing in zone, district, area, regional, and state-level UIL contests.
• Districtwide middle and high school TAKS performance results for spring 2007 and spring 2008 revealed that AVID student performance on each TAKS subtest was generally better than average performance of all non-AVID students at the same campus.
• AVID student participation and performance on AP examinations increased since the 2006–2007 school year. A total of 74 AVID program participants took 105 AP examinations in 2007–2008 compared to nine participants taking 10 examinations in the previous year. Nineteen AVID students received a score of three or higher on 20 examinations. This is significantly higher than the 2006–2007 school year in which one student received a three or higher on one examination.
Should you have any further questions, please contact my office or Carla Stevens in Research and Accountability at 713-556-6700.
AS Attachment c: Superintendent’s Direct Reports Noelia Garza
Regional Superintendents Pamela Evans Executive Principals Lawanda Coffee
RESEARCH
Title V, Part A Innovative Programs 2007–2008
Department of Research and Accountability Houston Independent School District
E d u c a t i o n a l P r o g r a m R e p o r t
2008 Board of Education
Harvin C. Moore PRESIDENT Paula M. Harris FIRST VICE PRESIDENT Natasha M. Kamrani SECOND VICE PRESIDENT Carol Mims Galloway SECRETARY Lawrence Marshall ASSISTANT SECRETARY Diana Dávila Dianne Johnson Greg Meyers Manuel Rodríguez Jr. Abelardo Saavedra, Ph.D. SUPERINTENDENT OF SCHOOLS Carla Stevens ASSISTANT SUPERINTENDENT DEPARTMENT OF RESEARCH AND ACCOUNTABILITY Ronald McCowan RESEARCH SPECIALIST Harry Selig RESEARCH MANAGER
Houston Independent School District Hattie Mae White Educational Support Center 4400 West 18th Street Houston, Texas 77092-8501 Website: www.houstonisd.org It is the policy of the Houston Independent School District not to discriminate on the basis of age, color, handicap or disability, ancestry, naitonal origin, marital status, race, religion, sex, veteran status, or political affiliation in its educational or employment programs and activities.
EXECUTIVE SUMMARY
TITLE V, PART A INNOVATIVE PROGRAMS 2007–2008
Program Description The purpose of the Title V, Part A Innovative Programs is to fund the implementation of promising educational reform and school improvement programs based on scientifically-based research. The No Child Left Behind (NCLB) Act of 2001 Public Law 107–110 reauthorized Title VI of the Elementary and Secondary Education Act of 1965 (ESEA) as Title V, Part A – State Grants for Innovative Programs. Specific purposes for Title V, Part A Innovative Programs are to: • support local education reform efforts that are consistent with and support statewide education reform
efforts; • implement promising educational reform programs and school improvement programs based on
scientifically-based research; • provide a continuing source of innovation and educational improvement, including support for
programs to provide library services and instructional and media materials; • meet the educational needs of all students, including at-risk youth; and • develop and implement education programs to improve school, student, and teacher performance,
including professional development activities and class size reduction programs (Texas Education Agency, 2006; U.S. Department of Education, 2002).
Title V, Part A Innovative Programs provide a state-administered grant based on student enrollment designed to improve the quality of educational programs for all students and to increase academic achievement. In the Houston Independent School District (HISD), the 2007–2008 Innovative Programs funding was centralized to improve academic achievement through four innovative programs based on comprehensive needs assessments of the district's student population. Statutory requirements mandate that Title V, Part A programs are tied to promoting challenging academic achievement standards; are used to improve student academic achievement; and are a part of an overall education reform strategy (Texas Education Agency, 2006; U.S. Department of Education, 2002). In 2002, the U.S. Department of Education (ED) categorized the twenty-seven approved Title V, Part A Innovative Programs areas listed in Section 5131 of the NCLB legislation to include the following eight program types for the purpose of planning, implementing, and evaluating Innovative Programs: • Educational Reform and School Improvement: • Teacher Quality, Professional Development, and Class Size Reduction (in accordance with Title II of
the ESEA); • Parental Options; • Technology and Educational Materials; • Students with Special Needs; • Literacy, Early Childhood Education, and Adult Education; • Community Service/Community Involvement; and • Health Services. Each of the four Innovative Programs was required to provide services consistent with at least one of the eight program categories set forth by ED, satisfy the statutory requirements, and target programs toward increasing student achievement.
HISD RESEARCH AND ACCOUNTABILITY
Key Findings 1. How were the Title V, Part A Innovative Programs implemented districtwide? • The decline from six programs in 2006–2007 to four programs in 2007–2008 resulted in a budget
reduction of 20.1 percent since last year.
• Innovative Programs implemented during the 2007–2008 school year include Advancement Via Individual Determination (AVID), Broad Candidates, Private School Share, and University Interscholastic League (UIL). Two programs, Lexile Framework for Reading and Translation/ Interpreter Services, which were funded under Title V, Part A last year were not funded this year.
• Based on the Title V, Part A Administrator Survey, two of the program administrators (AVID and
Private School Share) reported adherence to all required 2007–2008 NCLB guidelines, Title V, Part A statutory purposes and requirements, and the Texas Education Agency (TEA) Initial Compliance Review (ICR) report requirement. One program administrator reported adherence to nine of the eleven requirements. The program administrator for one program (Broad Candidates) did not provide responses to the survey, and it is unknown if the program met each criterion.
• Of the eight approved program categories, district programs encompassed two types of services
including educational reform/school improvement and educational materials.
AVID • The Advancement Via Individual Determination (AVID) program was developed to increase the
number of secondary students that participated in rigorous academic courses, including Advanced Placement (AP) and Pre-AP. The program also provided opportunities for middle and high school students to receive tutoring, investigate colleges, take college tours, participate in regularly scheduled workshops with guest speakers, and work with community service projects.
• A total of 1,516 students (856 high and 660 middle school) and approximately 73 college tutors
participated in the AVID program. The program specifically targeted at-risk students for more rigorous coursework who (1) were economically disadvantaged, (2) were underrepresented in four-year colleges, (3) possessed the potential to become first-generation college students, and (4) were currently enrolled in regular (non-Gifted and Talented, non-Special Education) classes.
• AVID students took at least one Pre-AP or AP course and the AVID Elective the first year in the program. Participating students will increase the number of Pre-AP or AP courses taken during each subsequent year to increase their academic growth.
Broad Candidates • The Broad Candidates program is a two-year management-training program for executives seeking to
become leaders in education reform. The program placed one graduate from a top business school, which had at least four years of work experience in the private and nonprofit sectors, in a managerial position in the central operations of HISD.
• The Broad Resident, who began her first year of service in the Business Operations Department and the Strategic Partnerships Department, served her second year as a special assignment administrator in the office of the Chief Academic Officer.
2
TITLE V, PART A INNOVATIVE PROGRAMS, 2007–2008
• The Broad Resident was to attend eight professional development sessions and receive training in the following critical areas: Context of Urban Education, System-wide Levers for Change, Change Management, and Leadership Skill Development.
• Documentation of official duties carried out by the Broad Resident and verification of attendance of
training activities were not submitted by program administrators on behalf of this innovative program. Private School Share • The Private School Share program provided TEA-approved, non-secular, neutral, and non-ideological
educational facilities throughout HISD boundaries with supplemental funds for instructional materials, technology/equipment, and teacher training.
• Forty-one private schools (Catholic, Jewish, Orthodox, and Protestant) received Innovative Programs
funds to help provide educational resources for 11,598 students. This represented an equal number of schools and students compared to the previous year. All program expenditures were utilized for the purchase of library services and materials.
• Campus-level descriptions of targeted subject areas, standardized tests, and student populations were
submitted to the Department of External Funding. UIL Project • The University Interscholastic League (UIL) Project was designed to promote education reform and
school improvement through enabling HISD elementary, middle, and high schools to engage students in at least one of 27 UIL competitions.
• A total of 32 HISD high schools, 26 middle schools, and 34 elementary schools participated in the UIL in 2007–2008 compared to just 28 high schools in 2006–2007. There were 3,747 students across the district competing in zone, district, area, regional, and state-level UIL contests.
2. What impact did the Title V, Part A Innovative Programs have on student academic achievement? • Due to the limited scope of Innovative Programs activities, districtwide change in student
achievement on standardized assessments can only minimally be attributed to these programs. Obviously, many variables affect teaching and learning outcomes, making it necessary for the research-based programs that are implemented through this grant to be designed and evaluated conscientiously, utilizing proven strategies to design and measure program effects.
• Districtwide English and Spanish TAKS passing rates for spring 2007 and 2008 demonstrate
achievement gains across most subjects and all tests taken for both the English and Spanish test versions.
• Results for TAKS performance gaps between economically disadvantaged students and all students
were mixed. Stanford 10 and Aprenda NCE grade level gains were not found consistently across grade levels and subject areas; however, Stanford 10 reductions in performance gaps for economically disadvantaged students and all students were evident.
• For the 2007–2008 school year, 7,835 HISD students in grades 8–12 were enrolled in AP courses and
34,778 students in grades 6–12 were enrolled in Pre-AP courses. Of the 7,835 students enrolled in AP courses, a total of 5,518 HISD students took 10,241 AP examinations during 2008. HISD students scored a 3 or higher on 4,517 (44.1 percent) of these exams. This represents an increase in the total
3
HISD RESEARCH AND ACCOUNTABILITY
number of exams receiving a score of at least 3, but the overall percentage of exams scored at this level decreased by 3.4 percentage points.
AVID • Districtwide middle and high school TAKS performance results for spring 2007 and spring 2008
revealed that AVID student performance on each TAKS subtest was generally better than average performance of all non-AVID students at the same campus.
• AVID student participation and performance on AP examinations increased since the 2006–2007
school year. A total of 74 AVID program participants took 105 AP examinations in 2007–2008 compared to nine participants taking 10 examinations in the previous year. Nineteen AVID students received a score of three or higher on 20 examinations. This is significantly higher than the 2006–2007 school year in which one student received a three or higher on one examination.
Broad Candidates • Documentation of the roles and responsibilities played by the Resident was limited, and
documentation of improvements within HISD realized on behalf of the Broad Resident was not provided. Therefore, the impact of this program on student academic achievement cannot be determined for 2007–2008.
Private School Share • Campus-level administrators reported subjects targeted for academic improvement to the HISD
Department of External Funding; however, documentation on targeted subjects was not provided on behalf of this report. Campus-level achievement data were not available for this report. Therefore, the direct impact of this program on student achievement cannot be determined for the current school year.
UIL Project • Although increased student participation in UIL contests likely had a positive overall impact on the
educational attainment of participants; no measure of the program’s direct impact on student achievement was conducted for 2007–2008.
Recommendations
1. To ensure compliance with statutory requirements, Innovative Programs must employ record keeping
systems that accurately track student participation in program activities. Three programs worked directly with students; however, student level documentation of program participation and performance was only provided for one program (AVID). Innovative Programs implemented by HISD need to ensure that adequate documentation is available so that a link between program expenditures and student achievement may be established.
2. District administrators must become fully aware of the legislative purposes, requirements, and criteria
for funding and implementing Title V, Part A Innovative Programs. During the current year, one program (Broad) did not provide documentation of program activities or compliance with statutory requirements and purposes. HISD should develop and require mandatory attendance of compliance training of all Innovative Programs administrators prior to the awarding of any federal and state funds.
4
Title V, Part A Innovative Programs 2007–2008
Introduction Program Description Title V, Part A Innovative Programs provide a state-administered grant based on student enrollment designed to improve the quality of educational programs for all students and to increase academic achievement. The purpose of the Title V, Part A Innovative Programs grant is to implement promising educational reform and school improvement programs based on scientifically-based research. In HISD, the 2007–2008 Innovative Programs funding was centralized to improve academic achievement through four innovative programs based on comprehensive needs assessments of the district's student population. Title V, Part A Innovative Programs must: • be tied to promoting challenging academic achievement standards; • be used to improve student academic achievement; and • be a part of an overall education reform strategy (Texas Education Agency, 2006; U.S. Department of
Education, 2002). Program History The No Child Left Behind (NCLB) Act of 2001 Public Law 107–110 reauthorized Title VI of the Elementary and Secondary Education Act of 1965 (ESEA) as Title V, Part A - State Grants for Innovative Programs. The grant allows school districts to design, fund, and implement Title V, Part A Innovative Programs within twenty-seven identified program areas, pursuant to the statutory requirements listed in Section 5131 of the NCLB Act. In 2002, the United States Department of Education (ED) categorized twenty-seven approved Title V, Part A Innovative Programs areas under the following eight program types for the purpose of planning, implementing, and evaluating programs: • Educational Reform and School Improvement; • Teacher Quality, Professional Development, and Class Size Reduction (in accordance with Title II of
ESEA); • Parental Options; • Technology and Educational Materials; • Students with Special Needs; • Literacy, Early Childhood Education, and Adult Education; • Community Service/Community Involvement; and • Health Services. Program Rationale, Goals, and Objectives Fundamentally, Title V, Part A Innovative Programs provide a state-administered grant based on student enrollment designed to improve the quality of educational programs for all students and to increase academic achievement. Each of the four Innovative Programs that operated in the district were required to provide services consistent with at least one of the eight program categories set forth by ED, satisfy the statutory requirements, meet NCLB provisions and assurances, and fulfill Texas Education Agency (TEA) compliance requirements (TEA, 2006; Department of Education, 2002): Title V, Part A Innovative Programs Statutory Requirements • Tied to promoting challenging academic achievement standards. • Used to improve student academic achievement standards.
HISD RESEARCH AND ACCOUNTABILITY
• Part of an overall education reform strategy.
Title V, Part A Innovative Programs Statutory Purposes • Support local education reform efforts that are consistent with and support statewide education reform
efforts. • Provide funding to enable state educational agencies and local educational agencies to implement
promising educational reform through programs based on scientifically-based research. • Provide a continuing source of innovation and educational improvement, including support programs
to provide library services and instructional and media materials. • Meet the educational needs of all students, including at-risk youth. • Develop and implement education programs to improve school, student, and teacher performance,
including professional development activities and class-size reduction programs.
Title V, Part A Innovative Programs NCLB Provisions and Assurances • Program provides for systematic consultation with parents of children attending public and private
nonprofit schools in the area served by the Local Education Agency (LEA), with teachers and administrative personnel in such schools, and with other groups involved in the implementation of Title V, Part A Innovative Programs, such as librarians, school counselors, and other pupil services personnel.
• Program conducted the required needs assessment relative to the purposes of Title V, Part A.
TEA Initial Compliance Review (ICR) Report Requirement • Program services and expenditures were described in the district's Continuous Improvement Plan or
Department Management Plan. In HISD, the 2007–2008 Title V, Part A Innovative Programs funding was centralized to improve academic achievement through innovative programs based on comprehensive needs assessments of the district's student population. Information obtained from the Title V, Part A Program Supervisor indicated that an annual, districtwide Federal Programs Parents Consultation Meeting was conducted in the spring of 2007 which provided an overview of Federal Programs for the 2007–2008 school year including Title I, Part A and Part C, Title II, Part A and Part D, Title II, Title IV, Part A, and Title V, Part A. Stakeholders' questions were answered consistent with program guidance from the U.S. Department of Education and TEA. Program Personnel The Title V, Part A Innovative Programs fund is administered through the External Funding Department. To facilitate the implementation of the program, the Title V, Part A Supervisor collaborated with central office representatives to supervise the implementation and to support program assessment for the grant. The Title V, Part A Supervisor and Evaluator were funded by this grant. A Secretary I provided administrative assistance to the Title V, Part A Supervisor. Consistent with allowable uses for the grant, additional administrative and instructional staff were hired and/or contracted through specific programs at the district level to support the Innovative Programs activities. The Title V, Part A Supervisor's responsibilities included supervising the Secretary I; managing the overall program budget; completing the annual application for state/federal funding; coordinating with the Budgeting Department to set up campus budgets for Innovative Programs services; coordinating with central administrators for dissemination of guidelines and policies to reflect the intent of the grant; monitoring the proper expenditure of grant funds by participants; updating the policy manual; monitoring maintenance of Innovative Programs; and managing and coordinating with the Department of Research and Accountability for proper program evaluation to meet state criteria.
6
TITLE V, PART A INNOVATIVE PROGRAMS, 2007–2008
Purpose of the Evaluation Report Federal and state guidelines require the completion of an annual evaluation of the Title V, Part A Innovative Programs for making decisions about appropriate program changes for the subsequent year. The evaluation provides feedback to program staff for assistance with program improvements, and constitutes a program summary for the July 1, 2007–June 30, 2008 fiscal year. In addition, it provides program outcomes for the 2007–2008 school year, as available. The report is intended for program administrators and district stakeholders. Qualitative and quantitative methods were utilized. Specifically, the following research questions were addressed: 1. How were the Title V, Part A Innovative Programs implemented districtwide? 2. What impact did the Title V, Part A Innovative Programs have on student academic achievement?
Methods Data Collection Several strategies were incorporated to ascertain how the Title V, Part A Innovative Programs were implemented and their impacts. Title V, Part A Innovative Programs criteria, and NCLB guidance documents from the U. S. Department of Education, the Texas Education Agency (TEA), and other program updates made available by the Title V, Part A Supervisor provided administrative reference materials for this report. Primary program documentation included budget allocations, central office program descriptions, implementation reports, and end-of-year reports submitted by program administrators for 2007–2008. Specifically, program services, target populations, evaluation strategies, and expected outcomes were obtained from related program descriptions. The Title V, Part A Innovative Programs Administrator Survey 2007–2008 responses provided information regarding adherence to NCLB assurances and provisions; Title V, Part A statutory purposes and requirements; and the TEA Initial Compliance Review (ICR) report requirement. In addition, detailed program schedules of actual services and activities, participant descriptions and counts, and program outcomes generated from planned evaluation strategies were obtained from administrative implementation and end-of-year reports. The Innovative Programs planning budget was provided by the Title V, Part A Supervisor. In addition, findings from Title V, Part A Texas Education Agency eGrants Compliance Reports for 2007–2008 as submitted by the Title V, Part A Supervisor were included. A final itemized budget report containing expenditures by expense category was not available for this report. Measures of Academic Achievement Districtwide and student group academic achievement were assessed using spring 2007 and 2008 Texas Assessment of Knowledge and Skills (TAKS) scores from HISD reports. Results were analyzed to assess performance gains and losses. The TAKS is a standardized criterion-based student academic achievement test. It is administered in grades three through eleven. The TAKS assessments evaluate the Texas Essential Knowledge and Skills (TEKS), which is the state-mandated curriculum. The percentage of students passing the identified subtests is presented, along with passing percentages for all tests taken. A comparison of Advanced Placement performance measures from spring 2007 and spring 2008 scores were used to evaluate the AVID program. Data Analysis The number of students tested on TAKS districtwide and by grade level was obtained from the HISD TAKS report for the respective year. Results for student groups of four or less were not reported, consistent with district practice. All calculations may vary by one percentage point due to rounding. Budget allocations and preliminary expenditures were rounded to the nearest dollar.
7
HISD RESEARCH AND ACCOUNTABILITY
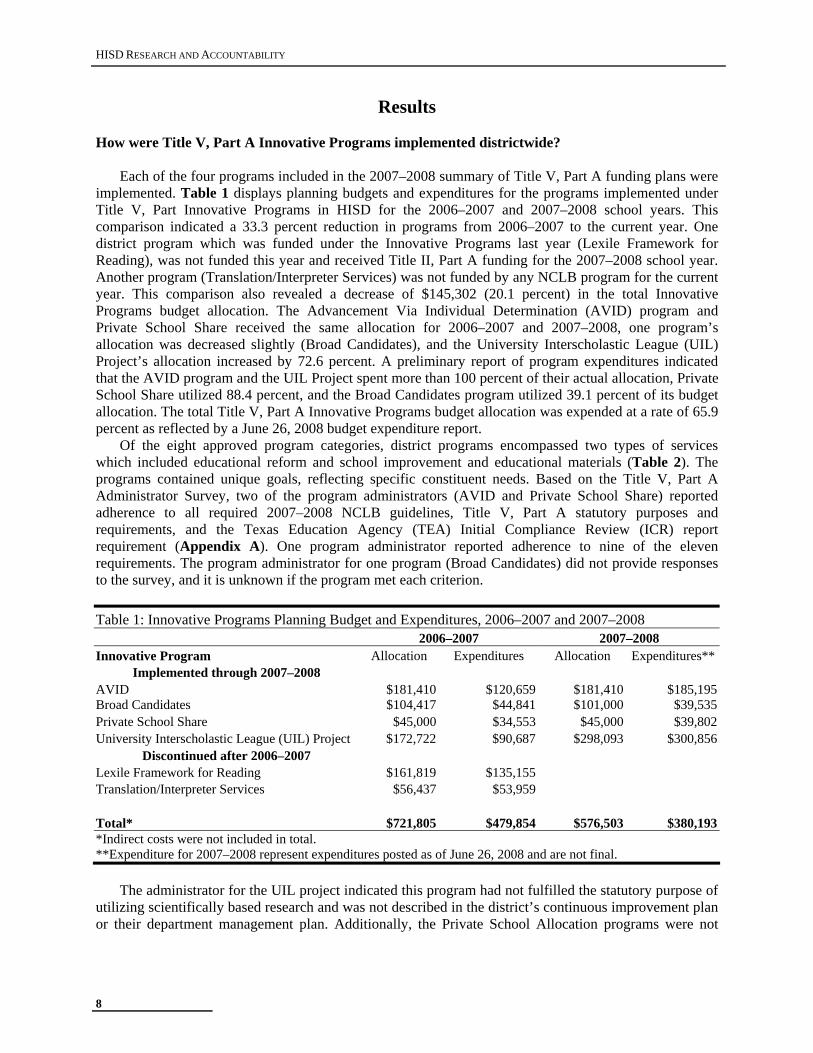
Results How were Title V, Part A Innovative Programs implemented districtwide? Each of the four programs included in the 2007–2008 summary of Title V, Part A funding plans were implemented. Table 1 displays planning budgets and expenditures for the programs implemented under Title V, Part Innovative Programs in HISD for the 2006–2007 and 2007–2008 school years. This comparison indicated a 33.3 percent reduction in programs from 2006–2007 to the current year. One district program which was funded under the Innovative Programs last year (Lexile Framework for Reading), was not funded this year and received Title II, Part A funding for the 2007–2008 school year. Another program (Translation/Interpreter Services) was not funded by any NCLB program for the current year. This comparison also revealed a decrease of $145,302 (20.1 percent) in the total Innovative Programs budget allocation. The Advancement Via Individual Determination (AVID) program and Private School Share received the same allocation for 2006–2007 and 2007–2008, one program’s allocation was decreased slightly (Broad Candidates), and the University Interscholastic League (UIL) Project’s allocation increased by 72.6 percent. A preliminary report of program expenditures indicated that the AVID program and the UIL Project spent more than 100 percent of their actual allocation, Private School Share utilized 88.4 percent, and the Broad Candidates program utilized 39.1 percent of its budget allocation. The total Title V, Part A Innovative Programs budget allocation was expended at a rate of 65.9 percent as reflected by a June 26, 2008 budget expenditure report.
Of the eight approved program categories, district programs encompassed two types of services which included educational reform and school improvement and educational materials (Table 2). The programs contained unique goals, reflecting specific constituent needs. Based on the Title V, Part A Administrator Survey, two of the program administrators (AVID and Private School Share) reported adherence to all required 2007–2008 NCLB guidelines, Title V, Part A statutory purposes and requirements, and the Texas Education Agency (TEA) Initial Compliance Review (ICR) report requirement (Appendix A). One program administrator reported adherence to nine of the eleven requirements. The program administrator for one program (Broad Candidates) did not provide responses to the survey, and it is unknown if the program met each criterion. Table 1: Innovative Programs Planning Budget and Expenditures, 2006–2007 and 2007–2008 2006–2007 2007–2008 Innovative Program Allocation Expenditures Allocation Expenditures**
Implemented through 2007–2008 AVID $181,410 $120,659 $181,410 $185,195Broad Candidates $104,417 $44,841 $101,000 $39,535Private School Share $45,000 $34,553 $45,000 $39,802University Interscholastic League (UIL) Project $172,722 $90,687 $298,093 $300,856
Discontinued after 2006–2007 Lexile Framework for Reading $161,819 $135,155 Translation/Interpreter Services $56,437 $53,959 Total* $721,805 $479,854 $576,503 $380,193*Indirect costs were not included in total. **Expenditure for 2007–2008 represent expenditures posted as of June 26, 2008 and are not final. The administrator for the UIL project indicated this program had not fulfilled the statutory purpose of utilizing scientifically based research and was not described in the district’s continuous improvement plan or their department management plan. Additionally, the Private School Allocation programs were not
8
TITLE V, PART A INNOVATIVE PROGRAMS, 2007–2008
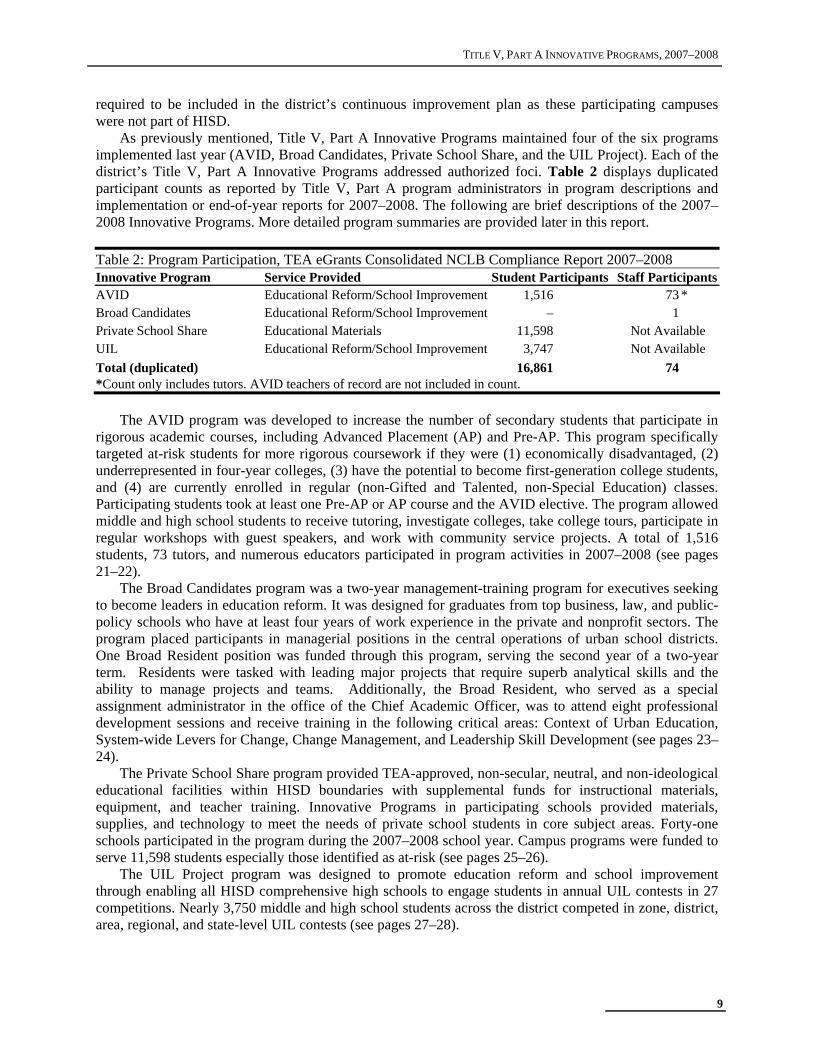
required to be included in the district’s continuous improvement plan as these participating campuses were not part of HISD. As previously mentioned, Title V, Part A Innovative Programs maintained four of the six programs implemented last year (AVID, Broad Candidates, Private School Share, and the UIL Project). Each of the district’s Title V, Part A Innovative Programs addressed authorized foci. Table 2 displays duplicated participant counts as reported by Title V, Part A program administrators in program descriptions and implementation or end-of-year reports for 2007–2008. The following are brief descriptions of the 2007–2008 Innovative Programs. More detailed program summaries are provided later in this report. Table 2: Program Participation, TEA eGrants Consolidated NCLB Compliance Report 2007–2008 Innovative Program Service Provided Student Participants Staff ParticipantsAVID Educational Reform/School Improvement 1,516 73 * Broad Candidates Educational Reform/School Improvement – 1 Private School Share Educational Materials 11,598 Not Available UIL Educational Reform/School Improvement 3,747 Not Available Total (duplicated) 16,861 74 *Count only includes tutors. AVID teachers of record are not included in count. The AVID program was developed to increase the number of secondary students that participate in rigorous academic courses, including Advanced Placement (AP) and Pre-AP. This program specifically targeted at-risk students for more rigorous coursework if they were (1) economically disadvantaged, (2) underrepresented in four-year colleges, (3) have the potential to become first-generation college students, and (4) are currently enrolled in regular (non-Gifted and Talented, non-Special Education) classes. Participating students took at least one Pre-AP or AP course and the AVID elective. The program allowed middle and high school students to receive tutoring, investigate colleges, take college tours, participate in regular workshops with guest speakers, and work with community service projects. A total of 1,516 students, 73 tutors, and numerous educators participated in program activities in 2007–2008 (see pages 21–22). The Broad Candidates program was a two-year management-training program for executives seeking to become leaders in education reform. It was designed for graduates from top business, law, and public-policy schools who have at least four years of work experience in the private and nonprofit sectors. The program placed participants in managerial positions in the central operations of urban school districts. One Broad Resident position was funded through this program, serving the second year of a two-year term. Residents were tasked with leading major projects that require superb analytical skills and the ability to manage projects and teams. Additionally, the Broad Resident, who served as a special assignment administrator in the office of the Chief Academic Officer, was to attend eight professional development sessions and receive training in the following critical areas: Context of Urban Education, System-wide Levers for Change, Change Management, and Leadership Skill Development (see pages 23–24). The Private School Share program provided TEA-approved, non-secular, neutral, and non-ideological educational facilities within HISD boundaries with supplemental funds for instructional materials, equipment, and teacher training. Innovative Programs in participating schools provided materials, supplies, and technology to meet the needs of private school students in core subject areas. Forty-one schools participated in the program during the 2007–2008 school year. Campus programs were funded to serve 11,598 students especially those identified as at-risk (see pages 25–26). The UIL Project program was designed to promote education reform and school improvement through enabling all HISD comprehensive high schools to engage students in annual UIL contests in 27 competitions. Nearly 3,750 middle and high school students across the district competed in zone, district, area, regional, and state-level UIL contests (see pages 27–28).
9
HISD RESEARCH AND ACCOUNTABILITY
What impact did the Title V, Part A Innovative Programs have on student academic achievement?
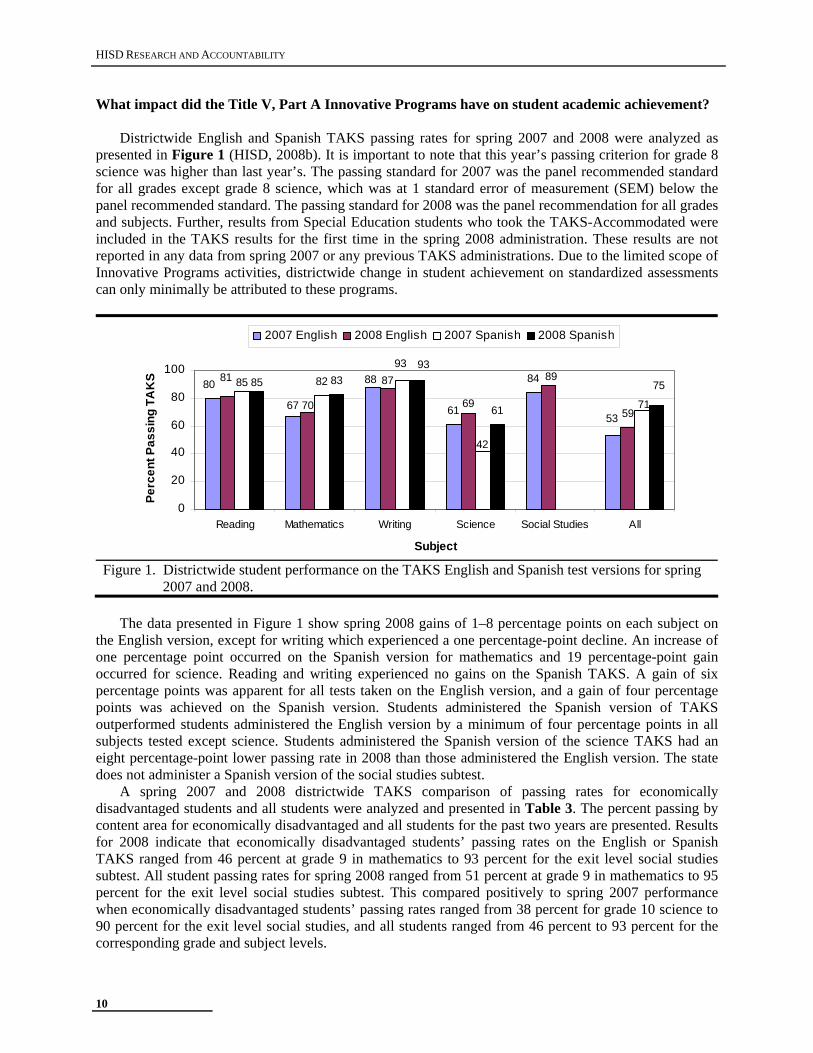
Districtwide English and Spanish TAKS passing rates for spring 2007 and 2008 were analyzed as presented in Figure 1 (HISD, 2008b). It is important to note that this year’s passing criterion for grade 8 science was higher than last year’s. The passing standard for 2007 was the panel recommended standard for all grades except grade 8 science, which was at 1 standard error of measurement (SEM) below the panel recommended standard. The passing standard for 2008 was the panel recommendation for all grades and subjects. Further, results from Special Education students who took the TAKS-Accommodated were included in the TAKS results for the first time in the spring 2008 administration. These results are not reported in any data from spring 2007 or any previous TAKS administrations. Due to the limited scope of Innovative Programs activities, districtwide change in student achievement on standardized assessments can only minimally be attributed to these programs.
61
84
59
82 83
6167
80
53
88
69
81 8987
70
85
71
42
93
75
9385
0
20
40
60
80
100
Reading Mathematics Writing Science Social Studies All
Subject
Perc
ent P
assi
ng T
AK
S
2007 English 2008 English 2007 Spanish 2008 Spanish
Figure 1. Districtwide student performance on the TAKS English and Spanish test versions for spring
2007 and 2008. The data presented in Figure 1 show spring 2008 gains of 1–8 percentage points on each subject on the English version, except for writing which experienced a one percentage-point decline. An increase of one percentage point occurred on the Spanish version for mathematics and 19 percentage-point gain occurred for science. Reading and writing experienced no gains on the Spanish TAKS. A gain of six percentage points was apparent for all tests taken on the English version, and a gain of four percentage points was achieved on the Spanish version. Students administered the Spanish version of TAKS outperformed students administered the English version by a minimum of four percentage points in all subjects tested except science. Students administered the Spanish version of the science TAKS had an eight percentage-point lower passing rate in 2008 than those administered the English version. The state does not administer a Spanish version of the social studies subtest.
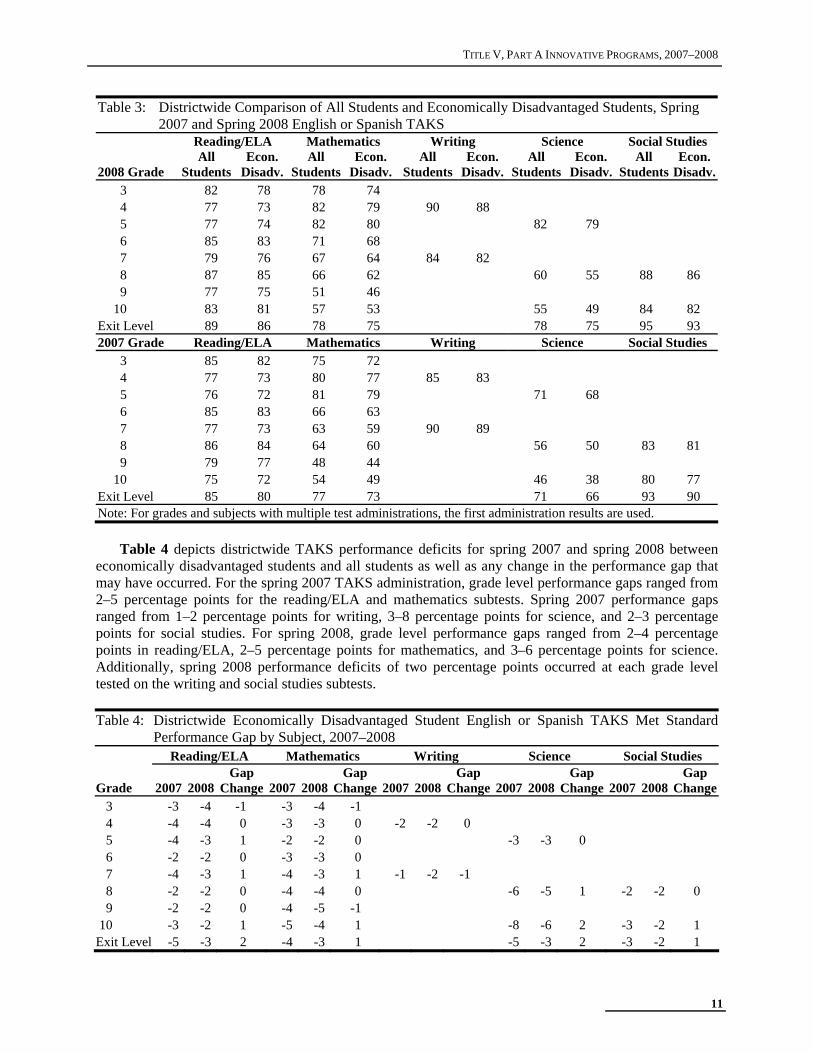
A spring 2007 and 2008 districtwide TAKS comparison of passing rates for economically disadvantaged students and all students were analyzed and presented in Table 3. The percent passing by content area for economically disadvantaged and all students for the past two years are presented. Results for 2008 indicate that economically disadvantaged students’ passing rates on the English or Spanish TAKS ranged from 46 percent at grade 9 in mathematics to 93 percent for the exit level social studies subtest. All student passing rates for spring 2008 ranged from 51 percent at grade 9 in mathematics to 95 percent for the exit level social studies subtest. This compared positively to spring 2007 performance when economically disadvantaged students’ passing rates ranged from 38 percent for grade 10 science to 90 percent for the exit level social studies, and all students ranged from 46 percent to 93 percent for the corresponding grade and subject levels.
10
TITLE V, PART A INNOVATIVE PROGRAMS, 2007–2008
Table 3: Districtwide Comparison of All Students and Economically Disadvantaged Students, Spring 2007 and Spring 2008 English or Spanish TAKS
Reading/ELA Mathematics Writing Science Social Studies
2008 Grade All
Students Econ.
Disadv. All
StudentsEcon.
Disadv.All
StudentsEcon.
Disadv.All
StudentsEcon.
Disadv. All
StudentsEcon.
Disadv.3 82 78 78 74 4 77 73 82 79 90 88 5 77 74 82 80 82 79 6 85 83 71 68 7 79 76 67 64 84 82 8 87 85 66 62 60 55 88 86 9 77 75 51 46
10 83 81 57 53 55 49 84 82 Exit Level 89 86 78 75 78 75 95 93 2007 Grade Reading/ELA Mathematics Writing Science Social Studies
3 85 82 75 72 4 77 73 80 77 85 83 5 76 72 81 79 71 68 6 85 83 66 63 7 77 73 63 59 90 89 8 86 84 64 60 56 50 83 81 9 79 77 48 44
10 75 72 54 49 46 38 80 77 Exit Level 85 80 77 73 71 66 93 90 Note: For grades and subjects with multiple test administrations, the first administration results are used.
Table 4 depicts districtwide TAKS performance deficits for spring 2007 and spring 2008 between economically disadvantaged students and all students as well as any change in the performance gap that may have occurred. For the spring 2007 TAKS administration, grade level performance gaps ranged from 2–5 percentage points for the reading/ELA and mathematics subtests. Spring 2007 performance gaps ranged from 1–2 percentage points for writing, 3–8 percentage points for science, and 2–3 percentage points for social studies. For spring 2008, grade level performance gaps ranged from 2–4 percentage points in reading/ELA, 2–5 percentage points for mathematics, and 3–6 percentage points for science. Additionally, spring 2008 performance deficits of two percentage points occurred at each grade level tested on the writing and social studies subtests.
Table 4: Districtwide Economically Disadvantaged Student English or Spanish TAKS Met Standard
Performance Gap by Subject, 2007–2008 Reading/ELA Mathematics Writing Science Social Studies
Grade 2007 2008 Gap
Change 2007 2008Gap
Change 2007 2008Gap
Change 2007 2008Gap
Change 2007 2008Gap
Change3 -3 -4 -1 -3 -4 -1 4 -4 -4 0 -3 -3 0 -2 -2 0 5 -4 -3 1 -2 -2 0 -3 -3 0 6 -2 -2 0 -3 -3 0 7 -4 -3 1 -4 -3 1 -1 -2 -1 8 -2 -2 0 -4 -4 0 -6 -5 1 -2 -2 0 9 -2 -2 0 -4 -5 -1
10 -3 -2 1 -5 -4 1 -8 -6 2 -3 -2 1 Exit Level -5 -3 2 -4 -3 1 -5 -3 2 -3 -2 1
11
HISD RESEARCH AND ACCOUNTABILITY
From spring 2007 to spring 2008, performance deficits were decreased by one percentage point at three grade levels for reading/ELA and mathematics, one grade level for science, and two grade levels for social studies. Economically disadvantaged student performance gaps were decreased by two percentage points at one reading/ELA grade level and two science grade levels. However, the performance gap increased by one percentage point at one grade level for reading/ELA and writing and at two grade levels on the mathematics subtest. Performance deficits remained constant at the remaining four grade levels for reading/ELA and mathematics and the one remaining grade level for writing, science, and social studies.
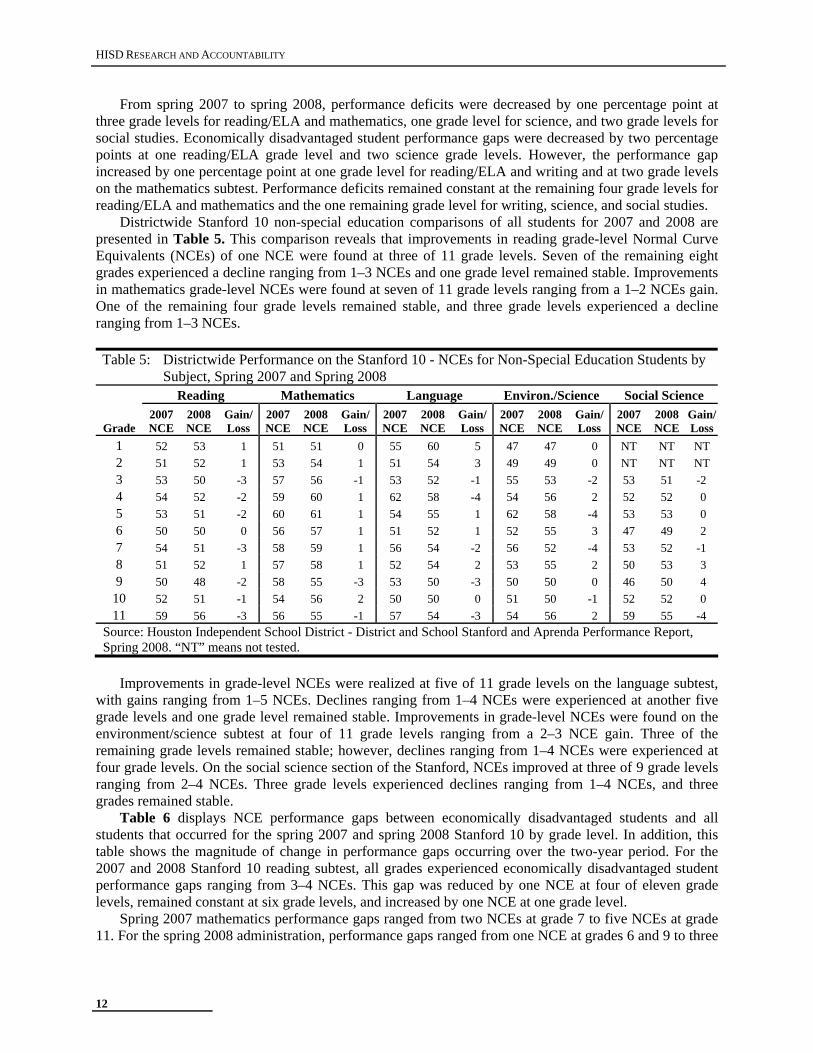
Districtwide Stanford 10 non-special education comparisons of all students for 2007 and 2008 are presented in Table 5. This comparison reveals that improvements in reading grade-level Normal Curve Equivalents (NCEs) of one NCE were found at three of 11 grade levels. Seven of the remaining eight grades experienced a decline ranging from 1–3 NCEs and one grade level remained stable. Improvements in mathematics grade-level NCEs were found at seven of 11 grade levels ranging from a 1–2 NCEs gain. One of the remaining four grade levels remained stable, and three grade levels experienced a decline ranging from 1–3 NCEs.
Table 5: Districtwide Performance on the Stanford 10 - NCEs for Non-Special Education Students by
Subject, Spring 2007 and Spring 2008 Reading Mathematics Language Environ./Science Social Science 2007 2008 Gain/ 2007 2008 Gain/ 2007 2008 Gain/ 2007 2008 Gain/ 2007 2008 Gain/Grade NCE NCE Loss NCE NCE Loss NCE NCE Loss NCE NCE Loss NCE NCE Loss
1 52 53 1 51 51 0 55 60 5 47 47 0 NT NT NT 2 51 52 1 53 54 1 51 54 3 49 49 0 NT NT NT 3 53 50 -3 57 56 -1 53 52 -1 55 53 -2 53 51 -2 4 54 52 -2 59 60 1 62 58 -4 54 56 2 52 52 0 5 53 51 -2 60 61 1 54 55 1 62 58 -4 53 53 0 6 50 50 0 56 57 1 51 52 1 52 55 3 47 49 2 7 54 51 -3 58 59 1 56 54 -2 56 52 -4 53 52 -1 8 51 52 1 57 58 1 52 54 2 53 55 2 50 53 3 9 50 48 -2 58 55 -3 53 50 -3 50 50 0 46 50 4
10 52 51 -1 54 56 2 50 50 0 51 50 -1 52 52 0 11 59 56 -3 56 55 -1 57 54 -3 54 56 2 59 55 -4
Source: Houston Independent School District - District and School Stanford and Aprenda Performance Report, Spring 2008. “NT” means not tested.
Improvements in grade-level NCEs were realized at five of 11 grade levels on the language subtest,
with gains ranging from 1–5 NCEs. Declines ranging from 1–4 NCEs were experienced at another five grade levels and one grade level remained stable. Improvements in grade-level NCEs were found on the environment/science subtest at four of 11 grade levels ranging from a 2–3 NCE gain. Three of the remaining grade levels remained stable; however, declines ranging from 1–4 NCEs were experienced at four grade levels. On the social science section of the Stanford, NCEs improved at three of 9 grade levels ranging from 2–4 NCEs. Three grade levels experienced declines ranging from 1–4 NCEs, and three grades remained stable.
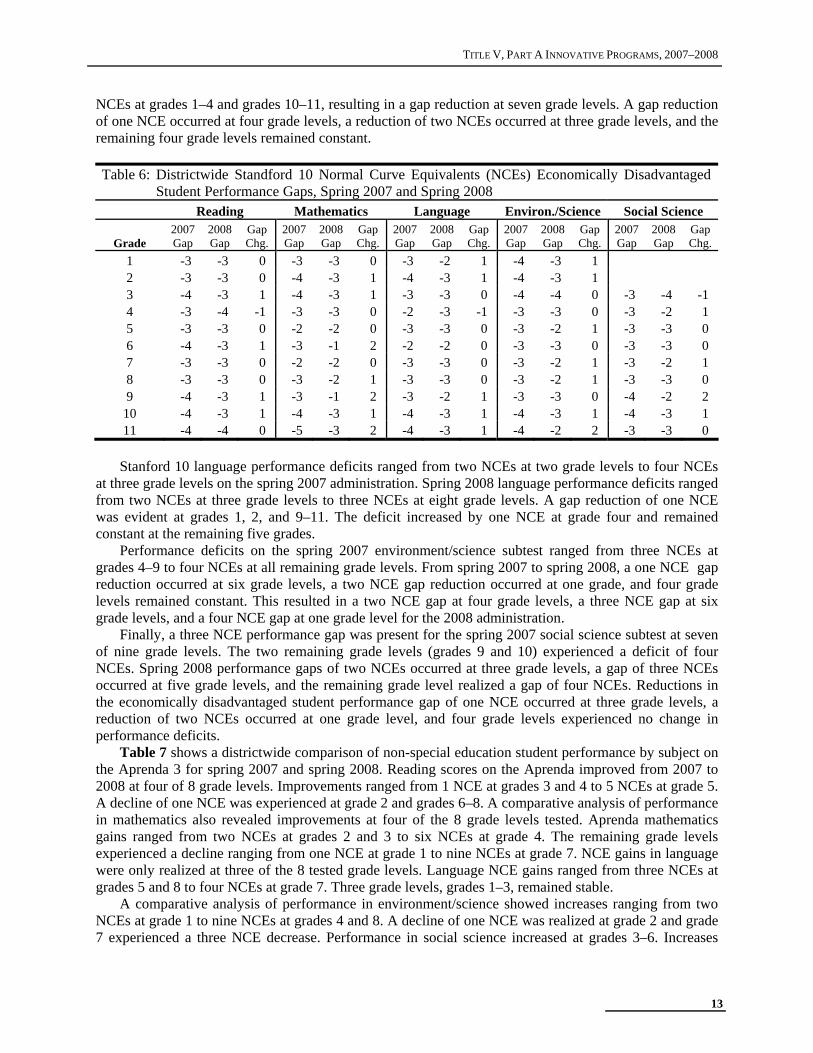
Table 6 displays NCE performance gaps between economically disadvantaged students and all students that occurred for the spring 2007 and spring 2008 Stanford 10 by grade level. In addition, this table shows the magnitude of change in performance gaps occurring over the two-year period. For the 2007 and 2008 Stanford 10 reading subtest, all grades experienced economically disadvantaged student performance gaps ranging from 3–4 NCEs. This gap was reduced by one NCE at four of eleven grade levels, remained constant at six grade levels, and increased by one NCE at one grade level.
Spring 2007 mathematics performance gaps ranged from two NCEs at grade 7 to five NCEs at grade 11. For the spring 2008 administration, performance gaps ranged from one NCE at grades 6 and 9 to three
12
TITLE V, PART A INNOVATIVE PROGRAMS, 2007–2008
NCEs at grades 1–4 and grades 10–11, resulting in a gap reduction at seven grade levels. A gap reduction of one NCE occurred at four grade levels, a reduction of two NCEs occurred at three grade levels, and the remaining four grade levels remained constant.
Table 6: Districtwide Standford 10 Normal Curve Equivalents (NCEs) Economically Disadvantaged
Student Performance Gaps, Spring 2007 and Spring 2008 Reading Mathematics Language Environ./Science Social Science
Grade 2007 Gap
2008 Gap
Gap Chg.
2007 Gap
2008 Gap
Gap Chg.
2007 Gap
2008 Gap
Gap Chg.
2007 Gap
2008 Gap
Gap Chg.
2007 Gap
2008 Gap
Gap Chg.
1 -3 -3 0 -3 -3 0 -3 -2 1 -4 -3 1 2 -3 -3 0 -4 -3 1 -4 -3 1 -4 -3 1 3 -4 -3 1 -4 -3 1 -3 -3 0 -4 -4 0 -3 -4 -1 4 -3 -4 -1 -3 -3 0 -2 -3 -1 -3 -3 0 -3 -2 1 5 -3 -3 0 -2 -2 0 -3 -3 0 -3 -2 1 -3 -3 0 6 -4 -3 1 -3 -1 2 -2 -2 0 -3 -3 0 -3 -3 0 7 -3 -3 0 -2 -2 0 -3 -3 0 -3 -2 1 -3 -2 1 8 -3 -3 0 -3 -2 1 -3 -3 0 -3 -2 1 -3 -3 0 9 -4 -3 1 -3 -1 2 -3 -2 1 -3 -3 0 -4 -2 2
10 -4 -3 1 -4 -3 1 -4 -3 1 -4 -3 1 -4 -3 1 11 -4 -4 0 -5 -3 2 -4 -3 1 -4 -2 2 -3 -3 0 Stanford 10 language performance deficits ranged from two NCEs at two grade levels to four NCEs
at three grade levels on the spring 2007 administration. Spring 2008 language performance deficits ranged from two NCEs at three grade levels to three NCEs at eight grade levels. A gap reduction of one NCE was evident at grades 1, 2, and 9–11. The deficit increased by one NCE at grade four and remained constant at the remaining five grades.
Performance deficits on the spring 2007 environment/science subtest ranged from three NCEs at grades 4–9 to four NCEs at all remaining grade levels. From spring 2007 to spring 2008, a one NCE gap reduction occurred at six grade levels, a two NCE gap reduction occurred at one grade, and four grade levels remained constant. This resulted in a two NCE gap at four grade levels, a three NCE gap at six grade levels, and a four NCE gap at one grade level for the 2008 administration.
Finally, a three NCE performance gap was present for the spring 2007 social science subtest at seven of nine grade levels. The two remaining grade levels (grades 9 and 10) experienced a deficit of four NCEs. Spring 2008 performance gaps of two NCEs occurred at three grade levels, a gap of three NCEs occurred at five grade levels, and the remaining grade level realized a gap of four NCEs. Reductions in the economically disadvantaged student performance gap of one NCE occurred at three grade levels, a reduction of two NCEs occurred at one grade level, and four grade levels experienced no change in performance deficits.
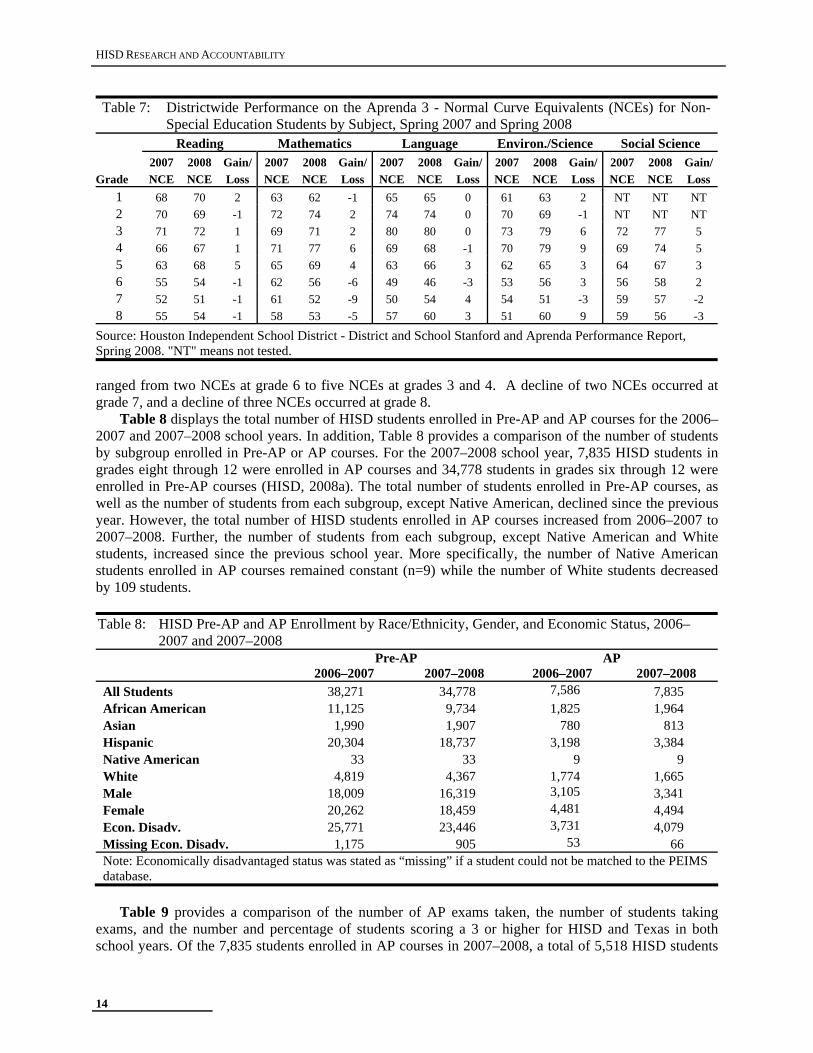
Table 7 shows a districtwide comparison of non-special education student performance by subject on the Aprenda 3 for spring 2007 and spring 2008. Reading scores on the Aprenda improved from 2007 to 2008 at four of 8 grade levels. Improvements ranged from 1 NCE at grades 3 and 4 to 5 NCEs at grade 5. A decline of one NCE was experienced at grade 2 and grades 6–8. A comparative analysis of performance in mathematics also revealed improvements at four of the 8 grade levels tested. Aprenda mathematics gains ranged from two NCEs at grades 2 and 3 to six NCEs at grade 4. The remaining grade levels experienced a decline ranging from one NCE at grade 1 to nine NCEs at grade 7. NCE gains in language were only realized at three of the 8 tested grade levels. Language NCE gains ranged from three NCEs at grades 5 and 8 to four NCEs at grade 7. Three grade levels, grades 1–3, remained stable.
A comparative analysis of performance in environment/science showed increases ranging from two NCEs at grade 1 to nine NCEs at grades 4 and 8. A decline of one NCE was realized at grade 2 and grade 7 experienced a three NCE decrease. Performance in social science increased at grades 3–6. Increases
13
HISD RESEARCH AND ACCOUNTABILITY
ranged from two NCEs at grade 6 to five NCEs at grades 3 and 4. A decline of two NCEs occurred at grade 7, and a decline of three NCEs occurred at grade 8.
Table 7: Districtwide Performance on the Aprenda 3 - Normal Curve Equivalents (NCEs) for Non-Special Education Students by Subject, Spring 2007 and Spring 2008
Reading Mathematics Language Environ./Science Social Science 2007 2008 Gain/ 2007 2008 Gain/ 2007 2008 Gain/ 2007 2008 Gain/ 2007 2008 Gain/Grade NCE NCE Loss NCE NCE Loss NCE NCE Loss NCE NCE Loss NCE NCE Loss
1 68 70 2 63 62 -1 65 65 0 61 63 2 NT NT NT 2 70 69 -1 72 74 2 74 74 0 70 69 -1 NT NT NT 3 71 72 1 69 71 2 80 80 0 73 79 6 72 77 5 4 66 67 1 71 77 6 69 68 -1 70 79 9 69 74 5 5 63 68 5 65 69 4 63 66 3 62 65 3 64 67 3 6 55 54 -1 62 56 -6 49 46 -3 53 56 3 56 58 2 7 52 51 -1 61 52 -9 50 54 4 54 51 -3 59 57 -2 8 55 54 -1 58 53 -5 57 60 3 51 60 9 59 56 -3
Source: Houston Independent School District - District and School Stanford and Aprenda Performance Report, Spring 2008. "NT" means not tested.
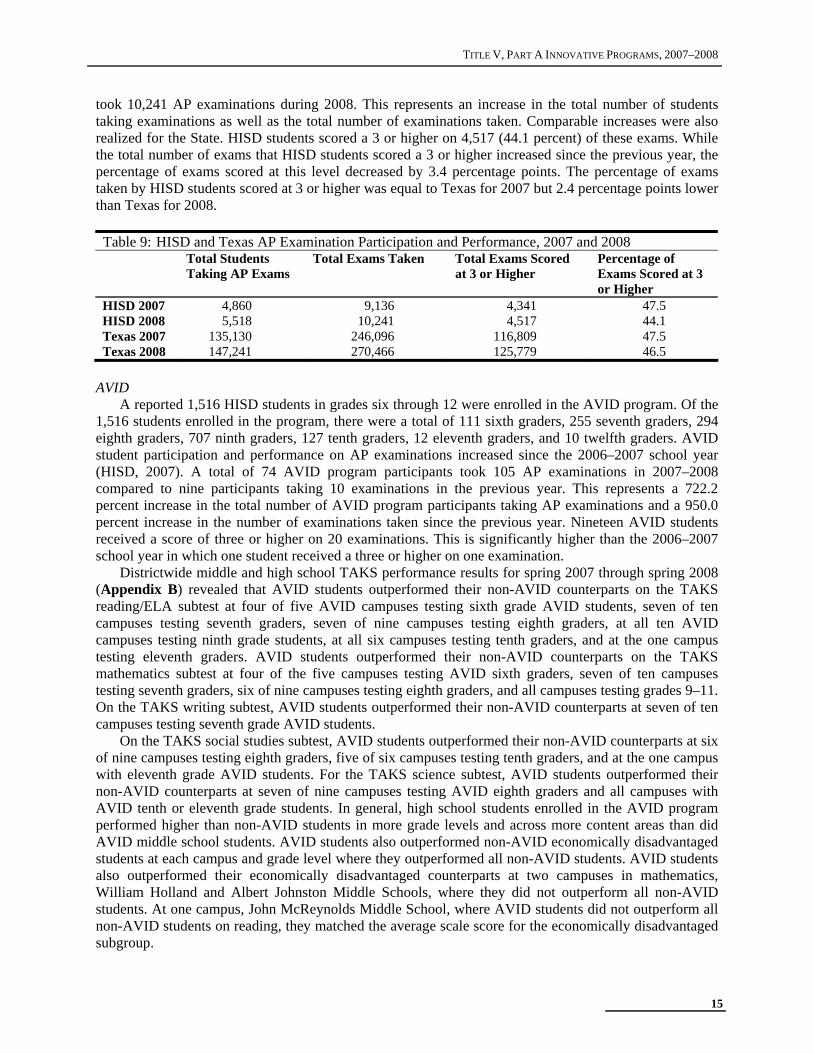
Table 8 displays the total number of HISD students enrolled in Pre-AP and AP courses for the 2006–2007 and 2007–2008 school years. In addition, Table 8 provides a comparison of the number of students by subgroup enrolled in Pre-AP or AP courses. For the 2007–2008 school year, 7,835 HISD students in grades eight through 12 were enrolled in AP courses and 34,778 students in grades six through 12 were enrolled in Pre-AP courses (HISD, 2008a). The total number of students enrolled in Pre-AP courses, as well as the number of students from each subgroup, except Native American, declined since the previous year. However, the total number of HISD students enrolled in AP courses increased from 2006–2007 to 2007–2008. Further, the number of students from each subgroup, except Native American and White students, increased since the previous school year. More specifically, the number of Native American students enrolled in AP courses remained constant (n=9) while the number of White students decreased by 109 students. Table 8: HISD Pre-AP and AP Enrollment by Race/Ethnicity, Gender, and Economic Status, 2006–
2007 and 2007–2008 Pre-AP AP 2006–2007 2007–2008 2006–2007 2007–2008 All Students 38,271 34,778 7,586 7,835 African American 11,125 9,734 1,825 1,964 Asian 1,990 1,907 780 813 Hispanic 20,304 18,737 3,198 3,384 Native American 33 33 9 9 White 4,819 4,367 1,774 1,665 Male 18,009 16,319 3,105 3,341 Female 20,262 18,459 4,481 4,494 Econ. Disadv. 25,771 23,446 3,731 4,079 Missing Econ. Disadv. 1,175 905 53 66 Note: Economically disadvantaged status was stated as “missing” if a student could not be matched to the PEIMS database.
Table 9 provides a comparison of the number of AP exams taken, the number of students taking
exams, and the number and percentage of students scoring a 3 or higher for HISD and Texas in both school years. Of the 7,835 students enrolled in AP courses in 2007–2008, a total of 5,518 HISD students
14
TITLE V, PART A INNOVATIVE PROGRAMS, 2007–2008
took 10,241 AP examinations during 2008. This represents an increase in the total number of students taking examinations as well as the total number of examinations taken. Comparable increases were also realized for the State. HISD students scored a 3 or higher on 4,517 (44.1 percent) of these exams. While the total number of exams that HISD students scored a 3 or higher increased since the previous year, the percentage of exams scored at this level decreased by 3.4 percentage points. The percentage of exams taken by HISD students scored at 3 or higher was equal to Texas for 2007 but 2.4 percentage points lower than Texas for 2008. Table 9: HISD and Texas AP Examination Participation and Performance, 2007 and 2008 Total Students
Taking AP Exams Total Exams Taken Total Exams Scored
at 3 or Higher Percentage of Exams Scored at 3 or Higher
HISD 2007 4,860 9,136 4,341 47.5 HISD 2008 5,518 10,241 4,517 44.1 Texas 2007 135,130 246,096 116,809 47.5 Texas 2008 147,241 270,466 125,779 46.5
AVID
A reported 1,516 HISD students in grades six through 12 were enrolled in the AVID program. Of the 1,516 students enrolled in the program, there were a total of 111 sixth graders, 255 seventh graders, 294 eighth graders, 707 ninth graders, 127 tenth graders, 12 eleventh graders, and 10 twelfth graders. AVID student participation and performance on AP examinations increased since the 2006–2007 school year (HISD, 2007). A total of 74 AVID program participants took 105 AP examinations in 2007–2008 compared to nine participants taking 10 examinations in the previous year. This represents a 722.2 percent increase in the total number of AVID program participants taking AP examinations and a 950.0 percent increase in the number of examinations taken since the previous year. Nineteen AVID students received a score of three or higher on 20 examinations. This is significantly higher than the 2006–2007 school year in which one student received a three or higher on one examination. Districtwide middle and high school TAKS performance results for spring 2007 through spring 2008 (Appendix B) revealed that AVID students outperformed their non-AVID counterparts on the TAKS reading/ELA subtest at four of five AVID campuses testing sixth grade AVID students, seven of ten campuses testing seventh graders, seven of nine campuses testing eighth graders, at all ten AVID campuses testing ninth grade students, at all six campuses testing tenth graders, and at the one campus testing eleventh graders. AVID students outperformed their non-AVID counterparts on the TAKS mathematics subtest at four of the five campuses testing AVID sixth graders, seven of ten campuses testing seventh graders, six of nine campuses testing eighth graders, and all campuses testing grades 9–11. On the TAKS writing subtest, AVID students outperformed their non-AVID counterparts at seven of ten campuses testing seventh grade AVID students. On the TAKS social studies subtest, AVID students outperformed their non-AVID counterparts at six of nine campuses testing eighth graders, five of six campuses testing tenth graders, and at the one campus with eleventh grade AVID students. For the TAKS science subtest, AVID students outperformed their non-AVID counterparts at seven of nine campuses testing AVID eighth graders and all campuses with AVID tenth or eleventh grade students. In general, high school students enrolled in the AVID program performed higher than non-AVID students in more grade levels and across more content areas than did AVID middle school students. AVID students also outperformed non-AVID economically disadvantaged students at each campus and grade level where they outperformed all non-AVID students. AVID students also outperformed their economically disadvantaged counterparts at two campuses in mathematics, William Holland and Albert Johnston Middle Schools, where they did not outperform all non-AVID students. At one campus, John McReynolds Middle School, where AVID students did not outperform all non-AVID students on reading, they matched the average scale score for the economically disadvantaged subgroup.
15
HISD RESEARCH AND ACCOUNTABILITY
Broad Candidates The Broad Resident program was designed to improve student academic achievement by improving business operations within HISD by providing the district with an individual who has demonstrated success in the private sector and through personal academic achievement. Documentation of the roles and responsibilities played by the Resident was limited, and documentation of improvements within HISD realized on behalf of the Broad Resident was not provided. Therefore, the impact of this program on student academic achievement cannot be determined for 2007–2008. Private School Share A total of 41 Catholic, Orthodox, Protestant, or Jewish private schools received funding to purchase library or media resources to improve student academic achievement for 11,598 eligible students. Campus-level administrators reported subjects targeted for academic improvement to the HISD Department of External Funding; however, documentation on targeted subjects was not provided on behalf of this report. Campus-level achievement data were not available for this report. UIL Project The UIL program has demonstrated success as evidenced by increases in the number of students and schools participating in the program since the 2006–2007 school year. Specifically, the number of students participating increased from 900 to 3,747 and the number of schools increased from 28 to 92. However, no measure of the program’s direct impact on student achievement was conducted.
Discussion Federal and state guidelines require the completion of an annual evaluation of the Title V, Part A Innovative Programs for making decisions about appropriate program changes for the subsequent year. However, it is important to note that the Title V, Part A Innovative Programs fund has expired and was not reauthorized. The 2007–2008 school year represents the final year that program funding was made available. Nevertheless, a small unspent balance remained at the end of the program fiscal year and will carry over for programming in 2008–2009. The evaluation provides feedback to program staff for assistance with program improvements, and constitutes a program summary for the July 1, 2007–June 30, 2008 fiscal year. In addition, it provides program outcomes for the 2007–2008 school year, as available. The report is intended for program administrators and district stakeholders. Qualitative and quantitative methods were utilized. The specific research questions addressed in this report pertain to how the Innovative Programs were implemented districtwide and their subsequent impact on student achievement. Effectiveness of Program Implementation All of the Innovative Programs planned for 2007–2008 were implemented, resulting in a 33.3 percent decrease in programs and a 20.1 percent budget reduction since 2006–2007. Furthermore, the Title V, Part A Innovative Programs budget allocation was expended at a rate of 65.9 percent as reflected by a June 26, 2008 budget expenditure report, with individual programs accomplishing expenditure rates from 39.1 percent to 102.1 percent.
Innovative Programs are required to fulfill the eleven statutory requirements of the grant as indicated in Section 5131 of the NCLB Act. Unfortunately, the Title V, Part A administrative reports and other documents were not sufficient to confirm that all the programs implemented in 2007–2008 satisfied the statutory requirements. More specifically, two of the program administrators (AVID and Private School Share) reported adherence to all requirements, and one program administrator reported adherence to 9 of the eleven requirements. The program administrator for one program (Broad Candidates) did not provide responses to the survey, and it is unknown if the program met each criteria. The administrator for the UIL project indicated this program had not fulfilled the statutory purpose of utilizing scientifically based
16
TITLE V, PART A INNOVATIVE PROGRAMS, 2007–2008
research and was not described in the district’s continuous improvement plan or their department management plan. Additionally, the Private School Allocation programs were not required to be included in the district’s continuous improvement plan as these participating campuses were not part of HISD. Additionally, of the eight approved program categories, district programs encompassed two types of services including educational reform and school improvement and educational materials. One program (Broad Candidates) offered services that did not fit any approved program category. The method by which program administrators gathered and reported explicit, detailed information regarding exact counts for all program services and participants and program impact on identified measures was not consistent. The coordination and documentation of program activities and participants is crucial to clearly assess: (1) the appropriateness of program services; (2) the scope of program participation; and (3) program impact on teaching and learning. Administrative coordination in these areas is necessary for collaborative participation and a unified understanding of each program's relationship to the districtwide needs as assessed. Program Effectiveness Regarding Student Academic Achievement
The fundamental measure of program effectiveness is the level of academic achievement for specified students and their academic improvement from one year to the next. Due to the limited scope of Innovative Programs activities, districtwide changes in student achievement on standardized assessments can only minimally be attributed to these programs. Obviously, many variables affect teaching and learning outcomes, making it necessary for the research-based programs that are implemented through this grant to be designed and evaluated carefully, utilizing proven strategies to design and measure program effects.
Innovative Programs documentation for 2007–2008 revealed extensive provision of diverse, innovative services to address specified instructional and learning needs across the district. Districtwide performance on TAKS revealed achievement gains across most subjects and all tests taken for both the English and Spanish test versions. Results for TAKS performance gaps between economically disadvantaged students and all students were mixed. Stanford 10 and Aprenda NCE grade level gains were not found consistently across grade levels and subject areas; however, Stanford 10 reductions in performance gaps for economically disadvantaged students and all students were evident. Although the total number of students who scored a 3 or higher on AP examinations increased, the districtwide percentage of students who obtained this score decreased. Unfortunately, standardized student achievement scores which could be used to assess the direct impact of the 2007–2008 programming were only available for one (AVID) of the four programs. AVID student performance on TAKS subtests was generally better than non-AVID student performance at the same campus. Further, AVID student participation and performance on AP examinations increased since the 2006–2007 school year. More specifically, the total number of AVID program participants taking AP examinations increased by 722.2 percent and the number of examinations taken increased by 950.0 percent since the previous year. Further, nineteen AVID students received a score of three or higher on 20 examinations. This is significantly higher than the 2006–2007 school year in which one AVID student received a three or higher on one examination.
Recommendations
1. To ensure compliance with statutory requirements, Innovative Programs must employ record keeping
systems that accurately track student participation in program activities. Three programs worked directly with students; however, student level documentation of program participation and performance was only provided for one program (AVID). Innovative Programs implemented by HISD
17
HISD RESEARCH AND ACCOUNTABILITY
need to ensure that adequate documentation is available so that a link between program expenditures and student achievement may be established.
2. District administrators must become fully aware of the legislative purposes, requirements, and criteria
for funding and implementing Title V, Part A Innovative Programs. During the current year, one program (Broad) did not provide documentation of program activities or compliance with statutory requirements and purposes. HISD should develop and require mandatory attendance of compliance training of all Innovative Programs administrators prior to the awarding of any federal and state funds.
References Houston Independent School District. (2007). Title V, Part A Innovative Programs, 2006–2007. Retrieved July 1, 2008, from
HISD website: http://www.houstonisd.org/ResearchAccountability/Home/ProgEval/Federal%20Title%20Programs/Final_ TitleVA_2006-2007.pdf
Houston Independent School District. (2008a). Advanced Placement (AP) Monitoring System Report 2007–2008. Unpublished Report.
Houston Independent School District. (2008b). Texas Assessment of Knowledge and Skills, Spring 2008. Retrieved August 18, 2008, from HISD website: http://www.houstonisd.org/ResearchAccountability/Home/Perform_Acount/StudPerf/TAKS%20 Reports/Performance%20Reports/2008/Complete%20Report%202008.pdf.
Houston Independent School District. (2008c). District and School Stanford and Aprenda Performance Report, Spring 2008. Retrieved August 1, 2008, from HISD website: http://www.houstonisd.org/ResearchAccountability/Home/Perform _Acount/StudPerf/Stanford%20Aprenda/Performance/PerfRpt%202008/Stanford_2008_Complete.pdf.
Texas Education Agency (TEA). (May 2006). Title V, Part A Innovative Programs. Retrieved October 1, 2007, from TEA website: http://www.tea.state.tx.us/nclb/newpolicy/title5a.pdf.
U. S. Department of Education. (August 2002). Guidance for Title V, Part A of the Elementary and Secondary Education Act, as reauthorized by the No Child Left Behind (NCLB) Act (State Grants for Innovative Programs).
18
TITLE V, PART A INNOVATIVE PROGRAMS, 2007–2008
INNOVATIVE PROGRAMS SUMMARIES
The following section provides a detailed summary of each of the Title V, Part A programs implemented in the district in 2007–2008. Each summary includes a program description, summary of related needs assessed, program goals, participants, location, costs, findings, discussion of findings, recommendations, and additional information as provided by program administrators.
19
HISD RESEARCH AND ACCOUNTABILITY
20
TITLE V, PART A INNOVATIVE PROGRAMS, 2007–2008
Advancement Via Individual Determination Program Description
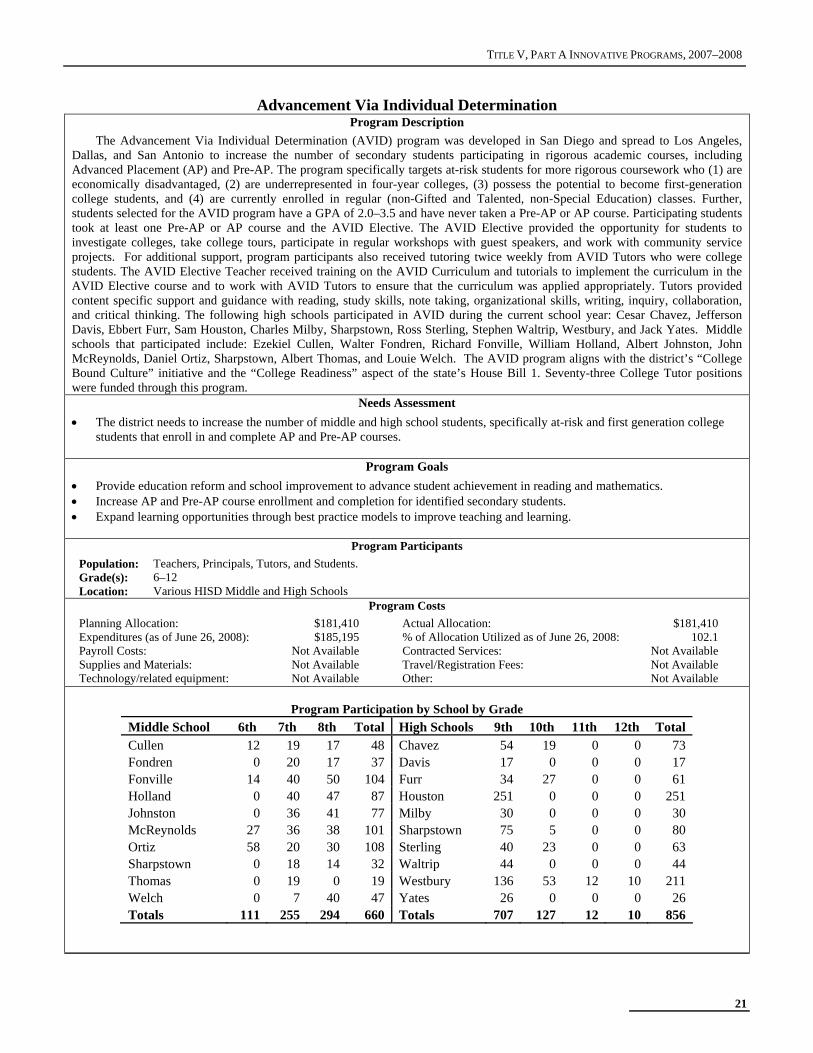
The Advancement Via Individual Determination (AVID) program was developed in San Diego and spread to Los Angeles, Dallas, and San Antonio to increase the number of secondary students participating in rigorous academic courses, including Advanced Placement (AP) and Pre-AP. The program specifically targets at-risk students for more rigorous coursework who (1) are economically disadvantaged, (2) are underrepresented in four-year colleges, (3) possess the potential to become first-generation college students, and (4) are currently enrolled in regular (non-Gifted and Talented, non-Special Education) classes. Further, students selected for the AVID program have a GPA of 2.0–3.5 and have never taken a Pre-AP or AP course. Participating students took at least one Pre-AP or AP course and the AVID Elective. The AVID Elective provided the opportunity for students to investigate colleges, take college tours, participate in regular workshops with guest speakers, and work with community service projects. For additional support, program participants also received tutoring twice weekly from AVID Tutors who were college students. The AVID Elective Teacher received training on the AVID Curriculum and tutorials to implement the curriculum in the AVID Elective course and to work with AVID Tutors to ensure that the curriculum was applied appropriately. Tutors provided content specific support and guidance with reading, study skills, note taking, organizational skills, writing, inquiry, collaboration, and critical thinking. The following high schools participated in AVID during the current school year: Cesar Chavez, Jefferson Davis, Ebbert Furr, Sam Houston, Charles Milby, Sharpstown, Ross Sterling, Stephen Waltrip, Westbury, and Jack Yates. Middle schools that participated include: Ezekiel Cullen, Walter Fondren, Richard Fonville, William Holland, Albert Johnston, John McReynolds, Daniel Ortiz, Sharpstown, Albert Thomas, and Louie Welch. The AVID program aligns with the district’s “College Bound Culture” initiative and the “College Readiness” aspect of the state’s House Bill 1. Seventy-three College Tutor positions were funded through this program.
Needs Assessment • The district needs to increase the number of middle and high school students, specifically at-risk and first generation college
students that enroll in and complete AP and Pre-AP courses.
Program Goals • Provide education reform and school improvement to advance student achievement in reading and mathematics. • Increase AP and Pre-AP course enrollment and completion for identified secondary students. • Expand learning opportunities through best practice models to improve teaching and learning.
Program Participants Population: Teachers, Principals, Tutors, and Students. Grade(s): 6–12 Location: Various HISD Middle and High Schools
Program Costs Planning Allocation: $181,410 Actual Allocation: $181,410 Expenditures (as of June 26, 2008): $185,195 % of Allocation Utilized as of June 26, 2008: 102.1 Payroll Costs: Not Available Contracted Services: Not Available Supplies and Materials: Not Available Travel/Registration Fees: Not Available Technology/related equipment: Not Available Other: Not Available
Program Participation by School by Grade
Middle School 6th 7th 8th Total High Schools 9th 10th 11th 12th Total Cullen 12 19 17 48 Chavez 54 19 0 0 73 Fondren 0 20 17 37 Davis 17 0 0 0 17 Fonville 14 40 50 104 Furr 34 27 0 0 61 Holland 0 40 47 87 Houston 251 0 0 0 251 Johnston 0 36 41 77 Milby 30 0 0 0 30 McReynolds 27 36 38 101 Sharpstown 75 5 0 0 80 Ortiz 58 20 30 108 Sterling 40 23 0 0 63 Sharpstown 0 18 14 32 Waltrip 44 0 0 0 44 Thomas 0 19 0 19 Westbury 136 53 12 10 211 Welch 0 7 40 47 Yates 26 0 0 0 26 Totals 111 255 294 660 Totals 707 127 12 10 856
21
HISD RESEARCH AND ACCOUNTABILITY
Findings • 1,516 students (660 middle school and 856 high school students) were enrolled in the AVID program. However, a list of
students submitted by the program administrator provided identifying information on 1,510 students (662 middle school and 848 high school). Further, only 1,490 students could be matched to student files for enrolled students in the district’s Chancery system.
• Every student participating in the program was enrolled in the AVID Elective and at least one AP or Pre-AP course. • AVID Elective teachers and coordinators attended three full-day training sessions and six two-hour training sessions
throughout the school year. • AVID students were provided access to a cohort of 73 tutors, enrolled as college freshman through graduate students, that
provided student assistance bi-weekly. AVID tutors were required to participate in four training sessions of unspecified length. Tutors were paid $12.06 for each hour of training they attended and for each hour worked.
• Unexpected tutor training expenditures resulted in the program going $37,000 over budget. The Small Learning Community Grant provided the additional funds.
• A classroom observation conducted at one school, Sharpstown Middle School, by the program evaluator indicated that students, the AVID teacher, and program administrator all agreed on how this program alters/modifies the school environment. All students shared positive experiences with the program. Delivery of the AVID curriculum appeared to have a positive effect on school and classroom environment.
• Interviewed students agreed that their individual learning had been impacted positively because of assistance from AVID teacher and AVID tutors. Students and their teacher agreed that program has had a positive impact on academic performance in multiple courses.
• Student identification numbers were obtained to make comparisons of AVID students to all non-AVID students and non-AVID students identified as economically disadvantaged for the participating campuses (see Appendix B). AVID students outperformed their non-AVID counterparts on the TAKS reading/ELA subtest at 4 of 5 AVID campuses testing 6th grade AVID students, 7 of 10 campuses testing 7th graders, 7 of 9 campuses testing 8th graders, at all ten AVID campuses testing 9th grade students, at all six campuses testing 10th graders, and at the lone campus testing 11 graders.
• AVID students outperformed their non-AVID counterparts on the TAKS mathematics subtest at 4 of the 5 campuses testing AVID 6th graders, 7 of 10 campuses testing 7th graders, 6 of 9 campuses testing 8th graders, and all campuses testing grades 9–11.
• On the TAKS writing subtest, AVID students outperformed their non-AVID counterparts at 7 of 10 campuses testing 7th grade AVID students.
• On the TAKS social studies subtest, AVID students outperformed their non-AVID counterparts at 6 of 9 campuses testing 8th graders, 5 of 6 campuses testing 10th graders, and at one campus with 11th grade AVID students.
• For the TAKS science subtest, AVID students outperformed their non-AVID counterparts at 7 of 9 campuses testing AVID 8th graders and all campuses with AVID 10th or 11th grade students.
• AVID students also outperformed non-AVID economically disadvantaged students at each campus and grade level where they outperformed all non-AVID students. AVID students also outperformed their economically disadvantaged counterparts at 2 campuses in mathematics where they did not outperform all non-AVID students. At one campus where AVID students did not outperform all non-AVID students on reading, they matched the average scale score for the economically disadvantaged subgroup.
• A total of 74 AVID program participants took 105 AP examinations. Nineteen AVID students received a score of three or higher on 20 examinations.
Discussion
The AVID program served approximately 1,500 students who were economically disadvantaged, from groups traditionally underrepresented in four-year colleges, had the potential to become first generation college students, and were not enrolled in Pre-AP or AP courses prior to their participation in the program. AVID teachers and college tutors worked with students to ensure success in all classes and support performance on standardized tests. In general, AVID students outperformed their economically disadvantaged non-AVID and all non-AVID counterparts at the corresponding campus on each TAKS subtest. However, few AVID students participated in the corresponding Pre-AP or AP examination. High school students enrolled in AVID performed higher than non-AVID students in more grade levels and content areas than did AVID middle school students.
Recommendations
1. Expand program goals to include increased participation and improved performance on Pre-AP and AP examinations. Consider reserving a portion of program funds to purchase Pre-AP and AP test preparation materials and to provide assistance to participating students for examination fees.
2. Identify best instructional practices that are occurring in AVID classes at the high school level and employ those strategies at schools where AVID students are performing below their non-AVID counterparts.
22
TITLE V, PART A INNOVATIVE PROGRAMS, 2007–2008
Broad Candidates Program Description
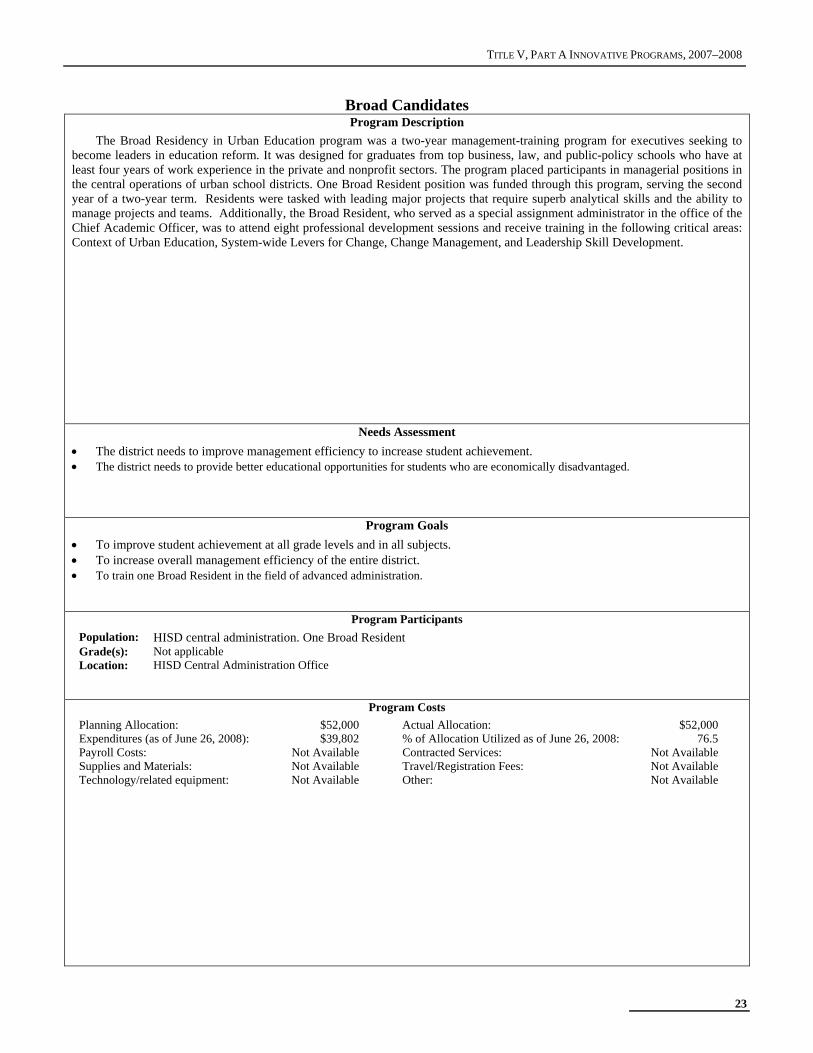
The Broad Residency in Urban Education program was a two-year management-training program for executives seeking to become leaders in education reform. It was designed for graduates from top business, law, and public-policy schools who have at least four years of work experience in the private and nonprofit sectors. The program placed participants in managerial positions in the central operations of urban school districts. One Broad Resident position was funded through this program, serving the second year of a two-year term. Residents were tasked with leading major projects that require superb analytical skills and the ability to manage projects and teams. Additionally, the Broad Resident, who served as a special assignment administrator in the office of the Chief Academic Officer, was to attend eight professional development sessions and receive training in the following critical areas: Context of Urban Education, System-wide Levers for Change, Change Management, and Leadership Skill Development.
Needs Assessment
• The district needs to improve management efficiency to increase student achievement. • The district needs to provide better educational opportunities for students who are economically disadvantaged.
Program Goals • To improve student achievement at all grade levels and in all subjects. • To increase overall management efficiency of the entire district. • To train one Broad Resident in the field of advanced administration.
Program Participants Population: HISD central administration. One Broad Resident Grade(s): Not applicable Location: HISD Central Administration Office
Program Costs Planning Allocation: $52,000 Actual Allocation: $52,000 Expenditures (as of June 26, 2008): $39,802 % of Allocation Utilized as of June 26, 2008: 76.5 Payroll Costs: Not Available Contracted Services: Not Available Supplies and Materials: Not Available Travel/Registration Fees: Not Available Technology/related equipment: Not Available Other: Not Available
23
HISD RESEARCH AND ACCOUNTABILITY
Findings
• The Broad Resident served the second year (2007–2008) of the two-year tenure in the office of the Chief Academic Officer. Official duties and responsibilities for the current school year were not provided.
• During the 2006–2007 school year, the Broad Resident served in the Business Operations Department and was eventually relocated to the Strategic Partnerships Department.
• Working in the Business Operations Department, the Resident was responsible for organizing training provided to School Business Managers within HISD, administering an Energy Conservation project, developing a strategic plan for Facilities Operations, assisting in the budgeting process, and preparing an Emergency Preparedness project. The Resident also served as Project Manager for the Connect-ED telephone notification system, an automated phone system utilized to deliver important messages to employees and parents, while working in Business Operations.
• While working in the Strategic Partnerships department, the Broad Resident promoted HISD’s strategic plan on safety during collaboration with representatives from Houston’s Metropolitan Transit Authority of Harris County, Texas; and continued work with the Connect-ED telephone notification system and School Business Managers.
• Additional responsibilities and duties performed by the Broad Resident were not provided for this report. • Requests for documentation of program implementation were made to program administrators; however, no documentation of
program activities was provided.
Discussion The Broad Resident program is designed to improve student academic achievement by improving business operations within
HISD by providing the district with an individual who has demonstrated success in the private sector and through personal academic achievement. Documentation of the roles and responsibilities played by the Resident was limited, and documentation of improvements within HISD realized on behalf of the Broad Resident was not provided. Documentation of all major projects involving the Resident must be provided to evaluate their overall impact on student achievement.
Recommendation Program administrator and Broad Resident must increase communication and planning to ensure this position has a measurable linkage to student academic achievement.
24
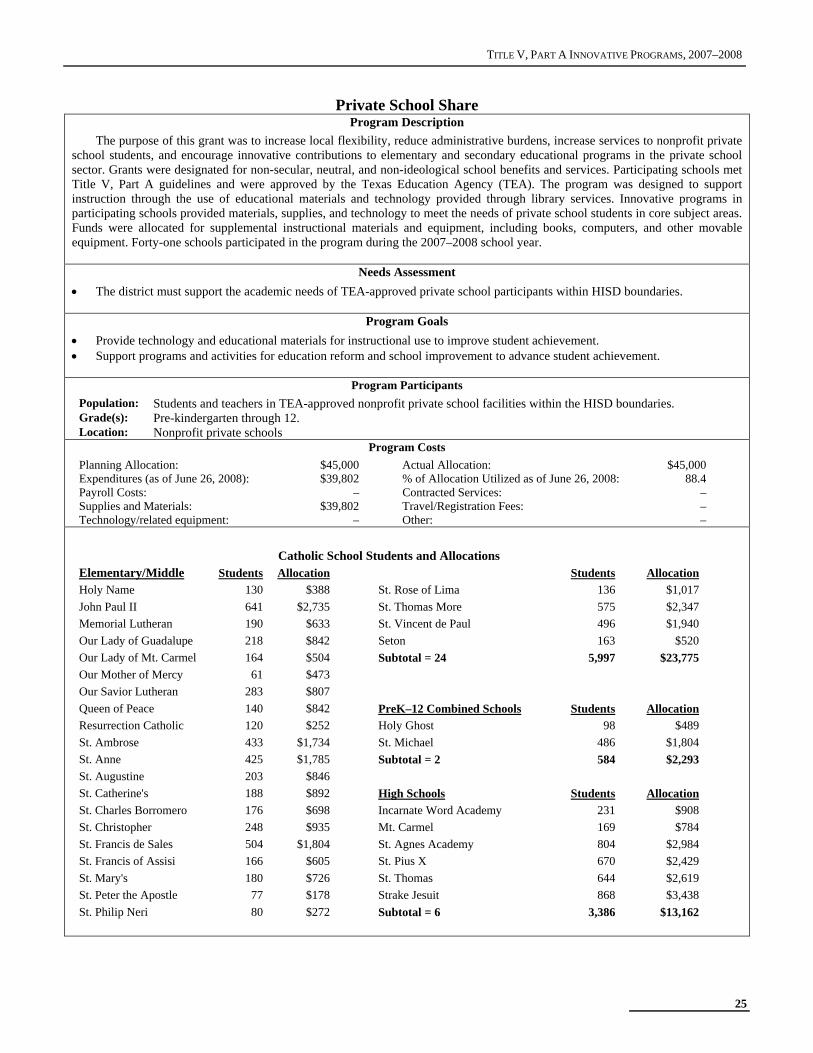
TITLE V, PART A INNOVATIVE PROGRAMS, 2007–2008
Private School Share Program Description
The purpose of this grant was to increase local flexibility, reduce administrative burdens, increase services to nonprofit private school students, and encourage innovative contributions to elementary and secondary educational programs in the private school sector. Grants were designated for non-secular, neutral, and non-ideological school benefits and services. Participating schools met Title V, Part A guidelines and were approved by the Texas Education Agency (TEA). The program was designed to support instruction through the use of educational materials and technology provided through library services. Innovative programs in participating schools provided materials, supplies, and technology to meet the needs of private school students in core subject areas. Funds were allocated for supplemental instructional materials and equipment, including books, computers, and other movable equipment. Forty-one schools participated in the program during the 2007–2008 school year.
Needs Assessment • The district must support the academic needs of TEA-approved private school participants within HISD boundaries.
Program Goals • Provide technology and educational materials for instructional use to improve student achievement. • Support programs and activities for education reform and school improvement to advance student achievement.
Program Participants Population: Students and teachers in TEA-approved nonprofit private school facilities within the HISD boundaries. Grade(s): Pre-kindergarten through 12. Location: Nonprofit private schools
Program Costs Planning Allocation: $45,000 Actual Allocation: $45,000 Expenditures (as of June 26, 2008): $39,802 % of Allocation Utilized as of June 26, 2008: 88.4 Payroll Costs: – Contracted Services: – Supplies and Materials: $39,802 Travel/Registration Fees: – Technology/related equipment: – Other: –
Catholic School Students and Allocations
Elementary/Middle Students Allocation Students AllocationHoly Name 130 $388 St. Rose of Lima 136 $1,017 John Paul II 641 $2,735 St. Thomas More 575 $2,347 Memorial Lutheran 190 $633 St. Vincent de Paul 496 $1,940 Our Lady of Guadalupe 218 $842 Seton 163 $520 Our Lady of Mt. Carmel 164 $504 Subtotal = 24 5,997 $23,775 Our Mother of Mercy 61 $473 Our Savior Lutheran 283 $807 Queen of Peace 140 $842 PreK–12 Combined Schools Students AllocationResurrection Catholic 120 $252 Holy Ghost 98 $489 St. Ambrose 433 $1,734 St. Michael 486 $1,804 St. Anne 425 $1,785 Subtotal = 2 584 $2,293 St. Augustine 203 $846 St. Catherine's 188 $892 High Schools Students AllocationSt. Charles Borromero 176 $698 Incarnate Word Academy 231 $908 St. Christopher 248 $935 Mt. Carmel 169 $784 St. Francis de Sales 504 $1,804 St. Agnes Academy 804 $2,984 St. Francis of Assisi 166 $605 St. Pius X 670 $2,429 St. Mary's 180 $726 St. Thomas 644 $2,619 St. Peter the Apostle 77 $178 Strake Jesuit 868 $3,438 St. Philip Neri 80 $272 Subtotal = 6 3,386 $13,162
25
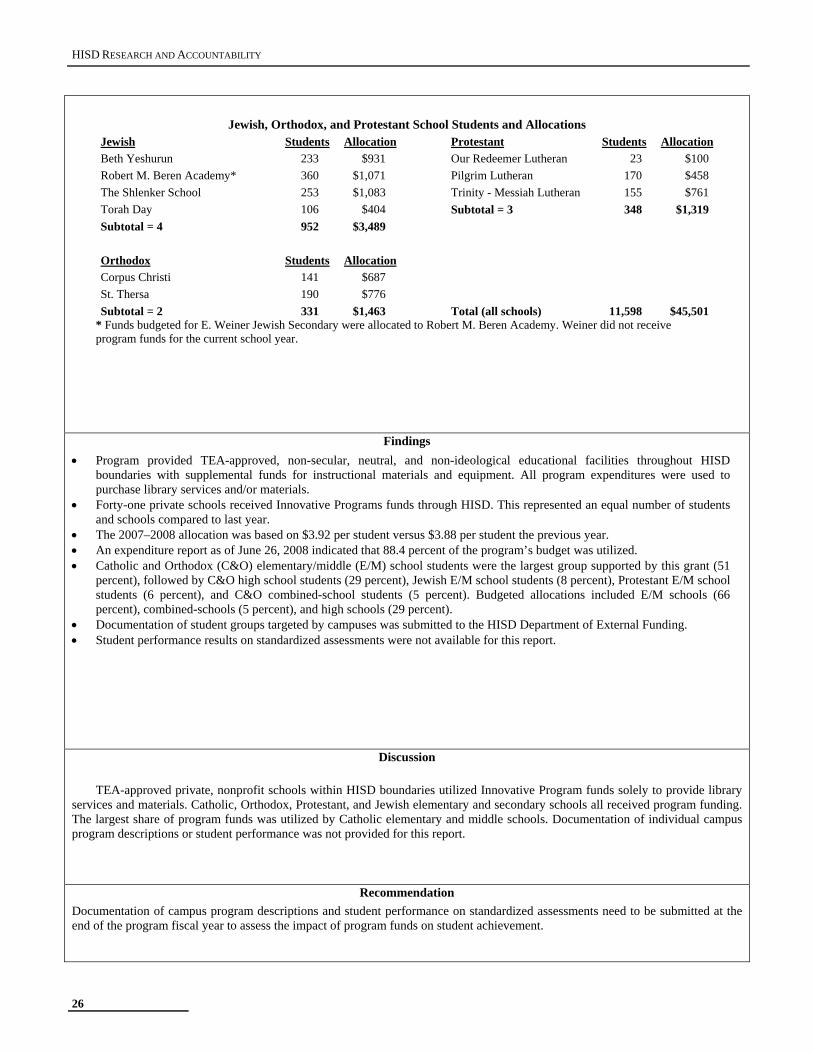
HISD RESEARCH AND ACCOUNTABILITY
Jewish, Orthodox, and Protestant School Students and Allocations
Jewish Students Allocation Protestant Students AllocationBeth Yeshurun 233 $931 Our Redeemer Lutheran 23 $100 Robert M. Beren Academy* 360 $1,071 Pilgrim Lutheran 170 $458 The Shlenker School 253 $1,083 Trinity - Messiah Lutheran 155 $761 Torah Day 106 $404 Subtotal = 3 348 $1,319 Subtotal = 4 952 $3,489 Orthodox Students Allocation Corpus Christi 141 $687 St. Thersa 190 $776 Subtotal = 2 331 $1,463 Total (all schools) 11,598 $45,501
* Funds budgeted for E. Weiner Jewish Secondary were allocated to Robert M. Beren Academy. Weiner did not receive program funds for the current school year.
Findings • Program provided TEA-approved, non-secular, neutral, and non-ideological educational facilities throughout HISD
boundaries with supplemental funds for instructional materials and equipment. All program expenditures were used to purchase library services and/or materials.
• Forty-one private schools received Innovative Programs funds through HISD. This represented an equal number of students and schools compared to last year.
• The 2007–2008 allocation was based on $3.92 per student versus $3.88 per student the previous year. • An expenditure report as of June 26, 2008 indicated that 88.4 percent of the program’s budget was utilized. • Catholic and Orthodox (C&O) elementary/middle (E/M) school students were the largest group supported by this grant (51
percent), followed by C&O high school students (29 percent), Jewish E/M school students (8 percent), Protestant E/M school students (6 percent), and C&O combined-school students (5 percent). Budgeted allocations included E/M schools (66 percent), combined-schools (5 percent), and high schools (29 percent).
• Documentation of student groups targeted by campuses was submitted to the HISD Department of External Funding. • Student performance results on standardized assessments were not available for this report.
Discussion TEA-approved private, nonprofit schools within HISD boundaries utilized Innovative Program funds solely to provide library
services and materials. Catholic, Orthodox, Protestant, and Jewish elementary and secondary schools all received program funding. The largest share of program funds was utilized by Catholic elementary and middle schools. Documentation of individual campus program descriptions or student performance was not provided for this report.
Recommendation Documentation of campus program descriptions and student performance on standardized assessments need to be submitted at the end of the program fiscal year to assess the impact of program funds on student achievement.
26
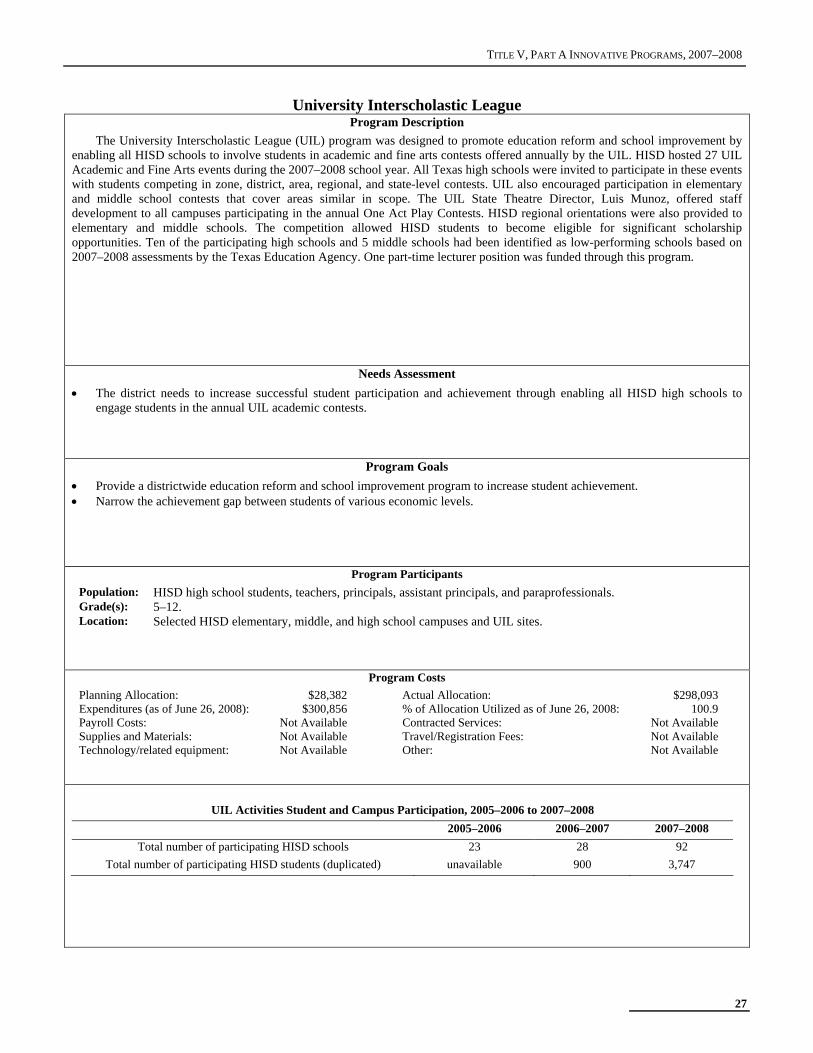
TITLE V, PART A INNOVATIVE PROGRAMS, 2007–2008
University Interscholastic League Program Description
The University Interscholastic League (UIL) program was designed to promote education reform and school improvement by enabling all HISD schools to involve students in academic and fine arts contests offered annually by the UIL. HISD hosted 27 UIL Academic and Fine Arts events during the 2007–2008 school year. All Texas high schools were invited to participate in these events with students competing in zone, district, area, regional, and state-level contests. UIL also encouraged participation in elementary and middle school contests that cover areas similar in scope. The UIL State Theatre Director, Luis Munoz, offered staff development to all campuses participating in the annual One Act Play Contests. HISD regional orientations were also provided to elementary and middle schools. The competition allowed HISD students to become eligible for significant scholarship opportunities. Ten of the participating high schools and 5 middle schools had been identified as low-performing schools based on 2007–2008 assessments by the Texas Education Agency. One part-time lecturer position was funded through this program.
Needs Assessment • The district needs to increase successful student participation and achievement through enabling all HISD high schools to
engage students in the annual UIL academic contests.
Program Goals • Provide a districtwide education reform and school improvement program to increase student achievement. • Narrow the achievement gap between students of various economic levels.
Program Participants Population: HISD high school students, teachers, principals, assistant principals, and paraprofessionals. Grade(s): 5–12. Location: Selected HISD elementary, middle, and high school campuses and UIL sites.
Program Costs Planning Allocation: $28,382 Actual Allocation: $298,093 Expenditures (as of June 26, 2008): $300,856 % of Allocation Utilized as of June 26, 2008: 100.9 Payroll Costs: Not Available Contracted Services: Not Available Supplies and Materials: Not Available Travel/Registration Fees: Not Available Technology/related equipment: Not Available Other: Not Available
U
IL Activities Student and Campus Participation, 2005–2006 to 2007–2008
2005–2006 2006–2007 2007–2008 Total number of participating HISD schools 23 28 92
Total number of participating HISD students (duplicated) unavailable 900 3,747
27
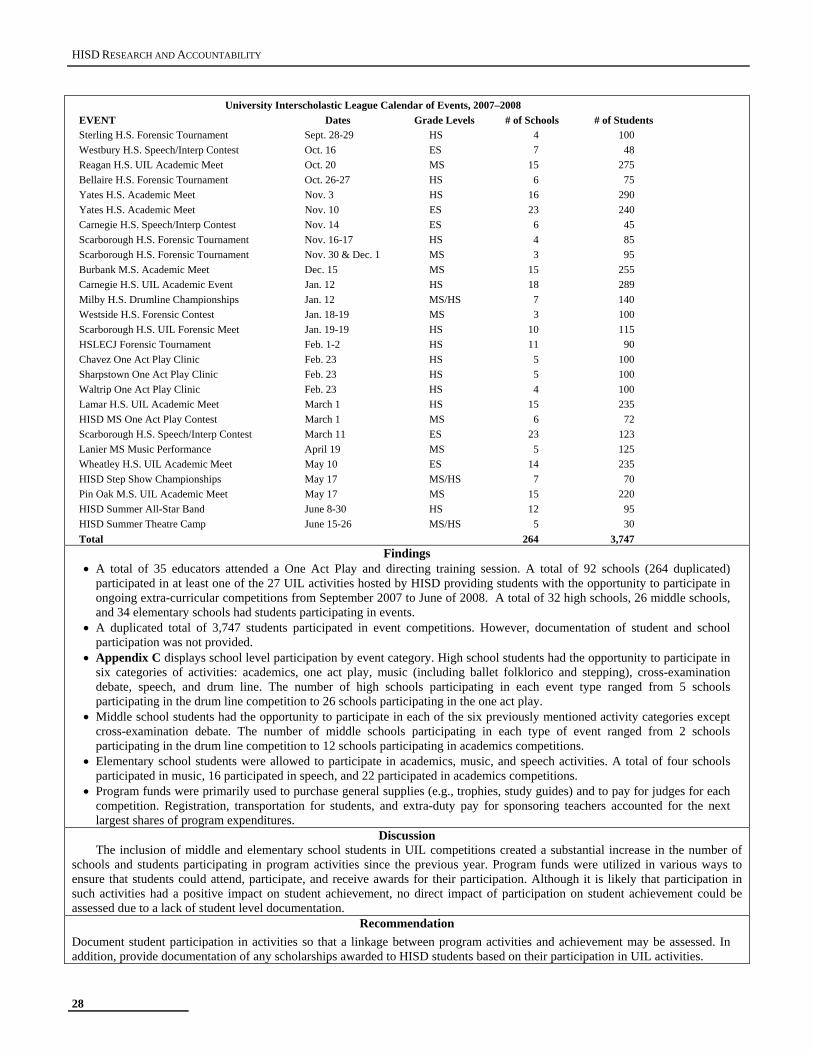
HISD RESEARCH AND ACCOUNTABILITY
UniverEVEN Dates Grade f Sc StuSterling Sept. 2 HS 4 100 Westbu Oct. 16 ES 7 48 Reagan Oct. 20 MS 15 275 Bellair Oct. 26- HS 6 75 Yates H Nov. 3 HS 16 290 Yates H Nov. 10 ES 23 240 Carneg Nov. 14 ES 6 45 Scarbor Nov. 16 HS 4 85 Scarbor Nov. 30 MS 3 95 Burban Dec. 15 MS 15 255 Carneg Jan. 12 HS 18 289 Milby H Jan. 12 MS/HS 7 140 Westsi Jan. 18- MS 3 100 Scarbor Jan. 19- HS 10 115 HSLEC Feb. 1- HS 11 90 Chavez Feb. 23 HS 5 100 Sharps Feb. 23 HS 5 100 Waltrip Feb. 23 HS 4 100 Lamar March HS 15 235 HISD M March MS 6 72 Scarbo March ES 23 123 Lanier April 1 MS 5 125 Wheatl May 10 ES 14 235 HISD S May 17 MS/HS 7 70 Pin Oa May 17 MS 15 220 HISD S June 8- HS 12 95 HISD S June 15 MS/HS 5 30 Total 264 3,747
sity Interscholastic League Calendar of Events, 2007–2008 T Levels # o hools # of dents H.S. Forensic Tournament 8-29 ry H.S. Speech/Interp Contest H.S. UIL Academic Meet
e H.S. Forensic Tournament 27 .S. Academic Meet .S. Academic Meet
ie H.S. Speech/Interp Contest ough H.S. Forensic Tournament -17 ough H.S. Forensic Tournament & Dec. 1 k M.S. Academic Meet ie H.S. UIL Academic Event
.S. Drumline Championships de H.S. Forensic Contest 19 ough H.S. UIL Forensic Meet 19 J Forensic Tournament 2 One Act Play Clinic
town One Act Play Clinic One Act Play Clinic H.S. UIL Academic Meet 1
S One Act Play Contest 1 rough H.S. Speech/Interp Contest 11 MS Music Performance 9 ey H.S. UIL Academic Meet tep Show Championships
k M.S. UIL Academic Meet ummer All-Star Band 30 ummer Theatre Camp -26
Findings
• A total of 35 educators attended a One Act Play and directing training session. A total of 92 schools (264 duplicated) participated in at least one of the 27 UIL activities hosted by HISD providing students with the opportunity to participate in ongoing extra-curricular competitions from September 2007 to June of 2008. A total of 32 high schools, 26 middle schools, and 34 elementary schools had students participating in events.
• A duplicated total of 3,747 students participated in event competitions. However, documentation of student and school participation was not provided.
• Appendix C displays school level participation by event category. High school students had the opportunity to participate in six categories of activities: academics, one act play, music (including ballet folklorico and stepping), cross-examination debate, speech, and drum line. The number of high schools participating in each event type ranged from 5 schools participating in the drum line competition to 26 schools participating in the one act play.
• Middle school students had the opportunity to participate in each of the six previously mentioned activity categories except cross-examination debate. The number of middle schools participating in each type of event ranged from 2 schools participating in the drum line competition to 12 schools participating in academics competitions.
• Elementary school students were allowed to participate in academics, music, and speech activities. A total of four schools participated in music, 16 participated in speech, and 22 participated in academics competitions.
• Program funds were primarily used to purchase general supplies (e.g., trophies, study guides) and to pay for judges for each competition. Registration, transportation for students, and extra-duty pay for sponsoring teachers accounted for the next largest shares of program expenditures.
Discussion The inclusion of middle and elementary school students in UIL competitions created a substantial increase in the number of
schools and students participating in program activities since the previous year. Program funds were utilized in various ways to ensure that students could attend, participate, and receive awards for their participation. Although it is likely that participation in such activities had a positive impact on student achievement, no direct impact of participation on student achievement could be assessed due to a lack of student level documentation.
Recommendation Document student participation in activities so that a linkage between program activities and achievement may be assessed. In addition, provide documentation of any scholarships awarded to HISD students based on their participation in UIL activities.
28
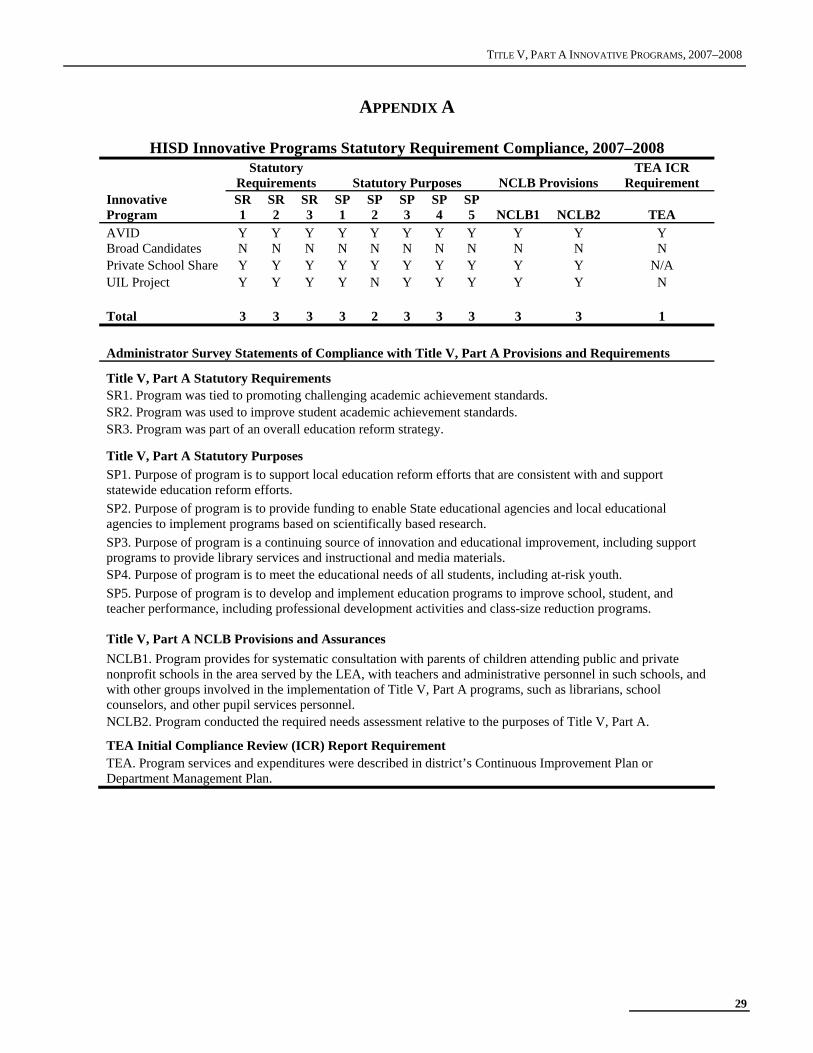
TITLE V, PART A INNOVATIVE PROGRAMS, 2007–2008
APPENDIX A
HISD Innovative Programs Statutory Requirement Compliance, 2007–2008
Statutory
Requirements Statutory Purposes NCLB Provisions TEA ICR
Requirement Innovative Program
SR1
SR2
SR3
SP1
SP2
SP3
SP4
SP5 NCLB1 NCLB2 TEA
AVID Y Y Y Y Y Y Y Y Y Y Y Broad Candidates N N N N N N N N N N N Private School Share Y Y Y Y Y Y Y Y Y Y N/A UIL Project Y Y Y Y N Y Y Y Y Y N Total 3 3 3 3 2 3 3 3 3 3 1 Administrator Survey Statements of Compliance with Title V, Part A Provisions and Requirements
Title V, Part A Statutory Requirements SR1. Program was tied to promoting challenging academic achievement standards. SR2. Program was used to improve student academic achievement standards. SR3. Program was part of an overall education reform strategy.
Title V, Part A Statutory Purposes SP1. Purpose of program is to support local education reform efforts that are consistent with and support statewide education reform efforts. SP2. Purpose of program is to provide funding to enable State educational agencies and local educational agencies to implement programs based on scientifically based research. SP3. Purpose of program is a continuing source of innovation and educational improvement, including support programs to provide library services and instructional and media materials. SP4. Purpose of program is to meet the educational needs of all students, including at-risk youth. SP5. Purpose of program is to develop and implement education programs to improve school, student, and teacher performance, including professional development activities and class-size reduction programs.
Title V, Part A NCLB Provisions and Assurances NCLB1. Program provides for systematic consultation with parents of children attending public and private nonprofit schools in the area served by the LEA, with teachers and administrative personnel in such schools, and with other groups involved in the implementation of Title V, Part A programs, such as librarians, school counselors, and other pupil services personnel. NCLB2. Program conducted the required needs assessment relative to the purposes of Title V, Part A.
TEA Initial Compliance Review (ICR) Report Requirement TEA. Program services and expenditures were described in district’s Continuous Improvement Plan or Department Management Plan.
29
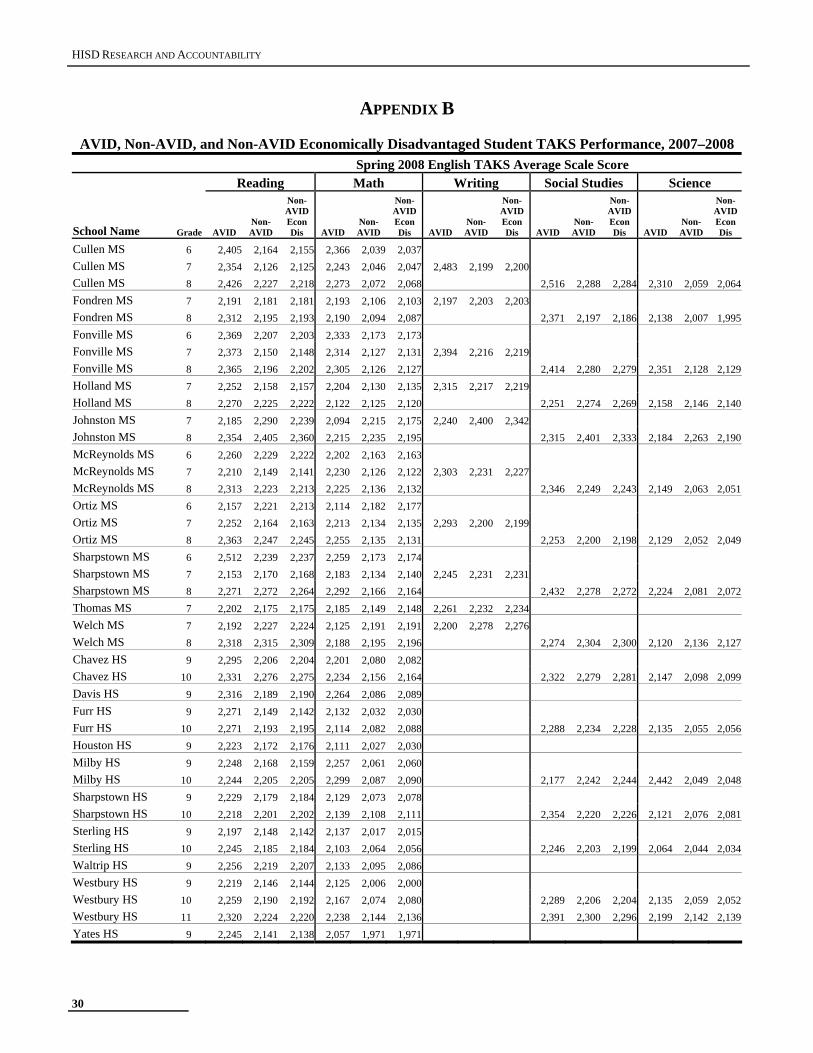
HISD RESEARCH AND ACCOUNTABILITY
APPENDIX B
AVID, Non-AVID, and Non-AVID Economically Disadvantaged Student TAKS Performance, 2007–2008 Spring 2008 English TAKS Average Scale Score Reading Math Writing Social Studies Science
School Name Grade AVID Non-AVID
Non-AVID Econ Dis AVID
Non-AVID
Non-AVID Econ Dis AVID
Non-AVID
Non-AVID Econ Dis AVID
Non-AVID
Non-AVID Econ Dis AVID
Non-AVID
Non-AVID Econ Dis
Cullen MS 6 2,405 2,164 2,155 2,366 2,039 2,037 Cullen MS 7 2,354 2,126 2,125 2,243 2,046 2,047 2,483 2,199 2,200 Cullen MS 8 2,426 2,227 2,218 2,273 2,072 2,068 2,516 2,288 2,284 2,310 2,059 2,064Fondren MS 7 2,191 2,181 2,181 2,193 2,106 2,103 2,197 2,203 2,203 Fondren MS 8 2,312 2,195 2,193 2,190 2,094 2,087 2,371 2,197 2,186 2,138 2,007 1,995Fonville MS 6 2,369 2,207 2,203 2,333 2,173 2,173 Fonville MS 7 2,373 2,150 2,148 2,314 2,127 2,131 2,394 2,216 2,219 Fonville MS 8 2,365 2,196 2,202 2,305 2,126 2,127 2,414 2,280 2,279 2,351 2,128 2,129Holland MS 7 2,252 2,158 2,157 2,204 2,130 2,135 2,315 2,217 2,219 Holland MS 8 2,270 2,225 2,222 2,122 2,125 2,120 2,251 2,274 2,269 2,158 2,146 2,140Johnston MS 7 2,185 2,290 2,239 2,094 2,215 2,175 2,240 2,400 2,342 Johnston MS 8 2,354 2,405 2,360 2,215 2,235 2,195 2,315 2,401 2,333 2,184 2,263 2,190McReynolds MS 6 2,260 2,229 2,222 2,202 2,163 2,163 McReynolds MS 7 2,210 2,149 2,141 2,230 2,126 2,122 2,303 2,231 2,227 McReynolds MS 8 2,313 2,223 2,213 2,225 2,136 2,132 2,346 2,249 2,243 2,149 2,063 2,051Ortiz MS 6 2,157 2,221 2,213 2,114 2,182 2,177 Ortiz MS 7 2,252 2,164 2,163 2,213 2,134 2,135 2,293 2,200 2,199 Ortiz MS 8 2,363 2,247 2,245 2,255 2,135 2,131 2,253 2,200 2,198 2,129 2,052 2,049Sharpstown MS 6 2,512 2,239 2,237 2,259 2,173 2,174 Sharpstown MS 7 2,153 2,170 2,168 2,183 2,134 2,140 2,245 2,231 2,231 Sharpstown MS 8 2,271 2,272 2,264 2,292 2,166 2,164 2,432 2,278 2,272 2,224 2,081 2,072Thomas MS 7 2,202 2,175 2,175 2,185 2,149 2,148 2,261 2,232 2,234 Welch MS 7 2,192 2,227 2,224 2,125 2,191 2,191 2,200 2,278 2,276 Welch MS 8 2,318 2,315 2,309 2,188 2,195 2,196 2,274 2,304 2,300 2,120 2,136 2,127Chavez HS 9 2,295 2,206 2,204 2,201 2,080 2,082 Chavez HS 10 2,331 2,276 2,275 2,234 2,156 2,164 2,322 2,279 2,281 2,147 2,098 2,099Davis HS 9 2,316 2,189 2,190 2,264 2,086 2,089 Furr HS 9 2,271 2,149 2,142 2,132 2,032 2,030 Furr HS 10 2,271 2,193 2,195 2,114 2,082 2,088 2,288 2,234 2,228 2,135 2,055 2,056Houston HS 9 2,223 2,172 2,176 2,111 2,027 2,030 Milby HS 9 2,248 2,168 2,159 2,257 2,061 2,060 Milby HS 10 2,244 2,205 2,205 2,299 2,087 2,090 2,177 2,242 2,244 2,442 2,049 2,048Sharpstown HS 9 2,229 2,179 2,184 2,129 2,073 2,078 Sharpstown HS 10 2,218 2,201 2,202 2,139 2,108 2,111 2,354 2,220 2,226 2,121 2,076 2,081Sterling HS 9 2,197 2,148 2,142 2,137 2,017 2,015 Sterling HS 10 2,245 2,185 2,184 2,103 2,064 2,056 2,246 2,203 2,199 2,064 2,044 2,034Waltrip HS 9 2,256 2,219 2,207 2,133 2,095 2,086 Westbury HS 9 2,219 2,146 2,144 2,125 2,006 2,000 Westbury HS 10 2,259 2,190 2,192 2,167 2,074 2,080 2,289 2,206 2,204 2,135 2,059 2,052Westbury HS 11 2,320 2,224 2,220 2,238 2,144 2,136 2,391 2,300 2,296 2,199 2,142 2,139Yates HS 9 2,245 2,141 2,138 2,057 1,971 1,971
30
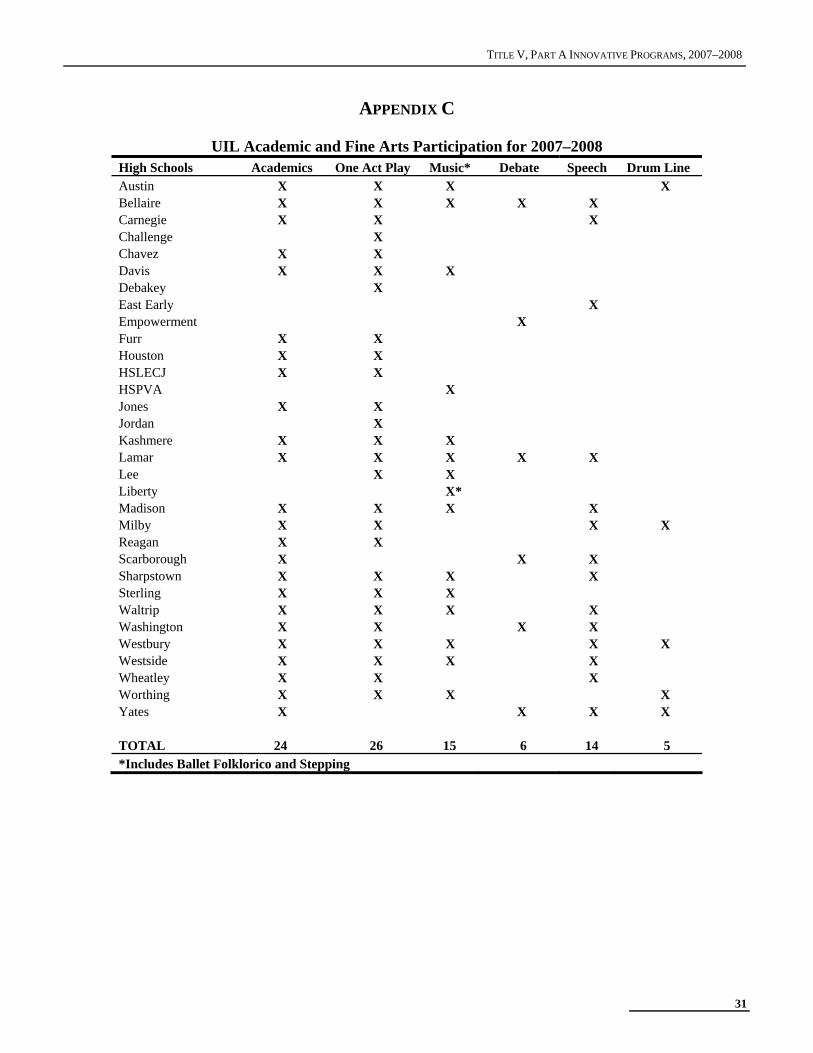
TITLE V, PART A INNOVATIVE PROGRAMS, 2007–2008
APPENDIX C
UIL Academic and Fine Arts Participation for 2007–2008 High Schools Academics One Act Play Music* Debate Speech Drum Line Austin X X X X Bellaire X X X X X Carnegie X X X Challenge X Chavez X X Davis X X X Debakey X East Early X Empowerment X Furr X X Houston X X HSLECJ X X HSPVA X Jones X X Jordan X Kashmere X X X Lamar X X X X X Lee X X Liberty X* Madison X X X X Milby X X X X Reagan X X Scarborough X X X Sharpstown X X X X Sterling X X X Waltrip X X X X Washington X X X X Westbury X X X X X Westside X X X X Wheatley X X X Worthing X X X X Yates X X X X TOTAL 24 26 15 6 14 5 *Includes Ballet Folklorico and Stepping
31
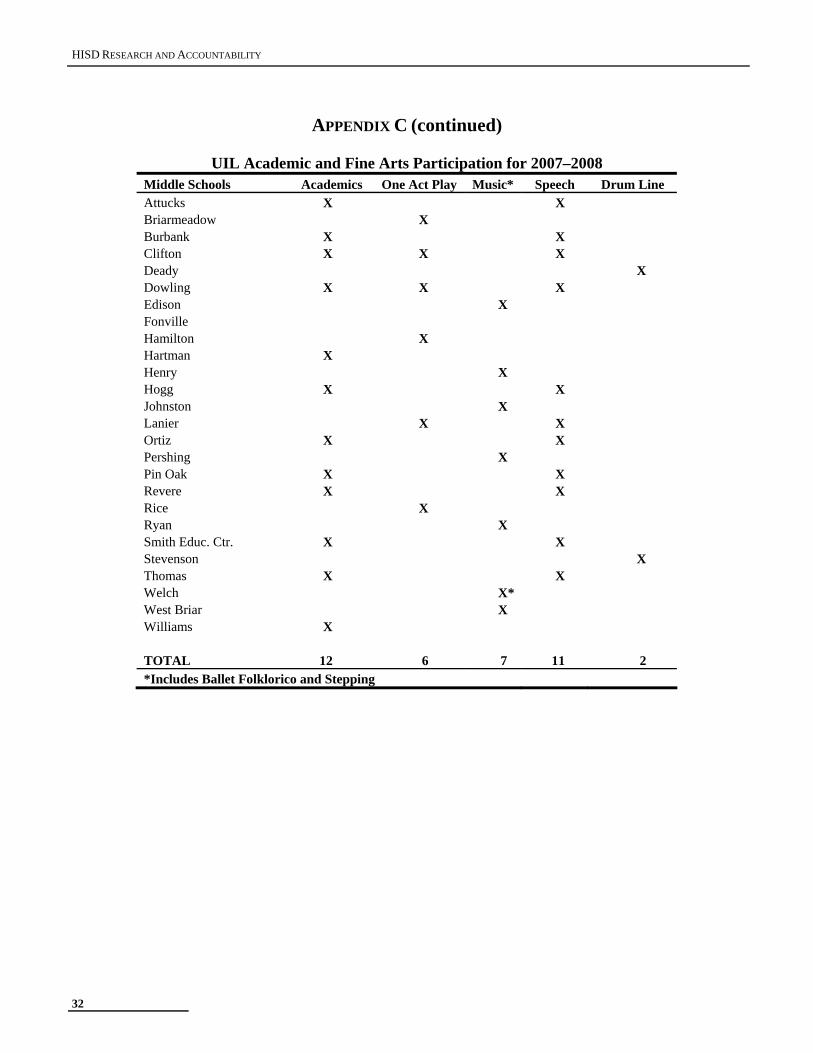
HISD RESEARCH AND ACCOUNTABILITY
APPENDIX C (continued)
UIL Academic and Fine Arts Participation for 2007–2008
Middle Schools Academics One Act Play Music* Speech Drum Line Attucks X X Briarmeadow X Burbank X X Clifton X X X Deady X Dowling X X X Edison X Fonville Hamilton X Hartman X Henry X Hogg X X Johnston X Lanier X X Ortiz X X Pershing X Pin Oak X X Revere X X Rice X Ryan X Smith Educ. Ctr. X X Stevenson X Thomas X X Welch X* West Briar X Williams X
TOTAL 12 6 7 11 2 *Includes Ballet Folklorico and Stepping
32
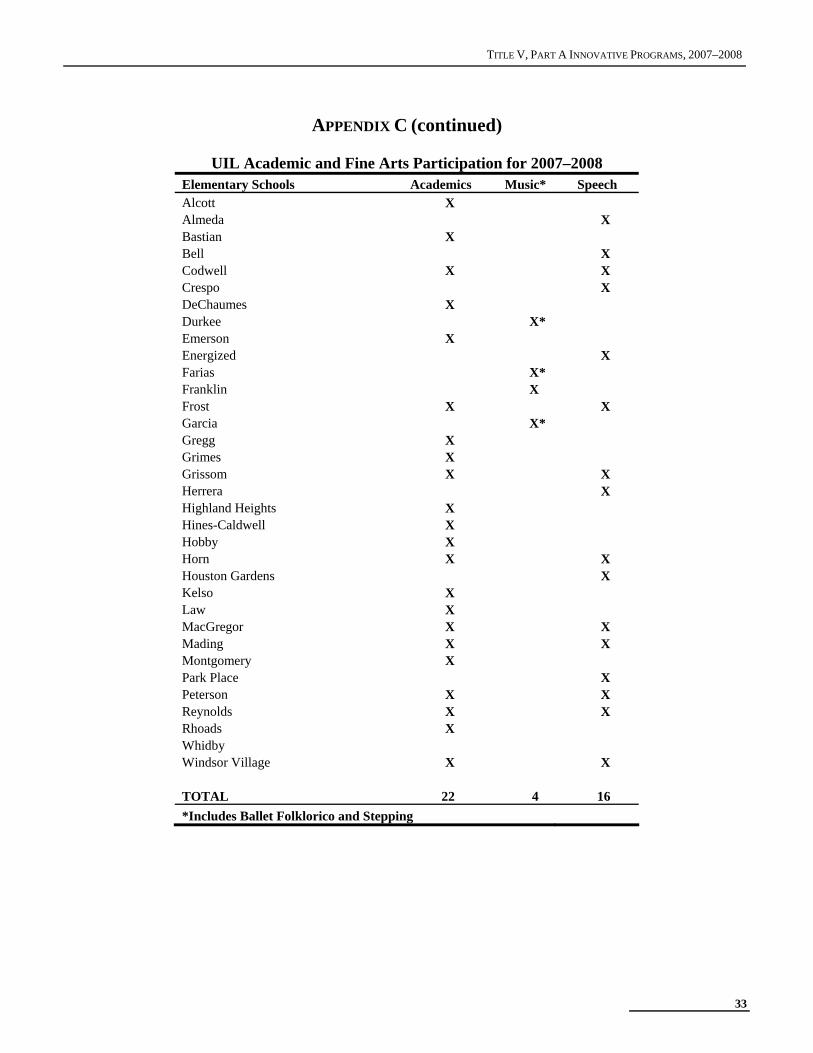
TITLE V, PART A INNOVATIVE PROGRAMS, 2007–2008
APPENDIX C (continued)
UIL Academic and Fine Arts Participation for 2007–2008
Elementary Schools Academics Music* Speech Alcott X Almeda X Bastian X Bell X Codwell X X Crespo X DeChaumes X Durkee X* Emerson X Energized X Farias X* Franklin X Frost X X Garcia X* Gregg X Grimes X Grissom X X Herrera X Highland Heights X Hines-Caldwell X Hobby X Horn X X Houston Gardens X Kelso X Law X MacGregor X X Mading X X Montgomery X Park Place X Peterson X X Reynolds X X Rhoads X Whidby Windsor Village X X
TOTAL 22 4 16 *Includes Ballet Folklorico and Stepping
33