Embed Size (px)
Citation preview
INNOVATIVE PRIMARY CARE CASE MANAGEMENT PROGRAMS OPERATING IN RURAL COMMUNITIES: CASE STUDIES OF THREE STATES
Working Paper No. 76 WORKING PAPER SERIES
Pam Silberman, JD, DrPH Stephanie Poley
Rebecca Slifkin, PhD
North Carolina Rural Health Research and Policy Analysis Program
Cecil G. Sheps Center for Health Services Research The University of North Carolina at Chapel Hill
January 3, 2003
This work was supported by Cooperative Agreement # 6-U1C-RH-00027-02-01 with the federal Office of Rural Health Policy.
TABLE OF CONTENTS Table Of Contents ......................................................................................................................... 2 Executive Summary ...................................................................................................................... 4 Background ................................................................................................................................... 5 Methods.......................................................................................................................................... 6 Case Studies: Florida................................................................................................................... 7
Background ............................................................................................................................ 7 Overview of Medicaid Managed Care Options ..................................................................... 8
HMO Model.................................................................................................................. 8 Medicaid Provider Access System (MediPass) .......................................................... 10 Children’s Medical Services (CMS)........................................................................... 12 Healthy Start ............................................................................................................... 13 Providers Service Network (PSN) .............................................................................. 13 Exclusive Provider Organization (EPO)..................................................................... 14
Disease-Focused Health Management ................................................................................. 14 Disease Management Organizations.................................................................................... 15
Identifying Program Participants ................................................................................ 16 Care Coordination....................................................................................................... 18 Patient Education ........................................................................................................ 18 Patient Contact and Monitoring .................................................................................. 19 Other Care Management Services .............................................................................. 21 Nurse Advice Lines..................................................................................................... 21 Hospitalizations and Emergency Room Utilization.................................................... 21 Primary Care Providers............................................................................................... 22 Data Systems............................................................................................................... 22 Finance Structure of DMO Initiative .......................................................................... 22 Improved Clinical Outcomes and Quality Improvement............................................ 25
Other Disease Management Contracts................................................................................. 28 Pfizer Health Solutions Initiative................................................................................ 28 Bristol-Myers Squibb (BMS)...................................................................................... 29 The University of Florida............................................................................................ 31
Evaluation of Medipass Compared to the HMO Program................................................... 31 Conclusions & Discussion About Rural Implications ......................................................... 31
Case Studies: North Carolina ................................................................................................... 33 History.................................................................................................................................. 33 Overview of Access II and III.............................................................................................. 34
Summary of the Eleven Access II and Two Access III Networks.............................. 35 Population-Based Health Management................................................................................ 35
Primary Care Providers............................................................................................... 40 Care Coordinators ....................................................................................................... 41
The Disease Management Process....................................................................................... 42 Identifying Medicaid Recipients in Need of Care Management Services .................. 42 Inpatient/ED Visits...................................................................................................... 42 Referrals...................................................................................................................... 42 Health Assessments .................................................................................................... 43
Patient Education ........................................................................................................ 43 Follow-up.................................................................................................................... 43 Addressing Psychosocial Needs ................................................................................. 44 Chart Reviews............................................................................................................. 44 Quality Improvement .................................................................................................. 44
Program Effectiveness ......................................................................................................... 45 Programmatic Challenges ........................................................................................... 46
Conclusions & Discussion About Rural Implications ......................................................... 46 Case Studies: Oklahoma............................................................................................................ 48
Overview of Sooner Care Program...................................................................................... 48 SoonerCare Choice .............................................................................................................. 50
Partial Capitation Payments........................................................................................ 51 Provider Relations....................................................................................................... 52 SoonerCare Helpline................................................................................................... 53 Nurse Advice Line ...................................................................................................... 53 Member Service Line.................................................................................................. 54 SoonerRide.................................................................................................................. 55 Care Management ....................................................................................................... 55
Quality Assurance/Quality Improvement Initiatives ........................................................... 57 Quality Improvement System for Managed Care (QISMC) and Incentive Payments 57 Consumer Assessment of Health Plan Satisfaction (CAHPS).................................... 58 Asthma Disease Management Initiative ..................................................................... 59 Healthplan Employer Data Information System (HEDIS) ......................................... 60 Physician Profiling...................................................................................................... 60
Indian Health Services (IHS) Initiatives .............................................................................. 60 Conclusions & Discussion About Rural Implications ......................................................... 61
Discussion & Conclusions .......................................................................................................... 62 Appendix I: DMO Contract Excerpts (Florida) ..................................................................... 65 Appendix II: Access II/III Performance Measures (North Carolina)................................... 70 Appendix III: Access II/III Performance Results For Programs In Effect For More Than One Year (North Carolina) ........................................................................................................ 71

4
EXECUTIVE SUMMARY Although Medicaid managed care programs have grown steadily in both rural and urban areas since the 1990s, states continue to report problems with health plan withdrawals. This instability of Medicaid health maintenance organizations (HMOs) has motivated some states to develop alternative managed care strategies for their Medicaid populations, including enhanced primary care case management (PCCM) programs which incorporate features developed for fully capitated managed care programs. Such alternative approaches have proven to be especially useful in rural communities, where it is more difficult to attract and maintain fully capitated managed care contracts. This study highlights strategies three states have used to provide enhanced benefits to Medicaid beneficiaries. Through in-depth case studies of each program, the paper provides an overview of each state’s program structure and illuminates the strengths and weakness of the various managed care models employed by Florida, North Carolina and Oklahoma. Florida and North Carolina have both created elaborate systems for disease management and case management, which are the center of their enhanced PCCM programs. Although the structure of each state’s program differs, they share the fundamental goals of reducing expenditures and improving patient outcomes. In North Carolina, care management is provided through provider-led community networks that participate in statewide disease management initiatives. Florida takes a different approach and contracts with Disease Management Organizations and other organizations that specialize in particular conditions. Both states have identified chronic conditions and/or high cost utilization areas to target through their disease management programs. Some of those initiatives include projects to reduce inappropriate emergency department (ED) and polypharmacy utilization, as well as case management for diabetes, asthma, HIV/AIDS, end-stage renal disease (ESRD), chronic heart failure, hypertension, Attention Deficit and Hyperactivity Disorder (ADHD), and/or hemophilia. Enrolled recipients are assigned care managers who provide health education, care coordination, and patient monitoring services. These care managers are especially important resources in small rural practices, where PCPs often have limited clinical or administrative support and may be a sole source of care for the community. Additionally, care managers often help to provide social service coordination for enrollees, which may be otherwise unavailable in small rural communities. Although neither Florida nor North Carolina’s programs were designed specifically for rural areas, recipients in these more isolated communities seem to benefit greatly from the additional clinicians and individualized care associated with the programs. Alternatively, Oklahoma has developed a Medicaid managed care program exclusively for its rural areas, which uses a partial capitation financial model. Unlike the fully capitated program operating in urban parts of the state, in the partial capitation system rural providers are only at risk for a limited range of primary care services – while receiving a steady stream of income. This regular source of revenue is particularly important in rural areas, where limited populations can make it challenging for providers to remain financially viable. Oklahoma’s Medicaid managed care program also features a nurse triage line and a capitated transportation system to serve rural communities, which serve to facilitate rural recipients’ access to health care. However, unlike North Carolina and Florida, Oklahoma focuses few resources on disease or case management, except for cases of individuals with special health needs. The limited scope of Oklahoma’s care coordination and disease management services may prevent the state from
5
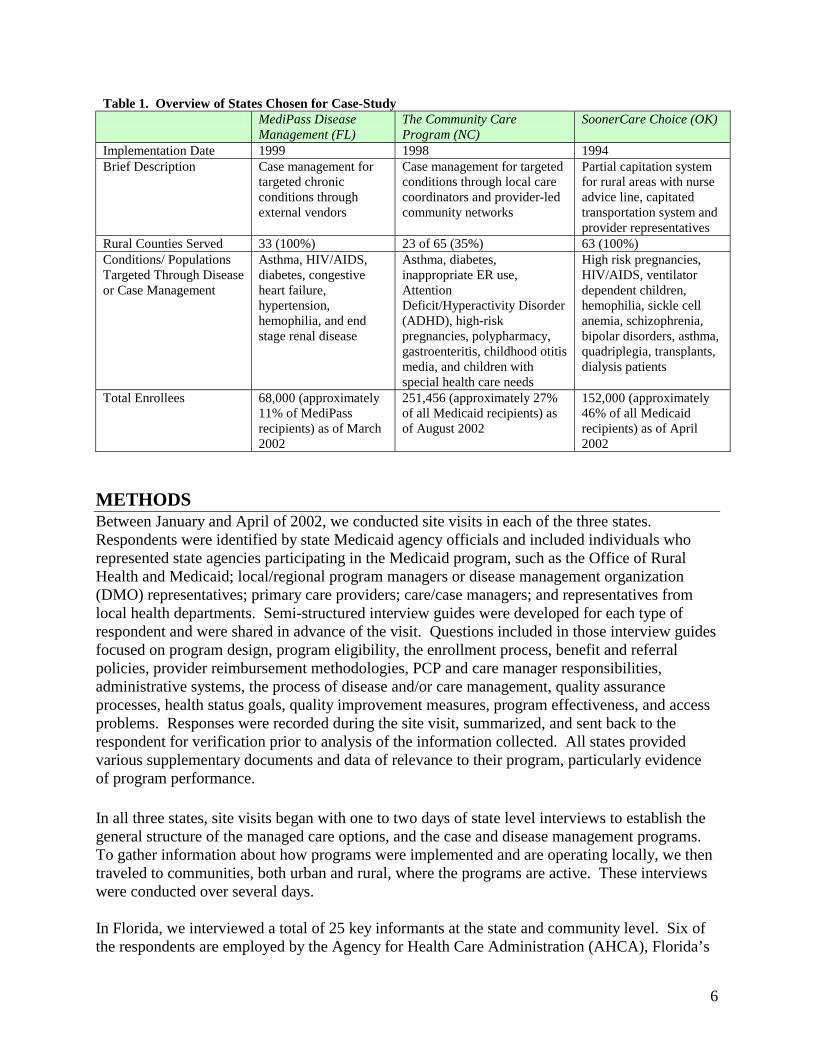
achieving improvements in health outcomes similar to those realized in other states that invest more heavily in case and disease management programs. While each of these Medicaid managed care programs offers unique benefits to rural recipients, there exist some inherent challenges in operating such programs. Case management and disease management programs offer promise in improving clinical outcomes and in reducing costs, however, it is still uncertain at what level of success these programs can perform. In North Carolina, respondents noted that the case management fee might not generate the necessary level of funding to support the program in some of the smaller communities because of their limited population base. Unlike the more urbanized areas of the state where thousands of recipients combine to create a substantial pool of money to hire staff and create program infrastructure, some rural communities may have too few enrollees to create the necessary funding base, a potential barrier to enrolling some of the most remote and sparsely populated rural areas. Further, evidence of cost savings and quality improvements cannot be observed in the short-term, making such case management programs particularly vulnerable during times of state financial crises. The inability to produce immediate results may also serve as a deterrent to other states considering the development of disease and case management programs, as it is difficult to justify the up-front costs associated with implementing such initiatives without immediate savings to balance them. Finally, it is apparent that case management is more challenging in rural areas. Because of geographic diffusion of patients, in-person visits are more time-consuming and resource intensive, but none of the states currently enhance case management fees for rural recipients. Even disease management programs that rely on telephone case management, such as Oklahoma’s and to some extent Florida’s, are problematic, as some Medicaid recipients do not have consistent access to telephones. BACKGROUND Between 1997 and 2001, the number of rural counties covered by Medicaid managed care programs increased by almost 30%.1 Primary care case management programs (PCCM) continue to be the most prevalent form of Medicaid managed care, but the number of rural counties with fully capitated plans also increased. However, health plan withdrawals in both rural and urban areas have led some states to develop alternative approaches, such as enhanced primary care case management models, to cover their Medicaid population. These models import some of the lessons from fully capitated managed care programs, including care coordination and quality improvement efforts, into more traditional PCCM models. Florida, North Carolina, and Oklahoma are three of the states that have taken this approach and the purpose of this study is to describe the structure of those programs, with particular attention to the impact these programs have on improving quality and access to Medicaid recipients in rural areas. While the paper provides in-depth analysis of each state’s program, Table 1 provides a simple comparison of the three programs to establish a general context.
1 Silberman P, Poley S, James K, Slifkin R. Tracking Medicaid Managed Care in Rural Communities: A Fifty-State Follow-Up. Health Affairs. July/August 2002;21(4):255-263.
6
Table 1. Overview of States Chosen for Case-Study MediPass Disease
Management (FL) The Community Care Program (NC)
SoonerCare Choice (OK)
Implementation Date 1999 1998 1994 Brief Description Case management for
targeted chronic conditions through external vendors
Case management for targeted conditions through local care coordinators and provider-led community networks
Partial capitation system for rural areas with nurse advice line, capitated transportation system and provider representatives
Rural Counties Served 33 (100%) 23 of 65 (35%) 63 (100%) Conditions/ Populations Targeted Through Disease or Case Management
Asthma, HIV/AIDS, diabetes, congestive heart failure, hypertension, hemophilia, and end stage renal disease
Asthma, diabetes, inappropriate ER use, Attention Deficit/Hyperactivity Disorder (ADHD), high-risk pregnancies, polypharmacy, gastroenteritis, childhood otitis media, and children with special health care needs
High risk pregnancies, HIV/AIDS, ventilator dependent children, hemophilia, sickle cell anemia, schizophrenia, bipolar disorders, asthma, quadriplegia, transplants, dialysis patients
Total Enrollees 68,000 (approximately 11% of MediPass recipients) as of March 2002
251,456 (approximately 27% of all Medicaid recipients) as of August 2002
152,000 (approximately 46% of all Medicaid recipients) as of April 2002
METHODS Between January and April of 2002, we conducted site visits in each of the three states. Respondents were identified by state Medicaid agency officials and included individuals who represented state agencies participating in the Medicaid program, such as the Office of Rural Health and Medicaid; local/regional program managers or disease management organization (DMO) representatives; primary care providers; care/case managers; and representatives from local health departments. Semi-structured interview guides were developed for each type of respondent and were shared in advance of the visit. Questions included in those interview guides focused on program design, program eligibility, the enrollment process, benefit and referral policies, provider reimbursement methodologies, PCP and care manager responsibilities, administrative systems, the process of disease and/or care management, quality assurance processes, health status goals, quality improvement measures, program effectiveness, and access problems. Responses were recorded during the site visit, summarized, and sent back to the respondent for verification prior to analysis of the information collected. All states provided various supplementary documents and data of relevance to their program, particularly evidence of program performance. In all three states, site visits began with one to two days of state level interviews to establish the general structure of the managed care options, and the case and disease management programs. To gather information about how programs were implemented and are operating locally, we then traveled to communities, both urban and rural, where the programs are active. These interviews were conducted over several days. In Florida, we interviewed a total of 25 key informants at the state and community level. Six of the respondents are employed by the Agency for Health Care Administration (AHCA), Florida’s
7
Medicaid Agency. The remaining interviews were with 11 Disease Management Organizations (DMOs) representatives (including five nurse care managers, five program managers, and one field representative); two representatives from Jackson Memorial Hospital, participating in the Pfizer initiative; one rural provider; two representatives from Children’s Medical Services (CMS); and three officials from the Office of Program Policy Analysis and Government Accountability (OPPAGA). Interviewed individuals represented three of the six contracted DMOs (Positive Health Care, Life Masters and Coordinated Care Solutions) and one of the 10 hospitals that are to be included in the Pfizer disease management initiative. In North Carolina, we interviewed key informants at the state and community level. We visited five communities, two in rural and three in urban counties. In total, we interviewed 25 individuals, including three people at the NC Division of Medical Assistance (DMA) and the Office of Research, Demonstrations and Rural Health Development (ORDRHD), seven care coordinators, four local program managers, seven practitioners (doctors and nurses), three health department directors and three DSS representatives.2 In Oklahoma, we visited five rural communities and Oklahoma City, where the state Medicaid agency, the Oklahoma Health Care Authority (OHCA), is located. We spoke with a total of 15 OHCA staff involved in the SoonerCare program. The staff was involved in program operation, care management, quality assurance, provider training and reimbursement, and the operation of the SoonerRide program. In addition, we spoke with staff in the contract agencies involved in operating the Helpline and the Nurse Advise line. We also spoke with six representatives for an Indian Health Service program, and providers and/or office managers in four rural practices. CASE STUDIES: FLORIDA Background Florida’s Medicaid managed care program began in 1984 in selected counties. At that time, Medicaid recipients were given the option of enrolling in fully capitated HMOs or remaining in the fee-for-service system. Since then, the state’s Medicaid managed care program has grown into a mandatory statewide system comprised of various managed care models. Currently, the managed care programs include contracts with fully capitated Health Maintenance Organizations (HMOs), a Primary Care Case Management Program (PCCM) called MediPass that includes a disease management initiative, a Provider Service Network (PSN), Children’s Medical Services (CMS), and Healthy Start. Within the year, the state expects to add an Exclusive Provider Organization (EPO) feature. System wide, more than 1.2 million Florida Medicaid recipients are enrolled in one of these managed care programs. The availability of the various managed care options varies by county. MediPass covers the entire state, operating in all 67 counties (33 of which are rural) and covering 49% of the state’s Medicaid recipients. Children’s Medical Services is available, on a voluntary
2 The numbers do not add up to the total because some individuals had more than one role (for example, several of the project directors were also care coordinators).
8
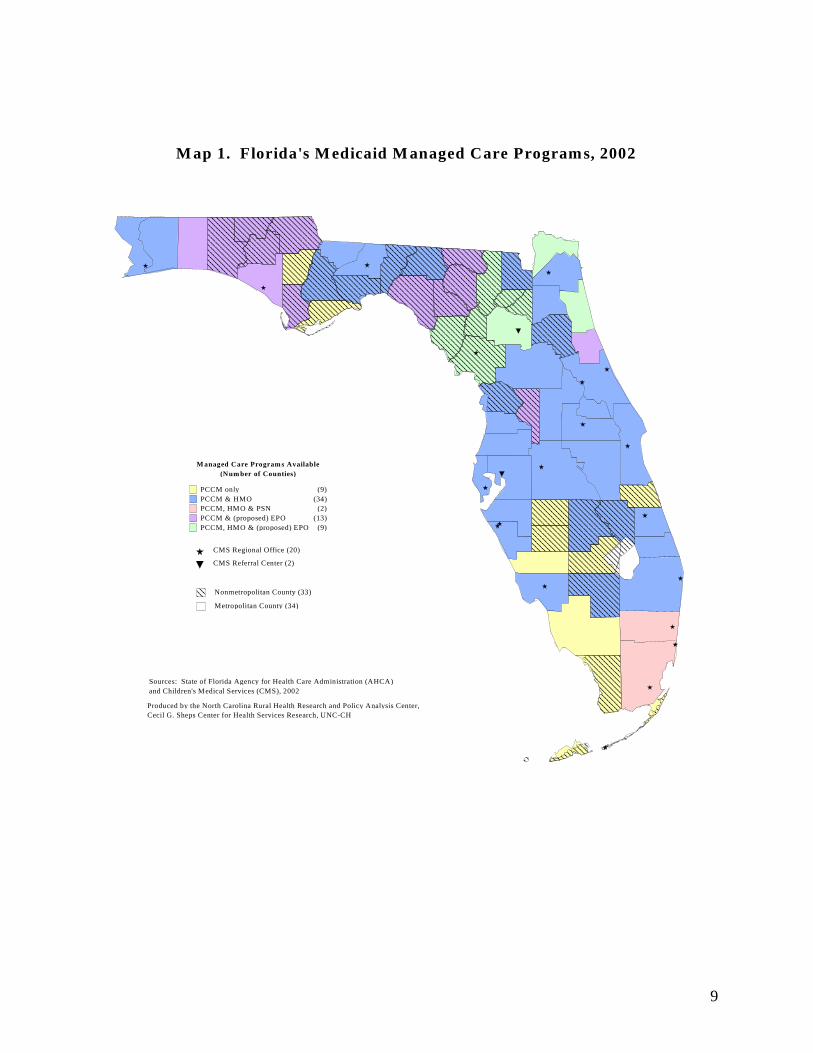
basis, to Medipass children with special health care needs statewide, and has an enrollment of approximately 26,000 kids. In 45 counties (16 rural), Medipass operates alongside a fully capitated program which offers HMO coverage to another 48% of the Medicaid population. The remainder of the Medicaid population is enrolled in the PSN program, which operates only in South Florida (Miami-Dade and Broward Counties). Approximately 1.5% of the population is enrolled in the PSN. Map 1 illustrates the availability of each program across the state. AHCA contracts with an enrollment broker to work with recipients in selecting one of the managed care options. In the 22 counties where Medipass is the only option, beneficiaries need only to choose their PCP. In counties where the HMO and/or PSN are also available, the enrollment broker assists the beneficiary in selecting both the type of Medicaid managed care program, and an HMO if they select the fully capitated program. Children with special health needs may voluntarily enroll in CMS in any county. Recipients are given 30 days from the date of their Medicaid eligibility to select one of the managed care options. If the beneficiary fails to make a choice, AHCA assigns the person to MediPass, an HMO, or the PSN. In the past, autoassignment into the different programs reflected the percentages of voluntary selections; however, recent legislation requires that AHCA now autoassign 100% of all recipients who have not selected a program into the HMO system in counties with at least two HMOs. For the purpose of autoassignment, the PSN is considered an HMO. In counties with only one HMO, half of the recipients are assigned to the HMO and the other half to MediPass. In counties with no HMOs, all recipients are assigned to MediPass and are matched to a provider based on their age, sex, and zip code. Recipients who lose their Medicaid eligibility are reenrolled with the same managed care program and provider if they regain eligibility within one year. Overview of Medicaid Managed Care Options The following summaries provide descriptions of the managed care programs offered to Florida Medicaid recipients. The primary focus of this study is the MediPass program because of the disease management initiatives. Only the fundamental structures of other programs are described. HMO Model Fully capitated managed care was the first managed care model offered to Florida’s Medicaid recipients. For the first six years, it was offered to beneficiaries on a voluntary basis in select areas of the state. As MediPass was introduced and expanded across the state, enrollment in managed care became mandatory where both models were available. Populations that are eligible to enroll in the HMO program include TANF families, pregnant women, children, older adults, and people with disabilities living in the 45 counties identified in Map 1 (including 20 nonmetro counties). Children with special health care needs (CSHCN) are contractually excluded from participation in the fully capitated program and are instead enrolled in the CMS network or MediPass.
9
M anaged Care Program s Available(Num ber of Counties)
PCCM only (9)PCCM & HMO (34)PCCM, HMO & PSN (2)PCCM & (proposed) EPO (13)PCCM, HMO & (proposed) EPO (9)
Nonmetropolitan County (33)
M ap 1. Florida's M edicaid M anaged Care Program s, 2002
CMS Regional Office (20)
Sources: State of Florida Agency for Health Care Administration (AHCA)and Children's Medical Services (CMS), 2002
CMS Referral Center (2)
Produced by the North Carolina Rural Health Research and Policy Analysis Center, Cecil G. Sheps Center for Health Services Research, UNC-CH
Metropolitan County (34)
10
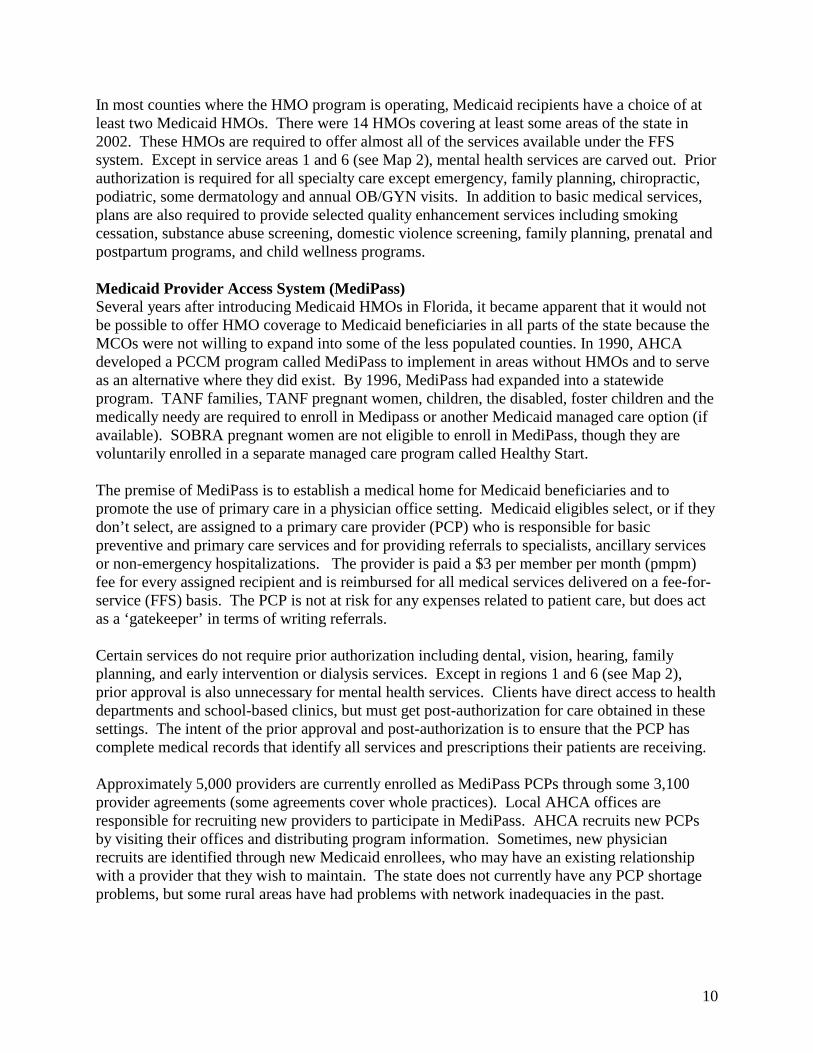
In most counties where the HMO program is operating, Medicaid recipients have a choice of at least two Medicaid HMOs. There were 14 HMOs covering at least some areas of the state in 2002. These HMOs are required to offer almost all of the services available under the FFS system. Except in service areas 1 and 6 (see Map 2), mental health services are carved out. Prior authorization is required for all specialty care except emergency, family planning, chiropractic, podiatric, some dermatology and annual OB/GYN visits. In addition to basic medical services, plans are also required to provide selected quality enhancement services including smoking cessation, substance abuse screening, domestic violence screening, family planning, prenatal and postpartum programs, and child wellness programs. Medicaid Provider Access System (MediPass) Several years after introducing Medicaid HMOs in Florida, it became apparent that it would not be possible to offer HMO coverage to Medicaid beneficiaries in all parts of the state because the MCOs were not willing to expand into some of the less populated counties. In 1990, AHCA developed a PCCM program called MediPass to implement in areas without HMOs and to serve as an alternative where they did exist. By 1996, MediPass had expanded into a statewide program. TANF families, TANF pregnant women, children, the disabled, foster children and the medically needy are required to enroll in Medipass or another Medicaid managed care option (if available). SOBRA pregnant women are not eligible to enroll in MediPass, though they are voluntarily enrolled in a separate managed care program called Healthy Start. The premise of MediPass is to establish a medical home for Medicaid beneficiaries and to promote the use of primary care in a physician office setting. Medicaid eligibles select, or if they don’t select, are assigned to a primary care provider (PCP) who is responsible for basic preventive and primary care services and for providing referrals to specialists, ancillary services or non-emergency hospitalizations. The provider is paid a $3 per member per month (pmpm) fee for every assigned recipient and is reimbursed for all medical services delivered on a fee-for-service (FFS) basis. The PCP is not at risk for any expenses related to patient care, but does act as a ‘gatekeeper’ in terms of writing referrals. Certain services do not require prior authorization including dental, vision, hearing, family planning, and early intervention or dialysis services. Except in regions 1 and 6 (see Map 2), prior approval is also unnecessary for mental health services. Clients have direct access to health departments and school-based clinics, but must get post-authorization for care obtained in these settings. The intent of the prior approval and post-authorization is to ensure that the PCP has complete medical records that identify all services and prescriptions their patients are receiving. Approximately 5,000 providers are currently enrolled as MediPass PCPs through some 3,100 provider agreements (some agreements cover whole practices). Local AHCA offices are responsible for recruiting new providers to participate in MediPass. AHCA recruits new PCPs by visiting their offices and distributing program information. Sometimes, new physician recruits are identified through new Medicaid enrollees, who may have an existing relationship with a provider that they wish to maintain. The state does not currently have any PCP shortage problems, but some rural areas have had problems with network inadequacies in the past.
11
12
75
9
10
11
8
34
6
M ap 2. Florida's M edicaid Service Areas, 2002
Source: State of Florida Agency for Health Care Administration, 2002
1 (Escambia, Okaloosa, Santa Rosa, Walton)
4 (Baker, Clay, Duval, Nassau, St.Johns, Flagler, Volusia)
2 (Bay, Franklin, Gulf, Holmes, Jackson, Washington, Calhoun, Gadsden, Jefferson, Leon, Liberty, Madison, Taylor, Wakulla)
3 (Alachua, Bradford, Columbia, Dixie, Gilchrist, Hamilton, Lafayette, Levy, Putnam, Suwannee, Union, Citrus, Hernando, Lake, Marion, Sumter)
8 (Charlotte, Collier, DeSoto, Glades, Hendry, Lee, Sarasota)
7 (Brevard, Orange, Osceola, Seminole)
6 (Hardee, Highlands, Hillsborough, Manatee, Polk)
5 (Pasco, Pinellas)
9 (Indian River, Martin, Okeechobee, Palm Beach, St.Lucie)
10 (Broward)
11 (Miami/Dade, Monroe)
Service Areas
Metropolitan County (34)
Nonmetropolitan County (33)
Metropolitan Status
Produced by the North Carolina Rural Health Research and Policy Analysis Center, Cecil G. Sheps Center for Health Services Research, UNC-CH
(Number of Counties)
Map 2. Florida’s Medicaid Service Areas, 2002
12
MediPass PCPs may include physicians specializing in general or family practice, internal medicine, pediatrics, and obstetrics/gynecology. Federally qualified health centers (FQHCs), county health departments, and rural health clinics (RHCs) may also serve as PCPs. There is a health department in every Florida county and in some of the most rural areas, the health department may be a major provider of services to Medicaid recipients. Advanced Registered Nurse Practitioners (ARNPs) and Physician Assistants (PAs) are permitted to serve as PCPs to clients who select them; however, beneficiaries are only autoassigned to these midlevel PCPs in three rural counties (Escambia, Bay, and Marion). With the exception of ARNPs and PAs, PCPs are limited to 1,500 MediPass enrollees, although the state has the authority to waive that limit in rural areas.3 ARNPs and PAs are limited to 750 MediPass enrollees. PCPs must make available, through answering services or on-call rotations, 24-hour care 7 days a week; they are not permitted to use the emergency room (ER) as routine after-hours coverage. In addition to their responsibilities for providing all primary care and assessing the need for referrals, PCPs are also required to coordinate with contractors participating in the MediPass disease management initiative. MediPass clients with certain chronic illnesses are eligible to participate in the disease management initiatives, which links clients with care managers specializing in specific chronic illnesses. These care managers counsel the recipient on how to better manage their condition and coordinate services for enrolled beneficiaries. This initiative is the primary focus of our study and is discussed in more detail later in the report. Children’s Medical Services (CMS) Children’s Medical Services (CMS) is Florida’s Title V program and has been operating since 1929, when it was called the Florida Commission for Crippled Children (FCCC). The program is administered by the Department of Health and was completely independent from Medicaid until 1996, when a network of providers and facilities for children with special health care needs (CSHCN) was developed and approved as a managed care option for CSHCN in the Medicaid program. The CMS program was designed to operate much like a PCCM program with more specialized providers and care managers. The current CMS network operates as a component of the existing MediPass program and like regular MediPass providers, CMS PCPs are paid a $3 monthly pmpm for each child they serve. All services are reimbursed on a FFS basis and PCPs are not at risk for any care required to treat their enrolled recipients. However, by legislative mandate, the program has been redesigned into a capitated model and will gradually be phased in to replace the current CMS program for Medicaid kids beginning in 2003. Currently, the system is built around 20 regional CMS offices and two referral centers (see Map 1). Each area office is administered by a medical director, who is a physician in the community, and other staff including care managers, nurses, administrators, and social workers. The regional offices are the first point of contact for new Medicaid enrollees who elect CMS as their
3 Although the state has had the authority to waive the maximum enrollees per PCP in rural areas, AHCA officials reported that they have not yet needed to do so.
13
managed care plan. Nurses in these regional offices screen newly enrolled children to determine if the child has special needs which qualify for CMS. If a child is found to qualify for CMS, they select or are assigned to a PCP in their local community who authorizes all services and referrals. CMS providers must be board certified in their specialty, have experience with CSHCN, and agree to participate as a PCP in the Medipass program. Children are assigned a care manager to help coordinate the child’s medical and psychosocial needs. The care manager is typically a nurse but may be a social worker if the child has significant psychosocial problems. Care managers work out of the regional CMS office and are supposed to coordinate with the child’s PCP. However, we were told that it is often difficult to get the physicians to communicate with the care managers about changes in the child’s medical care. The care manager helps link the child to needed services, including transportation and counselors, assists in the development of a care plan with the help of the child’s family, and coordinates with the child’s PCP. The care manager may help to identify specialists and arrange transportation, however the PCP must ultimately approve all referrals and medical services. If disease management is appropriate for the child, the care manager will coordinate with the physician treating the condition to develop a disease action plan for the child and family to follow. The care manager maintains regular contact with the child and family to monitor the child’s compliance with care plans and overall health status; more intensive cases require more frequent communication. Healthy Start Healthy Start is a voluntary program for pregnant women and infants operated by local Healthy Start Coalitions. The program is available to all Florida residents, however a new partnership between Healthy Start Coalitions and AHCA provides funding for Healthy Start services provided to SOBRA pregnant Medicaid recipients. The additional services available through Healthy Start include risk screenings, breastfeeding counseling, childbirth classes, coordination of community services, and various counseling/health education services related to smoking cessation, nutrition, family planning, and parenting. Healthy Start participants select a PCP from a panel of Medicaid enrolled providers who agree to meet specified standards of prenatal care. The goal is to enroll eligible recipients with a Medicaid PCP within 30 days of eligibility and to promote continuity of care during pregnancy. PCPs are reimbursed on a FFS basis and the local Healthy Start Coalitions are paid a $12 pmpm administrative fee to compensate the agencies for care coordination, care management, and some counseling services. Providers Service Network (PSN) The South Florida Community Care Network is an integrated health care delivery system owned and operated by Florida hospitals and physician groups. It was implemented in Broward and Miami-Dade counties in 2001 and is the only one of four proposed PSNs that has been implemented to date. Populations eligible for enrollment include families, pregnant women, children, the disabled, foster children and the medically needy.

14
Like MediPass, beneficiaries select or are assigned to a PCP who is responsible for managing primary care. Most out-of-network care provided to enrollees is paid for and must be pre-authorized by the PSN. The PCPs in the PSN are paid $3 pmpm for each assigned member and an additional monthly administrative fee is also paid to the PSN. Services are delivered on a FFS basis and individual providers are not at any financial risk. However, the PSN must demonstrate cost savings, a percentage of which they may keep, or they must repay 50% of the administrative fees paid by AHCA. Exclusive Provider Organization (EPO) At the time of our visit, the EPO initiative was not yet operational. In March of 2002, AHCA released a Request for Proposals (RFP) to begin an Exclusive Provider Organization (EPO) program for 22 counties (half of which are rural) that currently have limited managed care options to Medicaid recipients because of a lack of HMO coverage. In theory, the EPO arrangement will work much like an HMO, but with less stringent financial solvency requirements than an HMO. By April of 2002, one licensed EPOs had demonstrated interest in covering these areas, but no contracts had been finalized at the time of our study. Disease-Focused Health Management In 1997, the Florida legislature directed AHCA to design and implement a disease management initiative to improve health outcomes and reduce Medicaid spending on a number of chronic and high cost conditions. AHCA was instructed by the Legislature to "select methods for implementing the program that included best practices, prevention strategies, clinical-practice improvement, clinical interventions and protocols, outcomes research, information technology, and other tools.”4 In response, the Agency convened a task force to develop a plan for disease management for the Medicaid population. The goals were to promote and measure improvements in health outcomes, reduce inpatient hospitalization and emergency room visits, and ultimately reduce program costs. Using utilization data, AHCA identified the highest cost conditions. This information was used to decide which conditions to target. AHCA was also involved in developing program recommendations, which were presented to the legislature and adopted. The disease management program began in 1999. AHCA’s approach in implementing the disease management initiative is constantly evolving. At the time of our visit, the state contracted with external organizations specializing in disease management to provide services to MediPass population. Initially, the contracts were limited to licensed Disease Management Organizations (DMOs), which specialized and focused on a single condition for a defined geographic area. To participate, the DMOs were required to sign a contract guaranteeing a minimum of 6.5% cost savings to the state. More recently, the state has expanded their approach and negotiated with other types of contractors, including the University of Florida, Pfizer Health Solutions and Bristol-Myers Squibb, to coordinate disease management services for certain geographic areas and population segments. Unlike the DMOs, these contractors are obligated to actively manage multiple conditions as defined by their contracts. Pfizer Health Solutions and Bristol Myers Squibb are
4 http://www.fdhc.state.fl.us/Medicaid/Disease_Management/index.shtml

15
also required to guarantee certain cost savings to the state. Table 2 describes each of the contracts that were active in the Spring of 2002. Currently, seven conditions are being targeted for case management including diabetes, HIV/AIDS, asthma, hypertension, hemophilia, congestive heart failure (CHF) and end stage renal disease (ESRD). Projects for additional conditions, including sickle cell anemia, auto immune disorders, and mental health problems, are either in development or in the initial stages of implementation. Table 2. Disease Management Contracts Disease Contractor(s) Service Area # Rural
Counties Initiated
Coordinated Care Solutions1 Statewide 33 May 1999 Pfizer Health Solutions* Statewide 33 December 2001 Diabetes Bristol-Myers Squibb* Broward, Dade, Lee,
Manatee, Pasco 0
Not yet implemented
Hemophilia Care Mark Areas 1-6 28 September 1999 Positive Healthcare Statewide except
Broward and Dade 33 July 1999
HIV/AIDS South Florida Community Care Network
Dade and Broward 0 Not yet implemented
Life Masters Areas 1-7 28 September 2000 Chronic Heart Failure Pfizer Health Solutions* Statewide 33 December 2001 End Stage Renal Disease (ESRD)
Renal Management System Disease Management, Inc.
Statewide 33 September 2000
Asthma Pfizer* Statewide 33 December 2001 Hypertension Pfizer* Statewide 33 December 2001 Mental Health Bristol-Myers Squibb* Broward, Dade, Lee,
Manatee, Pasco 0
Not yet implemented
Auto Immune Disorders
University of Florida Statewide 33 Not yet implemented
1 Contract terminated in June 2002. *Care not delivered directly by contractor. Pfizer initiative is a cooperative agreement with 10 major hospitals and a call center to provide care management. Recipients in the Bristol-Myers Squibb project receive care through Federally Qualified Health Centers (FQHCs). Disease Management Organizations In March 2002, AHCA had contracts with five disease management organizations that managed approximately 14,000 MediPass beneficiaries with at least one of the seven targeted chronic conditions. If the recipient is identified as having comorbidities, AHCA assigns the person to the DMO responsible for the individual’s most life threatening condition, according to an established disease hierarchy. The order of the hierarchy, from most to least life threatening is:
• HIV/AIDS • Hemophilia • ESRD • CHF/Hypertension • Diabetes • Asthma
Thus, for example, a recipient with HIV/AIDS may also have diabetes or hypertension, but is assigned to the DMO responsible for HIV/AIDS. The DMOs have no contractual obligation to

16
address the co-occurring conditions, nor are they provided additional resources to provide such additional care. 5, 6 As Table 2 demonstrates, the DMOs are each responsible for certain service areas of the state according to their contracts. AHCA has divided the state into standard service areas for the purpose of these contracts, and those regions are defined in Map 2. Currently only one of the DMOs covers the entire state of Florida. Coordinated Care Solutions, a DMO specializing in diabetes care, initially served the entire state but gradually conceded portions of its service area until June of 2002 when the contract was terminated entirely. We were told that the Bristol-Myers Squibb and Pfizer initiatives would assume the beneficiaries who had been under the care of CCS. While there is clearly overlap in the service areas of these five DMOs, there is essentially no coordination or communication between the agencies because they do not manage the same clients. Each DMO has a different approach to care management, which varies from electronic or telephonic contact with patients to routine in-person visits. Each DMO’s contract specifies AHCA’s expectations for care management from the DMO; however there is not a uniform care management process prescribed by AHCA. According to the 1915(b) waiver renewal for MediPass, the agency deliberately avoided such instruction because it was their intention to test the various care management models by contracting with vendors using varied approaches. This would enable the state to assess the strengths and weaknesses of each model. Identifying Program Participants Typically, beneficiaries are initially identified for participation in the disease management initiative through claims data. The Medicaid Agency has developed algorithms that detect recipients who might be eligible for disease management by certain combinations of ICD-9 (diagnosis) and NDC (drug therapy) codes. MediPass recipients meeting the criteria for one of the targeted conditions are enrolled in the disease management program and assigned to the contractor appropriate for the conditions and geographic area in which the person lives. Occasionally, recipients are referred to the DMOs by their PCPs or a hospital discharge planner if a medical encounter reveals the presence of one of the seven targeted conditions.
5 OPPAGA. November 2001. Expected Medicaid Savings Unrealized; Performance, Cost Information Not Timely for Legislative Purposes. Report No.01-61. 6 OPPAGA. May 2001. Medicaid Disease Management Initiative Sluggish, Cost Savings Not Determined, Design Changes Needed. Report No. 01-27.
Good Policy? The performance audit branch of the Florida legislature, Office of Program Policy Analysis and Government Accountability (OPPAGA) has criticized AHCA’s policy for DMO management of comorbidities in two 2001 reports. 5, 6 Their concern is whether patients receive adequate education, resources, and medical monitoring for secondary chronic conditions. Our discussions with representatives from Positive Healthcare and Life Masters, DMOs that care for many beneficiaries with multiple illnesses, revealed that while DMOs may not have contractual obligations to manage secondary conditions, they typically try to address other health issues as they arise. The care managers are nurses that have training and experience caring for health problems that commonly accompany the disease they are helping to coordinate. Further, these DMOs recognized an inability to manage the designated condition absent management of the comorbidities.
17
Representatives of the DMOs told us that the best way to identify patients was through “real time” hospital emergency room or admission records, as it was easier to then locate the individual and educate them about the disease management initiative. Waiting for the state to “verify” that a Medicaid recipient had a particular condition through the claims data caused problems—because by the time the claims data reached the state system, it could be much more difficult to locate the patient. The DMOs that we interviewed described different procedures to address this problem. Life Masters, the DMO focusing on congestive heart failure, waits until the state verifies that a patient has congestive heart failure before enrolling the patients. In contrast, Positive Health Care, the HIV/AIDS DMO begins to immediately offer services and then work with AHCA to enroll the clients retroactively based on lab test results or referrals. On a monthly basis, each contractor is sent a list of their newly enrolled clients. The recipient is immediately sent written notification of their eligibility for disease management benefits and is given a 30-day period during which they may voluntary disenroll (an opt-out period). The beneficiary’s primary care provider (PCP) is also notified of the patient’s eligibility for disease management services by the DMO. Within three months of enrollment in MediPass, the PCP is expected to conduct a health assessment for all new MediPass clients. The state provides PCPs with a standardized form for the purpose. At the end of the 30-day opt-out period, the contractor can begin contacting the recipient by telephone or home visits. Eligible recipients can disenroll at any time. Each of the DMOs we interviewed described difficulty finding newly enrolled clients. In part, this is due to the transient nature of the population and the frequent problem of recipients not having working telephones. The care managers and case finders with whom we talked, estimated that between 20 to 40% of their clients did not have working telephones; however these estimates were not supported by any official documentation. Some of the contractors engage in intense ‘case finding’ to locate their new clients and conduct an assessment. This case finding may involve records reviews (conducting property searches, obtaining incarceration lists), home visits and visits to provider offices. For some conditions, a nurse manager may also visit the enrolled recipient’s primary care provider’s office and do a chart review to get a more complete case history on the client, including a detailed account of the patient’s prescribed medication regimen or a history of lab values. Finding rural recipients can be a particular challenge because the case finder must drive to rather remote areas with no guarantee of finding the person, possibly having to return if the client is not at home or having to follow a new trail of clues. Searching for recipients in urban areas is somewhat more efficient because the distances between clients is not as great, and often case finders can search for multiple clients at a time. Some of the DMOs told us that working with rural health departments and providers was an effective strategy in rural areas, as providers sometimes have more up-to-date contact information and may be willing to contact the DMO when the patient they are looking for shows up in the practice. However, the downside of this approach is that it requires a significant time investment to maintain these relationships, a commitment that some DMOs were less willing to make. Once the DMO contacts the recipient, they confirm that the recipient has the specified condition. We heard from some of the representatives of the DMOs that between 20% to 30% of the
18
recipients initially identified through claims data are not eligible for the disease management programs, either because they are children and enrolled in CMS, do not have the specific disease, or are no longer eligible for Medicaid. DMOs will assess the severity of the health problems for individuals properly enrolled in the DMO. Each DMO uses its own assessment tool. Several of the DMOs consider non-medical factors in their stratification of risk. For example, DMOs recognize that living circumstances and family stability may be important factors in adherence to care plans, thus these factors influence the client’s assessed risk status. Some DMOs conduct these severity assessments by telephone, but others find it is easier to assess psychosocial issues which affect a patient’s condition and care compliance by conducting home visits. However home visits are not feasible in some cases because the client may want to keep their illness confidential from their family or neighbors. DMOs must return the administrative fees for any individual that is ultimately determined to be ineligible for the disease management program. This provides a financial incentive for the DMO to quickly contact all eligibles to determine their eligibility for the program. Care Coordination One common feature among the DMOs is that they all employ nurse care managers to coordinate care for enrolled beneficiaries. The three DMOs that we studied reported that all case managers are registered nurses (RNs). Care managers are limited to 250 clients by AHCA; however some DMOs set lower ratios. For example, Positive Healthcare reported that their care managers have approximately 125 to 175 clients to manage and each has a mix of high, medium and low risk patients. In general, care managers are responsible for a defined region and are assigned clients that reside in that area. Care managers serving the more rural counties may be responsible for large geographic areas, and have to spend considerable time traveling to and from clients. All of the DMOs engage in certain care management activities, including patient education, coordination of medical care, arrangements of some social services, monitoring the patient’s condition, and follow-up. Care managers are required to provide feedback to the patient’s PCP on a regular basis and act as an extension of the provider by answering questions about their disease or treatment and counseling the patient on how to self-manage their condition. There is considerable variation in the means of patient contact, however, from the very comprehensive hands-on style Positive Healthcare takes the more limited, telephone/electronic dependent approach that other DMOs, such as Life Masters or Coordinated Care Solutions takes with its clients. Patient Education Each of the DMOs provide some form of patient education whether through mailings or through face-to-face information sessions. The DMOs help teach their members about behaviors and lifestyle choices that affect their health problems. DMOs also help to teach enrollees to use equipment that monitors their health condition. Most DMOs provide patients with journals to track their medication regimens and to document their symptoms and general health status as a way of promoting self-management. Many of the DMOs engage in ongoing patient education by mailing newsletters, magazines, or informational pamphlets and by sponsoring health fairs that involve clients in health promotion activities and learning. By contract, all written materials must be written at or near the fourth grade level and made available in foreign languages as needed to ensure that patients understand the advice provided.
19
LifeMasters, which manages patients with congestive heart failure, has a structured patient education program that it provides all new enrollees. Patient education is provided by a dedicated clinical education specialist (CES) and nurses employed by Gentiva, a home health agency under contract with LifeMasters. The CES provides direct patient counseling in regions 5, 6 and 8 and Gentiva provides support in the more rural parts of their service area, regions 1-4, 7, and 9 (see Map 2). All Gentiva patient educators are nurses and are trained by LifeMasters’ CES to assure consistent training of all enrollees. The content and depth of the disease education varies somewhat according to the patient’s disease severity, needs and individualized care plan; but at a minimum involves instruction on how to use monitoring devices and how to send daily readings, called Interactive Voice Responses (IVRs) to a central database that monitors the patients’ health conditions and risk factors (such as high blood pressure or rapid weight gain) that lead to congestive heart failure. During the training session, which may take place in a patient’s home or in a classroom setting, the CES instructs the client on how to identify warning signs of deterioration, and usually involves a full medication review with the patient. The clinical education specialist may also provide nutritional counseling after reviewing the food items in a patient’s cupboard. The CES teaches the client how to read nutrition labels for important dietary information and provides the patient with advice on diet modifications. All LifeMasters clients are provided with educational materials during their session, including health promotion videotapes and a manual called “A Stronger Pump.” This manual contains easy to read information on the causes and mechanics of heart disease, detailed clinical and drug therapies for heart disease, diet and exercise recommendations (including lists of heart-smart and heart-risky foods), and worksheets for self-monitoring. Clients are given journals to track their symptoms, vital signs, and changes in daily activities due to their heart condition. Patient follow-up is usually in the form of informational mailings; however, patient educators may schedule another training session if the client requests additional information or if the nurse care manager detects that the patient is having specific difficulties with their care plan. An obvious limitation of the telephonic or electronic mode of communication is that it depends on the beneficiary having access to these technologies. As previously mentioned, a significant portion of the MediPass population do not have telephones or computers, and many of those that do frequently have interruptions in their service because they are transient or have difficulty paying their bills. Both LifeMasters and Coordinated Care Solutions explored the possibility of purchasing telephones for their enrollees; however the contract with the state did not include sufficient funds to pay for this effort. Another problem in relying almost exclusively on telephone contacts is that it precludes the nurse care manager from visually observing changes in the patient’s status and relies on self-reporting to identify potential problems. Patient Contact and Monitoring The frequency and nature of contact the care managers have with patients varies across DMOs and is influenced by several factors. Some DMOs insist on face-to-face interactions between care managers and patients, while others rely on telephonic or electronic communication. With only one exception, the five DMOs serving MediPass clients use a combination of the two approaches. To some degree, the nature of the disease influences the general approach employed by the contractor. Another important factor DMOs consider in designing care plans is a patient’s
20
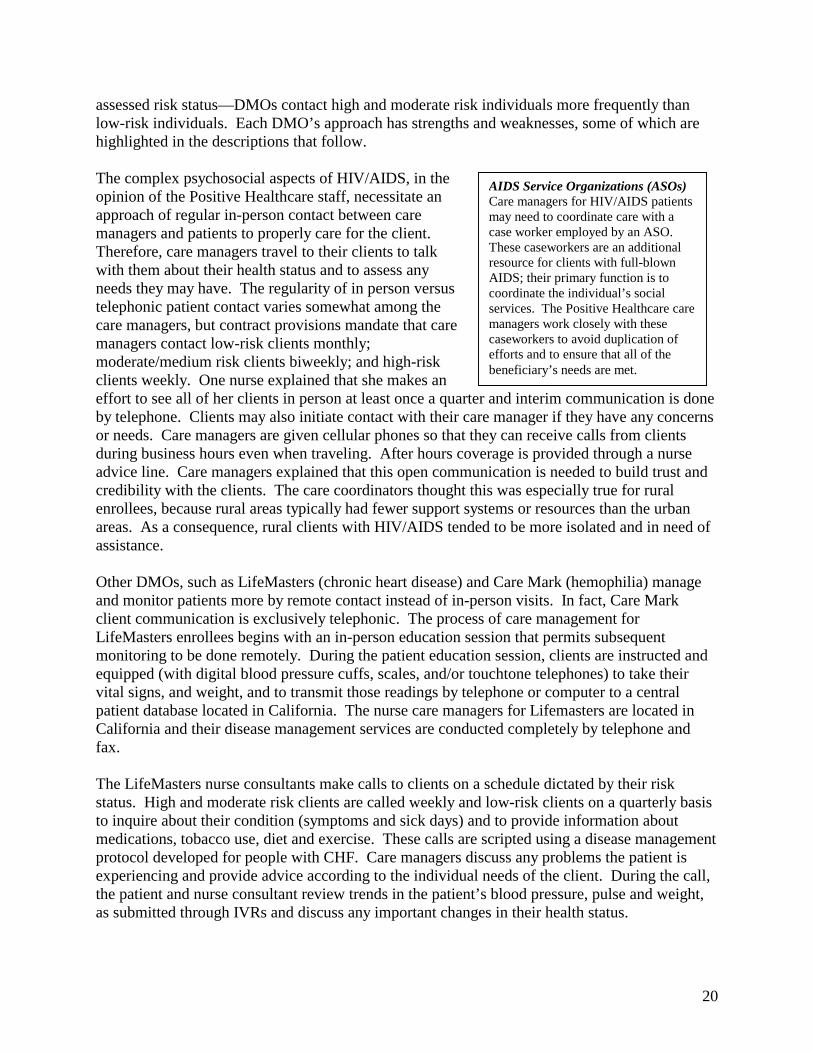
assessed risk status—DMOs contact high and moderate risk individuals more frequently than low-risk individuals. Each DMO’s approach has strengths and weaknesses, some of which are highlighted in the descriptions that follow. The complex psychosocial aspects of HIV/AIDS, in the opinion of the Positive Healthcare staff, necessitate an approach of regular in-person contact between care managers and patients to properly care for the client. Therefore, care managers travel to their clients to talk with them about their health status and to assess any needs they may have. The regularity of in person versus telephonic patient contact varies somewhat among the care managers, but contract provisions mandate that care managers contact low-risk clients monthly; moderate/medium risk clients biweekly; and high-risk clients weekly. One nurse explained that she makes an effort to see all of her clients in person at least once a quarter and interim communication is done by telephone. Clients may also initiate contact with their care manager if they have any concerns or needs. Care managers are given cellular phones so that they can receive calls from clients during business hours even when traveling. After hours coverage is provided through a nurse advice line. Care managers explained that this open communication is needed to build trust and credibility with the clients. The care coordinators thought this was especially true for rural enrollees, because rural areas typically had fewer support systems or resources than the urban areas. As a consequence, rural clients with HIV/AIDS tended to be more isolated and in need of assistance. Other DMOs, such as LifeMasters (chronic heart disease) and Care Mark (hemophilia) manage and monitor patients more by remote contact instead of in-person visits. In fact, Care Mark client communication is exclusively telephonic. The process of care management for LifeMasters enrollees begins with an in-person education session that permits subsequent monitoring to be done remotely. During the patient education session, clients are instructed and equipped (with digital blood pressure cuffs, scales, and/or touchtone telephones) to take their vital signs, and weight, and to transmit those readings by telephone or computer to a central patient database located in California. The nurse care managers for Lifemasters are located in California and their disease management services are conducted completely by telephone and fax. The LifeMasters nurse consultants make calls to clients on a schedule dictated by their risk status. High and moderate risk clients are called weekly and low-risk clients on a quarterly basis to inquire about their condition (symptoms and sick days) and to provide information about medications, tobacco use, diet and exercise. These calls are scripted using a disease management protocol developed for people with CHF. Care managers discuss any problems the patient is experiencing and provide advice according to the individual needs of the client. During the call, the patient and nurse consultant review trends in the patient’s blood pressure, pulse and weight, as submitted through IVRs and discuss any important changes in their health status.
AIDS Service Organizations (ASOs) Care managers for HIV/AIDS patients may need to coordinate care with a case worker employed by an ASO. These caseworkers are an additional resource for clients with full-blown AIDS; their primary function is to coordinate the individual’s social services. The Positive Healthcare care managers work closely with these caseworkers to avoid duplication of efforts and to ensure that all of the beneficiary’s needs are met.
21
LifeMasters nurse care managers are also responsible for responding to alert reports the central patient database generates on abnormal IVR readings. The care managers must contact their patients immediately to verify readings that are out of normal parameters, and if the data are confirmed to be abnormal, a Patient Exception Report is generated and faxed immediately to the PCP. The report informs the PCP of the abnormal readings and provides the PCP with essential patient information (medication inventory, summary of patient’s vitals, care plan) and a recommended clinical care guideline. The form includes a section for the PCP to fill out and fax back to LifeMasters so as to update the nurse care manager on action taken. Within a few days, the care manager contacts the patient to confirm that the provider took action and to ensure that the patient’s condition has stabilized. Other Care Management Services Care managers in some DMOs also locate specialists and interface with other social services agencies as needed for their enrollees. They may arrange transportation for the client to see medical providers or pick up prescription drugs or arrange for the client to receive in-home meal delivery if they cannot prepare their own food. Nurse Advice Lines By contract, each of the DMOs must provide 24-hour, 7 days-a-week access to their clients. Each of the DMOs we studied makes available a toll-free advice hotline, staffed with registered nurses who may also be care managers. In general, the nurse attendants assist callers in determining the urgency of a problem and if it is a true emergency, the on-call nurse advises the person to go to the hospital emergency department. Because MediPass PCPs are required to provide 24/7 coverage, the DMO’s advice line often encourages the caller to contact their PCP for complex problems as they do not have medical histories or patient information on hand. By contract, each DMO must provide the nurse advice services with multilingual capabilities through staff or translator services. At least one DMO, Positive Healthcare, described improvements they are making to enhance the nurse advice line capabilities. This DMO is working to provide the on-call nurse immediate access to its patient database, which contains important information about all of its enrollees. With this new system, the on-call nurse would be able to review information about the beneficiary’s care plan, health status, prescription regimen, and medical diagnoses. This system is under development and an implementation date was not provided. Hospitalizations and Emergency Room Utilization In an effort to aid the disease management contractors in patient finding, AHCA has developed a system to alert them when enrolled patients present in hospital emergency rooms. Each recipient enrolled in one of the disease management programs is provided a swipe card that identifies the patient’s DMO. In theory, the emergency room attendant is supposed to call that contractor immediately to inform them of their enrollee’s presence in the hospital. This system presents the opportunity for case managers to speak with their enrollees, possibly for the first time, and provide information about care management services available to them. This system is relatively new, and we were told that it does not yet work as intended because the ER attendant does not always contact the contractor.
22
Primary Care Providers PCPs are responsible for communicating with DMOs that help to manage their patients’ care. The DMO is required to provide the PCP with best practice guidelines for the conditions they specialize in and for keeping the PCP informed of the recipient’s progress and adherence to their care plan. AHCA recently modified the provider contracts to explicitly require PCPs to coordinate with DMOs and care managers because there had been problems getting PCPs to voluntarily maintain this contact. Several DMOs are actively working to enhance communication between the PCPs and care managers to better enable care managers in monitoring their patient’s condition. One comment made by several of the DMOs was that care management would be much more effective and informed if PCPs would make a better effort to share important lab values and exam summaries. For example, Coordinated Care Solutions (CCS) care managers would have a better gauge on their diabetic patient’s health status if they had access to Hemoglobin A1C test results, and summaries of eye and foot exams. LifeMasters described plans to test the use of financial incentives as a method to encourage PCP’s communication with care managers; doctors that complete and return their questionnaire on the use of Ace inhibitors will be paid a small fee for their time. In general, the DMOs did not perceive a resistance to cooperate among PCPs; rather case managers perceived it as a lack of the PCP’s time that impeded the process. Data Systems The sophistication of data systems and abilities of staff to operate these systems varies among the DMOs. The patient database used by LifeMasters is built around IVRs submitted by patients, supplemented by the assessments of care managers and some treatment summaries. Other DMOs offered little information about their data systems. Positive Healthcare describes its system as “state-of-the-art” and the potential of this disease management software, which was designed specifically for HIV/AIDS, is impressive. The system, as designed, will include patient demographics and background, clinical data (including office visits, lab results, treatment regimens, prescription inventory, and medical histories), physician information and case management information (contacts, appointments, assessments). Some of the data are collected by nurse care managers (lab values) and other data (claims) come directly from the state. Once completely implemented, the system would permit comprehensive analysis to aid care management planning. It would also allow the DMO management to review patterns in outcomes related to certain providers or care plans. While the system was not fully operational at the time of our interview, it was expected to be live by Summer 2002. Finance Structure of DMO Initiative The premise of the disease management initiative is that helping certain high cost individuals better manage their diseases would both help improve their health and lead to cost savings in the program. Initially, DMO contracts varied in their levels of guaranteed cost savings; however all contracts currently require that the DMO produce 6.5% cost savings annually for the population they are managing. DMOs are paid an administrative fee per member per month (pmpm), to hire care managers and implement the disease management protocol. The amount of the administrative fee varies across and within DMOs by disease and acuity; there is no geographic adjustment in the payment. In a sense, the administrative fees are interim payments because the
23
DMO is not actually guaranteed any payment unless they produce the specified savings in their contract. At the end of the contract period, the DMOs calculate the total annual cost of care for their members, including both health care and administrative costs paid on behalf of their members. These costs are compared to the expected costs absent a disease management initiative to determine the extent, if any, of the cost savings. The expected costs are calculated using a base year, agreed upon in the contract, and then inflated forward using various factors such as general medical inflation. If the DMO achieved cost savings above the 6.5% guaranteed in their contract, they split the savings with the state. However, if they fall short of the 6.5% savings, they pay the state the difference to ensure a 6.5% net savings. This performance based payment arrangement ensures that the initiative will not cost the State of Florida additional monies and presents the possibility of reducing costs for an expensive population of health care users. Annual reports submitted to AHCA for their first contract year by five of the DMOs purport that each of the DMOs did realize cost reductions as a result of the intervention. At the time of our visit, only one DMO, Positive Health Care, had reconciled its first year of operations with AHCA and agreed upon the produced reductions. Positive Health Care, the DMO managing HIV/AIDS patients, showed $5.8 million in savings for their population, which exceeded the 6.5% contractual guarantee and permitted them to take part in shared savings. Positive Health Care staff also suggested that there were additional cost savings to the state through reduced use of non-Medicaid services that were not calculated as part of the intervention’s cost-savings.7 Other DMOs, such as CCS were in dispute with the state over whether there were any cost savings as a result of the diabetes disease management initiative. By mutual consent of both parties, a third party arbitrator had been hired to review the CCS cost reconciliation calculations and determine whether the DMO had achieved the requisite cost savings or whether it owed money back to the state. Part of the problem which surfaced in the CCS dispute was that the initial AHCA DMO contracts were not sufficiently clear in how the state would calculate the expected costs that would have been incurred absent the disease management initiative. The original contract language did not specify the base year amounts, or how this would be trended forward over the life of the contract. To correct this point of confusion, the contract language was tightened so that both parties had a clear understanding of how the savings would be calculated at the end of the 2nd year. A complete description of the agreement between AHCA and the DMOs about shared savings is contained in Appendix I; however, the following citation summarizes the methodology for establishing baseline payments (Attachment V, Section C, 2):
7 Positive Health Care Staff noted that while hospitalizations and emergency room visits were on the decline, the cost for prescription drugs among its enrollees has risen since inception. This was not an unexpected event, as drug compliance is correlated with decreased hospitalizations, which is one of the goals of the initiative. With new drug therapies, the condition of some HIV/AIDS patients has improved considerably, making some services, such as homemaker services and meals on wheels, unnecessary as they regain ability to perform those functions. The current AIDS Service Organizations do not regularly reevaluate the health needs of clients and thus some services continue beyond the period of necessity. Nurse care managers are able to assess these needs and recommend discontinuation of such services, with the client’s consent. Although some of these cost savings are not quantifiable in terms of Medicaid expenditures, the state realizes these savings in other program budgets.
24
The baseline payment reflects an estimate of the level of MediPass recipient costs that the Agency would expect to incur in the absence of implementing the disease management initiative. The baseline payment will be derived from a claims analysis involving eligible MediPass recipients. … All paid claims for these recipients, while enrolled in MediPass, will be aggregated to determine total expenditures for the Baseline Period. … These expenditures will be divided by the total number of case months for recipients eligible for [DISEASE] management to obtain a dollar expenditure amount per recipient per case month. This dollar expenditure amount per recipient per case month will be inflated based on yearly Medicaid budget adjustments and will be referred to as the baseline payment per recipient case month. This will be used in the calculation of the baseline payment. Fiscal year 1997-98 dates of service will be used to establish the Baseline Payment for [CONTRACTOR’S] first operational year. Fiscal year 1998-99 dates of service (or the most current available fiscal data) will be used to establish the baseline payment for [CONTRACTOR’S] second operational year.
Additionally, the Positive Healthcare contract contained a clause, which protects the DMO from losses due to the introduction of expensive new therapies for HIV/AIDS.
…If payments made by AHCA on behalf of [contractor] in a contract year include payments for new treatments or therapies introduced during that contract year, AHCA will develop and establish, with input from [contractor], an appropriate and rational factor for these new costs and add that factor to the established baseline payment prior to performing a final costs savings calculation.
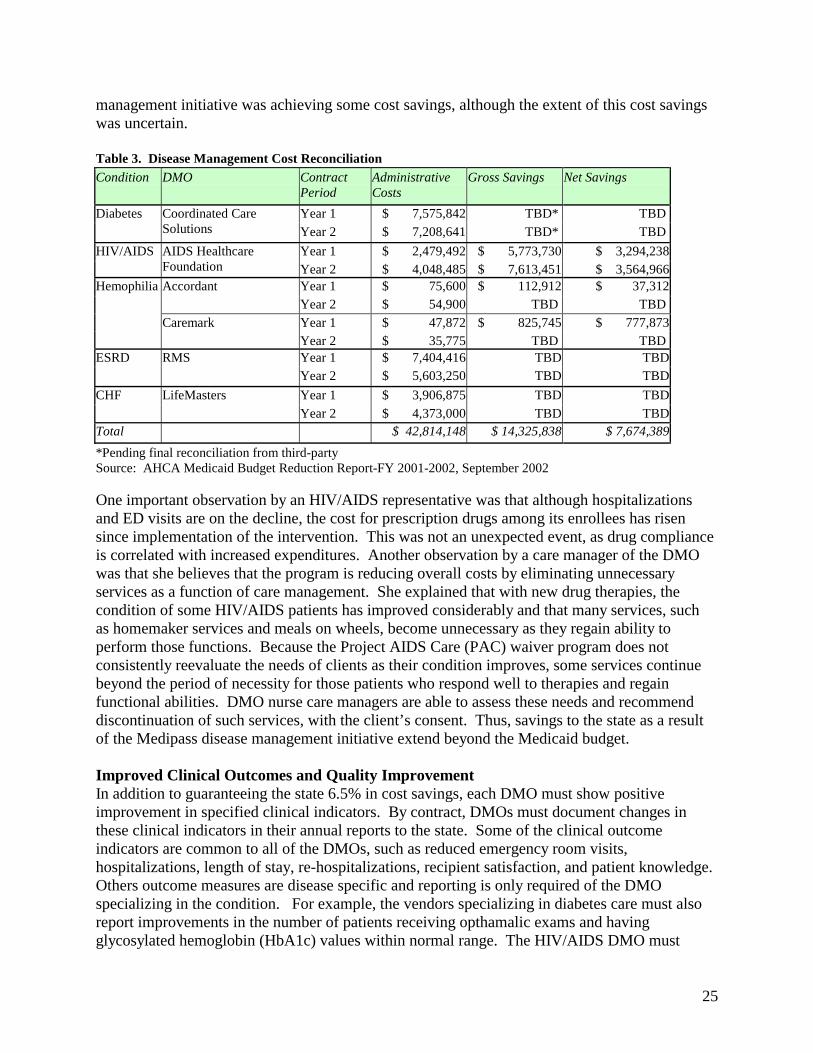
Follow-up communication with AHCA yielded additional information about DMO cost reconciliations, which is summarized in Table 3. Although total cost savings for the disease management initiative were not available for many of the contractors as they had not yet completed cost-settlement with the state, data were available indicating the administrative costs for all contractors and savings for some of the vendors. These data demonstrate that the disease management initiatives have proven to be successful in reducing Medicaid expenditures for the targeted conditions. A study conducted by Georgetown University (GU) and Florida State University (FSU) examined the per enrollee expenditures for participants and non-participants in several of the disease management initiatives.8 The evaluation generally found that pharmaceutical, outpatient and inpatient expenditures for participants (per enrollee) were slightly lower than for non-participants with the same conditions (AIDS, diabetes, and hemophilia); though there was variation in the size of the difference among the DMOs and by eligibility and demographic categories in this finding.9 The study also compared expenditures for program participants before and after the disease management began. Regression analyses demonstrated cost savings were associated with the disease management intervention at a significant level with the largest effects observed in the HIV/AIDS population. This study suggests that, on average, the disease
8 Parker, Suzanne L.; Mitchell, Jean M.; Cowart, Marie E. June 2001. Evaluation of Disease Management in the Florida Medicaid Program: AIDS, Diabetes, and Hemophilia. 9 AHCA disagreed with some of the methodologies employed in the study and felt that the cost savings was actually greater for participants in the disease management initiative.
25
management initiative was achieving some cost savings, although the extent of this cost savings was uncertain. Table 3. Disease Management Cost Reconciliation Condition DMO Contract
Period Administrative Costs
Gross Savings Net Savings
Year 1 $ 7,575,842 TBD* TBD Diabetes Coordinated Care Solutions Year 2 $ 7,208,641 TBD* TBD
Year 1 $ 2,479,492 $ 5,773,730 $ 3,294,238 HIV/AIDS AIDS Healthcare Foundation Year 2 $ 4,048,485 $ 7,613,451 $ 3,564,966
Year 1 $ 75,600 $ 112,912 $ 37,312 Accordant Year 2 $ 54,900 TBD TBD Year 1 $ 47,872 $ 825,745 $ 777,873
Hemophilia
Caremark Year 2 $ 35,775 TBD TBD Year 1 $ 7,404,416 TBD TBD ESRD RMS Year 2 $ 5,603,250 TBD TBD Year 1 $ 3,906,875 TBD TBD CHF LifeMasters Year 2 $ 4,373,000 TBD TBD
Total $ 42,814,148 $ 14,325,838 $ 7,674,389
*Pending final reconciliation from third-party Source: AHCA Medicaid Budget Reduction Report-FY 2001-2002, September 2002 One important observation by an HIV/AIDS representative was that although hospitalizations and ED visits are on the decline, the cost for prescription drugs among its enrollees has risen since implementation of the intervention. This was not an unexpected event, as drug compliance is correlated with increased expenditures. Another observation by a care manager of the DMO was that she believes that the program is reducing overall costs by eliminating unnecessary services as a function of care management. She explained that with new drug therapies, the condition of some HIV/AIDS patients has improved considerably and that many services, such as homemaker services and meals on wheels, become unnecessary as they regain ability to perform those functions. Because the Project AIDS Care (PAC) waiver program does not consistently reevaluate the needs of clients as their condition improves, some services continue beyond the period of necessity for those patients who respond well to therapies and regain functional abilities. DMO nurse care managers are able to assess these needs and recommend discontinuation of such services, with the client’s consent. Thus, savings to the state as a result of the Medipass disease management initiative extend beyond the Medicaid budget. Improved Clinical Outcomes and Quality Improvement In addition to guaranteeing the state 6.5% in cost savings, each DMO must show positive improvement in specified clinical indicators. By contract, DMOs must document changes in these clinical indicators in their annual reports to the state. Some of the clinical outcome indicators are common to all of the DMOs, such as reduced emergency room visits, hospitalizations, length of stay, re-hospitalizations, recipient satisfaction, and patient knowledge. Others outcome measures are disease specific and reporting is only required of the DMO specializing in the condition. For example, the vendors specializing in diabetes care must also report improvements in the number of patients receiving opthamalic exams and having glycosylated hemoglobin (HbA1c) values within normal range. The HIV/AIDS DMO must
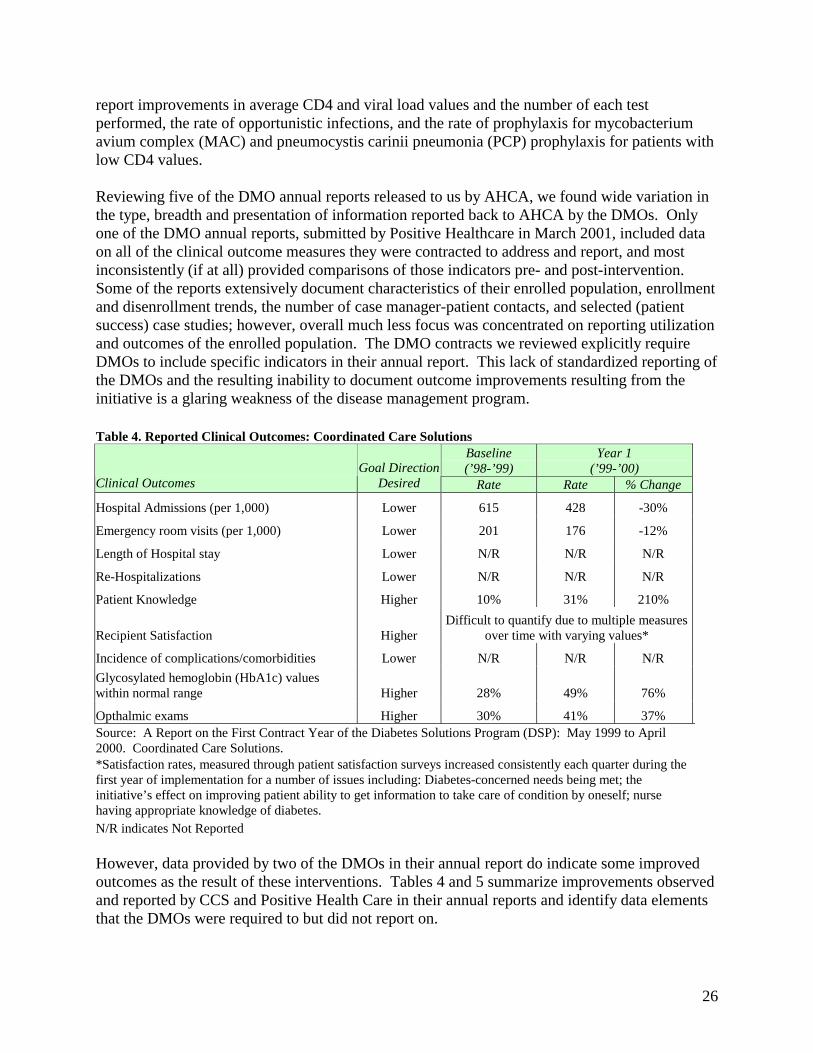
26
report improvements in average CD4 and viral load values and the number of each test performed, the rate of opportunistic infections, and the rate of prophylaxis for mycobacterium avium complex (MAC) and pneumocystis carinii pneumonia (PCP) prophylaxis for patients with low CD4 values. Reviewing five of the DMO annual reports released to us by AHCA, we found wide variation in the type, breadth and presentation of information reported back to AHCA by the DMOs. Only one of the DMO annual reports, submitted by Positive Healthcare in March 2001, included data on all of the clinical outcome measures they were contracted to address and report, and most inconsistently (if at all) provided comparisons of those indicators pre- and post-intervention. Some of the reports extensively document characteristics of their enrolled population, enrollment and disenrollment trends, the number of case manager-patient contacts, and selected (patient success) case studies; however, overall much less focus was concentrated on reporting utilization and outcomes of the enrolled population. The DMO contracts we reviewed explicitly require DMOs to include specific indicators in their annual report. This lack of standardized reporting of the DMOs and the resulting inability to document outcome improvements resulting from the initiative is a glaring weakness of the disease management program. Table 4. Reported Clinical Outcomes: Coordinated Care Solutions
Baseline (’98-’99)
Year 1 (’99-’00)
Clinical Outcomes Goal Direction
Desired Rate Rate % Change
Hospital Admissions (per 1,000) Lower 615 428 -30%
Emergency room visits (per 1,000) Lower 201 176 -12%
Length of Hospital stay Lower N/R N/R N/R
Re-Hospitalizations Lower N/R N/R N/R
Patient Knowledge Higher 10% 31% 210%
Recipient Satisfaction Higher Difficult to quantify due to multiple measures
over time with varying values*
Incidence of complications/comorbidities Lower N/R N/R N/R
Glycosylated hemoglobin (HbA1c) values within normal range Higher 28% 49% 76%
Opthalmic exams Higher 30% 41% 37% Source: A Report on the First Contract Year of the Diabetes Solutions Program (DSP): May 1999 to April 2000. Coordinated Care Solutions. *Satisfaction rates, measured through patient satisfaction surveys increased consistently each quarter during the first year of implementation for a number of issues including: Diabetes-concerned needs being met; the initiative’s effect on improving patient ability to get information to take care of condition by oneself; nurse having appropriate knowledge of diabetes. N/R indicates Not Reported However, data provided by two of the DMOs in their annual report do indicate some improved outcomes as the result of these interventions. Tables 4 and 5 summarize improvements observed and reported by CCS and Positive Health Care in their annual reports and identify data elements that the DMOs were required to but did not report on.
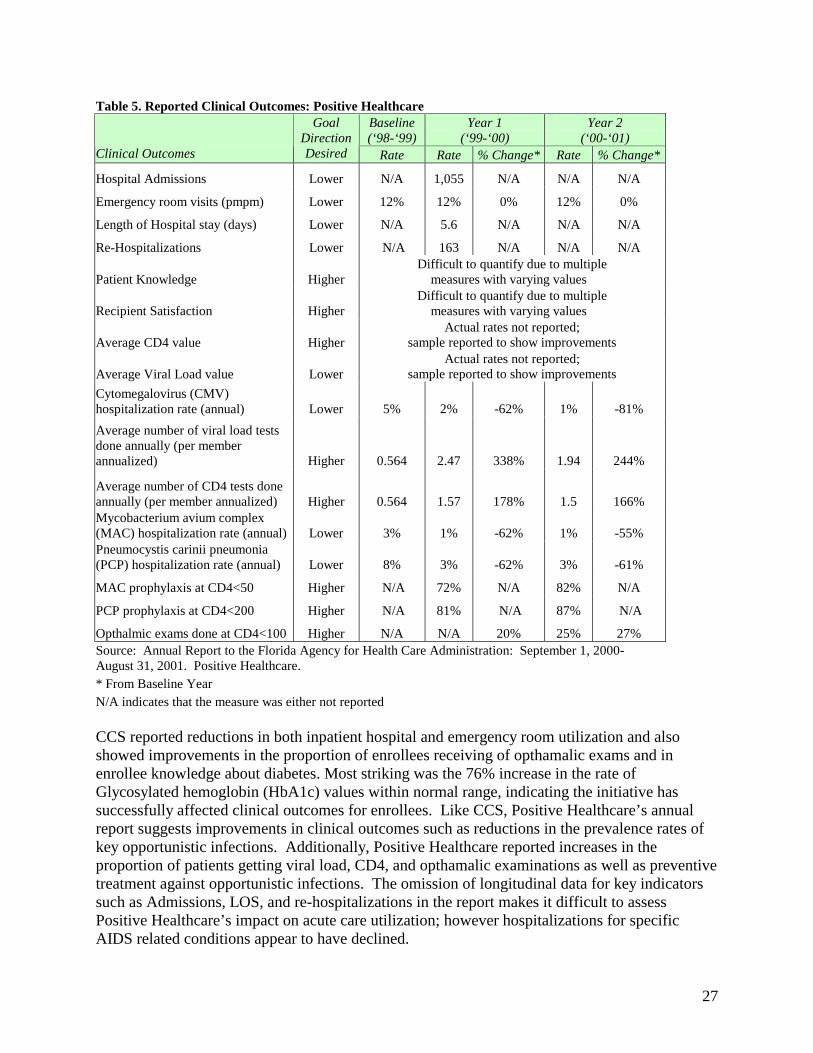
27
Table 5. Reported Clinical Outcomes: Positive Healthcare Baseline (‘98-‘99)
Year 1 (‘99-‘00)
Year 2 (‘00-‘01)
Clinical Outcomes
Goal Direction Desired Rate Rate % Change* Rate % Change*
Hospital Admissions Lower N/A 1,055 N/A N/A N/A
Emergency room visits (pmpm) Lower 12% 12% 0% 12% 0%
Length of Hospital stay (days) Lower N/A 5.6 N/A N/A N/A
Re-Hospitalizations Lower N/A 163 N/A N/A N/A
Patient Knowledge Higher Difficult to quantify due to multiple
measures with varying values
Recipient Satisfaction Higher Difficult to quantify due to multiple
measures with varying values
Average CD4 value Higher Actual rates not reported;
sample reported to show improvements
Average Viral Load value Lower Actual rates not reported;
sample reported to show improvements
Cytomegalovirus (CMV) hospitalization rate (annual) Lower 5% 2% -62% 1% -81%
Average number of viral load tests done annually (per member annualized) Higher 0.564 2.47 338% 1.94 244%
Average number of CD4 tests done annually (per member annualized) Higher 0.564 1.57 178% 1.5 166% Mycobacterium avium complex (MAC) hospitalization rate (annual) Lower 3% 1% -62% 1% -55% Pneumocystis carinii pneumonia (PCP) hospitalization rate (annual) Lower 8% 3% -62% 3% -61%
MAC prophylaxis at CD4<50 Higher N/A 72% N/A 82% N/A
PCP prophylaxis at CD4<200 Higher N/A 81% N/A 87% N/A
Opthalmic exams done at CD4<100 Higher N/A N/A 20% 25% 27% Source: Annual Report to the Florida Agency for Health Care Administration: September 1, 2000-August 31, 2001. Positive Healthcare. * From Baseline Year N/A indicates that the measure was either not reported CCS reported reductions in both inpatient hospital and emergency room utilization and also showed improvements in the proportion of enrollees receiving of opthamalic exams and in enrollee knowledge about diabetes. Most striking was the 76% increase in the rate of Glycosylated hemoglobin (HbA1c) values within normal range, indicating the initiative has successfully affected clinical outcomes for enrollees. Like CCS, Positive Healthcare’s annual report suggests improvements in clinical outcomes such as reductions in the prevalence rates of key opportunistic infections. Additionally, Positive Healthcare reported increases in the proportion of patients getting viral load, CD4, and opthamalic examinations as well as preventive treatment against opportunistic infections. The omission of longitudinal data for key indicators such as Admissions, LOS, and re-hospitalizations in the report makes it difficult to assess Positive Healthcare’s impact on acute care utilization; however hospitalizations for specific AIDS related conditions appear to have declined.
28
While statistics from these two annual reports suggest that the DMOs have realized success in improving clinical outcomes for their enrollees, some key indicators were not reported that limit the agency’s ability to assess the initiatives’ overall impact on quality improvement. CCS included data on only six of the nine targeted outcome indicators and Positive Healthcare reported on each of their 14 indicators (as well as two that were not required); yet the reports lacked data for the most recent contract period for several indicators. Other DMO annual reports had even less documentation of clinical improvements, if any. In response to questions about the omission of baseline data, AHCA indicated that internal review of claims data would be relied upon to indicate improvements in hospital and ER usage. However, no analysis of these data had been conducted during the time frame of our study. Additionally, AHCA pointed out that reported changes in clinical indicators were subject to bias for two reasons: 1) baseline data represent clinical values at the time of the enrollee’s initial health assessment and are not reported for 100% of enrolled recipients; 2) clinical indicators for subsequent years are collected from medical records and during patient interviews and also do not represent 100% of the enrolled population. Though we were not able to review the documented changes in clinical outcomes for all of the DMOs, respondents representing AHCA and the DMOs we interviewed indicated that hospitalizations and ED visits had been reduced since the implementation of the disease management program. The study conducted by researchers at Georgetown University (GU) and Florida State University (FSU), under contract with AHCA, offered very little evidence to substantiate these claims. This evaluation focused primarily on the disease management program’s effect on expenditures with very little attention to utilization. To our knowledge, there are no other studies or internal AHCA analyses examining the effects of the program on utilization, outcomes or quality. Discussions with AHCA officials and with DMO staff revealed internal and external quality improvement processes, beyond monitoring clinical indicators, to monitor and promote quality of care. For example, nurses employed by regional AHCA offices visit MediPass providers’ offices and review patient records to determine if the provider is providing adequate care and if that care is well documented and coordinated with DMOs, if applicable. The records selected are a combination of those chosen randomly and those flagged because of grievances. Additionally, the state contracts with a peer review organization (PRO) to review 400 medical records for each of the managed care options (except CMS, which operates its own quality assurance program) on a monthly basis with the same intention of reviewing provider performance. Other Disease Management Contracts Pfizer Health Solutions Initiative In July 2001, Florida developed a preferred drug list. Pharmaceutical companies that want to ensure that all of their drugs are placed on the preferred drug list have to agree to a supplemental rebate (in addition to the rebate paid under the federal Medicaid statute). Rather than agree to pay a supplemental rebate, Pfizer agreed to finance a new disease management initiative. Details of the Pfizer contract are not public record; however the agreement, as we were told, has three parts.
29
The most substantial part of the agreement is that Pfizer has committed to lead a disease management initiative through the 10 of the state’s largest tertiary care hospitals. The initiative encompasses diabetes, asthma, congestive heart failure and hypertension. To begin, Pfizer will outfit each facility with Clinical Management System, Pfizer’s proprietary case management software, and train staff to use the system. Pfizer also agreed to pay AHCA an undisclosed sum of money, which is redistributed to the participating hospitals, to hire case managers. These case managers are responsible for providing health education and care coordination to eligible recipients within the hospital’s catchment area. Patients living outside of the catchment areas are assigned to McKesson call center for telephonic care management of the same chronic conditions. Eligible recipients are identified by AHCA through claims data and a list of potential enrollees is provided to Pfizer on a monthly basis. Each hospital has a defined catchment area that includes the county in which the hospital is located and surrounding counties. In total, 23 counties (6 rural) were being served by the Pfizer initiative as of October 2002, and there were plans to expand to two additional (urban) counties. Map 3 identifies the hospitals and counties included in the Pfizer initiative. In March of 2002, Pfizer had approximately 54,000 MediPass recipients enrolled in their initiative, and that number was expected to grow to about 85,000 by October 2002. As part of the agreement with AHCA, Pfizer receives claims data on all enrollees, which feeds into the Clinical Management System, and provides case managers with additional medical history on their patients. The second aspect of the agreement is that Pfizer will donate medications to be distributed to Medicaid patients at FQHCs across the state. Third, Pfizer has agreed to lead (and finance) a study of health literacy in collaboration with the University of Florida. The study will test the impact of health education materials on low-literacy populations in terms of health status and health care costs. Pfizer will use the findings to develop new materials and train health care providers to more effectively communicate health education information to people with low-literacy abilities. In total, we were told that Pfizer has guaranteed savings to the state equal to a fixed sum that AHCA projected a supplemental drug rebate would have cost Pfizer. The guaranteed cost savings include the monetary value of product donations, costs associated with hiring case managers and the low-literacy study, and any claims reimbursement reductions attributable to the initiative. Like other contractors, Pfizer is at risk for the guaranteed fixed amount agreed upon by the two parties and must pay the state the difference if savings are not achieved. Bristol-Myers Squibb (BMS) The agreement between AHCA and Bristol-Myers Squibb is said to be similar to the Pfizer initiative, except it will focus on African-American and Hispanic Medicaid patients obtaining care in the state’s FQHCs. Diseases targeted by this project include diabetes and depression. Like Pfizer, BMS will provide disease management software to help manage the care of Medicaid recipients in lieu of paying a supplemental cash rebate for drugs listed on the state’s Preferred Drug List. Like Pfizer’s contract, the BMS agreement is contingent on the company generating a minimum cost savings, or they must provide the state with cash payments equaling the difference.
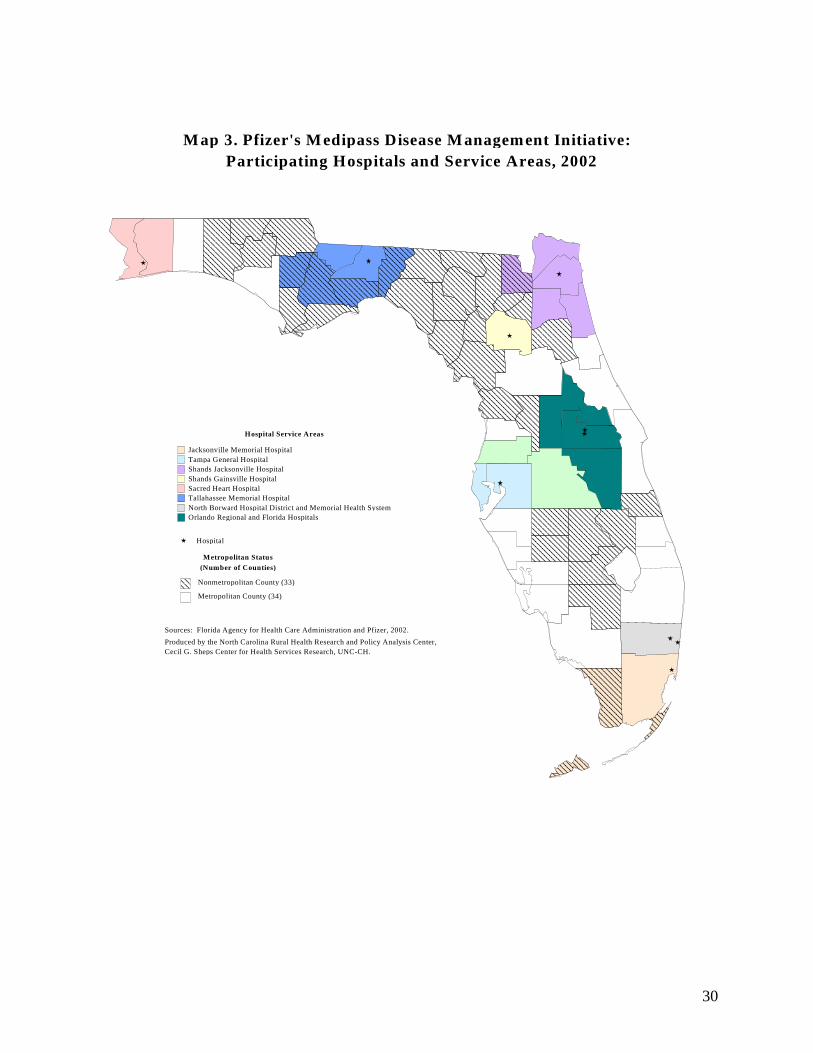
30
Hospital Service Areas
Jacksonville Memorial HospitalTampa General HospitalShands Jacksonville HospitalShands Gainsville HospitalSacred Heart HospitalTallahassee Memorial HospitalNorth Borward Hospital District and Memorial Health SystemOrlando Regional and Florida Hospitals
M ap 3. Pfizer's M edipass Disease M anagement Initiative: Participating Hospitals and Service Areas, 2002
Nonmetropolitan County (33)
Metropolitan County (34)
Hospital
Sources: Florida Agency for Health Care Administration and Pfizer, 2002.
Produced by the North Carolina Rural Health Research and Policy Analysis Center, Cecil G. Sheps Center for Health Services Research, UNC-CH.
Metropolitan Status
(Number of Counties)
31
The University of Florida The autoimmune disorders initiative was implemented in January 2002. AHCA has paid the University $500,000 to develop a program to manage care for children with a variety of autoimmune disorders. By design, the children will go to the University of Florida campus to be seen by a panel of experts who will develop individual care plans for the recipients. They will recommend clinical pathways and work with local providers through telemedicine technology to manage the patient’s condition. Unlike the other disease management contractors, the University has no obligation of guaranteeing cost savings as a condition of their contract. Evaluation of Medipass Compared to the HMO Program The primary goals of the fully capitated program and the MediPass disease management initiative are to improve health outcomes and to achieve cost efficiency in providing services. Measuring program effectiveness across these two models has been challenging. Because HMOs are paid on a capitated basis, it is more difficult to capture 100% utilization data than can be captured in the Medipass program through claims data. Therefore, it is difficult to compare the clinical outcomes across programs. In order to obtain some comparison data, the state examined selected Health Plan Employer Data and Information Set (HEDIS) measures across programs. However, these data represent differences observed during a one year period from 1998-99 and have not been updated to assess differences since the disease management initiative was implemented. Overall, very little work has been done comparing the different managed care models on measures of quality, and even less research has focused on the disease management initiative. Furthermore, there is a lack of data comparing expenditures in the PCCM program to the HMO program as well on the realized DMO cost savings. Some research has been done comparing the costs of care for recipients enrolled in MediPass with the costs of FFS beneficiaries, showing that MediPass beneficiaries’ average expenditures per person has consistently been lower than in the FFS system, even when high cost users such as CSHCN from the CMS program are aggregated with MediPass enrollees. However, no studies have compared the HMO and MediPass program expenditures. Conclusions & Discussion About Rural Implications Overall, Florida’s disease management program for MediPass recipients includes some very unique and positive features, many of which are especially beneficial for rural enrollees. In general, the nature of rural health care practice is one of limited resources and increased access barriers, which the disease management program can help to overcome. Ideally, care managers serve as care extenders for PCPs who often practice medicine with limited support and who may be a sole source of care for large populations. Furthermore, care managers can help provide social service coordination for enrollees, which may be otherwise unavailable in small rural communities. The role of the care manager is value-added for rural recipients. However, there are considerable challenges in operating a disease management program of this magnitude and those challenges were clearly observed in our study of MediPass’ program. While these challenges are not specific to program operations in rural areas, they certainly apply to these communities and may even be more profound in rural areas. To begin, Florida’s disease management program is very complicated and relies on vastly different approaches taken by a
32
multitude of participating contractors. This may have been useful to the state at the inception of the program, as they were testing various approaches for different diseases. However, PCPs may find it confusing and administratively difficult to communicate and coordinate with so many contractors and care managers. This may limit the ability of PCPs and care coordinators to establish relationships and ultimately undermine the program’s intent. Since rural providers tend to be smaller practices with few administrative support staff, managing relationships and maintaining communication with numerous disease management program representatives may be an exceptional burden to these providers. Additionally, the methods of care coordination used by some contractors vary for the rural populations within their service areas. This is especially true for the Pfizer initiative, in which enrollees living in the hospitals’ (primarily urban) catchment area are assigned to care managers at the hospital while enrollees outside of that service area are managed by a call center. Many of the respondents we interviewed commented that it is more time-consuming and resource intensive to visit with patients in person in rural areas than in urban places. As a result, a number of contractors rely more heavily on telephonic communication for care management for their rural enrollees while urban recipients enjoy in-person visits with care coordinators. This is a potential concern for rural recipients, as telephonic communication depends on the patient’s access to a telephone, which is problematic when dealing with a low-income population such as Medicaid recipients. Representatives of the DMOs shared that between 30-40% of their clients did not have working telephones. Perhaps the state should consider enhancing administrative costs provided for rural recipients to compensate the DMOs for the additional costs (travel time and distance) in contacting rural recipients. As previously suggested, there is reason to have reservations about the state’s solution to managing patients with multiple chronic conditions. The policy of assigning a patient to one contractor according to their most life threatening condition seems to have good intentions (streamlining responsibility); however it prevents the sharing of “best practices” because the vendors have no forum or responsibility to communicate with one another. For example, Positive Healthcare is assigned all patients diagnosed with HIV/AIDS, many of whom have other health problems. Although Positive Healthcare care managers may be capable of advising the patient on other illnesses, for example diabetes; the patient may not benefit from clinical practice guidelines and other “best practices” (health education, monitoring/coordinating systems) developed for their other chronic conditions. Finally, there are considerable deficiencies and limitations in the data provided to and maintained by disease management contractors that could enhance care coordination. The reliance on claims data for identifying and assigning individuals to disease management program is problematic because those claims take several months to process. The DMOs had different understandings about their authority to enroll clients into disease management absent AHCA’s assignment of the patient; for example, when a PCP refers them patients who have been recently diagnosed with a chronic condition. Delaying the identification of recipients and the commencement of care coordination services is problematic because the difficulty in locating these patients increases as time goes by and the patients obviously do not realize the benefits of the additional services as soon as possible. While some efforts have been made to assist DMOs in locating patients once identified through claims data (using the Medicaid card swipe system), the new system did not
33
appear to be working perfectly at the time of our visit. Furthermore, there is a lack of standardization in the reporting of utilization and outcome data by the DMOs, limiting the ability to assess the disease management initiative’s impact on quality. CASE STUDIES: NORTH CAROLINA History North Carolina began Carolina Access, a primary care case management (PCCM) program in 1991 under a 1915(b) Medicaid waiver. The program was developed jointly between the North Carolina Division of Medical Assistance (DMA, the North Carolina Medicaid agency), and the Office of Research, Demonstrations, and Rural Health Development (ORDRHD, the state Office of Rural Health). The primary goal of the program was to help link Medicaid recipients to a medical home. In 1991, Carolina Access started in five counties, and by 1999 it covered 99 of the state’s 100 counties. Mecklenburg County the state’s most populous urban county, started a fully capitated, managed care program in 1996, and by 2002 became the last of the 100 counties to start an Access program (in conjunction with their fully capitated program). Initially, Carolina Access paid primary care providers $3.00 pmpm for the first 250 patients, then $2.50 per member thereafter to manage the patients’ care—however, all services provided were reimbursed on a fee-for-service basis. Currently, primary care providers in Carolina Access receive $2.00 pmpm. The definition of a primary care provider for North Carolina’s Access Program includes general practitioners, family physicians, pediatricians, internists, OB/GYNs, nurse practitioners, physicians assistants,10 nurse midwives, public health departments, federally qualified health centers, and rural health clinics. Carolina Access improves access to primary care providers by linking Medicaid recipients to a primary care physician. The program was not designed to focus on quality improvement, goal often promised by fully capitated health systems. As in other states, capitated Medicaid managed care was an unattainable goal in many parts of the state. There was an attempt by some of the state’s larger tertiary hospitals to design a fully capitated Medicaid managed care system. Under this proposal, a network of hospitals, with participating primary care providers, would have assumed responsibility for managing the care of the Medicaid clients. This plan was not seriously considered, but it did spark interest in creating provider-led networks to manage the care of the state’s Medicaid recipients. Rather than try to expand capitated Medicaid managed care statewide, the state decided to develop a new model that would simultaneously improve quality and control costs. The state became more interested in developing a program that could help reduce costs as the Medicaid budgetary constraints became more apparent. The opportunity to achieve cost savings within the existing Carolina Access program had become limited after the enactment of the “prudent layperson” provisions of the Balanced Budget Act.11 The goal of the new program was to
10 Physicians Assistants cannot enroll directly as a primary care provider, but can serve as a primary care provider through a group practice. 11 Carolina Access was created to help establish a medical home for Medicaid recipients. Under a 1915(b) waiver, the program had to be cost-neutral. The original programmatic goals did not focus on cost-containment; however,
34
develop local disease management and care coordination models to better manage the health of the Medicaid population and reduce Medicaid expenditures. By 1998, the state had created and implemented its new Medicaid managed care program, formally designated The Community Care Program, but more often called Access II and III. Overview of Access II and III The Community Care Program is built around provider-led community networks that include, at a minimum, local primary care providers, a local hospital, Department of Social Services (DSS), and the health department. These participants are connected through a 501(c)(3) non-profit corporation, which receives the case management funds, and coordinate services. Each network is responsible for population health management which involves identifying individuals with certain high-cost or complex health conditions in need of case management. The goal of the program is to enable these networks to design a system to improve health status through additional case management and care coordination strategies. DMA started the program by issuing a request for proposals (RFP) to identify counties that were interested in developing these local networks to serve their Medicaid populations. In order to target providers who already had a strong commitment to the Medicaid population and to being part of the safety-net, the state limited participation in the program to communities where local physician groups already managed at least 2,000 Medicaid patients. Recognizing that this threshold would exclude many rural communities from participation, the state permitted rural provider practices to combine their Medicaid patient rolls to achieve the 2,000 minimum. Fourteen communities submitted proposals in response to the RFP. Nine projects were selected: six of which were for networks within individual counties and one that proposed a multi-county provider network of (primarily pediatric) practices in 32 counties (Access II); and two of which were county-wide and included all the Medicaid providers in the county (Access III). Currently, Access II and III programs cover rural providers in more than a quarter of the state’s 65 rural counties. Map 4 identifies all active Access II and III projects, as well as counties cooperating in the multi-county pediatric project. In some counties, the Community Care Program operates alongside the traditional primary care case management program (Carolina Access, also called Access I). Local providers make the choice between Access I or II, and that choice determines the program that their patients are enrolled in. North Carolina requires TANF-related families, children, and disabled, non-Medicare eligibles to enroll in a Medicaid managed-care system. Pregnant women are enrolled in managed care on a voluntary basis; as are dual eligibles and foster children. The medically needy, institutionalized individuals, and undocumented immigrants are excluded from participation in Medicaid managed care programs.
the program was initially successful in reducing costs, largely through the reduced use of the emergency room. However, the Balanced Budget Act (BBA) of 1997 changed the Medicaid statute, requiring states to reimburse all emergency room visits when a “prudent layperson” would have a reasonable belief that an emergency condition existed. This made it more difficult for the state Medicaid agency or primary care providers to control inappropriate use of the emergency room.
35
Access III differs from Access II primarily in that Access III sites include all of the community primary care providers in the network. Access III initially began in two urban counties; however, one of the sites has since expanded to include a neighboring urban county and plans to further expand into two contiguous rural counties. Both of the initial Access III sites also operate federal Community Access Program (CAP) grants to include the uninsured in their systems of care. In August 2002, Access II and III networks provided care to 251,456 Medicaid recipients (27% of all Medicaid enrollees) which reflects the total of eleven networks (two networks were added in 2002): Summary of the Eleven Access II and Two Access III Networks (reflecting enrollment as of August 2002) Access II
• Access Care (multi-county network – 50 practices in 33 counties, 21 non-MSA): 114,717 enrollees
• Access II Care of Western North Carolina (covering Buncombe, Transylvania∗ and Madison counties): 14,701 enrollees
• CLECO (Cleveland County*): covering 4,778 enrollees • Community Health Partners (Gaston County): covering 12,223 enrollees • Durham County Community Health Network: covering 12,361 enrollees • Guilford County Access II partnership: covering 14,135 enrollees • Surry County* Health System: covering 4,789 enrollees • Carolinas Medical Center Access II (Mecklenburg County): covering 19,432 enrollees • Forsyth County Carolina Access LLC: covering 19,095 enrollees
Access III
• Cabarrus County Community Care Plan: covering 11,031 enrollees • Community Care Plan of Pitt County: covering 24,194 enrollees (This project also covers
Edgecombe and Greene* counties) The 2001 NC General Assembly directed the state to expand Access II and III statewide. The DMA and ORDRHD’s strategy to achieve statewide coverage is to implement the programs in targeted urban areas and to gradually expand the networks to include providers in the contiguous rural counties. The state is developing a new governance model as it expands the program to rural areas. Under the new model, local communities will have local management committees including all the community partners, and will send representatives to participate in the regional management teams. Population-Based Health Management The most distinguishing feature of the Access II and III project is the emphasis on population-based health management and quality improvement initiatives. Access II and III are designed to identify and manage the care of high-risk Medicaid enrollees. Physicians are currently paid
∗ Non-MSA Counties.
36
$2.50 per member per month (pmpm) to manage the care of their Medicaid patients. Because Access II/III primary care providers have greater responsibilities in managing the care of their patients, they continue to receive the $2.50 pmpm case management fee (rather than have it reduced to $2.00 as under the Access I program). Access II and III networks are paid an additional $2.50 pmpm for all their Medicaid enrollees, which must be used for managed care activities such as hiring care coordinators, conducting risk assessments, and operating targeted disease and care management initiatives.12 Care coordinators play a central role in Access II and III sites, and are generally responsible for helping identify patients with high risk conditions or needs, assisting the providers in disease management education and/or follow-up, helping patients coordinate their care or access needed services, and collecting data on process and outcome measures. (The role of the care coordinators is described in more detail later in the report). The local Access II/III networks each have a local coordinating body that is comprised of representatives of the local medical community, hospital, DSS and health department. In addition, the networks must select a local physician to serve as the Medical Director. This physician participates in the statewide Clinical Director’s Group helping the state select statewide disease management projects. At the inception of the program, the statewide Clinical Director’s Group developed the following guidelines to consider in selecting disease management initiatives:13
• There are enough Medicaid enrollees with the disease to obtain a “return on investment” • Evidence exists that best practices lead to predictable and improved outcomes • Appropriate evidenced-based practice guidelines are available • Physicians will support the process • Patient education and support can improve outcomes • Best practices and outcomes are measurable, reliable, and relevant • There is room for improvement—a gap exists between best practices and everyday
practice • Ability exists to measure baseline and thus be able to measure improvement
Using these criteria, the group picked three projects to launch statewide—asthma (for children), diabetes (for adults), and unnecessary use of the emergency room.14 Asthma was the first initiative to be implemented; once that effort proved successful in the local Access II and III sites, the Clinical Director’s Group moved on to diabetes. At the same time, Access II/III networks were also required to identify high-cost individuals who might be appropriate
12 Because of budget shortfalls in the state, the North Carolina General Assembly has limited the amount of additional money that can be used to pay the additional $2.50 to the local network. To pay local networks the additional case management fee, the fee paid to primary care providers was reduced from $2.50 pmpm to $2.00 pmpm. 13 NC Office of Research, Demonstrations and Rural Health Development. Access II & III Update. July 2000. No 2. 14 The state explored the possibility of implementing an adult congestive heart failure (CHF) initiative, but found out that most of the adults were dually eligible (Medicaid and Medicare), and thus outside of the Carolina Access program.
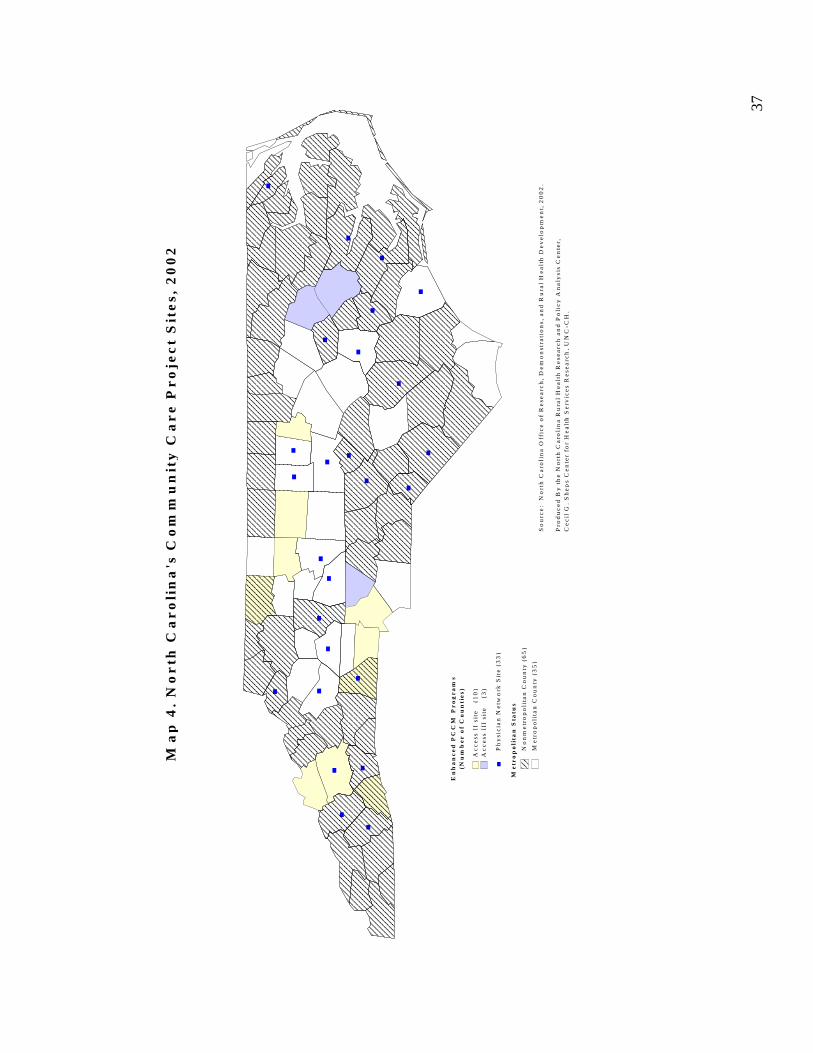
37
En
ha
nc
ed
PC
CM
Pr
og
ra
ms
(Nu
mb
er
of
Co
un
tie
s)
Ac
ce
ss I
I si
te
(10
)A
cc
ess
III
sit
e
(3)
Me
tro
po
lita
n C
ou
nty
(3
5)
No
nm
etr
op
oli
tan
Co
un
ty (
65
)
Ph
ysi
cia
n N
etw
ork
Sit
e (
33
)
Ma
p 4
. N
or
th C
ar
oli
na
's C
om
mu
nit
y C
ar
e P
ro
jec
t S
ite
s, 2
00
2
So
urc
e:
No
rth
Ca
roli
na
Off
ice
of
Re
sea
rch
, D
em
on
stra
tio
ns,
an
d R
ura
l H
ea
lth
De
ve
lop
me
nt,
20
02
.
Pro
du
ce
d B
y t
he
No
rth
Ca
roli
na
Ru
ral
He
alt
h R
ese
arc
h a
nd
Po
lic
y A
na
lysi
s C
en
ter,
C
ec
il G
. S
he
ps
Ce
nte
r fo
r H
ea
lth
Se
rvic
es
Re
sea
rch
, U
NC
-CH
.
Me
tro
po
lita
n S
tatu
s
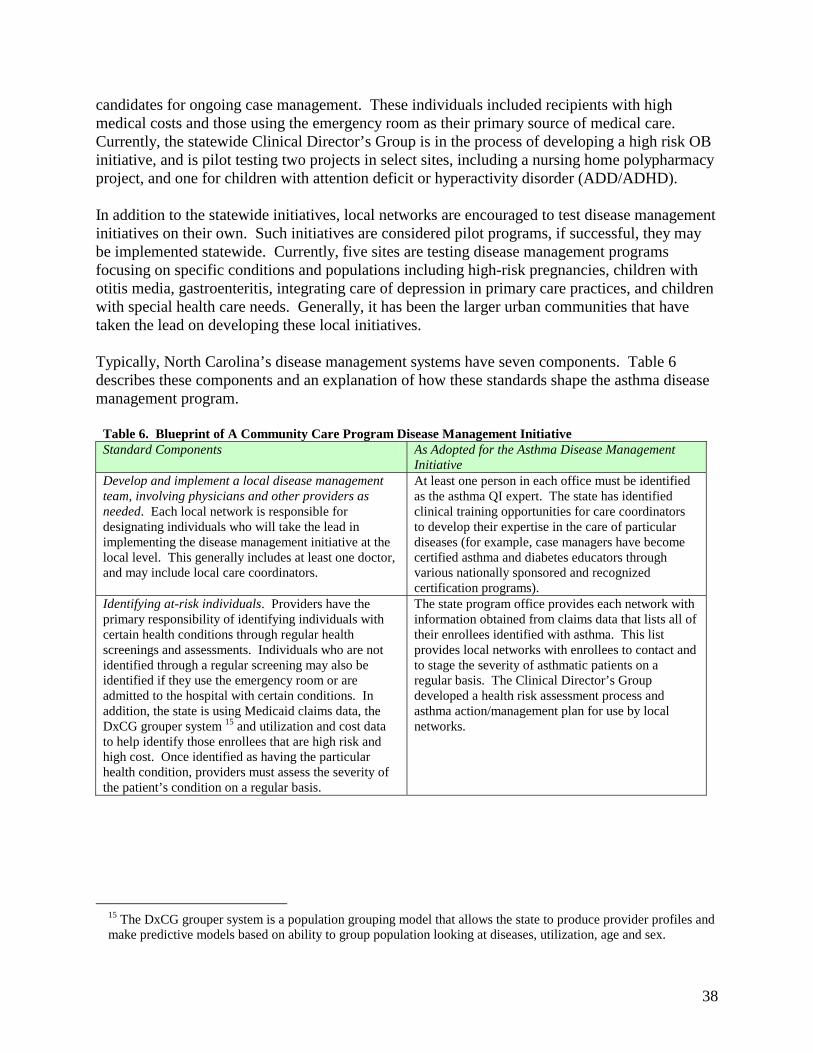
38
candidates for ongoing case management. These individuals included recipients with high medical costs and those using the emergency room as their primary source of medical care. Currently, the statewide Clinical Director’s Group is in the process of developing a high risk OB initiative, and is pilot testing two projects in select sites, including a nursing home polypharmacy project, and one for children with attention deficit or hyperactivity disorder (ADD/ADHD). In addition to the statewide initiatives, local networks are encouraged to test disease management initiatives on their own. Such initiatives are considered pilot programs, if successful, they may be implemented statewide. Currently, five sites are testing disease management programs focusing on specific conditions and populations including high-risk pregnancies, children with otitis media, gastroenteritis, integrating care of depression in primary care practices, and children with special health care needs. Generally, it has been the larger urban communities that have taken the lead on developing these local initiatives. Typically, North Carolina’s disease management systems have seven components. Table 6 describes these components and an explanation of how these standards shape the asthma disease management program.
Table 6. Blueprint of A Community Care Program Disease Management Initiative Standard Components As Adopted for the Asthma Disease Management
Initiative Develop and implement a local disease management team, involving physicians and other providers as needed. Each local network is responsible for designating individuals who will take the lead in implementing the disease management initiative at the local level. This generally includes at least one doctor, and may include local care coordinators.
At least one person in each office must be identified as the asthma QI expert. The state has identified clinical training opportunities for care coordinators to develop their expertise in the care of particular diseases (for example, case managers have become certified asthma and diabetes educators through various nationally sponsored and recognized certification programs).
Identifying at-risk individuals. Providers have the primary responsibility of identifying individuals with certain health conditions through regular health screenings and assessments. Individuals who are not identified through a regular screening may also be identified if they use the emergency room or are admitted to the hospital with certain conditions. In addition, the state is using Medicaid claims data, the DxCG grouper system 15 and utilization and cost data to help identify those enrollees that are high risk and high cost. Once identified as having the particular health condition, providers must assess the severity of the patient’s condition on a regular basis.
The state program office provides each network with information obtained from claims data that lists all of their enrollees identified with asthma. This list provides local networks with enrollees to contact and to stage the severity of asthmatic patients on a regular basis. The Clinical Director’s Group developed a health risk assessment process and asthma action/management plan for use by local networks.
15 The DxCG grouper system is a population grouping model that allows the state to produce provider profiles and make predictive models based on ability to group population looking at diseases, utilization, age and sex.
39
Developing a treatment plan, using standardized protocols. The state Clinical Director’s Group identifies nationally recognized practice guidelines that can be implemented by local practitioners. Participating health professionals are trained in the appropriate practice guidelines.
To ensure consistent care within and across practices, the local providers and medical staff are educated about how to stage asthmatics, the “step” approach to asthma management, and how to write an asthma action plan. Training is also provided about the proper use of anti-inflammatory medications, including the use of anti-inflammatories and/or inhaled corticosteroids for stage II, III and IV asthmatics.
Educate the patient and his or her family (as appropriate). Patients and/or their families must be educated about the specific disease condition, including how to assess and manage the condition. Disease management education is typically provided by the patient’s primary care provider, but may be augmented by one of the doctor’s nurses or office staff or the care manager. Some of the networks may also offer classes or clinics targeted at managing specific health conditions. In addition, the Access II and III case managers can provided targeted home visits as deemed appropriate.
Patients and their families are taught how to use peak flow meters to assess their asthma. Patients and their families are also taught how to use inhalers, spacers and/or holding chambers (as appropriate). They are also taught how to keep an asthma diary and are given literature on warning signs and triggers. Patients and their family are given a copy of the child’s asthma action plan, available in both English and Spanish. Some communities offer asthma clinics for children with more severe conditions or for families having problems managing the child’s asthma. For enrollees that are high risk or have experienced frequent ED visits for asthma, the case managers can visit their homes to perform an environmental assessment and focus on potential triggers and provide the appropriate family education and follow-up.
Provide individualized care coordination services for patients. Care coordinators help to identify high-risk or non-compliant patients (through review of emergency room admissions and hospitalizations), and may help in follow-up patient education. In addition, care coordinators help link patients to other community resources, and may help arrange transportation if needed to get to a doctors appointment. Depending on the severity of the individual’s conditions and their other psychosocial needs, the care coordinator may be responsible for contacting the patient on a weekly, biweekly or monthly basis.
Care coordinators identify children having problems managing their asthma, and may assist in additional patient education. The care coordinators may also be involved in environmental assessments for asthmatic children; particularly for those having problems managing their asthma.
Work with other community agencies or providers to manage the patients’ care.
Local schools and day care must be given a copy of the child’s asthma action plan.
Collect performance data and provide feedback to individual practitioners, group practices and the local network. The Clinical Director’s Group has identified outcome and process measures to evaluate the performance of individual providers, practices and the local network. Typically, outcome data includes hospital admissions or use of the emergency room, while process measures may include periodic assessments or treatment plans recorded in the medical records. The data are collected through claims databases and regular chart reviews.
Outcome measures included: inpatient admission rates, inpatient admission rates for asthma, emergency department utilization rate, and emergency department utilization rates for asthma. The process measures included: the proportion of asthma patients staged, the proportion of asthma patients staged as II, III or IV on corticosteroids, the proportion of asthma patients with an asthma management plan, and the percent of asthma patients receiving an annual influenza vaccine. The state analyzes claims data to determine outcomes, and care coordinators or other program staff are involved in semi-annual chart audits of a random sample of patient charts to determine compliance with the process measures.
40
Primary Care Providers Primary care providers in both Carolina Access and the Community Care Programs are responsible for managing the care of their patients, which includes the provision of regular primary care services and making referrals for specialty care and non-emergency hospitalizations. Primary care providers must be available to their patients 24-hours a day, 7-days a week. The provider has some flexibility in the 24/7-access requirement: they may either assume responsibility for after-hours call coverage him or herself, or can arrange after-hours coverage with other community providers, nurse call centers and/or the local hospital. The major difference between Carolina Access I and the Community Care Plan is the role that the providers play in disease management. There are no required disease management protocols that physicians must follow in Access I. However, physicians are expected to actively participate in the state’s disease management initiatives in the Community Care Plan (Access II and III). These providers are expected to follow the recommended clinical practice guidelines for assessing the patient and developing treatment plans (once the patient has been identified as having one of the conditions targeted for disease management). In some practices, the doctors or their nurses do the initial patient education, including teaching the patient how to monitor their condition, use medical equipment (such as a nebulizer or peak flow meter), follow their treatment plan, and identify warning signs that their condition is deteriorating. In other practices, the care manager assumes responsibility for the more intensive patient education. Care coordinators track patients closely in Access II and III sites, the frequency of patient contacts depends on the severity of the patient’s condition and whether the patient’s condition is stabilized. While each office may have a different system for following agreed upon guidelines, each office must ensure that the guidelines are followed. At each Community Care Program site, care coordinators, not employed by the practice, monitor a sample of all participating doctors’ (patient) charts to assess their compliance with the practice guidelines. Information from this chart review is fed back to the physician and his or her practice, to help improve patient care. One physician described the disease management program as follows:
The state’s first disease management initiative was asthma. The state sponsored a program at the NC Pediatric Society meeting on ‘staging’ of asthma patients. That’s when some of the doctors in our practice started using the new guidelines. Now, everyone in our practice does the staging and sets up asthma care plans. The doctors put a copy of the asthma action plan in the charts, give it to parents, and send it to the schools. The practice guidelines (care plans) and staging process makes caring for patients easier…I think that the chart audits help. I like to see what the other practices are doing, to compare ourselves to the other practices.
According to multiple respondents, the success of the disease management initiative depends on local physician leadership and whether the local physician can see “value-added” by participating in the practice guidelines. There does not appear to be any rural or urban differences in the availability of local leadership in the counties that have participated to date,but that may change as the state starts expanding the program to cover practices that did not volunteer to participate in Access II/III. Local physicians have competing demands for their

41
time and are more likely to deem the activity worthy of their time if their peers have accepted it and there is some evidence that the efforts lead to better health outcomes. In addition, the physicians have been responsive to this model because of the “value-added” by the care coordinators. Several of the physicians commented positively on the role that the care coordinators play, in following up with non-compliant patients, helping arrange for transportation or in addressing the non-medical issues that may be complicating the patient’s condition, such as lack of housing or need for other social services. The care coordinators add tangible benefits for the patient that the provider does not have time to offer. According to another physician, the real benefit of this model is getting local physicians to change their practice patterns for all patients:
It’s important to get providers to change their practice patterns—and you can’t do that from Raleigh or from separate disease management organizations. You might be able to obtain some cost savings and some results from disease management organizations (who make calls and follow-up with patients), but it’s hard in this model to get physicians to change their practice patterns unless they have a very large Medicaid population. The value of a community-based system of care is that you can involve the physicians to change their practice patterns for their entire patient population.
There has not been any rural/urban split in the willingness of local physicians to participate in the disease management initiative, but to date, the only practices that are participating are those that volunteered into the program. It is uncertain whether there will be any rural or urban differences in the physicians willingness to participate in Access II/III or to engage in new disease management protocols as the state expands the program statewide. Care Coordinators Access II and III sites must use some of the additional case management fees to hire local care coordinators, who may be either social workers or nurses. Care coordinators assume different responsibilities depending on the community and providers’ needs. Some doctors’ offices have case managers on staff to coordinate disease management initiative. However, many practices depend on the Community Care Program’s hired care coordinators to follow their patients. In some of the smaller rural areas, a care coordinator may be shared among different practices. In some practices, the doctor or nurse may provide the patient education; in other settings the care coordinator assumes this responsibility. In general, care coordinators help to identify Medicaid recipients in need of care management services, conduct health assessments, assist in patient education, conduct follow-up with the patient, address the patients’ psychosocial needs, and help in chart-audits. Typically, the care coordinators have caseloads of approximately 2,500 patients, but most patients do not have a health or psychosocial condition that warrants care management. Care coordinators typically have an active caseload of about 150-200 clients who need continual management; other patients can manage their own diseases and generally only require initial patient education and/or a six-month or twelve-month follow-up. The services provided and regularity of contact by the care coordinators depends on the intensity of the patient’s need.
42
The Disease Management Process Identifying Medicaid Recipients in Need of Care Management Services There are three primary ways that care coordinators identify Medicaid recipients who may need care management services: examining the hospital inpatient and emergency room records; conducting chart audits; and through provider referrals to the program. The following sections describe the case finding process: Inpatient/ED Visits Respondents in several of the sites told us that many patients are identified through hospital records. Typically, a care coordinator or other program staff will visit the hospital on a daily or weekly basis to pick up emergency department or other inpatient reports. Network staff will follow-up with the patient if the hospital records indicate that the hospital visit was inappropriate (e.g., for a non-emergency condition) or for a condition subject to disease management. In one community, care coordinators contact all Access II clients who inappropriately sought care in the emergency department. The care coordinator advises the patient on the proper way to seek care through their PCP before using the emergency room. In other communities, trained administrative staff assume the responsibility for follow-up with patients who inappropriately use the emergency room. However, if the hospital records indicate that the Medicaid recipient has asthma, diabetes, or one of the other conditions subject to disease management in that community, the case will be referred to a trained care manager for follow-up. Respondents indicated that reviewing local hospital records is useful in that it allows the identification of patients in “real time” who may need care management services. Care coordinators can review the hospital records of participating hospitals, but not all the hospitals in the Access II/III locations participate in the network. In two of the communities we visited, one hospital (the hospital with the largest number of Medicaid patients) chose to participate, and the other did not. Without a hospital’s cooperation in sharing records, care coordinators must rely on claims data sent by the state. These data are typically several months old by the time it reaches the care manager (because it is generated from the claims data which has a several month time lag). Another benefit of the hospital chart review is that care coordinators are often able to identify these patients while they are still in the hospital, which eliminates the arduous task of locating the beneficiary and also presents the care manager with the opportunity to provide patient education immediately (and at a time when they may be more receptive to the information given). Chart Audits Medicaid recipients in need of care coordination are also identified through chart audits of physicians’ medical records. Every six months, the Access II and III networks are required to review a sample of medical records of patients who have been treated for one of the conditions included in the area’s disease management projects. These patients are identified through claims data. (See below for a fuller description of the chart audits). Referrals Medicaid recipients may also be referred to the care coordinators by their primary care physician or other Community Care Program partners (such as a school nurse). Doctors offices sometimes
43
notify the care manager when they have patients who regularly miss appointments, may be in need of other social services, or there is some indication that the patient needs a home visit for more intensive patient education or for an environmental assessment. Once identified, the care coordinator contacts the patient. If the patient is still in the hospital, the care coordinator may initially visit the patient in the hospital. Otherwise, the care coordinator will attempt to contact the patient by phone. If the patient’s phone number listed in the eligibility files is not accurate, the care coordinator attempts to get an up-to-date number through hospital and/or physician’s records. The low-income Medicaid population is often difficult to reach by telephone because they do not all have telephones. Some beneficiaries have telephones in their own name, while others have access to a telephone through a family member or neighbor. In the event that the care manager cannot reach the patient by telephone, they may attempt to make a home visit.
Health Assessments A standardized health assessment tool for the Community Care Program was being developed at the time of the site visit. There will be both adult and pediatric versions of this assessment form. This form will be used in all Access II and III sites to identify patients with certain health conditions included in the program’s disease management initiatives (including asthma, diabetes, ADHD, etc.). The assessment also identifies psychosocial issues, such as depression, substance abuse, homelessness, limited English proficiency (LEP), and transportation problems, which might affect the patient’s health or access to healthcare. Ideally, the primary care provider will complete this assessment form during the patient’s first visit. However, if the primary care provider fails to conduct the health assessment, the care coordinator will complete the form during their first encounter with the patient. This may occur in person or over the phone (for example, as part of a follow-up after a visit to the emergency room). Patient Education Typically, the initial disease management education occurs in the doctor’s office. However, care coordinators often follow-up to make sure that their patients understand their treatment plans, including the use of monitoring devices (such as a peak flow meter, nebulizer or blood-glucose monitoring devices). Care coordinators may also provide basic nutritional counseling to the patients, and may conduct home visits, often at the request of the primary care provider. The home visit provides an opportunity to identify environmental hazards that may affect the patient’s health such as the absence of a smoke detector, or living or environmental conditions which may trigger asthma outbreaks. Follow-up Care coordinators assist patients in making follow-up appointments, arranging transportation, and in identifying patients who may need more intensive patient education or care. For example, a care manager may identify a patient who has problems with their treatment plan. The patient may need additional education (about self-monitoring, how to use equipment, or nutritional counseling), or may need a modification to the treatment plan. The care manager can work with the patient’s primary care provider to address the problems—for example, by conducting a home visit to get more information about the patient’s home environment, by providing additional disease management or nutritional education, by referring patients to specialized clinics (if
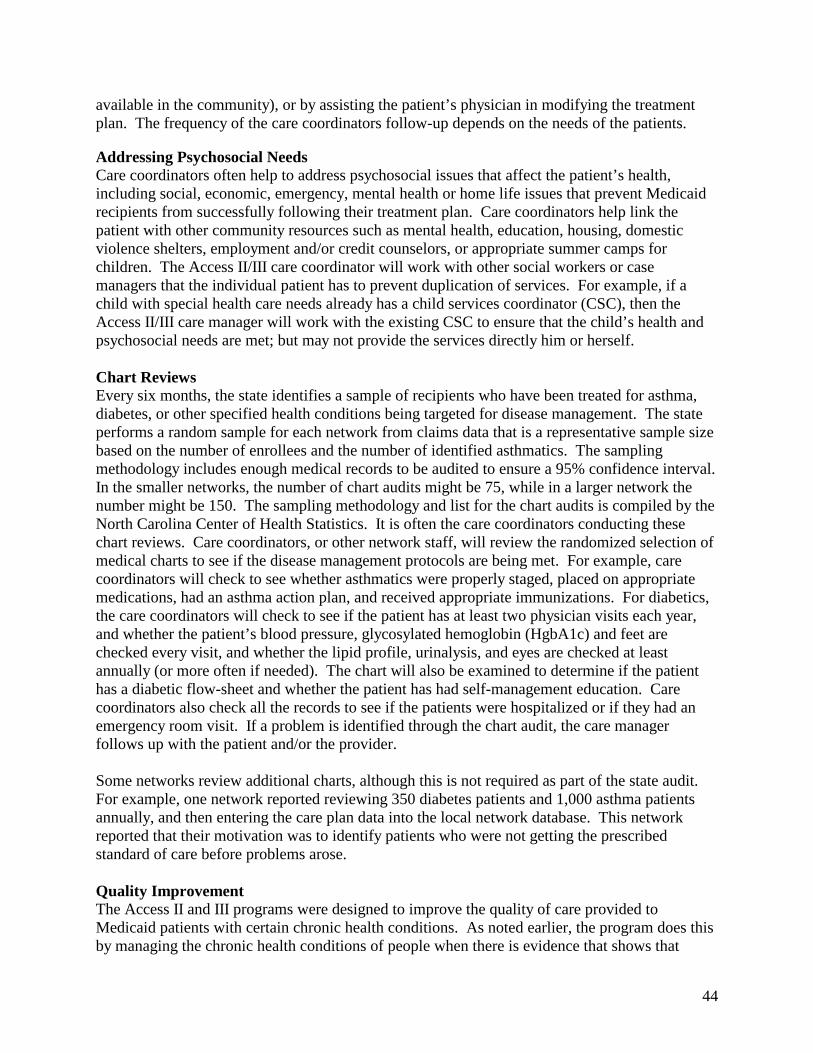
44
available in the community), or by assisting the patient’s physician in modifying the treatment plan. The frequency of the care coordinators follow-up depends on the needs of the patients. Addressing Psychosocial Needs Care coordinators often help to address psychosocial issues that affect the patient’s health, including social, economic, emergency, mental health or home life issues that prevent Medicaid recipients from successfully following their treatment plan. Care coordinators help link the patient with other community resources such as mental health, education, housing, domestic violence shelters, employment and/or credit counselors, or appropriate summer camps for children. The Access II/III care coordinator will work with other social workers or case managers that the individual patient has to prevent duplication of services. For example, if a child with special health care needs already has a child services coordinator (CSC), then the Access II/III care manager will work with the existing CSC to ensure that the child’s health and psychosocial needs are met; but may not provide the services directly him or herself. Chart Reviews Every six months, the state identifies a sample of recipients who have been treated for asthma, diabetes, or other specified health conditions being targeted for disease management. The state performs a random sample for each network from claims data that is a representative sample size based on the number of enrollees and the number of identified asthmatics. The sampling methodology includes enough medical records to be audited to ensure a 95% confidence interval. In the smaller networks, the number of chart audits might be 75, while in a larger network the number might be 150. The sampling methodology and list for the chart audits is compiled by the North Carolina Center of Health Statistics. It is often the care coordinators conducting these chart reviews. Care coordinators, or other network staff, will review the randomized selection of medical charts to see if the disease management protocols are being met. For example, care coordinators will check to see whether asthmatics were properly staged, placed on appropriate medications, had an asthma action plan, and received appropriate immunizations. For diabetics, the care coordinators will check to see if the patient has at least two physician visits each year, and whether the patient’s blood pressure, glycosylated hemoglobin (HgbA1c) and feet are checked every visit, and whether the lipid profile, urinalysis, and eyes are checked at least annually (or more often if needed). The chart will also be examined to determine if the patient has a diabetic flow-sheet and whether the patient has had self-management education. Care coordinators also check all the records to see if the patients were hospitalized or if they had an emergency room visit. If a problem is identified through the chart audit, the care manager follows up with the patient and/or the provider. Some networks review additional charts, although this is not required as part of the state audit. For example, one network reported reviewing 350 diabetes patients and 1,000 asthma patients annually, and then entering the care plan data into the local network database. This network reported that their motivation was to identify patients who were not getting the prescribed standard of care before problems arose. Quality Improvement The Access II and III programs were designed to improve the quality of care provided to Medicaid patients with certain chronic health conditions. As noted earlier, the program does this by managing the chronic health conditions of people when there is evidence that shows that
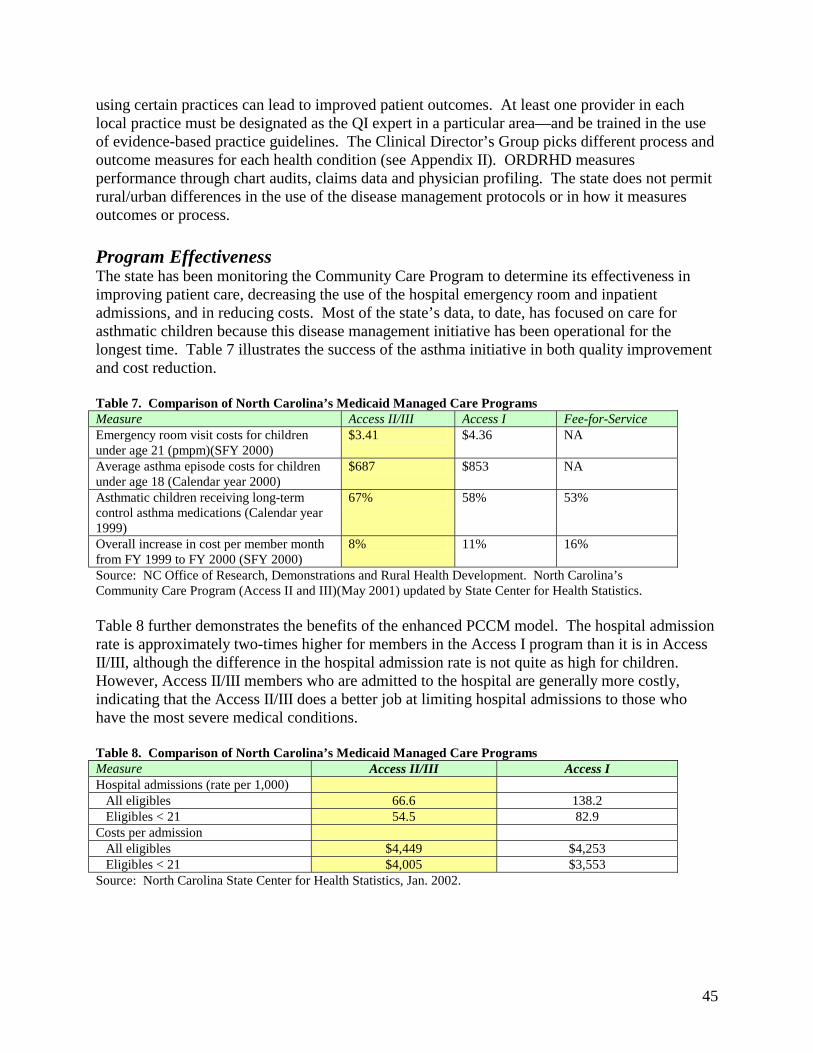
45
using certain practices can lead to improved patient outcomes. At least one provider in each local practice must be designated as the QI expert in a particular area—and be trained in the use of evidence-based practice guidelines. The Clinical Director’s Group picks different process and outcome measures for each health condition (see Appendix II). ORDRHD measures performance through chart audits, claims data and physician profiling. The state does not permit rural/urban differences in the use of the disease management protocols or in how it measures outcomes or process. Program Effectiveness The state has been monitoring the Community Care Program to determine its effectiveness in improving patient care, decreasing the use of the hospital emergency room and inpatient admissions, and in reducing costs. Most of the state’s data, to date, has focused on care for asthmatic children because this disease management initiative has been operational for the longest time. Table 7 illustrates the success of the asthma initiative in both quality improvement and cost reduction. Table 7. Comparison of North Carolina’s Medicaid Managed Care Programs Measure Access II/III Access I Fee-for-Service Emergency room visit costs for children under age 21 (pmpm)(SFY 2000)
$3.41 $4.36 NA
Average asthma episode costs for children under age 18 (Calendar year 2000)
$687 $853 NA
Asthmatic children receiving long-term control asthma medications (Calendar year 1999)
67% 58% 53%
Overall increase in cost per member month from FY 1999 to FY 2000 (SFY 2000)
8% 11% 16%
Source: NC Office of Research, Demonstrations and Rural Health Development. North Carolina’s Community Care Program (Access II and III)(May 2001) updated by State Center for Health Statistics. Table 8 further demonstrates the benefits of the enhanced PCCM model. The hospital admission rate is approximately two-times higher for members in the Access I program than it is in Access II/III, although the difference in the hospital admission rate is not quite as high for children. However, Access II/III members who are admitted to the hospital are generally more costly, indicating that the Access II/III does a better job at limiting hospital admissions to those who have the most severe medical conditions. Table 8. Comparison of North Carolina’s Medicaid Managed Care Programs Measure Access II/III Access I Hospital admissions (rate per 1,000) All eligibles 66.6 138.2 Eligibles < 21 54.5 82.9 Costs per admission All eligibles $4,449 $4,253 Eligibles < 21 $4,005 $3,553 Source: North Carolina State Center for Health Statistics, Jan. 2002.
46
Programmatic Challenges Despite some of its early successes, the Access II and III programs face significant challenges. First, it requires the buy-in of local providers and agencies. This program is heavily reliant on local physician leadership who can encourage other providers to participate, but this may not be available in every community. Further, hospital participation is not always guaranteed. In two of the counties we visited, one of the two local hospitals chose not to participate in the program. This makes it more difficult for care coordinators to obtain timely information about hospital admissions or use of the emergency room from those hospitals. Program financing is another challenge given the state’s current budget crisis. The North Carolina General Assembly directed DMA to expand the program statewide, but did not appropriate funds for this purpose. To expand the program may necessitate a reduction in the $2.50 pmpm Access II/III physician case management fee, which may negatively impact on providers’ willingness to participate in the program. Care coordinators face unique challenges working with the Medicaid population. Medicaid recipients do not all have regular phone services, making regular communication difficult. Because of budget constraints, there are no new funds available to increase the number of care coordinators in the counties, yet the state is considering adding new disease management initiatives. As the state develops new disease management initiatives, there are questions about whether existing care coordinators can assume the care coordination, patient education, and quality assurance responsibilities for a whole new group of patients and health conditions. Conclusions & Discussion About Rural Implications The knowledge and experience gained over the years has motivated the state to develop a regional approach for the programs’ expansion which will link small rural communities to a larger urban community and will create networks along existing referral lines. The past four years have shown that rural areas face unique challenges in implementing the program. Respondents noted that the additional $2.50 pmpm may not generate the necessary level of funding to support the program in some communities because of a limited population. Unlike the more urbanized areas of the state where thousands of recipients’ combine to create a substantial pool of money to hire staff and create program infrastructure; some rural communities may have too few enrollees to create the necessary funding base. This is a real potential barrier in enrolling some of the most remote and sparsely populated rural areas. Additionally, care coordinators in rural areas may have more responsibilities in coordinating the patient’s care because these communities have few existing resources available to assist with health education and to address the psychosocial needs of the patients. Rural care coordinators often have to manage the care of patients across a number of different practices, making it more difficult for the care manager to routinely communicate with both the providers and patients because of time constraints. Similarly, rural care coordinators may need to travel farther. This has already been raised as a potential barrier to expanding Access II/III to some of the remote mountainous areas of the state. Another challenge is the distrust some rural providers have of their urban regional partners; often there is fear that the urban providers may be trying to capture their patient base or exert control over the rural practices.
47
Most of the respondents interviewed for this study thought that the Access II and III model could work in rural areas, but that it would necessitate a regional approach. Regional networking helps reduce some, but not all, of the challenges described above. For example, the urban partners can assume some of the administrative support functions such as analyzing claims data from the state, setting up computerized data systems, supervising care coordinators, and absorbing some of the overhead costs that rural practices simply cannot afford. Also, a regional approach lends itself to beneficial networking opportunities for the rural practices. A multi-county and multi-practice approach allows providers to learn from each other, to share the leadership of different disease management initiatives, and to have a stronger voice with state agencies. The regional approach also benefits rural beneficiaries in that the collaboration helps to link rural patients with specialists in urban areas. In addition, the Access II/III model may actually help to reduce the need for specialists—as the disease management and care management program becomes more established, it will enhance the capacity of primary care providers to care for patients with chronic conditions without the need for specialty referrals. However, the Access II and III models require local physician buy-in. Thus, if the local physicians are resistant to working in a regional approach, it will be difficult to get the program to succeed. The program appears to work the best in communities where there are local physician leaders touting the program. Further, it may be more difficult to involve each of the rural partners to the same extent as in the urban area. For example, in one of the regional partnerships currently operating, DSS and the health department in the urban community are official partners in the Access II network, but the rural DSS and health department do not officially participate in the network. This may make it more difficult to get their “buy-in” and cooperation in achieving the programmatic goals. The state is trying to address some of these problems by developing local management teams that include providers, DSS, health department and hospital representatives in each rural community. This management team will be separate from, but connected to, the urban regional partner. Through this approach, the state hopes to reduce any potential distrust on the part of the rural providers (or fear that the medical care will be dictated by the urban providers); while at the same time affording the rural communities the administrative support and access to resources that can be provided by the urban partner. Several of the respondents noted that while this program is effective in both urban and rural areas, it may be needed more in rural areas. Because of the lack of resources in many rural communities, residents may not know where to turn for specialized care. In rural practices, which typically have a smaller staff than urban practices, a care manager may be a critical care extender and link to other health care and social service resources in the immediate and surrounding communities. In addition, care coordinators can help arrange transportation, which while a problem everywhere, is considered a more significant problem in rural areas. As one respondent noted:
Care management may be even more important in rural areas. There are a lot of people in the rural areas who have needs, but don’t seek care unless they have help with transportation and hooking them up with resources. Care coordinators can help people access the care they need, and help with patient education.
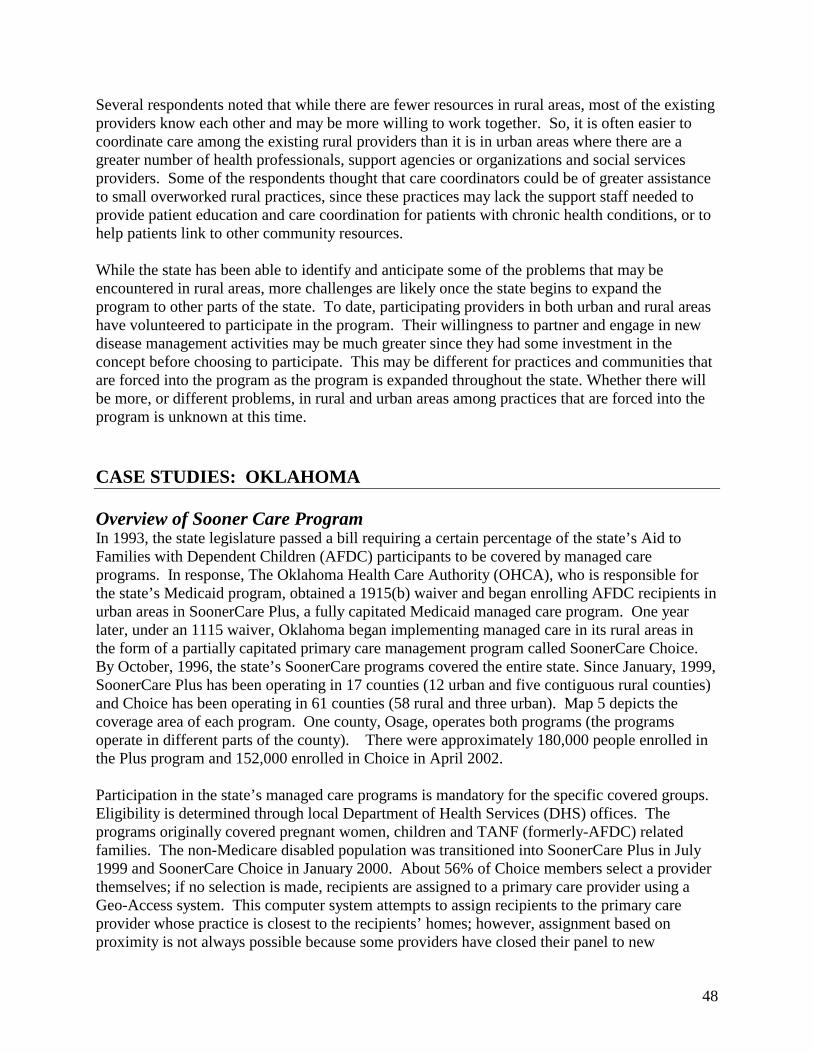
48
Several respondents noted that while there are fewer resources in rural areas, most of the existing providers know each other and may be more willing to work together. So, it is often easier to coordinate care among the existing rural providers than it is in urban areas where there are a greater number of health professionals, support agencies or organizations and social services providers. Some of the respondents thought that care coordinators could be of greater assistance to small overworked rural practices, since these practices may lack the support staff needed to provide patient education and care coordination for patients with chronic health conditions, or to help patients link to other community resources. While the state has been able to identify and anticipate some of the problems that may be encountered in rural areas, more challenges are likely once the state begins to expand the program to other parts of the state. To date, participating providers in both urban and rural areas have volunteered to participate in the program. Their willingness to partner and engage in new disease management activities may be much greater since they had some investment in the concept before choosing to participate. This may be different for practices and communities that are forced into the program as the program is expanded throughout the state. Whether there will be more, or different problems, in rural and urban areas among practices that are forced into the program is unknown at this time. CASE STUDIES: OKLAHOMA Overview of Sooner Care Program In 1993, the state legislature passed a bill requiring a certain percentage of the state’s Aid to Families with Dependent Children (AFDC) participants to be covered by managed care programs. In response, The Oklahoma Health Care Authority (OHCA), who is responsible for the state’s Medicaid program, obtained a 1915(b) waiver and began enrolling AFDC recipients in urban areas in SoonerCare Plus, a fully capitated Medicaid managed care program. One year later, under an 1115 waiver, Oklahoma began implementing managed care in its rural areas in the form of a partially capitated primary care management program called SoonerCare Choice. By October, 1996, the state’s SoonerCare programs covered the entire state. Since January, 1999, SoonerCare Plus has been operating in 17 counties (12 urban and five contiguous rural counties) and Choice has been operating in 61 counties (58 rural and three urban). Map 5 depicts the coverage area of each program. One county, Osage, operates both programs (the programs operate in different parts of the county). There were approximately 180,000 people enrolled in the Plus program and 152,000 enrolled in Choice in April 2002. Participation in the state’s managed care programs is mandatory for the specific covered groups. Eligibility is determined through local Department of Health Services (DHS) offices. The programs originally covered pregnant women, children and TANF (formerly-AFDC) related families. The non-Medicare disabled population was transitioned into SoonerCare Plus in July 1999 and SoonerCare Choice in January 2000. About 56% of Choice members select a provider themselves; if no selection is made, recipients are assigned to a primary care provider using a Geo-Access system. This computer system attempts to assign recipients to the primary care provider whose practice is closest to the recipients’ homes; however, assignment based on proximity is not always possible because some providers have closed their panel to new
49
Med
ica
id M
an
ag
ed C
are
Pro
gra
ms
(Nu
mb
er o
f C
ou
nti
es)
So
on
er C
are
Ch
oic
eS
oo
ner
Car
e P
lus
So
on
er C
are
Plu
s an
d C
ho
ice
Met
rop
oli
tan
Sta
tus
Met
rop
oli
tan
Co
un
ty (
14
)
No
nm
etro
po
lita
n C
ou
nty
(6
3)
Ma
p 5
. O
kla
ho
ma
's M
edic
aid
Ma
na
ged
Ca
re P
rog
ram
s,
20
02
So
urc
e:
Ok
lah
om
a H
ealt
h C
are
Au
tho
rity
(O
HC
A),
20
02
Pro
du
ced
by
the
No
rth
Car
oli
na
Ru
ral
Hea
lth
Res
earc
h a
nd
Po
licy
An
aly
sis
Cen
ter,
Cec
il G
. S
hep
s C
ente
r fo
r H
ealt
h S
erv
ices
R
esea
rch
, U
NC
-CH
(Nu
mb
er o
f C
ou
nti
es)(6
0)
(16
)
(1)
Map
5.
Okl
ahom
a’s
Med
icai
d M
anag
ed C
are
Prog
ram
s, 2
002
50
Medicaid recipients. If a recipient loses eligibility and reenrolls within 90 days, that person will be auto-assigned to his or her last provider. This 90-day “look back” system was implemented at the request of providers, who were concerned about the disruption in care of their patients due to recipient churning.16 From the inception of the managed care programs, OHCA pursued different strategies for urban and rural areas. Both programs were established as a means of improving access, establishing a medical home, and ensuring budget predictability. SoonerCare Choice was initially envisioned as a transition to full capitation in rural areas. The partial capitation model was designed to give rural providers some experience with capitation, but with limited financial risk. While the original goal was to move to full capitation statewide, OHCA was concerned that imposing a fully capitated program might discourage providers from participating in Medicaid altogether. After several years of experience with both programs, the state realized that there were parts of the state that would never support full capitation. SoonerCare Choice SoonerCare Choice is one of only three partial capitation programs operating in the country. It was designed specifically for rural practices and is the model used for nearly half of the state’s Medicaid population. Beneficiaries residing in counties where SoonerCare Choice operates select or are assigned to a PCP who is responsible for providing a specific set of primary care and care management services, for which they are paid a pmpm payment. Exceptional Needs Coordinators (ENCs), discussed in greater detail later in the report, are available to PCP's if the recipient has been identified as needing additional support. General practitioners, family physicians, internists, pediatricians, obstetrician-gynecologists, nurse practitioners, and physician assistants can serve as primary care providers under the Choice program. Specialists are permitted to enroll as PCPs, although not many have chosen to do so. OHCA contracts with individual and group practices, including providers with federally qualified health centers. Individual SoonerCare Choice PCPs are required to contract for a minimum of 150 recipients, whereas group practice providers contract for a minimum of 200 recipients. The upper limit for physicians is 2,500; Nurse Practitioners and Physician Assistants may have 1,250 patients, though under extenuating circumstances with approval the limit may be as many as 1,750. All but one of the counties participating in SoonerCare Choice has PCPs. There are no providers practicing in that one county, so Medicaid recipients are linked to PCPs in surrounding counties. SoonerCare Choice PCPs must authorize all non-emergency use of hospitals and visits to specialists; however, recipients have direct access to health departments for immunizations, family planning, OB services, TB screenings, HIV testing, and dental care. Medicaid recipients enrolled in SoonerCare have no co-payments for primary care visits, and are not limited to two
16 “Churning” is caused when Medicaid recipients move on and off of the Medicaid eligibility rolls (for example, a family with fluctuating income may be eligible for Medicaid in one month, and ineligible the following month). Providers were interested in a longer “look-back” period for auto-assignment for the Medicaid recipients. OHCA has since implemented an 180-day look back period (October 2002).
51
doctor’s visits/month as are Medicaid recipients in the traditional Medicaid fee-for-service (FFS) system. Partial Capitation Payments The SoonerCare Choice partial capitation payment covers medically necessary office visits to the primary care provider, EPSDT visits, injections and immunizations, basic lab and x-rays, basic family planning, and care management. Primary care capitation payments are based on nine different age and sex cohorts with adjustments based on eligibility category. The average rate for TANF recipients (families and children) was $15.90 per member per month, and $23.26 for Medicaid recipients who are aged, blind or disabled. Primary care providers also receive a $2 pmpm care management fee, which is increased to $3 for very young children ages birth through two years of age and for people with disabilities. Additionally, the state pays an additional $3 care management fee to providers to manage the care of patients with certain health conditions that require more time to manage, such as sickle cell anemia, hemophilia, HIV/AIDS, and those that are transplant-eligible. OHCA staff reported that one of the goals of the partial capitation payment was to help rural providers by giving them a predictable source of income. This payment system was thought to be particularly beneficial to new providers, who could use the steady Medicaid payments to address short-term cash-flow problems. This perception was confirmed by the rural providers and office staff with whom we talked. One of the rural practices noted that they preferred partial capitation over FFS because advance payments help them with cash-flow and they feel that patients are better served without the two-doctor visit/month limit. What makes the partial capitation system unique is that the provider is only at risk for a specified set of primary care services and there are limits to the amount of financial risk the PCP assumes. SoonerCare Choice has two mechanisms to limit physician financial risk: a stop-loss system implemented at program inception for TANF recipients, and a hold harmless provision for the disabled (this policy was implemented during the transition of the disabled into the program in January 2002)17. Under the stop-loss provision, Medicaid will pay providers on a fee-for-service basis once the costs for any individual TANF patient exceed $1,800 annually. Similarly, OHCA will pay providers the difference between the partial capitation fee and the FFS-equivalent value of the capitated services for disabled recipients. For providers who exercise this hold harmless provision, they are effectively paid on a fee-for-services basis. While these systems would theoretically protect PCPs from exorbitant losses, OHCA officials reported that no provider has requested the stop-loss or hold-harmless payments. Few of these providers with whom we talked knew about these special payment mechanisms. One rural practice explained that they are losing money on some of their Medicaid patients under partial capitation, because of over utilization of services, which they viewed as “abuse of the system.” When asked if they had availed themselves of the stop-loss or hold harmless payment protections, they claimed it was the first they had heard of the provisions.
17 These contract provisions are detailed in the Choice provider training manual.
52
Provider Relations Over the years, the state has focused a lot of attention on recruiting and supporting primary care physicians in order to improve access to care. In order to facilitate this activity, OHCA created a special contractor services unit that assumes responsibility for recruiting and training PCPs. The contractor services unit is made up of a contract services supervisor, six provider representatives, and one senior healthcare analyst. In the past, the staff focused on a broad range of activities including retaining and recruiting primary care physicians. More recently they have also taken an active role in provider training, contract management, and resolving provider complaints. Often this has required that the provider representatives work directly with the providers’ office staff, doing site visits as needed to help participating providers with questions about SoonerCare Choice. In 2001, OHCA expanded their team to include a contracted provider trainer, who has developed and implemented a curriculum for on-site training of new PCPs and established providers that have questions about aspects of the program. During these training sessions, PCPs and support staff are briefed on the general structure of SoonerCare Choice; their clinical and administrative responsibilities as PCPs; policies for enrollment, referrals, and payment; and resources for both providers and enrollees participating in SoonerCare Choice. A provider handbook, which is updated regularly, was developed by OHCA for use as an on-site reference for providers and their staff after their training sessions. SoonerCare Choice also held a series of “town meetings” throughout the state, during which provider representatives solicit feedback from providers about the Medicaid program. When SoonerCare Choice was first established, there was considerable provider opposition causing the town meetings to be adversarial. Providers complained about the quality of member education (i.e., about Medicaid recipients’ understanding of the SoonerCare Choice program and the need to obtain referrals from their primary care providers), auto-assignment, specialty referrals, and churning. OHCA has tried to address some of the problems—for example, by establishing a toll-free number for providers, as well as the 90-day look-back period in the auto-assignment process to try to promote continuity of care with an established provider, and through establishing the care management unit to assist with specialty referrals. According to OHCA staff, there seems to be more acceptance and stabilization of the program over the past few years as indicated by fewer provider complaints and lower turnout for the town meetings. The rural providers and their staff with whom we spoke were generally very positive about the assistance they have received from the contractor services staff. Two respondents in separate rural practices noted that the help they received from their provider representative was one of the best elements of the Medicaid program. The provider representatives come to their offices when needed, and help them work through administrative problems that arise. One respondent noted:
The provider rep is wonderful, she travels to the clinic if needed to assist with problems in coordinating care for clients and even helps by dismissing (non-compliant or disruptive) patients if needed.
Between 1996 and 2002, the number of participating primary care providers increased from 448 to more than 600. With the exception of some Native Americans living in remote tribal areas, all of the Medicaid recipients have been successfully assigned to PCPs within 45 miles from their
53
house18. In July 2001, the SoonerCare program implemented an American Indian Case Management program. As PCP participation in SoonerCare has stabilized, the provider representatives have been able to focus more of their attention on specialist recruitment. SoonerCare Helpline OHCA contracts with First Health Services to assist in member enrollment and education. First Health sends new enrollees information about either SoonerCare Plus or Choice (depending on where they live), and helps them in selecting a PCP or HMO. An explicit obligation in their contract is to telephone every new SoonerCare Choice enrollee, which averages approximately 200 to 400 monthly, to advise them on program usage. In addition, First Health Services is responsible for assisting all SoonerCare program enrollees if they want to change health plans or primary care providers, and to send out replacement insurance cards. In the first three months of 2002, the Helpline received between 27,000 and 37,000 calls per month. Many of these calls concerned issues out of the realm of Helpline information services, and contributed to call abandonment rates higher than the contractual 10% limit. The Helpline responded to this problem by screening all incoming calls as to purpose. Calls requesting information best provided elsewhere are referred, thereby routing to the Helpline call queue only those calls that the Helpline can effectively handle. The Helpline is responsible for submitting daily Dire Medical Reports to OHCA on calls that they reroute to the Nurse Advice Line. If the Helpline handles a call that involves a problem which cannot be resolved immediately, the Help Line forwards an “incident report” to OHCA, who must follow-up within five days of the receipt of this report. Nurse Advice Line All SoonerCare PCPs are required to ensure the availability of 24-hours-per-day/ 7-days-per-week telephone coverage which will immediately page an on-call medical professional. PCPs can meet this requirement by arranging for coverage through other providers. Another way they can meet this requirement is by having a phone message that that refers patients to the Nurse Advice Line serving SoonerCare Choice members. The state contracts with First Health to operate a separate Nurse Advice Line. The Nurse Advice Line is staffed entirely by registered nurses (RNs) with at least two years of experience, preferably in an intensive care unit or in an urgent or emergency care setting. There are 3-4 nurses staffing the phone lines during the day, and one or two people at night, providing advice to more than 20 facilities/groups including the SoonerCare Choice program. The advice line employs part-time Spanish-speaking staff and uses the AT&T language line for other translation when necessary. The Nurse Advice Line has provided service to SoonerCare Choice members since the beginning of the program. Over the course of a month, the Nurse Advice Line handles approximately 2,000 telephone calls from SoonerCare Choice members. Between 50-75% of incoming calls require nurses to triage patients with health problems, a smaller percentage (3-4%) are recipients requesting information about medications or with general health questions. Exhibit 1 displays the disposition of the calls to the Nurse Advice Line that required a medical issue. Calls recorded as ‘No Disposition’
18 OCHA’s analysis showed that there were approximately 600 Native Americans that did not have access to an I/T/U provider within 45 miles, which is the state’s prescribed access standard.

54
include calls meant for the Helpline, wrong numbers, or any calls concerning issues outside the contractual purpose of the Nurse Advice Line. Approximately half of the triage calls are pediatric cases. The majority of these calls are for cough, cold symptoms, fever, vomiting and diarrhea. For adults, the most common calls are for abdominal pain, anxiety, chest pain, headaches, and questions about post-operative procedures. Between 35-40% of callers are repeat callers. Information is forwarded to the primary care providers on a daily basis every time a patient is referred to the emergency room. Further, the staff follow up emergency room referrals to see if the patient followed their advice, had any problems with the emergency room, and if they were satisfied with the advice they were given. Most of the rural providers with whom we spoke reported having received faxes from the nurse advice line that they find to be helpful; however, they continued to set up after-hours call coverage locally, rather than rely on the nurse advice line.
Exhibit 1. SoonerCare Nurse Advice Line Triage Dispositions: January 2002
No Disposition41%
See PCP within 72 hours3%
See PCP within 2 weeks
1%
Place Call to PCP3%
Homecare13%
Other (pharmacy, lab, etc.)
1%
See PCP within 24 hours14%
Contact PCP within 4 hours
5%
See in Office Immediately
0%
Call Poison Control Center
1%
See in ED Immediately
16%
Activate EMS/9112%
Source: SoonerCare Choice Nurse Advice Line Monthly Report, March 2002.
Exhibit 1. SoonerCare Nurse Advice Line Triage Dispositions: January 2002 Member Service Line In addition to the SoonerCare Helpline and the SoonerCare Choice Nurse Advice Line, OHCA also operates a toll-free agency Medicaid member services line for recipients to call with billing concerns. Recipients’ Medicaid cards list the phone number for the member service line as well as the Helpline and the Nurse Advice Line. Several OHCA staff and provider representatives acknowledged that it was at times confusing for Medicaid recipients to know who to call for what type of problem.
55
SoonerRide SoonerRide was established to provide non-emergency Medicaid transportation to Medicaid recipients in the fee-for-service system and in SoonerCare Choice. The program originally started in six counties in June 1999 and rolled out statewide within a year. OHCA contracts with Metropolitan Tulsa Transit Authority (MTTA) to run the SoonerRide program via a call center and managed transportation subcontracts in all 77 counties. SoonerRide occasionally contracts with local Community Action Programs (CAP) to provide the transportation. SoonerRide will pay for the least expensive and most convenient form of transportation available to a qualifying recipient, ranging from taxis and van services to bus vouchers or mileage reimbursement. Transportation services are available from 6 am until 8 pm on weekdays and from 8 am to 1:00 pm on Saturdays. Under special circumstances and on a case-by-case basis, transportation may be arranged outside of these normal SoonerRide hours. When an eligible Medicaid recipient needs transportation to obtain a Medicaid covered service, the person calls a SoonerRide toll free phone number and the requested transportation is authorized and scheduled. Recipients are required to arrange their transport three-days in advance, but SoonerRide will try to work in patients even on short notice. The providers with whom we spoke were uniformly pleased with the SoonerRide program, noting that it helped their patients access medical services. Typically, patients work directly with SoonerRide to arrange transportation, although the physician’s office may help by giving patients the SoonerRide phone number. Providers noted that they had not heard of any problems from their patients in accessing these services. Care Management OHCA has a centralized care management team consisting of seven staff that was fully operational by February 2001. Five of the staff are nurses, the others health care analysts that assist in care coordination. The nurses function as exceptional needs coordinators (ENCs), working with patients with complex medical conditions. Some of the specific responsibilities of these ENCs include :
• Coordinating care for members with complex medical needs and/or exceptional health care costs.
• Processing and/or addressing member’s issues and concerns related to managed care. • Facilitating and coordinating discharge planning with physicians, facilities and members
(including negotiating members out-of-state care when comparable in-state services are not available).
• Assisting in locating and recruiting providers (including specialists, DME, home health, pediatric rehabilitation and lock-in providers).
• Addressing members access issues (including, but not limited to medical care). • Handling provider inquiries such as specialty referrals. • Addressing plan issues (including enrollment/disenrollment, providers, plan-to-plan
transitions, ENC collaboration). • Educating members with high-risk pregnancies, high service utilization, and medical
regimen noncompliance.
56
• Conducting lock-in evaluations for recipients with drug-seeking behaviors; scheduled medication requests; enrollees who refuse pain management referrals and/or alternative treatment/prescriptions; those using multiple providers/pharmacies; and for individuals who frequent the emergency room.
• Developing disease management protocols. Patients in need of care coordination are identified through providers, self-referrals (typically through calls to OHCA’s member service line), the Nurse Advice Line, OHCA provider representative, legislators and other state agencies. In addition, Medicaid recipients who have been locked-in to specific PCPs or pharmacists may be referred to the case managers—to ensure that the patient does not circumvent the system and bypass their designated PCP or pharmacist. Most of the rural providers with whom we spoke were aware of, and had used, the SoonerCare Choice care management unit for help with specialist referrals, autoassignment problems or for patient lock-ins. We did, however, talk to one practice that was unfamiliar with these services. In 2001, more than two-thirds of the Medicaid recipients assisted by the care management team were Choice members (67%). The care management staff also assist Plus members (18%), and Medicaid recipients in the fee-for-service (FFS) system. The unit received an average of 1,647 calls per month. Only a small subset of cases require active care management—at the time of our visit, the number of cases being actively managed was approximately 240. Most of the other phone calls dealt with access to specialists or lock-in referrals, and could be addressed over the phone or with a referral. In 2001, the most frequently requested specialty referrals were to dentists, OB/GYN physicians, neurologists, orthopedists, and psychiatrists. Each SoonerCare care management staff member has specialty areas (for example, high risk pregnancies, HIV/AIDS, transplants). Cases that fall within their specialty area are referred to them. The care managers will try to contact the patient by phone, and if unsuccessful, they will send a letter. Over half of the referrals they get do not have working phone numbers. The SoonerCare Choice care management program was modeled after the SoonerCare Plus program’s Exceptional Needs Coordinators. By contract, HMOs participating in SoonerCare Plus are required to have exceptional needs coordinators (ENCs) and other staff that help manage the care of patients. An internal study conducted by the largest participating HMO showed that the ENCs were very popular with their Medicaid recipients. As in the SoonerCare Choice Program, ENCs actively manage patients with specific conditions. Ventilator dependent children and/or children requiring skilled nursing, HIV/AIDS, hemophilia, sickle cell, schizophrenia, bipolar disorders, asthma, quadriplegia, transplants, TANF patients who have several behavioral health problems, and dialysis patients are all targeted for care management services. In SoonerCare Plus, the health plan ENCs are contractually required to make two contacts per month with their patients, and must have face-to-face visits for ventilator dependent or skilled nursing children. Because of limited resources and the central location of ENCs, the SoonerCare Choice care management staff employed by OHCA are unable to provide care management services to all recipients in need, and are heavily reliant on the phone to provide services. At the time of our site visit, the SoonerCare Choice care management staff depended on provider, agency or self-
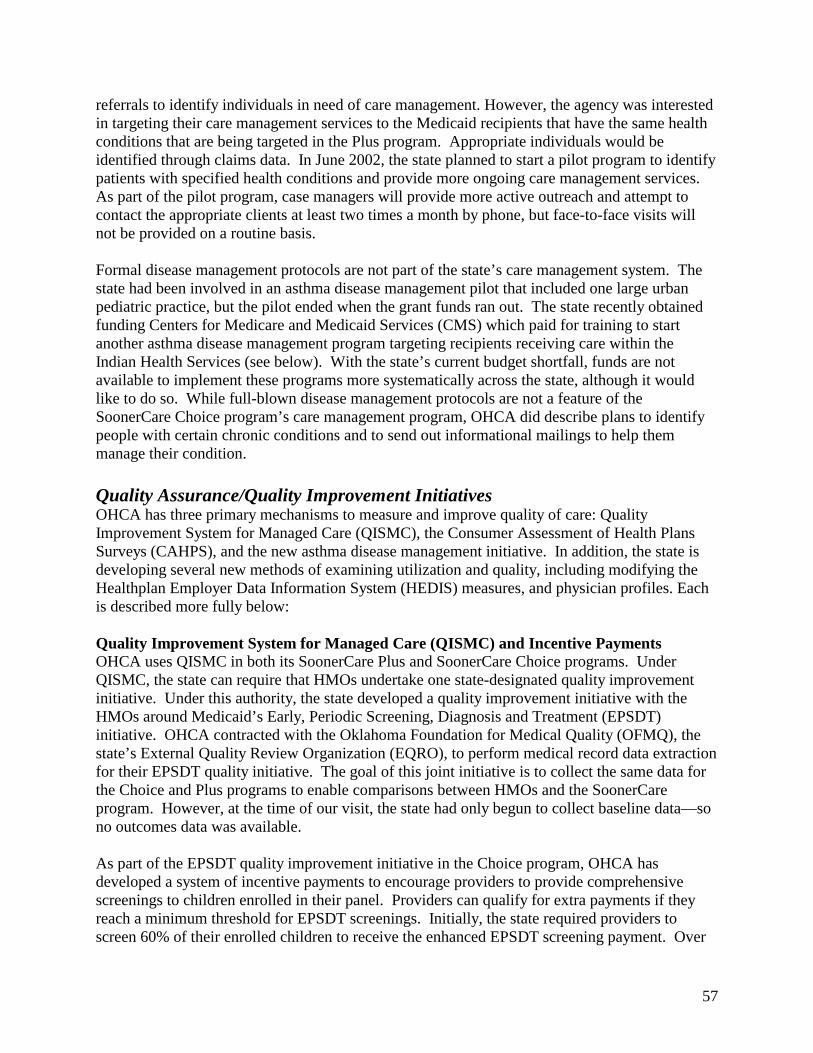
57
referrals to identify individuals in need of care management. However, the agency was interested in targeting their care management services to the Medicaid recipients that have the same health conditions that are being targeted in the Plus program. Appropriate individuals would be identified through claims data. In June 2002, the state planned to start a pilot program to identify patients with specified health conditions and provide more ongoing care management services. As part of the pilot program, case managers will provide more active outreach and attempt to contact the appropriate clients at least two times a month by phone, but face-to-face visits will not be provided on a routine basis. Formal disease management protocols are not part of the state’s care management system. The state had been involved in an asthma disease management pilot that included one large urban pediatric practice, but the pilot ended when the grant funds ran out. The state recently obtained funding Centers for Medicare and Medicaid Services (CMS) which paid for training to start another asthma disease management program targeting recipients receiving care within the Indian Health Services (see below). With the state’s current budget shortfall, funds are not available to implement these programs more systematically across the state, although it would like to do so. While full-blown disease management protocols are not a feature of the SoonerCare Choice program’s care management program, OHCA did describe plans to identify people with certain chronic conditions and to send out informational mailings to help them manage their condition. Quality Assurance/Quality Improvement Initiatives OHCA has three primary mechanisms to measure and improve quality of care: Quality Improvement System for Managed Care (QISMC), the Consumer Assessment of Health Plans Surveys (CAHPS), and the new asthma disease management initiative. In addition, the state is developing several new methods of examining utilization and quality, including modifying the Healthplan Employer Data Information System (HEDIS) measures, and physician profiles. Each is described more fully below: Quality Improvement System for Managed Care (QISMC) and Incentive Payments OHCA uses QISMC in both its SoonerCare Plus and SoonerCare Choice programs. Under QISMC, the state can require that HMOs undertake one state-designated quality improvement initiative. Under this authority, the state developed a quality improvement initiative with the HMOs around Medicaid’s Early, Periodic Screening, Diagnosis and Treatment (EPSDT) initiative. OHCA contracted with the Oklahoma Foundation for Medical Quality (OFMQ), the state’s External Quality Review Organization (EQRO), to perform medical record data extraction for their EPSDT quality initiative. The goal of this joint initiative is to collect the same data for the Choice and Plus programs to enable comparisons between HMOs and the SoonerCare program. However, at the time of our visit, the state had only begun to collect baseline data—so no outcomes data was available. As part of the EPSDT quality improvement initiative in the Choice program, OHCA has developed a system of incentive payments to encourage providers to provide comprehensive screenings to children enrolled in their panel. Providers can qualify for extra payments if they reach a minimum threshold for EPSDT screenings. Initially, the state required providers to screen 60% of their enrolled children to receive the enhanced EPSDT screening payment. Over
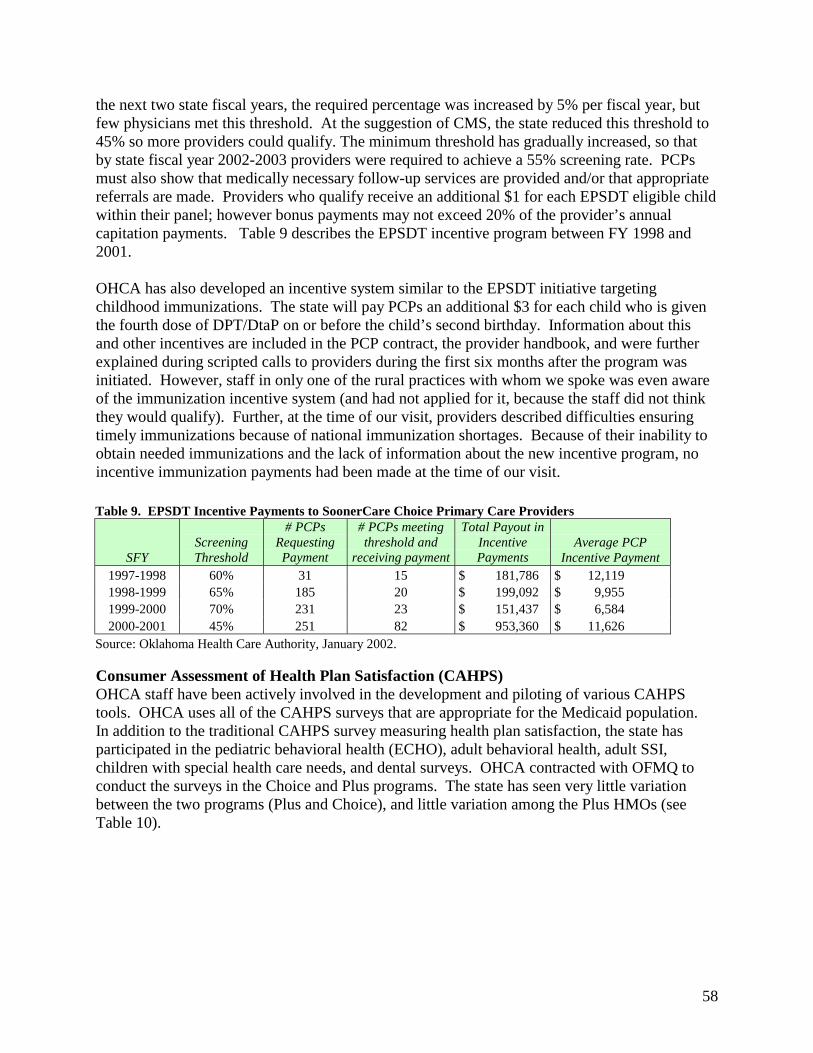
58
the next two state fiscal years, the required percentage was increased by 5% per fiscal year, but few physicians met this threshold. At the suggestion of CMS, the state reduced this threshold to 45% so more providers could qualify. The minimum threshold has gradually increased, so that by state fiscal year 2002-2003 providers were required to achieve a 55% screening rate. PCPs must also show that medically necessary follow-up services are provided and/or that appropriate referrals are made. Providers who qualify receive an additional $1 for each EPSDT eligible child within their panel; however bonus payments may not exceed 20% of the provider’s annual capitation payments. Table 9 describes the EPSDT incentive program between FY 1998 and 2001. OHCA has also developed an incentive system similar to the EPSDT initiative targeting childhood immunizations. The state will pay PCPs an additional $3 for each child who is given the fourth dose of DPT/DtaP on or before the child’s second birthday. Information about this and other incentives are included in the PCP contract, the provider handbook, and were further explained during scripted calls to providers during the first six months after the program was initiated. However, staff in only one of the rural practices with whom we spoke was even aware of the immunization incentive system (and had not applied for it, because the staff did not think they would qualify). Further, at the time of our visit, providers described difficulties ensuring timely immunizations because of national immunization shortages. Because of their inability to obtain needed immunizations and the lack of information about the new incentive program, no incentive immunization payments had been made at the time of our visit. Table 9. EPSDT Incentive Payments to SoonerCare Choice Primary Care Providers
SFY Screening Threshold
# PCPs Requesting Payment
# PCPs meeting threshold and
receiving payment
Total Payout in Incentive Payments
Average PCP Incentive Payment
1997-1998 60% 31 15 $ 181,786 $ 12,119 1998-1999 65% 185 20 $ 199,092 $ 9,955 1999-2000 70% 231 23 $ 151,437 $ 6,584 2000-2001 45% 251 82 $ 953,360 $ 11,626
Source: Oklahoma Health Care Authority, January 2002. Consumer Assessment of Health Plan Satisfaction (CAHPS) OHCA staff have been actively involved in the development and piloting of various CAHPS tools. OHCA uses all of the CAHPS surveys that are appropriate for the Medicaid population. In addition to the traditional CAHPS survey measuring health plan satisfaction, the state has participated in the pediatric behavioral health (ECHO), adult behavioral health, adult SSI, children with special health care needs, and dental surveys. OHCA contracted with OFMQ to conduct the surveys in the Choice and Plus programs. The state has seen very little variation between the two programs (Plus and Choice), and little variation among the Plus HMOs (see Table 10).
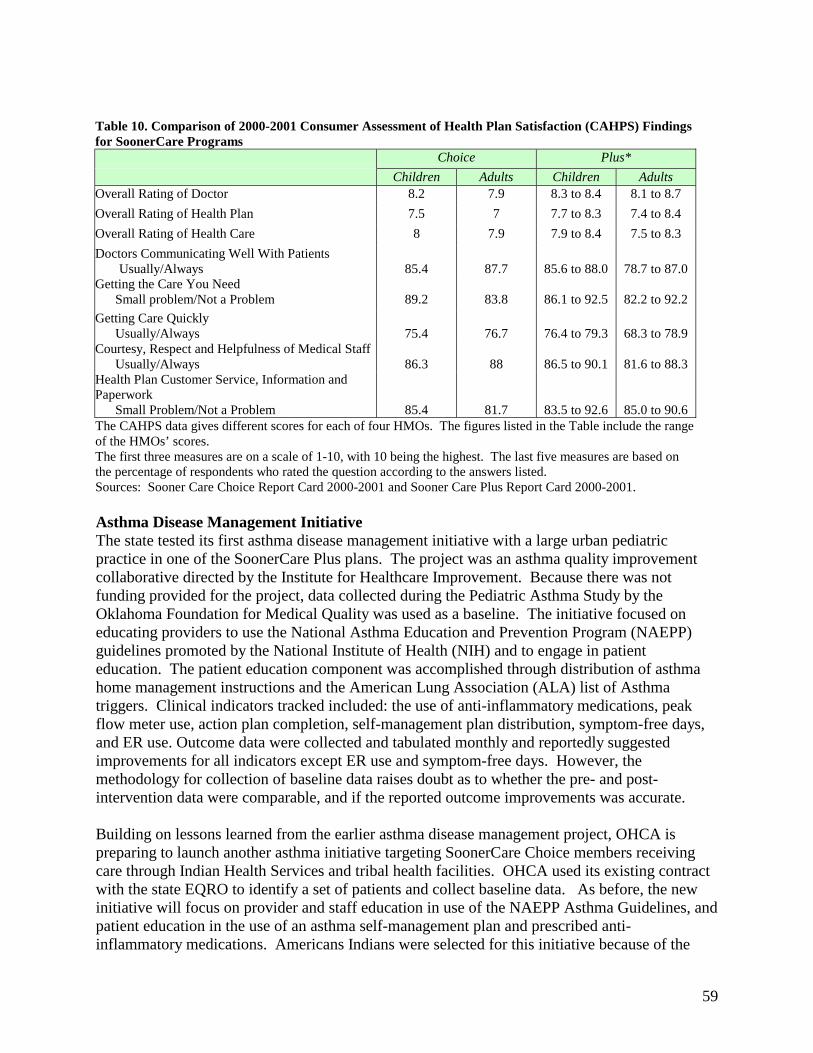
59
Table 10. Comparison of 2000-2001 Consumer Assessment of Health Plan Satisfaction (CAHPS) Findings for SoonerCare Programs Choice Plus*
Children Adults Children Adults Overall Rating of Doctor 8.2 7.9 8.3 to 8.4 8.1 to 8.7
Overall Rating of Health Plan 7.5 7 7.7 to 8.3 7.4 to 8.4
Overall Rating of Health Care 8 7.9 7.9 to 8.4 7.5 to 8.3
Doctors Communicating Well With Patients Usually/Always
85.4
87.7
85.6 to 88.0
78.7 to 87.0
Getting the Care You Need Small problem/Not a Problem
89.2
83.8
86.1 to 92.5
82.2 to 92.2
Getting Care Quickly Usually/Always
75.4
76.7
76.4 to 79.3
68.3 to 78.9
Courtesy, Respect and Helpfulness of Medical Staff Usually/Always
86.3
88
86.5 to 90.1
81.6 to 88.3
Health Plan Customer Service, Information and Paperwork Small Problem/Not a Problem
85.4
81.7
83.5 to 92.6
85.0 to 90.6 The CAHPS data gives different scores for each of four HMOs. The figures listed in the Table include the range of the HMOs’ scores. The first three measures are on a scale of 1-10, with 10 being the highest. The last five measures are based on the percentage of respondents who rated the question according to the answers listed. Sources: Sooner Care Choice Report Card 2000-2001 and Sooner Care Plus Report Card 2000-2001. Asthma Disease Management Initiative The state tested its first asthma disease management initiative with a large urban pediatric practice in one of the SoonerCare Plus plans. The project was an asthma quality improvement collaborative directed by the Institute for Healthcare Improvement. Because there was not funding provided for the project, data collected during the Pediatric Asthma Study by the Oklahoma Foundation for Medical Quality was used as a baseline. The initiative focused on educating providers to use the National Asthma Education and Prevention Program (NAEPP) guidelines promoted by the National Institute of Health (NIH) and to engage in patient education. The patient education component was accomplished through distribution of asthma home management instructions and the American Lung Association (ALA) list of Asthma triggers. Clinical indicators tracked included: the use of anti-inflammatory medications, peak flow meter use, action plan completion, self-management plan distribution, symptom-free days, and ER use. Outcome data were collected and tabulated monthly and reportedly suggested improvements for all indicators except ER use and symptom-free days. However, the methodology for collection of baseline data raises doubt as to whether the pre- and post-intervention data were comparable, and if the reported outcome improvements was accurate. Building on lessons learned from the earlier asthma disease management project, OHCA is preparing to launch another asthma initiative targeting SoonerCare Choice members receiving care through Indian Health Services and tribal health facilities. OHCA used its existing contract with the state EQRO to identify a set of patients and collect baseline data. As before, the new initiative will focus on provider and staff education in use of the NAEPP Asthma Guidelines, and patient education in the use of an asthma self-management plan and prescribed anti-inflammatory medications. Americans Indians were selected for this initiative because of the
60
high incidence of asthma in this population, and the opportunity to also work with the adult population with asthma who can receive prescriptions above the three prescription limit for adults in the State Plan for the rural population. Further, the Centers for Disease Control (CDC) and CMS have explicit interest in developing disease management initiatives that benefit American Indians. Healthplan Employer Data Information System (HEDIS) OHCA is in the process of identifying HEDIS measures that would be most appropriate in a partially capitated model, and plans to use the data to compare utilization between the Choice and Plus programs. Physician Profiling Physician profiles are not currently used to examine utilization or practice variations across practices in the Choice program. However, OHCA recently contracted with Electronic Data System (EDS) to develop their new Medical Management Information System. Once it is operational, the state hopes to be able to examine referrals patterns and utilization across providers as a method for monitoring quality and developing initiatives to improve quality. Indian Health Services (IHS) Initiatives Native Americans have always been able to have direct access to Indian Health Services, tribal or urban Indian providers (I/T/U) within the Medicaid system. However, American Indian Medicaid recipients enrolled in the Choice program were still required to obtain referrals for specialists and non-emergency hospitalizations from their traditional primary care providers. Beginning in July 2001, some of the I/T/U providers began participating in the Choice program as PCPs. This made it easier for American Indian Medicaid recipients, who were already using the I/T/U clinics as their medical home, to get necessary referrals. However, unlike other PCPs who receive capitation payments, individual I/T/U providers are only paid a care management fee and services are reimbursed on a FFS basis. Indian health facilities are reimbursed using an all-inclusive rate for services they provide. This policy is advantageous to both the providers and to the state because the federal government pays 100% of the charges, which is higher than the partial capitation rate that the state would otherwise pay, and the state does not have to contribute the non-federal match portion of payments for these Medicaid recipients. In April of 2002, there were 37 I/T/U clinics with approximately 170 participating providers. At the request of the I/T/U providers, OHCA is also developing a system for auto-assignment of American Indian Medicaid recipients to the appropriate I/T/U provider, although the system was not yet operational at the time of our visit. Such a program was viewed as desirable because it could ensure that Native Americans are assigned to I/T/U providers and eliminate the need for reassignment once the recipient seeks care and is determined eligible for I/T/U program benefits. In addition to the PCCM arrangement, OHCA is working with one of the Indian Health Service offices to start the asthma disease management program previously described. The program was under development at the time of our visit, so little additional information was available.

61
Conclusions & Discussion About Rural Implications Since the implementation of SoonerCare Choice, OHCA has been working to recruit more PCPs to participate in Medicaid. Program features such as the partial capitation payments, the contractor services unit, and to a lesser extent, the centralized care management system, appear to have addressed many of the provider concerns that previously discouraged primary care providers from participating in Medicaid. In addition to working to recruit more primary care providers, the state has improved patient access by establishing the SoonerRide program and by removing the two visits per month limit for primary care (the limit continues for specialty care). However, some problems persist in accessing primary care providers. While there are generally enough primary care providers to meet OHCA’s 45-mile access standards, providers in some parts of the state are still reluctant to participate in Medicaid. This causes burdens to the providers who are willing to accept Medicaid patients. Further, providers continue to have concerns with the state’s auto-assignment process. Several of the rural providers whom we interviewed commented that new patients are not being assigned to providers with whom they have established relations. Patients, not aware that they have been assigned to another provider, seek services from their traditional provider. This causes administrative burdens to the rural providers because their staff must contact the state provider relations office or Help Line to get approval to care for the patient and to get the patient re-assigned to their office. The state has several innovative models to encourage primary care providers to participate in SoonerCare Choice and to improve the quality of care provided to children. These include the partial capitation payments, stop-loss and hold-harmless payments, and the EPSDT and immunization incentive systems. However, providers are not uniformly aware of these programs. Many of these systems were new, which may explain why some providers were unaware of these initiatives. But to get the full benefit of these initiatives, more outreach may be necessary to primary care providers and their office staff. Overall, the state appears to have made significant headway in recruiting primary care providers. But there are still significant barriers in accessing certain specialists. Rural providers noted shortages of certain types of specialists, including pediatric neurologists, dentists, behavioral health, and podiatrists. Some of these specialists are unwilling to participate in the Medicaid program or want to limit their Medicaid panels—leading to access barriers that are exacerbated in rural communities. For other specialties, there are simply too few specialists practicing in the state; and those that are practicing are more likely to practice in an urban area. Having the contractor services staff focus more closely on specialty recruitment, and having the care management staff available to assist with specialty referrals may help, but will not eliminate all access barriers to specialists. The state faces bigger challenges in developing its care management and disease management initiatives. At the time of our visit, the state only had seven staff persons responsible for providing care management services to more than 152,000 SoonerCare Choice enrollees. The staff are responsible for direct patient assistance, coordinating care for individuals with complex medical needs, addressing patient access problems, supporting providers (e.g., helping to locate and recruit specialists and other type of medical suppliers, handle provider inquiries); and for handling inquiries from Congress and their state legislature. Further, the staff is involved in
62
developing the state’s disease management protocol. With so few staff and so many differing responsibilities, the state is unlikely to obtain the same positive health outcomes as states or managed care organizations that invest more heavily in case and disease management services. DISCUSSION & CONCLUSIONS The current instability of capitated-managed care, particularly in rural areas, places many states in the position of having to redesign their Medicaid managed care programs. States are beginning to develop innovative primary care case management programs as one vehicle to improve access, enhance quality, and reduce program costs in rural areas. As more states engage in this process, it is useful for them to understand the approaches that other states have taken to improve access and ensure high quality and efficient care for their rural enrollees. This study explored the experience of three states that have developed innovative primary care case management programs. They have each taken different paths, but contain some commonalities. All three of the states are employing case management techniques in their PCCM programs, and two of the three states (Florida and North Carolina) have gone a step further and invested heavily in disease management. Oklahoma relies more on other strategies to improve access and quality, including partial capitation payments to rural providers, a centralized nurse triage line and capitated transportation system. Two of the states are in the process of developing regional approaches linking smaller rural communities to urban centers. Each of these variations has significant implications for rural practice. Case management, a central feature of all three states, can be especially beneficial to rural enrollees as they can increase the resources available to small rural practices and provide needed social services that might otherwise be unavailable. However, the structure of these programs differed dramatically. Care coordinators (or case managers) in all three states help coordinate the clients’ medical care, and help link clients to other available services in the community. In Florida and North Carolina, the care coordinators also help with disease management, by providing more intensive patient education, monitoring the patient’s condition, and providing follow-up. Despite these similarities, there are significant differences in how these programs operate. In Florida, the state contracted with multiple DMOs to provide services directly to beneficiaries, while in North Carolina, it is the responsibility of local provider networks to hire case managers who work directly with the provider network in managing the patient’s care. Oklahoma has a centralized staff of case managers that work directly for the Medicaid agency. In the rural areas of Florida, the DMO case managers typically coordinate the care of beneficiaries in multiple counties. Because rural enrollees are more geographically dispersed, there is an incentive to conduct case management by telephone rather than in person, as is often the case in urban areas. This can create problems for some rural beneficiaries who lack access to regular telephone service. To address this inequality, states could consider higher case management fees for rural enrollees, with requirements regarding the provision of in-person services. This may be a bigger problem in the new Pfizer initiative, as some communities will be managed exclusively through a centralized call center, rather than through the network of hospital-based case managers.
63
The Florida model also has implications for rural practitioners. The use of multiple disease management contractors, each handling different conditions, may be difficult for small rural practices with limited administrative staff. Also, smaller practices may not have enough patients to establish relationships with multiple managers. This problem is being partially addressed through the new Pfizer initiative, which streamlines the number of different disease management organizations working with different patients. Nonetheless, in most communities, providers will still be required to interface with multiple disease management organizations. In the participating rural counties in North Carolina, there has been at least one case manager in every county and in some counties, multiple case managers. However, any given practice is usually assigned a single case manager. Case managers typically work closely with the local physicians, sometimes working directly out of the physicians’ offices or spending time each week with the physicians. While the telephone is still a primary method of reaching clients, case managers have greater ability to provide case management services directly to the clients, for example, in the beneficiaries’ homes or in the doctors’ office. Nonetheless, there are still disadvantages in rural communities. Case managers have to travel further, and spend more time, to reach the homes of some rural beneficiaries in sparsely populated communities. Further, in rural areas, case managers may have more responsibilities because of the lack of other available community resources to provide patient education or address psychosocial problems. Because of the way the program is financed (based on a per member per month case management fee), some of the rural networks may not have enough patients to generate the income necessary to hire sufficient numbers of case managers to meet the needs of the rural beneficiaries. North Carolina could address this problem by ensuring that all participating counties have sufficient resources to hire at least one case manager, and/or to increase the per member per month payments to adjust for the greater travel distances and time involved in providing care to rural beneficiaries. In Oklahoma, case management is provided by a centralized case management staff comprised of exceptional needs coordinators. In addition to traditional case management functions, the case managers help primary care providers with specialty referrals and in managing “lock-in” patients. Because of the lack of resources and centralized system, Oklahoma relies solely on the telephone for case management services. While the case management and provider relations staff appears to be doing a good job interfacing with rural physicians, they have less capacity to work intensively in meeting the health and psychosocial needs of rural beneficiaries. Other options to support rural beneficiaries and rural practitioners are worth exploring. Oklahoma appears to have some success with their capitated transportation system and nurse-triage line, both of which improve access to services for rural beneficiaries. Oklahoma’s provider relations and case management staff also have assisted rural providers in obtaining specialty referrals, when local specialists are unavailable. The findings from the three case studies suggest that states should consider factors that are unique to rural areas when designing their Medicaid managed care programs. Some of the factors that should be considered include: Small number of enrollees in geographic service areas. Rural counties typically have fewer Medicaid beneficiaries than urban communities. Providing in-home services to a rural
64
community often requires additional costs (in both travel and time). Further, per member per month payments may generate insufficient funds to support the program in some rural communities. States may need to adjust the case management fees to address these problems. Fewer resources in rural communities. In many rural communities, there are fewer resources available to address the health, psychosocial and other needs of rural residents. Rural recipients may have to travel out of the community for specialty care or for other needed services. Care coordinators can help link patients to needed resources. This may be easier for locally based care coordinators than those in regional or centralized locations, as locally based staff are likely to have a better understanding of the available resources in the immediate or surrounding counties. Ongoing transportation barriers. Transportation barriers are common in both urban and rural areas, but appear to be a bigger issue in rural communities. Not only do most rural areas lack public transportation, but rural residents often have to travel further to obtain needed health care services. Federal Medicaid laws require states to assure transportation so that Medicaid recipients can access necessary medical services; however, state transportation systems are not always effective. Oklahoma appears to have some success with its capitated transportation model that may be worth exploring in other states. Smaller practices with fewer administrative staff. Some rural practices are small, with few administrative staff. Requiring small rural practices to interface with multiple case managers or different disease management organizations can create administrative barriers. On the other hand, trained care managers can serve as care extenders for rural practitioners, helping to arrange transportation, link the patient to available social services, or assist in patient education. Other systems can be established to reduce barriers for rural practitioners, for example, by helping to facilitate referrals to specialists. These services—provided at either the state or local level—can assist rural practitioners who may be a sole source of care for large populations. Regional approaches. Regional approaches that link small communities to larger urban centers to create referral networks have the promise to improve care. But, if states rely on networking as part of their case management strategy, they need to develop strategies to address the potential distrust that some rural providers feel towards the larger urban providers. Developing enhanced primary care case management programs, with case management, disease management, and/or other systems to improve access and quality may be more challenging in rural areas. Despite these challenges, the value of such programs in rural areas is significant and should be worth considering across states.

65
APPENDIX I: DMO CONTRACT EXCERPTS (FLORIDA)
ATTACHMENT V METHOD OF PAYMENT
A. Introduction. 1. This is a fixed price (unit cost) contract. The Agency will manage this fixed price contract
for the delivery of services to enrolled members (service units). [CONTRACTOR] will be paid by the Medicaid fiscal agent in accordance with the [Contractor] of this contract for a total dollar amount not to exceed $ (Program Analysis to supply this), subject to the availability of funds. [CONTRACTOR] is prohibited from billing the recipient for disease management services.
2. [CONTRACTOR] will be paid by the Agency with a retrospective adjustment based on the
level of savings that occurs when comparing the Agency’s expected expenditures for [CONTRACTOR] enrollees to the actual expenditures for [CONTRACTOR] enrollees. The Agency will continue to pay submitted Medicaid fee-for-service claims through its fiscal agent for participating recipients. The Agency will reimburse Medicaid providers only for those services identified as compensable in the program specific Medicaid Coverage and Limitations handbooks.
B. Monthly Administrative Fee.
1. The Agency agrees to pay [CONTRACTOR] for the service units (enrolled members) at the unit price and limits listed below.
Service Units Unit Price Maximum # of Units Maximum Time 1. Enrolled members $ (DMO to supply
this) per member per month
(MediPass data to supply this) estimated members per month**
24 months of contract period
*[CONTRACTOR] reserves the right to resubmit a proposed budget once Tier II participant levels are established.
**[CONTRACTOR] will implement the disease management project in 4 phases during the first 8 months of the contract period.
These funds will be a “draw down” against [CONTRACTOR’S] share of anticipated cost savings. The purpose of this fee is to help [CONTRACTOR] invest in administrative activities (e.g. care management, education and outreach) that present short-term costs but long-term savings to the Agency.
Unless this contract is extended or renewed, no disease management services will occur during the third contract year and, therefore, no monthly administrative fees will be paid during the third year of the contract.
66
2. The total amount of monthly fees will vary from month to month based on census levels. The administrative fees will be paid to [CONTRACTOR] through the Medicaid fiscal agent on a monthly basis.
3. The Agency will verify the Census List monthly. All known adjudications to any prior month’s administrative fees (due to findings of Census List reviews) shall be made in the form of adjustments to an ensuing month’s administrative payment.
4. For each of the three years of the contract, the Agency does not intend for total actual payments (paid claims, MediPass PCP case management fees plus the DMO’s administrative fees) for enrolled recipients to exceed the total baseline payment. However, if the total actual payments exceed the baseline payment, [CONTRACTOR] will refund previously received administrative fees to the Agency, as necessary, so that the Agency’s total actual payments do not exceed the total baseline payment. In a worst-case scenario, [CONTRACTOR] would refund all administrative fees received from the Agency. [CONTRACTOR] will submit payment to the Agency within 90 days of notification that a refund of monthly payments is required.
5. The Agency shall not pay a monthly administrative fee for a recipient automatically enrolled in the [CONTRACTOR] disease management project should a [CONTRACTOR] assessment indicate a recipient does not have ESRD, or is enrolled in CMS.C.
C. Shared Savings.
1. [CONTRACTOR] may receive payment in the form of shared savings. Savings available to
be shared is the difference between actual Agency payments on behalf of [CONTRACTOR] enrollees (Medicaid claims payments including MediPass PCP case management fees) and the baseline payment.
2. Establishing the Baseline Payment:
(a) The baseline payment reflects an estimate of the level of MediPass recipient costs that the Agency would expect to incur in the absence of implementing the disease management initiative. The baseline payment will be derived from a claims analysis involving eligible MediPass recipients. These recipients will meet the Agency’s criteria for having characteristics of [DISEASE].
(b) For the identified recipients, the number of MediPass recipient case months will be
calculated for the 1997-98 fiscal year (defined as the “Baseline Period”). All paid claims for these recipients, while enrolled in MediPass, will be aggregated to determine total expenditures for the Baseline Period. The number of case months and the paid claims will be excluded for those months when recipients are in categories ineligible for disease
67
management services. These expenditures will be divided by the total number of case months for recipients eligible for [DISEASE] management to obtain a dollar expenditure amount per recipient per case month. This dollar expenditure amount per recipient per case month will be inflated based on yearly Medicaid budget adjustments and will be referred to as the baseline payment per recipient case month. This will be used in the calculation of the baseline payment.
(c) Fiscal year 1997-98 dates of service will be used to establish the Baseline Payment for
[CONTRACTOR’S] first operational year. Fiscal year 1998-99 dates of service (or the most current available fiscal data) will be used to establish the baseline payment for [CONTRACTOR’S] second operational year.
3. Cost Savings Calculation:
(b) Paid claims of all recipients enrolled with [CONTRACTOR] will be identified. Only claims with service dates during periods of [CONTRACTOR] enrollment will be used.
(c) Paid claims will be aggregated to determine the expenditures for the identified recipients
for all Medicaid service categories.
(d) Total cost savings will be calculated as follows: 1. [CONTRACTOR’S] baseline payment for the contract year, which includes
MediPass case management fees paid to primary care providers
2. Minus all Medicaid paid claims made on behalf of [CONTRACTOR] enrollees for dates of service during the contract year, which includes MediPass case management fees to primary care providers. Only claims incurred during periods of [CONTRACTOR] enrollment are included in the calculation.
4. Shared Savings Payments:
(a) It is the intent of the Agency that the [CONTRACTOR’S] portion of savings will be reasonable and related to [CONTRACTOR’S] costs and not reflect a disproportionate share of the cost savings.
(b) If total cost savings exist in a given contract year, these savings will be shared with [CONTRACTOR] as follows:
1. [CONTRACTOR] will receive X % (DMO to supply this) of the savings until the savings reach a figure representing X % (DMO to supply this) of [CONTRACTOR] actual spending for the enrolled population;
2. [CONTRACTOR] will receive X % (DMO to supply this) of additional savings above X % (DMO to supply this) of [CONTRACTOR’S] actual spending for the enrolled population and up to 133% of [CONTRACTOR’S] actual spending for the enrolled population; and
68
3. Notwithstanding 4. (b) 1., 2., [CONTRACTOR’S] total share of savings shall not exceed the lesser of: (a) 133% of the total budgeted expenses for the first two (2) years of the contract period, as reported in the revised budget submitted to the Agency by [CONTRACTOR] to be $X (DMO and Program Analysis to supply this), or (b) 133% of actual expenses incurred in completing the requirements of the contract.
(c) [CONTRACTOR] shall submit quarterly expenditure reports within 45 days of the end of each quarter. The expenditure reports shall be in the same format as the revised budget submitted to the Agency and shall show expenditures for the quarter, as well as, a year to date total of expenditures.
(d) Medicaid staff will perform the necessary analysis in order to determine total cost savings, the total monthly administrative fees previously paid to [CONTRACTOR] and the total amount that might be due [CONTRACTOR] for the contract year. Medicaid staff will transmit this information (including a statement of methodology and utilization data) to [CONTRACTOR’S] Project Manager. If money is owed to [CONTRACTOR] by the Agency, the Project Manager will submit an invoice to the Agency to be paid in compliance with F.S. 215.422. If [CONTRACTOR] owes the Agency money, the Project Manager will submit payment within 90 days of notification by the Agency.
(e) The Agency and [CONTRACTOR] agree to meet every six months after the contract effective date to review the status, calculation and methodology associated with the shared savings provision.
D. Reconciliation. 1. To allow for the adjudication of Medicaid claims, factoring in the delayed submission of
claims, the Agency and [CONTRACTOR] shall conduct three payment reconciliations. Each reconciliation will have the following components:
(a) the identification of a baseline payment;
(b) the determination of whether cost savings exist;
(c) the determination of the amount of [CONTRACTOR’S] share of cost savings, if any, that will be paid by the Agency to [CONTRACTOR]; and
(d) the determination of the amount, if any, that must be repaid by [CONTRACTOR] to the Agency.
(See Exhibit 1 to Attachment V for scenario examples illustrating C.4. (b) 1., 2. and D.1.(a-d)).
2. The reconciliation for the first contract year will be made after the first quarter of the second contract year. Cost savings will be determined after an analysis of paid claims with service dates during months 4 through 12 of the first year’s contract period, to allow for a three-month project start-up period. The total amount of paid claims will be adjusted to an annual amount. Although the first reconciliation will not include paid claims during the first three-months of the contract, the administrative fees paid during all twelve months of the contract year will be included in the reconciliation process. The amount owed to [CONTRACTOR]

69
will be calculated using the formula described within this contract. Reconciliation shall consist of determining whether the total amount of administrative fees paid to [CONTRACTOR] is greater or less than the amount owed to [CONTRACTOR]. If the amount owed to [CONTRACTOR] is larger than the total administrative payments, the Agency will pay [CONTRACTOR] the difference. If the total of the administrative payments is larger than the amount owed to [CONTRACTOR], [CONTRACTOR] will pay the Agency 100% of the difference within 90 days of notification.
3. The reconciliation for the second contract year will be made after the first quarter of the third
contract year. Cost savings will be determined after an analysis of paid claims with service dates during the second contract year. The amount owed to [CONTRACTOR] will be calculated using the formula described within this contract. Reconciliation shall consist of determining whether the total amount of administrative fees paid to [CONTRACTOR] is greater or less than the amount owed to [CONTRACTOR]. If the amount owed to [CONTRACTOR] is larger than the total administrative payments, the Agency will pay [CONTRACTOR] the difference. If the total of the administrative payments is larger than the amount owed to [CONTRACTOR], [CONTRACTOR] will pay the Agency 100% of the difference within 90 days of notification.
4. A final reconciliation will be made a year after the end of the second operational year to
precisely adjudicate the final paid claims totals for applicable service dates during the first 24 months of the contract period and with payment dates encompassing all applicable months of the contract. The final reconciliation will have the same components as the first and second contract year reconciliations. If the amount owed to [CONTRACTOR] is larger than the total administrative payments, the Agency will pay [CONTRACTOR] the difference. If the total of the administrative payments is larger than the amount owed to [CONTRACTOR], [CONTRACTOR] will pay the Agency 100% of the difference within 90 days of notification.
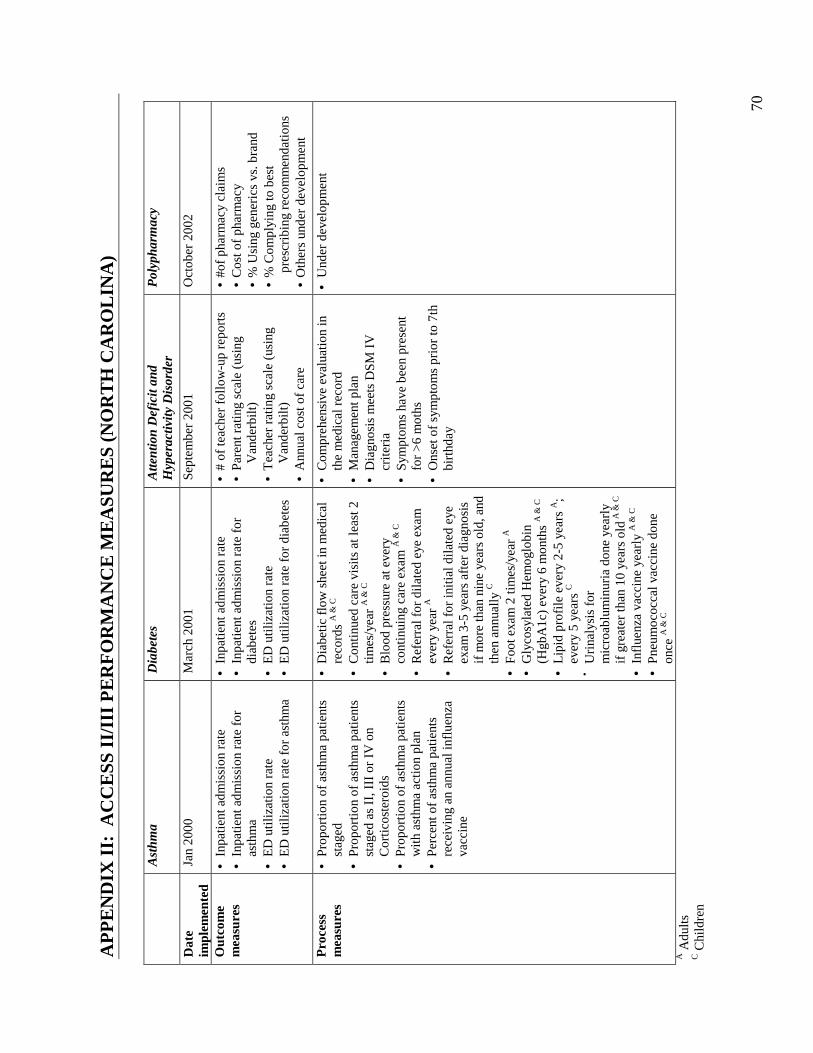
70
AP
PE
ND
IX I
I: A
CC
ESS
II/
III
PE
RF
OR
MA
NC
E M
EA
SUR
ES
(NO
RT
H C
AR
OL
INA
)
A
sthm
a D
iabe
tes
Atte
ntio
n D
efic
it an
d H
yper
activ
ity D
isor
der
P
olyp
harm
acy
Dat
e im
plem
ente
d Ja
n 20
00
Mar
ch 2
001
Sept
embe
r 20
01
Oct
ober
200
2
Out
com
e m
easu
res
• In
patie
nt a
dmis
sion
rat
e •
Inpa
tient
adm
issi
on r
ate
for
asth
ma
• E
D u
tiliz
atio
n ra
te
• E
D u
tiliz
atio
n ra
te f
or a
sthm
a
• In
patie
nt a
dmis
sion
rat
e •
Inpa
tient
adm
issi
on r
ate
for
diab
etes
•
ED
util
izat
ion
rate
•
ED
util
izat
ion
rate
for
dia
bete
s
• #
of te
ache
r fo
llow
-up
repo
rts
• P
aren
t rat
ing
scal
e (u
sing
V
ande
rbilt
) •
Tea
cher
rat
ing
scal
e (u
sing
V
ande
rbilt
) •
Ann
ual c
ost o
f ca
re
• #o
f ph
arm
acy
clai
ms
• C
ost o
f ph
arm
acy
• %
Usi
ng g
ener
ics
vs. b
rand
•
% C
ompl
ying
to b
est
pres
crib
ing
reco
mm
enda
tion
s •
Oth
ers
unde
r de
velo
pmen
t
Pro
cess
m
easu
res
• P
ropo
rtio
n of
ast
hma
patie
nts
stag
ed
• P
ropo
rtio
n of
ast
hma
patie
nts
stag
ed a
s II
, III
or
IV o
n C
ortic
oste
roid
s •
Pro
port
ion
of a
sthm
a pa
tient
s w
ith a
sthm
a ac
tion
plan
•
Per
cent
of
asth
ma
patie
nts
rece
ivin
g an
ann
ual i
nflu
enza
va
ccin
e
• D
iabe
tic
flow
she
et in
med
ical
re
cord
s A
& C
•
Con
tinu
ed c
are
visi
ts a
t lea
st 2
tim
es/y
ear
A &
C
• B
lood
pre
ssur
e at
eve
ry
cont
inui
ng c
are
exam
A &
C
• R
efer
ral f
or d
ilat
ed e
ye e
xam
ev
ery
year
A
• R
efer
ral f
or in
itial
dila
ted
eye
exam
3-5
yea
rs a
fter
dia
gnos
is
if m
ore
than
nin
e ye
ars
old,
and
th
en a
nnua
lly C
•
Foot
exa
m 2
tim
es/y
ear
A
• G
lyco
syla
ted
Hem
oglo
bin
(Hgb
A1c
) ev
ery
6 m
onth
s A
& C
•
Lip
id p
rofi
le e
very
2-5
yea
rs A
; ev
ery
5 ye
ars
C
• Uri
naly
sis
for
mic
roab
lum
inur
ia d
one
year
ly
if g
reat
er th
an 1
0 ye
ars
old A
& C
• In
flue
nza
vacc
ine
year
ly A
& C
•
Pne
umoc
occa
l vac
cine
don
e on
ce A
& C
• C
ompr
ehen
sive
eva
luat
ion
in
the
med
ical
rec
ord
• M
anag
emen
t pla
n •
Dia
gnos
is m
eets
DSM
IV
cr
iter
ia
• Sy
mpt
oms
have
bee
n pr
esen
t fo
r >
6 m
oths
•
Ons
et o
f sy
mpt
oms
prio
r to
7th
bi
rthd
ay
• U
nder
dev
elop
men
t
A A
dults
C C
hild
ren
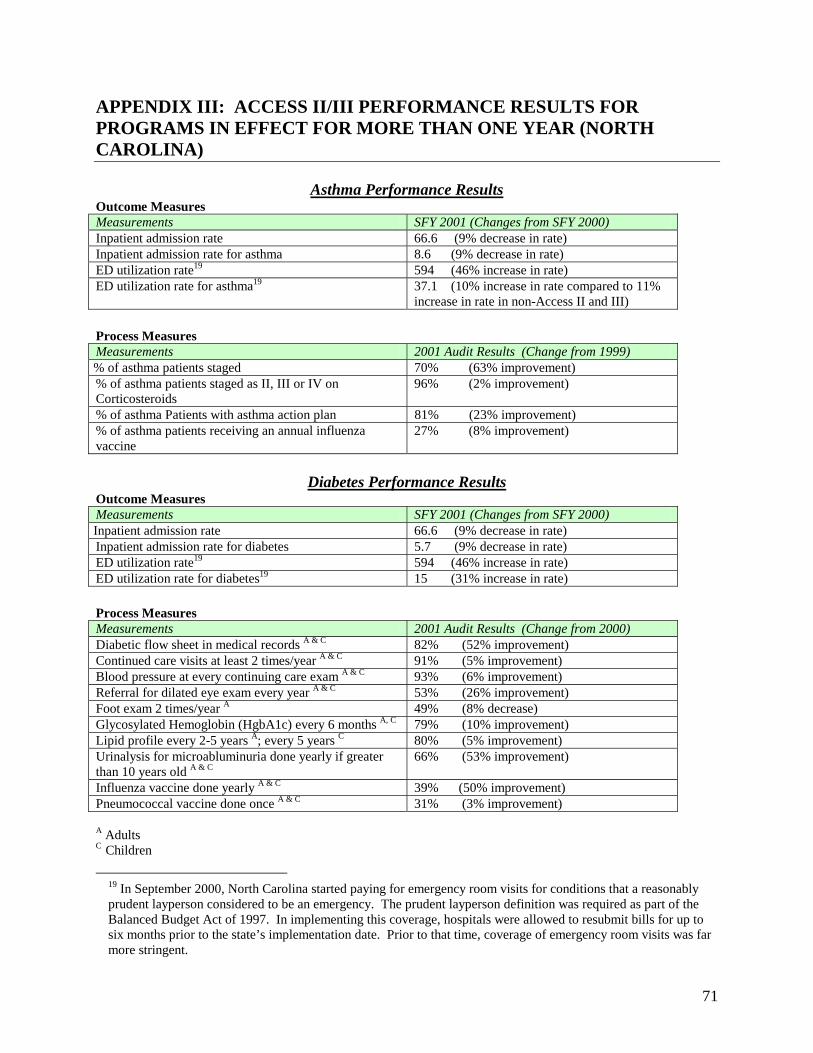
71
APPENDIX III: ACCESS II/III PERFORMANCE RESULTS FOR PROGRAMS IN EFFECT FOR MORE THAN ONE YEAR (NORTH CAROLINA)
Asthma Performance Results Outcome Measures Measurements SFY 2001 (Changes from SFY 2000) Inpatient admission rate 66.6 (9% decrease in rate) Inpatient admission rate for asthma 8.6 (9% decrease in rate) ED utilization rate19 594 (46% increase in rate) ED utilization rate for asthma19 37.1 (10% increase in rate compared to 11%
increase in rate in non-Access II and III)
Process Measures Measurements 2001 Audit Results (Change from 1999) % of asthma patients staged 70% (63% improvement) % of asthma patients staged as II, III or IV on Corticosteroids
96% (2% improvement)
% of asthma Patients with asthma action plan 81% (23% improvement) % of asthma patients receiving an annual influenza vaccine
27% (8% improvement)
Diabetes Performance Results
Outcome Measures Measurements SFY 2001 (Changes from SFY 2000) Inpatient admission rate 66.6 (9% decrease in rate) Inpatient admission rate for diabetes 5.7 (9% decrease in rate) ED utilization rate19 594 (46% increase in rate) ED utilization rate for diabetes19 15 (31% increase in rate) Process Measures Measurements 2001 Audit Results (Change from 2000) Diabetic flow sheet in medical records A & C 82% (52% improvement) Continued care visits at least 2 times/year A & C 91% (5% improvement) Blood pressure at every continuing care exam A & C 93% (6% improvement) Referral for dilated eye exam every year A & C 53% (26% improvement) Foot exam 2 times/year A 49% (8% decrease) Glycosylated Hemoglobin (HgbA1c) every 6 months A, C 79% (10% improvement) Lipid profile every 2-5 years A; every 5 years C 80% (5% improvement) Urinalysis for microabluminuria done yearly if greater than 10 years old A & C
66% (53% improvement)
Influenza vaccine done yearly A & C 39% (50% improvement) Pneumococcal vaccine done once A & C 31% (3% improvement)
A Adults C Children
19 In September 2000, North Carolina started paying for emergency room visits for conditions that a reasonably prudent layperson considered to be an emergency. The prudent layperson definition was required as part of the Balanced Budget Act of 1997. In implementing this coverage, hospitals were allowed to resubmit bills for up to six months prior to the state’s implementation date. Prior to that time, coverage of emergency room visits was far more stringent.