Embed Size (px)
Citation preview

Title Strategies to modify fiber structure and increase digestible energy in corn distillers dried grains with solubles ndash NPB 17-036
Investigator Pedro E Urriola Institution Department of Animal Science University of Minnesota Co-PIrsquos Zhikai Zeng and Gerald C Shurson Date Submitted Aug 1 2018
Industry summary The aims of this project were 1) to develop a new method for quantification of the feeding value of corn DDGS and 2) to increase extraction of nutrients from corn DDGS (a low energy feedstuffs) We used an in vitro digestibility assay that was developed in NPB project 13-014 We introduced modifications to the procedure that allowed us to understand what the characteristics of fiber are that are responsible for low digestible and metabolizable energy (DE and ME) in DDGS We used 15 sources of DDGS of known DE and ME and that we have preserved at ndash 20 degC (NPB project 11-136) We measured fermentability of neutral detergent fiber (NDF) after incubating DDGS with fecal inocula for 8 12 and 72 hours We observed that a significant portion of NDF (216) was degraded after 8 hours of incubation while it took another 72 hours to degrade 68 of NDF In addition the lower content of undigestible fiber in DDGS (uNDFom8) the greater apparent total tract digestibility (ATTD) of gross energy (R2 = 0881) and ether extract (R2 = 0382) These two characteristics of fNDFom8 made it a good predictor of the DE (R2 = 093) and ME (R2 = 092) content among the 15 sources of DDGS Subsequently we used x-ray diffraction to determine the relationship between crystalline configuration of fiber in DDGS and ATTD of NDF We observed that DDGS with low (445) ATTD of NDF had lower crystallinity index (92) than 122 in DDGS with high ATTD of NDF (573) These observations suggest that the differences in digestibility of fiber among sources of DDGS appears to be related to crystalline configuration of fiber This crystalline structure is more resistant to degradation in the large intestine of pigs Therefore for the second objective we used ammonia fiber expansion (AFEX) to degrade the unfermentable portion of fiber in DDGS from two sources (A and B) We measured in vitro digestibility of dry matter and energy during fermentation of the non-treated and treated DDGS with and without enzymes We observed that pretreatment of DDGS increased the digestibility of dry matter and energy it also increased in vitro DE from 3579 to 4502 kcalkg DM in DDGS A and from 3699 to 4225 kcalkg DM The effect of adding enzymes was negligible compared with AFEX
2
Key observations of this research 1) Digestibility of fiber differs among sources of corn DDGS and the difference in digestibility of fiber
appears to be due to crystalline configuration of fiber 2) The greater content of undigestible fiber in DDGS the less digestibility of gross energy protein
and lipids Consequently the greater content of undigestible fiber in DDGS the less DE and ME in DDGS
3) Ammonia expansion is an effective technology for increasing the energy value in corn DDGS Pedro E Urriola Urrio001umnedu Key words low energy feedstuffs energy value energy extraction feed efficiency Scientific abstract Volatile fatty acids produced from fermentable fiber contribute to digestible energy (DE) and metabolizable energy (ME) content of high fiber ingredients while unfermented fiber reduces DE and ME content Characterizing fiber portions into fermentable and unfermentable fractions may enhance the accuracy of estimating DE and ME content in fiber-rich ingredients Therefore the objective of the study was to determine the concentrations of fermented and unfermented neutral detergent fiber (NDF) among sources of corn distillers dried grains with solubles (DDGS) and determine their relative contributions to DE and ME content A second objective of this study was to increase degradation of fiber in corn DDGS to increase digestibility of energy For Exp 1 15 samples of corn DDGS with known values of apparent total tract digestibility (ATTD) of NDF were selected for their known content of DE and ME Samples of DDGS (05 g) were mixed with fecal inoculum and incubated in vitro for 8 12 and 72 h Ash corrected NDF (NDFom) content of DDGS residues at each time point were determined The disappearance coefficients of NDFom were 216 290 and 686 after inoculated with feces for 8 12 and 72 h respectively The ATTD of gross energy (GE) increased as the unfermented NDF decreased at 8 h (uNDFom8 R2 = 083 P lt 001) and 72 h (uNDFom72 R2 = 083 P lt 001) Likewise ME content of DDGS increased with the decreased unNDFom72 (R2 = 059 P lt 001) The best fit DE equation was DE (kcalkg DM) = 2175 ndash 307 times uNDFom8 (gkg DM) ndash 150 times uNDFom72 (gkg DM) + 055 times GE (kcalkg DM) [R2 = 094 SE = 3621] The best fit ME equation was ME (kcalkg DM) = 1643 ndash 231 times uNDFom8 (gkg DM) ndash 254 times uNDFom72 (gkg DM) + 065 times GE (kcalkg DM) ndash 142 times crude protein (gkg DM) [R2 = 094 SE = 3921] These results indicate that in vitro unfermented fiber is strongly negatively associated with GE and NDF digestibility Therefore we studied the structural characteristics of fiber in corn DDGS that are associated with unfermented fiber We used x-ray diffraction to measure crystallinity index of two sources of DDGS with low (445) and high (573) ATTD of NDF We observed that crystallinity index of DDGS with low ATTD of NDF (122) was greater than in DDGS with high ATTD of NDF (92) For Exp 2 we used ammonia fiber expansion (AFEX) to increase degradation of fiber in corn DDGS We collected DDGS from two ethanol plants with very distinct processes (A and B) The in vitro digestibility of dry matter (IVDMD) was less (P lt 005) in DDGS A and in DDGS B and addition of carbohydrase enzymes did no increase IVDMD Pretreating DDGS with AFEX increased IVDMD of DDGS A to greater extent (P lt 005) than DDGS B There was an interaction (P lt 001) between DDGS sources and AFEX for energy disappearance during fermentation (GEf) and estimated in vitro digestible energy (DE) of DDGS The pretreatment (AFEX) decreased (P lt 005) GEf in a greater manner for DDGS A (332 kcalkg DM feed) compared with DDGS B (154 kcalkg DM feed) However pretreatment (AFEX) increased (P lt 005) DE in a greater manner for DDGS A (922 kcalkg DM feed) compared with DDGS B (526 kcalkg DM feed) Consequently the AFEX pretreatment increased the DE of both sources of DDGS but the effect was
3
greater for source A Calculated DE of DDGS A after AFEX 4502 kcalkg was greater (P lt 005) than DDGS B 4225 kcalkg In conclusion composition of fiber varies among sources of corn DDGS This changes in composition of fiber have an impact on the energy value of DDGS where sources of DDGS with greater content of unfermentable fiber have less energy value because unfermentable fiber appears to decrease digestibility of other dietary components (especially protein and lipids) The reason that some sources of DDGS have less digestible fiber appears to be due to the crystalline configuration of fiber Pretreating DDGS with ammonia fiber expansion increased digestibility of energy in corn DDGS Introduction Utilization of agroindustry coproducts decrease overall feeding cost of pigs However most coproducts available in North America (eg corn distillers dried grains with solubles corn germ corn germ meal high protein distillers dried grains with solubles) have high content of dietary fiber (Shurson 2017) This dietary fiber decreases feed efficiency decreases energy digestibility and decreases overall nutritional efficiency (Kerr and Shurson 2013 Gutierrez et al 2016) Improving efficiency of utilization of dietary energy is necessary for maximizing utilization of resources The content of digestible energy (DE) and metabolizable energy (ME) among feed ingredient with high content of dietary fiber is less than other feed ingredients (Noblet and Le Goff 2001) This digestibility of energy is less because the extend of degradation of dietary fiber in the gastrointestinal tract of pigs is less than starch proteins and lipids (Noblet and Le Goff 2001 Blok et al 2015) Likewise there are large differences in degradability of dietary fiber among high fiber feed ingredients This was clearly demonstrated in our past NPB funded work (13-xx) and publications (Huang et al 2017a) We also demonstrated that using an in vitro digestibility system it is possible to accurately measure the digestibility of dietary fiber among feed ingredients (Huang et al 2017b) However the digestibility of dietary fiber varies among sources of the same ingredient (Urriola et al 2010) Therefore it is necessary to develop new technologies for the quantification of the feeding value of dietary ingredients Therefore the first objective of this project is to develop a method for measuring the impact of dietary fiber digestibility on the feeding value of corn DDGS Dietary fiber is the least degradable portion in many low-cost feedstuffs In addition dietary fiber decreases the ability of pigs to extract other nutrients (eg protein lipids starch) in low-cost high fiber feedstuffs Therefore it is necessary to increase degradability of dietary fiber in order to increase nutrient extraction from low energy feedstuffs There are multiple methods for increasing the digestibility of dietary fiber in low energy feedstuffs these include reduction of particle size (Liu et al 2012) addition of carbohydrate degrading enzymes (Zeng et al 2017) Addition of exogenous cabohydrase enzymes (eg xylanase glucanaze pectinase and combinations) is a common strategy to increase energy utilization from fibrouslow energy feed ingredients However the impact of these enzymes on energy uplift in corn DDGS is rather small and inconsistent Preliminary results from our pastNPB project (14-045 - Gut physiology and metabolomic profile of pigs fed diets with carbohydrase enzymes and dried distillers grains with solubles) suggest that the improvement of in vitro ileal digestibility of DM by commercial carbohydrases is associated with a decrease in fermentability of DM using in vitro digestibility procedures to measure hindgut fermentation This fiber digestion shift from the large intestine to small intestine diminishes the impact of energy uplift in DDGS through feed enzyme addition or similar technologies It is worth mentioning that this shift in energy and fiber digestibility is a consistent result observed in previous NPB projects (14-234) and in the literature (Bach Knudsen et al 2016 Gerrits and Vries 2016) Therefore it is critical to understand the reasons of this shift in the digestion of fiber in the intestine of pigs and to understand the conditions under that exogenous enzymes can increase NE in DDGS
4
Ammonia fiber expansion (AFEX) is one alkaline pre-treatment technology that disrupts the crystalline structure of cellulose and significantly enhances enzymatic digestibility from fiber rich biomass (Dien et al 2008) In ruminants AFEX treated forages were reported to have improved NDF digestibility when evaluated in vitro with rumen inoculum Actually the same research group tried to optimize AFEX pre-treatment conditions in corn DDGS and reported that almost all cellulose in DDGS was removed after 72 h of enzymatic hydrolysis and released 190 gglucose dry biomass Corn DDGS contains 58 cellulose and accounts for about 233 of total NSP (Jaworski et al 2015) If cellulose of DDGS were hydrolyzed before entering the hindgut of a pig we estimate that it will contribute with approximately 242 kcalkg DE (Noblet and van Milgen 2004) More importantly the portion of arabinoxylans buried in cellulose may be exposed and to degradation from exogenous enzymes bacteria organic acids or their combination Therefore we hypothesize that the shift induced by exogenous enzymes may be overcome if cellulose were removed before digesta flows into the hindgut Objectives as stated in the project proposal The overall objective of this project is to increase energy uplift from low energy feedstuffs by characterizing DDGS according to digestibility of fiber studying the structure of fiber and developing degradation procedures Specifically we will enhance 1 Understanding the relationship between crystallinity of DDGS and in vivo fiber and energy digestibility 2 Understanding structural changes on fiber from DDGS before and after ammonia fiber expansion (AFEX) pre-treatment as well as in vitro and in vivo digestion 3 Energy uplift in corn DDGS by combining exogenous carbohydrases with fiber pre-treatment to improve digestibility in the small and large intestine as well as digestibility of nutrients (protein starch fat and cellulose non-cellulose polysaccharides) using in vitro and in vivo methods A component of the second and third objectives was to measure energy uplift after pretreatment of DDGS with AFEX and carbohydrase enzymes This were described in the original grant However funding for in vivo digestibility measurements was deferred after analyzing results from objectives 1 and 2 Materials and methods The project is divided into two major experiments Experiment 1 for the first objective and experiment 2 for objectives 2 and 3 Experiment 1 Sample collection Fifteen sources of corn DDGS were obtained from different ethanol plants that represented diverse geographical locations of US corn production and different co-product processing technologies to capture variability in chemical composition among sources in the US market These 15 corn DDGS samples were used in our previous experiment to determine chemical composition in vivo apparent total tract digestibility (ATTD) of nutrients as well as DE and ME content for growing pigs (Kerr et al 2013) The digestible nutrient content of DDGS was calculated by multiplying total concentration by the corresponding ATTD values and the indigestible portion was subsequently calculated by the difference between total and digestible nutrient content Crystallinity index (CrI)
5
Crystallin configuration of structural carbohydrates in grains have been associated with accessibility of degrading enzymes and digestibility of fiber Our hypothesis is that greater crystallinity index will be a good measurement for the apparent total tract digestibility of fiber in corn DDGS We selected two sources of DDGS with different ATTD of NDF (445 vs 573) that collected from Kerr et al (2013) We scanned the samples by x-ray diffraction (XRD) to determine the degree of crystallinity of the structural fiber in these samples Briefly samples were front-loaded into shallow (ca 05 mm) wells machined into zero background holders manufactured from off-axis single crystal quartz The XRD measurements were performed on a Bruker D8 Advance System (Billerica MA) The diffracted intensity of Cu Kα radiation (λ = 01542 nm 40 kV and 40 mA) was measured in a 2θ range between 10o and 60o Crystallinity index (CrI) was calculated from the area ratio between the intensity of the crystalline peak and total intensity after subtraction of the background signal In vitro fermentation Feces were obtained from 3 finishing pigs (90 kg BW) from Cargill Animal Nutrition (Elk River MN) The pigs were fed a corn-wheat-soybean meal diet with no antibiotics Fecal samples were collected directly from the rectum immediately placed in zipper plastic bags without air and kept in a water bath at 39 degC until used as inoculum for incubation The time from fecal collection until incubation was less than 1 h Briefly 500 mg of DDGS samples were added to 125 mL serum bottles with rubber-stoppers containing 40 mL buffer solution containing macro- and micro-minerals (Rymer et al 2005) The inoculum was prepared by diluting blended feces in an inoculation solution composed of distilled water (474 mLL) trace mineral solution (012 mLL containing CaCl2 132 gL MnCl34H2O 100 gL CoCl2bull6H2O 10 gL and FeCl3bull6H2O 80 gL) in vitro buffer solution (237 mLL containing NH4HCO3 40 gL and NaHCO3 35 gL) macro-mineral solution (237 mLL composed of Na2HPO4 57 gL KH2PO4 62 gL MgSO47H2O 0583 gL and NaCl 222 gL) and resazurin (blue dye 01 wv solution 122 mLL) and was filtered through four layers of cheesecloth The final inoculum concentration was adjusted to 0094 g feces per mL of buffer which represented the same feces to substrate ratio used in previous studies (Huang et al 2017b Huang et al 2017a) Forty mL of inoculum was transferred into bottles containing DDGS samples and bottles were sealed with rubber stoppers before placing in a 39oC water bath for incubation Anaerobiosis was maintained in the inoculation solution by the addition of a reducing solution (distilled water 475 mLL 1 M NaOH 2 mLL Na2S 335 mgL) and CO2 Bottles were sealed with a rubber stopper and placed in the water-bath for incubation The fermentation was terminated after 8 12 or 72 h of incubation by placing bottles in ice and gas production was recorded at 2 5 8 12 16 20 24 30 36 48 and 72 h After the termination of fermentation the inoculum (40 mL) was directly mixed with NDF washing detergents (60 mL) and loaded on the reflux apparatus for NDF analyses as described by Mertens (2002) After reflux solubilization residues were filtered with the use of a glass microfiber filter (934-AHtrade by Whatmanreg Whatman Limited-GE Healthcare Maidstone UK) with porosity of 15 μm in Pyrexreg Gooch crucibles (40 to 60 μm Corning Inc Corning NY) Subsequently residues were ashed at 550degC to determine ash free NDF (NDFom) Blanks were created by inoculating the bottles with buffer fecal inoculum and were subjected to the same process as the test feed ingredients to adjust for any particles introduced into the in vitro fermentation system The NDF content of DDGS samples was analyzed in duplicate and all unfermented NDF residues after 8 12 and 72 h fecal incubation (uNDFom8 uNDFom12 and uNDFom72 respectively) were analyzed in triplicate The in vitro fermented NDFom (fNDFom8 12 and 72) was calculated by subtracting total NDFom and uNDFom after 8 12 and 72 h fecal incubation The digestibility coefficients of NDFom (DigNDFom8 12 and 72) were calculated by the ratio of digestible NDFom and total NDFom content
6
Gas accumulation curves were recorded during the 72 h of fermentation and were modified according to (France et al 2005)
G (mL gDM) = 0 if 0 lt t lt L G (mL gDM) = Gf (1-exp (-[b(t-L) + c ( ])) if t ge L
where G denotes the gas accumulation at a specific time (t) Gf (ml gminus1 DM) was the maximum gas volume for t = infin and L (h) represents the lag time before the fermentation began Gas accumulation rapidly reached one-fourth of the maximum accumulation in 2 h and the parameter L was very close to 0 which resulted in the model failing to converge Therefore L(h) data were removed from the final model The constants b (h-1) and c (hminus12) were used to determine the fractional rate of degradation of the substrate micro (hminus1) which is postulated to vary with time as follows
micro = b + c(2 ) t=T2 representing the time to half-asymptote when G = Gf2 Experiment 2 Sample collection and ammonia expansion pretreatment (AFEX) Two sources of DDGS were obtained (A and B) and sent to Michigan Biotechnology Institute (Lansing MI) for pretreatment with the ammonia expansion process (AFEX) Briefly samples were premixed with water to the desired moisture (60) and then were loaded in a 19 L reactor Air was removed from the reactor using a vacuum Anhydrous ammonia was preheated to the desired pressure (around 300 psi) in the ammonia loading vessel and the biomass was preheated to a target temperature (100 degC) The reactor was maintained at 100 plusmn5 degC and 300 plusmn20 psi for 30 min after all the preheated ammonia was loaded with 1 gg of dry DDGS In the end the pressure was gradually released and then the treated biomass was removed from the reactor Fiber fermentability The fermentability of fiber in corn DDGS (with or without AFEX) was determined by using modified in vitro fermentation Briefly about 05 g (plusmn 001) DDGS samples were directly weighted into pre-weighed filter bags (F57 Ankom Technology Macedon NY) which was sealed and put into 310 mL bottles with 75 mL buffer solution containing macro- and micro-minerals along with fecal inoculum (005gmL) and incubated at 39 degC A blank bag was inocubated and served as corrected blank control Feces were obtained from 3 finishing pigs (90 kg BW) from Cargill Animal Nutrition (Elk River MN) The pigs were fed a corn-wheat-soybean meal diet with no antibiotics Fecal samples were collected directly from the rectum immediately placed in zipper plastic bags without air and kept in a water bath at 39 degC until used as inoculum for incubation The time from fecal collection until incubation was less than 1 h Anaerobiosis was maintained in the inoculation solution by the addition of a reducing solution (distilled water 475 mLL 1 M NaOH 2 mLL Na2S 335 mgL) and CO2 The fermentation was terminated after 8 12 or 72 h of incubation by placing bottles in ice (n = 3 for each time point) The bags were put into oven and dried for 48 h at 60 C before neutral detergent fiber (NDF) analysis Three step in vitro digestion and fermentation Samples of DDGS were ground to pass 1 mm-mesh screen before undergoing in vitro pepsin and pancreatin hydrolysis according to the first step of the method (Boisen and Fernaacutendez 1997) Briefly about 2 g (plusmn 001) samples were weighed into 500 mL conical flasks A phosphate buffer solution (100 mL 01 M pH 60) and a HCl solution (40 mL 02 M) were added into each flask Solution pH was adjusted to 20 with 1 M HCl or 1 M NaOH In addition 2 mL of chloramphenicol (Sigma C-0378 Sheboygan Falls WI) solution (05 g 100 mLL ethanol) were added to inhibit microbial activity One milliliter of carbohydrases solution (Archer Daniels Midland Animal Nutrition Decatur IL) was prepared to provide 10 g enzymekg of DDGS and pipetted into the 500-mL conical flask The carbohydrases cocktail was composed of 1500
7
Ug xylanase 1100 Ug β-glucanase 110 Ug mannanase and 35 Ug galactosidase Prepared phytase solution (1 mL 20 FTU AB Vista Marborugth UK) was transferred to each flask across all treatments Fresh porcine pepsin solution (4 mL 25 g L P-7000 Sigma Aldrich St Louis MO) was added and flasks were closed with a rubber stopper and placed in a water-bath at 39 plusmn 05 C for 2 h under gentle agitation Subsequently 40 mL phosphate buffer (02 M pH 68) and 20 mL of 06 M NaOH were added to the solution The pH was adjusted to 68 with 1 M HCl or 1 M NaOH Fresh pancreatin solution (2 mL 100 gL pancreatin P-1750 Sigma) was added and hydrolysis was continued for 4 h using the same water-bath conditions as the ones for pepsin After hydrolysis the residues (n = 4 per treatment) were collected by filtration through a nylon bag (R510 50 μm porosity Ankom Technology Macedon NY) washed with ethanol (2 times 25 ml 95 ethanol) and acetone (2 times 25 ml 995 acetone) dried for 48 h at 60 C and weighed The enzymatic hydrolysis was repeated 12 times under the conditions described previously to obtain sufficient residue for multiple analyses Hydrolyzed residues from the different replicates and batches of same treatments (n = 6) were pooled for subsequent in vitro fermentation The remaining 6 replicates were pooled for GE determination using an isoperibol bomb calorimeter (Parr 6400 Parr Instrument Company Moline IL) The rate of fermentation of the hydrolyzed substrates was assessed in vitro using a cumulative gas-production technique (Bindelle et al 2007) Briefly 500 mg of pooled enzymatic hydrolytic residues for each treatment was added to 125 mL-glass bottles with 75 mL buffer solution containing macro- and micro-minerals (Menke and Steingass 1988) along with fecal inoculum (005gmL) and incubated at 39 degC Feces were obtained from 3 finishing pigs (90 kg BW) from Cargill Animal Nutrition (Elk River MN) The inoculum was diluted to 005 g of wet feces per mL of the buffer solution The prepared inoculum was filtered through a 250 μm screen and transferred into the bottle with fermentation substrates Bottles were sealed with a rubber stopper and placed in the water-bath for incubation An anaerobic environment was maintained throughout the experiment from the time of inoculum preparation until the incubation step by adding CO2 gas to bags and bottles The gas generated from fermentation was manually recorded at 0 2 5 8 12 18 24 36 48 and 72 h by using inverted burette assembly for gas measurement The bottles were vented to release gas that accumulated after every measurement Fermentation was terminated at 72 h of incubation by quenching the bottles in ice cold water At the end of the fermentation period the supernatant from each bottle was collected and frozen until analysis for short chain fatty acids (SCFA e g acetic propionic butyric and branched chain fatty acids) The unfermented residues were collected by filtration (R510 50 μm porosity Ankom Technology) washed dried and weighed following the same procedures described for the hydrolyzed residues Samples of the fecal inoculum prior to fermentation were also analyzed for SCFA concentrations Chemical analyses All samples and feed ingredients were ground with a laboratory mill to pass through 1 mm mesh screen Chemical analyses were performed according to the Association of Official Analytical Chemists standard procedures (AOAC 2007)(AOAC 2007) with specific methods as follows DM (135 degC for 2 h AOAC 93015) nitrogen (AOAC 96806 using an elemental analyzer LECO FP528 St Joseph MI USA crude protein = nitrogen times 625) acid-hydrolyzed fat using Soxhlet apparatus and petroleum ether (AOAC 92039) and ash (AOAC 94205) The GE was determined by bomb calorimeter (Parr 6400 Parr Instrument Company Moline IL) and benzoic acid was used as standard Neutral detergent fiber (NDF) acid detergent fiber (ADF) and lignin were determined using fiber bags and Fiber Analyzer (Ankom Technology Macedon NY USA) following an adaptation of the procedure described by (Van Soest et al 1991) The total and free AA profile were analyzed at the University of Missouri Agricultural Experiment Station Chemical Laboratories (Columbia MO) The non-protein nitrogen was calculated by differences of total nitrogen and total AA The SCFA were determined via gas chromatography (Agilent 6890 System
8
Boumlblingen Germany) after extraction with diethyl ether Briefly 2 mL of the samples were transferred into the centrifuge tube and 05 mL of sulfuric acid (11) 04 g sodium chloride 04 mL internal standard and 2 mL of diethyl ether were added (Urriola and Stein 2010) The samples were mixed for 2 min and centrifuged at 3000 times g for 3 min Subsequently the ether layer was transferred to vials and loaded on the gas chromatography analyzer (Agilent 6890 System) Calculations and statistical analyses The fermentability () of DM (NDF) at 8 12 and 72 h were calculated as equations disappeared DM (NDF) after 8 12 and 72 h fermentationtotal DM (NDF) content The fermented or unfermented NDF (gkg DM) at 8 12 and 72 h were calculated as equation total NDF content times fermentability or (1 ndash fermentability) In vitro digestibility of GE (IVDGE) and IVDDM during the pepsin and pancreatin hydrolysis were calculated as follows
IVDDM (GE) = (dry weight (GE) of the sample before hydrolysis minus dry weight (GE) of the residue) dry weight (GE) of the sample before hydrolysis In vitro fermentability of DM (IVFDM) during feces fermentation was calculated as follows
IVFDM = (dry weight of the hydrolyzed residue minus dry weight of the residue after fermentation) dry weight of the hydrolyzed residue
Gas accumulation curves recorded during the 72 h of fermentation were modeled according to France et al (1993)
G (mL gDM) = 0 if 0 lt t lt L G (mL gDM) = Gf (1-exp (-[b(t-L) + c (radict-radicL)])) if t ge L
where G denotes the gas accumulation at a specific time (t) Gf (ml gminus1 DM) was the maximum gas volume for t = infin and L (h) represents the lag time before the fermentation began The constants b (h-1) and c (hminus12) determine the fractional rate of degradation of the substrate micro (hminus1) which is postulated to vary with time as follows
micro = b + c(2radict) if t ge L Kinetics parameters (Gf t = T2 and micro at T2) were compared in the statistical analysis with T2 representing the time to half-asymptote when G = Gf2
The SCFA (acetic [A] propionic [P] butyric [B] and valeric [V] acids) production per kg of enzymatic digestion residues DM was estimated by the following equation [(A+ P + B+ V)]72h ndash (A+ P + B+ V)]0hg of residue DM The equivalent energy for each SCFA was assumed to be 0209 0365 0522 and 0678 Mcalmol for acetic propionic butyric and valeric acids respectively (Anguita et al 2006) The DE of DDGS (DM basis) was then calculated according to the following equations
GEf = GE of SCFA times (1-IVDDM) GEi = GE times IVDGE DE = GEi + GEf
where GEf denotes the energy (kcalkg DM basis) derived from SCFA per kg of feed DM GE of SCFA was energy of SCFA production per kg of enzymatic digestion residues DM GEi (kcalkg DM basis) denotes energy disappeared during two-step in vitro enzymatic digestion which is equivalent to digested GE at ileum Statistical analyses The PROC CORR of SAS (Version 93 SAS Inst Inc Cary NC) was used to determine if there was an association among DE ME fNDF and uNDF fractions and the chemical composition of corn DDGS samples Correlations with a value of P lt 005 were considered significant The PROC REG STEPWISE of SAS was used to select input variables for the equations to predict DE and ME content from chemical
9
composition and in vitro fNDFom and uNDFom of the corn DDGS samples Variance Inflation Factor (VIF) was used to determine multicollinearity variables with VIF gt 10 were considered as multicollinear and were removed from the prediction equations The P value R2 and root of the mean square error (SEM) were used as parameters to determine the accuracy of the prediction equations All data were analyzed by using the GLM procedure of SAS version 94 (SAS Inst Inc Cary NC) with individual bottles considered the experimental unit For NDF fermentability data the model included DDGS sources AFEX and their interaction For 3-step digestion and fermentation data the model included DDGS sources AFEX carbohydrases addition and their interactions The equality of variances was tested by Levene test in GLM procedure of SAS 94 If variances were not equal then heterogeneous variance model in MIXED procedure was used If interaction effects tended to be significant (P lt 010) treatment differences were separated using PDIFF and adjusted by the Tukey option Results were considered significant at P le 005 and trends at 005 lt P le 010 Results and discussion Experiment 1 Crystallinity in Distillers Dried Grains with Solubles The x-ray diffraction pattern of the sample of DDGS with low ATTD of NDF (445) was similar and overlapping to the pattern of the sample with high ATTD of NDF (573) Despite that patterns between both sources of DDGS overlapped there was sufficient information in the data to calculate crystallinity index for both samples Consequently the CrI of the sample with low ATTD of NDF (122) was greater (P lt 001) than that of the sample with high ATTD of NDF (92) suggesting that crystallinity index is a potential measure of ATTD of NDF In spite these encouraging results we observe challenges that will need to be resolved for developing a more robust assay that measures ATTD of NDF The reason is that DDGS is not a purified material but contains other amorphous components such as lignin and hemicellulose (Jaworski et al 2015) The content of other amorphous components affect XRD patterns (Xu et al 2009) Consequently XRD is unable to distinguish between the crystallinity index of the cellulose inside the biomass and the crystallinity index of other components (protein starch) in the biomass in DDGS Therefore more samples of DDGS with known ATTD of NDF are needed to verify the relationship between fiber structure and fiber digestibility Variability of energy and fiber related composition Based on variability of chemical composition (eg DE ME NDF) the sources of DDGS collected for this project represent the variability observed in previous publications (Urriola et al 2014) The differences between maximum and minimum energy values were 387 396 and 430 kcalkg for gross energy (GE) DE and ME respectively (Table 11) Dietary fiber (as measured by ADF NDF and TDF) This suggests that measuring the content of fiber would improve prediction of DE and ME among sources of DDGS (Kerr et al 2013) However our hypothesis is that additional information regarding fiber composition may improve our ability to predict the impact of dietary fiber on nutrient digestibility and ultimately DE or ME content in corn DDGS Among all 15 sources of DDGS the disappearance of NDFom after 8 h fecal incubation (fNDFom8) was 216 (range 110 to 304) Interestingly this value is close to the apparent ileal digestibility (AID 215 ) of total dietary fiber (TDF) reported by Urriola and Stein (2010) for 10 sources of corn DDGS This observation suggest that DigNDFom8 may represent the portion of NDF in corn DDGS that is readily degradable in the small intestine of pigs About 686 of NDFom disappeared after 72 h fecal incubation
10
(fNDFom72) This value is greater than the 327 in vitro total tract digestibility of non-starch polysaccharides (Jaworski et al 2015) Likewise this value is also greater than the ATTD of NDF (593) in corn DDGS reported by Urriola et al (2010) The exact reason for the difference is unknown but we speculate that this difference may have been a result of using the 72-h in vitro incubation time compared with a typical 30 to 51 h in vivo digesta transit time (Le Goff et al 2002) If the use of in vitro digestible fiber is of use for predicting energy value of corn DDGS or other high fiber feed ingredients it would be necessary to adjust in vitro incubation time to a time that represents normal physiological conditions in the gastrointestinal tract of pigs In addition the difference between in vitro and in vivo assays may be due to the fact that excretion of many nutrients in vivo is composed of the undigestible portion of the diet and lsquoendogenousrsquo nutrients lost during the digestion process (Sauer and Ozimek 1986) In the in vitro assay the digestion residue is only composed on undigestible portion of the diet and it is a representation of sometimes called lsquorealrsquo digestibility (de Lange et al 1990) This phenomenon has been primarily demonstrated for amino acids phosphorus and lipids However it has been recently reported that analysis of TDF (and possibly NDF) in gastrointestinal content and feces may be biased by non-dietary materials (eg mucin microbial biomass) This non-dietary material is excreted in gastrointestinal content and feces and may decrease calculated AID and ATTD of NDF and TDF (Montoya et al 2016) In fact negative values for AID of NDF was observed in diets with very low content of NDF these AID values increased linearly with increasing intake of NDF (a suggestion that non-dietary material may be excreted in digesta) The DigNDFom8 had greater CV (gt 20) than DigNDFom12 or DigNDFom72 This observation suggests that the ethanol production process and differences among technologies may modify dietary fiber among sources of DDGS Interestingly the fact that the most variable portion is DigNDFom8 may suggest that ethanol production technologies have greater impact of the portion of dietary fiber (NDF) in corn DDGS that is readily degradable (possibly arabinoxylans) The use of different types and amounts of enzymes (eg xylanases) in the bioethanol process among different ethanol plants may contribute to high variance of readily degradable fiber in corn DDGS samples evaluated in this study (Luangthongkam et al 2015) Unfermented fiber and apparent total tract digestibility An interesting observation of the studies reported in this NPB project is that different portions of NDF specially undigestible portions (eg uNDFom8 uNDFom12 and uNDFom72) have strong relationship to digestibility of other components of DDGS (eg protein lipids) The ATTD of GE DM and carbon decreased linearly (P lt 001) in response to increased uNDFom8 and uNDFom72 (Fig 1) The ATTD of ether extract (EE) was negatively (P lt 001) associated with uNDFom8 and uNDFom12 but not affected by uNDFom72 The ATTD of nitrogen (N) tended to decrease linearly (P = 0067) with increasing uNDFom72 It has been well documented that there is a linear decrease in apparent ileal and total tract digestibility of GE DM and N with increased levels of dietary fiber (Yin et al 2001 Gutierrez et al 2016) In a meta-analysis review Zeng et al (2018) also reported that standardized ileal digestibility of N and amino acids decreased linearly with increasing NDF or ADF content of different sources of DDGS The greater content of uNDFom8 in DDGS the lesser ATTD of EE (R2 = 038 P lt 001) However the ATTD of EE was not correlated to uNDFom8 uNDFom12 or uNDFom72 (Figures 11 12 13 and 14) These two observations suggest that readily degradable fiber but not the recalcitrant portions degraded at 12 and 72 hours of incubation are responsible for encapsulating and decreasing ATTD of EE This observation is also in agreement with previous reports that ATTD of EE is greater in extracted corn oil compared with the intact oil from corn germ meal (Kil et al 2010) It is important to note that this report contains values for ATTD of EE and not AID of EE or fatty acids Therefore it is possible that another cause for the relationship between readily degradable fiber (NDFom8) and ATTD of EE is that the former
11
may stimulate hindgut fermentation and modification of the excretion of EE and fatty acids (Kim et al 2013) Correlation among energy components gas production and chemical composition The content of DE among sources of DDGS was correlated negatively with uNDFom8 (r = -086 P lt 001) uNDFom12 (r = -086 P lt 001) uNDFom72 (r = -086 P lt 001) and NDFom (r = -084 P lt 001) While it was positively correlated with digestible DM (r = 073 P lt 001 Figure 14) Similarly ME was negatively (P lt 005) associated with uNDFom8 (r = -086 P lt 001) uNDFom12 (r = -086 P lt 001) uNDFom72 (r = -086 P lt 001) and NDFom (r = -084 P lt 001) Gas production at 8 12 and 72 h was positively (P lt 005) associated with fermented NDFom at the corresponding time points (Table 12) The disappearance of NDFom at 8 and 12 h was negatively associated (P lt 005) with time of achieving half maximal gas production (T2) These results are consistent with previous data reported by our research group where an increase in ATTD of TDF was observed as the maximal gas production increased among DDGS wheat straw and soybean hulls (Huang et al 2017a) In vitro gas accumulation measurements can be used to estimate substrate degradation and yield valuable information about feed ingredient fermentation kinetics of feed ingredients (France et al 1993) However the disappearance of NDF may not precisely match with gas accumulation from fermentation because gas is generated from fermenting a wide range of substrates including both soluble and insoluble fiber components (Williams et al 2001) DE and ME prediction equations Stepwise regression analysis of fiber-related measurements was used to generate a series of prediction equations for DE (Table 13) The initial regression equation (Eq [1]) included uNDFom8 as the most important component to predict DE followed by Eq [2] which included both uNDFom8 and GE and ultimately resulting in the best-fit equation (Eq [3]) which included uNDFom8 uNDFom72 and GE A series of prediction equations were also developed for ME content of corn DDGS (Table 4) The initial regression (Eq [4]) included uNDFom72 as the most important component to predict ME followed by Eq [5] which included both uNDFom72 and GE Equation 6 included uNDFom8 uNDFom72 and GE Lastly the inclusion of CP improved prediction of ME for the best fit equation (Eq [7]) which included uNDFom8 uNDFom72 GE and CP The in vitro uNDFom8 and uNDFom72 are initial variables in the DE and ME regression model indicating that unfermented fiber is an important factor that affects DE and ME value of corn DDGS for growing pigs The uNDFom8 contains slow fermented fiber (uNDFom8 ndash uNDFom72) that appears to affect digestibility of other nutrients mainly protein starch and fat It has been reported that cell walls can encapsulate nutrients in grains nuts and other vegetable ingredients making them inaccessible to digestive enzymes and decreasing utilization of the nutrient (Grundy et al 2016) In conclusion the use of the in vitro fermentation assay appears to be an effective method to estimate the content of fermentable and unfermentable fiber in corn DDGS The portion of unfermentable fiber (uNDFom8 and uNDF72) are good predictors of the DE and ME content among the 15 sources of DDGS because uNDFom8 and uNDFom72 were correlated to ATTD of GE EE and N Further investigations are encouraged to develop prediction equation of energy based on in vitro digestible nutrients (CP fat starch and carbohydrates) and unfermented residues (ash and fiber) Experiment 2 Chemical composition of DDGS after pretreatment The sample of DDGS from source A contained less acid hydrolyzed fat crude protein than source B (Table 21) The sample of DDGS from source A had greater content of neutral detergent fiber acid detergent fiber and lignin than source B There were no differences in the amino acid composition between the two sources of DDGS Pretreatment of DDGS with AFEX decreased the content of acid
12
hydrolyzed fat in both sources of DDGS by 12 - 22 gkg DM Likewise pretreatment of DDGS with AFEX increased the content of non-protein nitrogen by 131 gkg DM and subsequently resulted in an increased CP by around 120 gkg DM The NDF content decreased by 168 and 128 gkg DM for DDGS from sources A and B after AFEX pretreatment However AFEX only resulted in a decrease in ADF (49 gkg DM) and lignin (17 gkg DM) for DDGS from source A whereas ADF and lignin of DDGS from source B were not affected by AFEX pretreatment of DDGS The content of free AA and the corresponding profile of either source of DDGS was also not modified after AFEX pretreatment (Table 22) Fiber fermentability after AFEX The pretreatment (AFEX) increased (P lt 001) fermentability of DM after in vitro fermentation for 8 12 and 72 h The fermentability of NDF and fermented NDF at 12 and 72 h were improved (P lt 001) by AFEX pretreatment There were interactions between DDGS sources and AFEX for unfermented NDF after in vitro fermentation of 8 12 and 72 h The DDGS sample from source B unfermented NDF (8 12 and 72 h) were decreased in a greater extent after AFEX pretreatment for DDGS source A Three step in vitro digestion and fermentation There was a significant interaction (P = 002) among the effect of DDGS sources carbohydrases and AFEX where the IVDMD of DDGS from source A was less than source B and adding carbohydrases increased the IVDMD of both sources of DDGS (Figure 21) Likewise AFEX increase the IVDMD of DDGS from source A but it was relatively less than AFEX and carbohydase These results for IVDMD were similar for in IVDGE (Figures 21 and 22) Carbohydrases supplementation only increased (P lt 005) IVDDM and IVDGE in DDGS from source B with AFEX pretreatment There was also an interaction (P lt 001) among DDGS sources AFEX and carbohydrases for IVFDM (Figure 23) For DDGS without AFEX pretreatment DDGS source B had a greater (P lt 005) IVFDM in the presence of carbohydrases compared to DDGS obtained from source A However carbohydrases supplementation decreased (P lt 005) IVFDM in DDGS from source B with AFEX pretreatment For both DDGS sources AFEX increased (P lt 005) the IVFDM in the situation without carbohydrases supplementation The DDGS from source B had a greater (P lt 005) Gf compared with DDGS from source A (Table 4) The pretreated (AFEX) DDGS had an increased (P lt 005) Gf and micro and decreased T2 compared with the untreated DDGS Compared with DDGS obtained from source B DDGS from source A had an increased (P lt 005) micro only in the presence of AFEX pretreatment but not in the untreated situation The pretreatment (AFEX) increased (P lt 005) the production of acetic acid and total SCFA (Mmolg DM hydrolyzed residue) in the both DDGS sources We observe that the effect of carbohydrases supplementation and AFEX were different depending on the source of DDGS Treating both sources of DDGS with AFEX increased (P lt 005) energy disappearing in the small intestinal portion of the in vitro assay (Gi) compared with DDGS without pretreatment whereas carbohydrases supplementation only increased (P lt 005) Gi in the DDGS source B with AFEX pretreatment There was an interaction (P lt 001) between DDGS sources and AFEX for energy disappearance during fermentation (GEf) and estimated in vitro digestible energy (DE) of DDGS The pretreatment (AFEX) decreased (P lt 005) GEf in a greater manner for DDGS source A (332 kcalkg DM feed) compared with DDGS from source B (154 kcalkg DM feed) However pretreatment (AFEX) increased (P lt 005) DE in a greater manner for DDGS A (922 kcalkg DM feed) compared with DDGS B (526 kcalkg DM feed) Consequently the AFEX pretreatment increased the DE of both sources of DDGS In conclusion the composition of fiber varies among sources of corn DDGS This changes in composition of fiber have an impact on the energy value of DDGS where sources of DDGS with greater content of unfermentable fiber have less energy value because unfermentable fiber appears to decrease digestibility of other dietary components (especially protein and lipids) The reason that some sources of DDGS have less
13
digestible fiber appears to be due to the crystalline configuration of fiber Pretreating DDGS with ammonia fiber expansion increased digestibility of energy in corn DDGS References Bach Knudsen K E N P Noslashrskov A K Bolvig M S Hedemann and H N Laerke 2016 Dietary
fibers and associated phytochemicals in cereals Mol Nutr Food Res 10ndash24 doi101002mnfr201600518 Available from httpwwwncbinlmnihgovpubmed27813269
Blok M C G Brandsma G Bosch W J J Gerrits A J M Jansman J Fledderus and H Everts 2015 A new Dutch Net Energy formula for feed and feedstuffs for growing and fattening pigs 1ndash39 Available from httplibrarywurnlWebQuerywurpubsfulltext375605
Boisen S and J A Fernaacutendez 1997 Prediction of the total tract digestibility of energy in feedstuffs and pig diets by in vitro analyses Anim Feed Sci Technol 68277ndash286 doi101016S0377-8401(97)00058-8 Available from httpswwwsciencedirectcomsciencearticlepiiS0377840197000588
Dien B S E A Ximenes P J OrsquoBryan M Moniruzzaman X L Li V Balan B Dale and M A Cotta 2008 Enzyme characterization for hydrolysis of AFEX and liquid hot-water pretreated distillersrsquo grains and their conversion to ethanol Bioresour Technol 995216ndash5225 doi101016jbiortech200709030
France J S Lopez E Kebreab A Bannink M S Dhanoa and J Dijkstra 2005 A general compartmental model for interpreting gas production profiles Anim Feed Sci Technol 123ndash124 Pa473ndash485 doi101016janifeedsci200504038
Gerrits W and S De Vries 2016 Digestion and energetic utilization of dietary fibres in pigs Fiber an important dietary ingredient Contents Defenitions and analyses Defenitions and analyses
Le Goff G L Le Groumellec J van Milgen S Dubois and J Noblet 2002 Digestibility and metabolic utilisation of dietary energy in adult sows influence of addition and origin of dietary fibre Br J Nutr 87325ndash335 doi101079BJNBJN2001528
Grundy M M-L C H Edwards A R Mackie M J Gidley P J Butterworth and P R Ellis 2016 Re-evaluation of the mechanisms of dietary fibre and implications for macronutrient bioaccessibility digestion and postprandial metabolism Br J Nutr 116816ndash33 doi101017S0007114516002610 Available from httpwwwpubmedcentralnihgovarticlerenderfcgiartid=4983777amptool=pmcentrezamprendertype=abstract
Gutierrez N A N V L Seratildeo and J F Patience 2016 Effects of distillersrsquo dried grains with solubles and soybean oil on dietary lipid fiber and amino acid digestibility in corn-based diets fed to growing pigs J Anim Sci 941508ndash1519 doi102527jas2015-9529
Huang Z P E Urriola I J Salfer M D Stern and G C Shurson 2017a Differences in in vitro hydrolysis and fermentation among and within high-fiber ingredients using a modified three-step procedure in growing pigs J Anim Sci 955497ndash5506 doi102527jas20171907 Available from httpswwwanimalsciencepublicationsorgpublicationsjasabstracts00jas20171907
Huang Z P E Urriola and G C Shurson 2017b Use of in vitro dry matter digestibility and gas production to predict apparent total tract digestibility of total dietary fiber for growing pigs1 J Anim Sci 955474ndash5484 doi102527jas20171964 Available from httpacademicoupcomjasarticle951254744772094
Jaworski N W H N Laeligrke K E Bach Knudsen and H H Stein 2015 Carbohydrate composition and in vitro digestibility of dry matter and nonstarch polysaccharides in corn sorghum and wheat
14
and coproducts from these grains1 J Anim Sci 931103ndash1113 doi102527jas2014-8147 Kerr B J W A Dozier and G C Shurson 2013 Effects of reduced-oil corn distillers dried grains
with solubles composition on digestible and metabolizable energy value and prediction in growing pigs J Anim Sci 913231ndash3243 doi102527jas2013-6252
Kerr B J and G C Shurson 2013 Strategies to improve fiber utilization in swine J Anim Sci Biotechnol 411 doi1011862049-1891-4-11 Available from httpwwwpubmedcentralnihgovarticlerenderfcgiartid=3623846amptool=pmcentrezamprendertype=abstract
Kim B G D Y Kil and H H Stein 2013 In growing pigs the true ileal and total tract digestibility of acid hydrolyzed ether extract in extracted corn oil is greater than in intact sources of corn oil or soybean oil J Anim Sci 91755ndash763 doi102527jas2011-4777
de Lange C F W B Souffrant and W C Sauer 1990 Real ileal protein and amino acid digestibilities in feedstuffs for growing pigs as determined with the 15N-isotope dilution technique J Anim Sci 68409ndash418
Liu P L W O Souza S K Baidoo and G C Shurson 2012 Impact of DDGS particle size on nutrient digestibility DE and ME content and flowability in diets for growing pigs J Anim Sci 4925ndash4932 doi102527jas2011-4604
Luangthongkam P L Fang A Noomhorm and B Lamsal 2015 Addition of cellulolytic enzymes and phytase for improving ethanol fermentation performance and oil recovery in corn dry grind process Ind Crops Prod 77803ndash808 doi101016JINDCROP201509060 Available from httpswwwsciencedirectcomsciencearticlepiiS092666901530426X
Montoya C A S J Henare S M Rutherfurd and P J Moughan 2016 Potential misinterpretation of the nutritional value of dietary fiber Correcting fiber digestibility values for nondietary gut-interfering material Nutr Rev 74517ndash533 doi101093nutritnuw014
Noblet J and G Le Goff 2001 Effect of dietary fibre on the energy value of feeds for pigs In Animal Feed Science and Technology Vol 90 p 35ndash52 Available from httplinkinghubelseviercomretrievepiiS037784010100195X
Noblet J and J van Milgen 2004 Energy value of pig feeds effect of pig body weight and energy evaluation system J Anim Sci 82 E-Suppl doi20048213_supplE229x
Rymer C J A Huntington B A Williams and D I Givens 2005 In vitro cumulative gas production techniques History methodological considerations and challenges Anim Feed Sci Technol 123ndash124 Pa9ndash30 doi101016janifeedsci200504055
Sauer W C and L Ozimek 1986 Digestibility of amino acids in swine Results and their practical applications A review Livest Prod Sci 15367ndash388 doi1010160301-6226(86)90076-X
Shurson G C 2017 The Role of Biofuels Coproducts in Feeding the World Sustainably Annu Rev Anim Biosci 5229ndash254 doi101146annurev-animal-022516-022907 Available from httpwwwannualreviewsorgdoi101146annurev-animal-022516-022907
Van Soest P J J B Robertson and B A Lewis 1991 Methods for dietary fiber neutral detergent fiber and nonstarch polysaccharides in relation to animal nutrition J Dairy Sci 743583ndash3597 doi103168jdsS0022-0302(91)78551-2 Available from httpdxdoiorg103168jdsS0022-0302(91)78551-2
Urriola P E M Li B J Kerr and G C Shurson 2014 Evaluation of prediction equations to estimate gross digestible and metabolizable energy content of maize dried distillers grains with solubles (DDGS) for swine based on chemical composition Anim Feed Sci Technol 198196ndash202 doi101016janifeedsci201409006
Urriola P E G C Shurson and H H Stein 2010 Digestibility of dietary fiber in distillers coproducts fed to growing pigs J Anim Sci 882373ndash2381 doi102527jas2009-2227
15
Urriola P E and H H Stein 2010 Effects of distillers dried grains with solubles on amino acid energy and fiber digestibility and on hindgut fermentation of dietary fiber in a corn-soybean meal diet fed to growing pigs J Anim Sci 881454ndash1462 doi102527jas2009-2162
Williams B a M W Verstegen and S Tamminga 2001 Fermentation in the large intestine of single-stomached animals and its relationship to animal health Nutr Res Rev 14207ndash228 doi101079095442201108729213
Xu W N Reddy and Y Yang 2009 Extraction characterization and potential applications of cellulose in corn kernels and Distillersrsquo dried grains with solubles (DDGS) Carbohydr Polym 76521ndash527 doi101016jcarbpol200811017 Available from httpdxdoiorg101016jcarbpol200811017
Yin Y L S K Baidoo H Schulze and P H Simmins 2001 Effects of supplementing diets containing hulless barley varieties having different levels of non-starch polysaccharides with -glucanase and xylanase on the physiological status of the gastrointestinal tract and nutrient digestibility of weaned pigs Livest Prod Sci 7197ndash107 doi101016S0301-6226(01)00214-7
Zeng Z K J Zhu C Chen and P E Urriola 2017 Improvement of ileal digestibility of dry matter and gross energy by commercial carbohydrases is associated with depression of fermentability in an in vitro digestibility determination system J Anim Sci 95119 doi102527asasmw2017248 Available from httpswwwanimalsciencepublicationsorgpublicationsjasabstracts95supplement2119
16
Table11 Chemical composition fermentation characteristics and parameters of cumulative gas production among 15 sources of corn distillers dried grains with solubles DM basis1 Item Mean Min Max Interval SD CV Chemical composition
GE kcalkg 4996 4780 5167 387 111 22 DE kcalkg 3650 3474 3870 396 130 36 ME kcalkg 3435 3266 3696 430 140 41 TDF gkg 342 308 378 69 19 56 NDF gkg 354 288 440 152 40 113 ADF gkg 117 90 140 50 18 153
Fiber fractions characterized by in vitro fecal incubation NDFom gkg 388 335 457 122 28 72 uNDFom8 gkg 304 247 350 103 30 98 uNDFom12 gkg 276 234 329 95 28 103 uNDFom72 gkg 123 84 165 81 28 226 fNDFom8 gkg 84 43 121 78 19 232 fNDFom12 gkg 112 73 146 73 18 164 fNDFom72 gkg 265 232 297 65 21 77 DigNDFom8 216 110 304 194 48 224 DigNDFom12 290 187 366 179 46 158 DigNDFom72 686 591 759 168 57 84
Gas accumulation kinetics Gas8 97 81 117 36 85 88 Gas12 120 105 139 33 92 77 Gas72 199 174 214 39 13 65 Gf mLg 240 211 271 60 224 93 T2 hour 172 109 271 162 48 276 μT2 0036 0024 0048 0024 0007 188
1Samples of corn distillers dried grains with solubles from previous experiment (Kerr et al 2013) SD standard deviation CV coefficient of variation GE gross energy DE digestible energy ME metabolizable energy TDF total dietary fiber ADF acid detergent fiber NDFom ash free NDF DigNDFom percentage of fermented NDFom after 8 12 or 72 h fecal incubation fNDFom fermented NDF after 8 12 or 72 h fecal incubation uNDFom unfermented NDF after 8 12 or 72 h fecal incubation Gas cumulative gas production after 8 12 or 72 h fecal incubation T2 half-time to asymptote (hour) μT2 fractional rate of degradation (h-1) at t = T2 Gf maximal gas production
17
Table 12 Correlation coefficients (r) between energy values total dietary fiber and fermented neutral detergent fiber of 15 corn distillers dried grains with solubles samples1
Item NDF om
uNDF om8
uNDF om12
uNDF om72
fNDF om8
fNDF om12
fNDF om72
DigNDF om8
DigNDF om12
DigNDF om72 Gas8 Gas12 Gas72 Gf T2 μT2
NDFom 100
uNDFom8 078 100
uNDFom12 079 094 100
uNDFom72 073 081 088 100
fNDFom8 024 -043 -031 -021 100
fNDFom12 030 -027 -035 -025 084 100
fNDFom72 038 -004 -012 -036 060 075 100
DigNDFom8 -011 -071 -060 -047 094 076 049 100
DigNDFom12 -014 -063 -072 -059 076 090 061 083 100
DigNDFom72 -052 -072 -079 -096 036 043 060 056 068 100 Gas8 -015 -051 -058 -045 057 067 040 062 075 048 100 Gas12 -007 -041 -053 -038 054 072 043 057 077 044 077 100 Gas72 -006 -042 -043 -064 056 058 078 059 062 078 062 059 100 Gf mLg 006 -002 -007 -046 012 020 070 011 018 060 013 018 073 100 T2 hour 010 042 041 012 -051 -049 -003 -054 -055 -009 -058 -048 -015 054 100 μT2 -044 -040 -044 -012 -003 001 -044 013 022 -004 021 025 -030 -070 -066 100
1GE gross energy DE digestible energy ME metabolizable energy NDFom ash free neutral detergent fiber DigNDFom percentage of fermented NDF after 8 12 or 72 h fecal incubation fNDFom fermented NDFom after 8 12 or 72 h fecal incubation uNDFom unfermented NDFom after 8 12 or 72 h fecal incubation Gas accumulative gas production after 8 12 or 72 h fecal incubation T2 half-time to asymptote (hour) μT2 fractional rate of degradation (h-1) at t = T2 Gf maximal gas production
Means P lt 005 means P lt 001
18
Table 13 Stepwise regression equation to predict digestible energy (DE) content among 15 sources of corn distillers dried grains with solubles
Item Regression coeficient1 Statistics2
Intercept uNDFom8 uNDFom72 GE SE R2 Adjust R2 Equation1 4783 -3728 6996 073 071 SE3 191 624 P-value3 lt001 lt001 Equation2 2388 -419 051 4289 091 089 SE3 517 0395 011 P-value3 lt001 lt001 lt001 Equation3 2175 -15 -2359 055 3541 094 093 SE3 435 054 058 009 P-value3 lt001 lt001 0026 lt001
1Equations based on analyzed nutrient content expressed on a DM basis GE gross energy Units are kcalkg DM for GE and DE and gkg DM for unfermented NDFom after 8 and 72 h fecal incubation (uNDFom8 and uNDFom72)
2SE = SE of the regression estimate defined as the root of the mean square error 3SE and P-values of the corresponding regression coefficient
19
Table 14 Stepwise regression equation for prediction of metabolizable energy (ME) among 15 sources of corn distillers dried grains with solubles
Item Regression coeedicient1 Statistics2
Intercept uNDFom8 uNDFom72 GE CP SE R2 Adjust R2 Equation4 3911 -3878 9353 059 055 SE3 113 902 P-value3 lt001 lt001 Equation5 6487 -449 067 5849 085 083 SE3 711 058 014 P-value3 0380 lt001 lt001 Equation6 899 -223 -257 071 4264 093 091 SE3 524 065 071 011 P-value3 0114 lt001 lt001 lt001 Equation7 1643 -231 -254 065 -142 3921 094 092 SE3 645 060 065 010 082 P-value3 0029 lt001 lt001 lt001 0013
1Equations based on analyzed nutrient content expressed on a DM basis CP crude protein GE gross energy Units are kcalkg DM for GE and ME and gkg DM for unfermented NDFom after 8 and 72 h fecal incubation (uNDFom8 and uNDFom72)
2SE = SE of the regression estimate defined as the root of the mean square error 3SE and P-values of the corresponding regression coefficient
20
Table 21 Chemical composition of corn distillers dried grains with solubles (DDGS) from two sources before and after of ammonia fiber expansion (AFEX)
Item Untreated AFEX
A B A B Gross energy kcalkg DM 5141 4902 5197 4939 Nutrients gkg DM Dry matter 884 890 922 933 Ash 53 59 53 57 Acid hydrolyzed fat 106 139 94 117 Neutral detergent fiber 363 346 199 218 Acid detergent fiber 150 121 100 118 Lignin 29 26 12 24 Crude protein 308 312 426 432 Non-protein nitrogen 32 27 163 158 Essential amino acids gkg DM
Arginine 14 13 12 13 Histidine 85 88 81 85 Isoleucine 12 13 12 13 Leucine 35 35 34 35 Lysine 86 94 79 88 Methionine 59 57 56 57 Phenylalanine 15 15 15 15 Threonine 11 12 11 11 Tryptophan 21 19 13 13 Valine 16 16 16 16
Nonessential amino acids gkg DM Alanine 21 21 21 21 Aspartic acid 20 20 19 20 Cysteine 68 71 20 26 Glutamic acid 43 45 40 44 Glycine 12 12 12 12 Proline 22 25 22 24 Serine 13 13 12 12 Tyrosine 11 12 12 12 Total amino acids 276 285 263 274
21
Table 22 Free amino acid content of corn distillers dried grains with solubles (DDGS) from two sources before and after of ammonia fiber expansion (AFEX)
Item gkg DM basis Untreated AFEX
A B A B Essential amino acids Arginine - 022 - 021 Histidine - 011 - - Isoleucine - 022 - 075 Leucine 011 056 011 043 Lysine 011 079 - 064 Methionine - - - - Phenylalanine 011 045 011 043 Threonine 011 022 033 043 Tryptophan - - - - Valine - 022 065 075 Nonessential amino acids Alanine 068 124 065 118 Aspartic acid 011 067 033 086 Cysteine - - - - Glutamic acid 023 045 033 054 Glycine 011 034 011 021 Proline - - - - Serine 011 034 022 032 Tyrosine 023 056 022 043 Total free amino acids 192 618 304 697
22
Table 23 The effects of ammonia fiber expansion (AFEX) on fermentability (Fer) of dry matter and neutral detergent fiber in corn distillers dried grains with solubles (DDGS) from two sources Item Untreated AFEX SEM P-value
A B A B Source AFEX Interaction1 Fermentation 8 h
Fer of DM 247 274 360 353 26 0707 lt001 0521
Fer of NDF -50 -27 20 00 34 0959 0191 0543
Fer NDF gkg -180 -90 40 00 71 0752 0055 0378
Unfer NDF gkg 3810a 3550a 1950b 2180b 73 0792 lt001 0010
Fer 12 h
Fer of DM 322 336 464 471 14 0457 lt001 0826
Fer of NDF 74 93 205 193 13 0813 lt001 0265
Fer NDF gkg 270 320 410 420 30 0367 lt001 0486
Unfer NDF gkg 3360a 3140b 1580d 1760c 28 0391 lt001 lt001
Fer 72 h
Fer of DM 469 526 628 644 13 0012 lt001 0128
Fer of NDF 472 528 669 664 18 0176 lt001 0114
Fer NDF gkg 1710 1830 1330 1450 45 0018 lt001 0985
Unf NDF gkg 1920a 1630b 660c 730c 45 0025 lt001 0001 1Interaction between AFEX and DDGS sources
23
Table 24 The effects of ammonia fiber expansion (AFEX) and exogenous carbohydrases supplementation on gas accumulation kinetics parameters short-chain fatty acid profile (SCFA) and fermented energy in corn distillers dried grains with solubles (DDGS)
Item1 No AFEX AFEX Enzyme
SEM P value
A B A B N Y AFEX DDGS Enz AtimesD2 Kinetics of gas production1
Gf mLg DM 236b 281a 217b 226b 240 238 1091 lt001 lt001 046 003 T2 h 292 313 134 155 214 227 233 lt001 020 078 091 micro h-1 003c 003c 010a 007b 006 005 001 lt001 001 046 002 Lag time h 286 323 311 156 286 250 099 0301 045 056 018
SCFA profile Mmolg DM Acetic 305 328 455 452 375 389 056 lt001 079 067 080 Propionic 101 101 103 099 102 100 007 098 061 068 069 Butyric 059 057 056 046 055 054 006 013 023 073 034 Valeric 009 010 010 007 009 009 002 030 073 054 018 Total SCFA 474 495 623 604 541 552 053 lt001 094 073 065
Energy kcalkg DM of feed3 GEi
4 2861 3122 4120 3834 3466 3481 3772 lt001 019 054 lt001 GEf 713a 577b 381c 423c 527 532 3923 lt001 009 091 lt001 DE 3579d 3699c 4502a 4225b 3978 3995 3921 lt001 002 053 lt001 1Gf maximum gas volume (ml per g DM incubated) T2 half-time to asymptote (h) micro fractional rate of degradation (hminus1) at t = T2 L lag time 2Interaction between AFEX and DDGS sources 3GEi GE times IVDGE estimated in vitro dissapearance of energy in the small intestine GEf energy estimated from stoichiometry of SCFA during in vitro fermentation DE GEi + GEf 4P-values (AFEX times DDGS times enzyme) = 0074 P-value (DDGS B with AFEX vs DDGS B with AFEX + enzyme) lt 005
24
Figure 11 Measured X-ray diffraction patterns of DDGS samples scaled to the same maximum intensity and offset for clarity
Figure 12 The crystallinity index and apparent total tract digestibility (ATTD) of NDF for DDGS samples adopted from Kerr et al (2013)
DDGS1 ATTD f
DDGS8 ATTD f
25
Figure 11 Prediction of apparent total tract digestibility of carbon (C) and dry matter (DM) from the concentration of total dietary fiber (TDF) among 15 sources of corn distillers dried grains with solubles
Figure 12 Prediction of the apparent total tract digestibility of nitrogen (N) gross energy (GE) carbon (C) and dry matter (DM) from the concentration of unfermentable neutral detergent fiber after 8-hour incubation (uNDF)
26
Figure 13 Prediction of apparent total tract digestibility of nitrogen (N) gross energy (GE) carbon (C) and dry matter (DM) from the concentration of unfermentable neutral detergent fiber after 72-hour incubation (uNDF)
27
A
B
C
28
Figure 14 Correlation coefficients (r) between chemical composition (digestible and unfermented) and GE (A) DE (B) and
ME (C) of 15 corn distillers dried grains with solubles samples ADF acid detergent fiber DE digestible energy DM dry
matters EE ether extract GE gross energy NDF neutral detergent fiber NDFom ash free NDF ME metabolizable energy
TDF total dietary fiber dDM dEE dADF and dNDF digestible DM EE ADF and NDF (multiplying by total content and
apparent total tract digestibility) dNDFom fermented NDFom after 8 12 or 72 h fecal incubation Gas12 gas production
after 12 h fecal incubation uNDF and uCP undigested NDF and CP (total ndash digestible) uNDFom unfermented NDFom after
8 12 or 72 h fecal incubation NDFom ash free NDF TDF total dietary fiber Means P lt 010 means P lt 005
29
Figure 21 The effects of ammonia fiber expansion (AFEX) and carbohydrases addition on in vitro digestibility of dry matter in corn distillers dried grains with solubles (DDGS) The interaction among DDGS sources carbohydrases and AFEX was significant (P = 002)
d d b
Source A A B
30
Figure 22 The effects of ammonia fiber expansion and carbohydrases addition on in vitro digestibility of gross energy (GE) in corn distillers dried grains with solubles (DDGS) There was a trend (P = 007) for an interaction among DDGS sources carbohydrases and AFEX
d d b
Source A A B
31
Figure 23 The effects of ammonia fiber expansion and carbohydrases addition on in vitro fermentation of dry matter in corn distillers dried grains with solubles (DDGS) The interaction among DDGS sources carbohydrases and AFEX was significant (P lt 001)
d
d
b
Source A A B
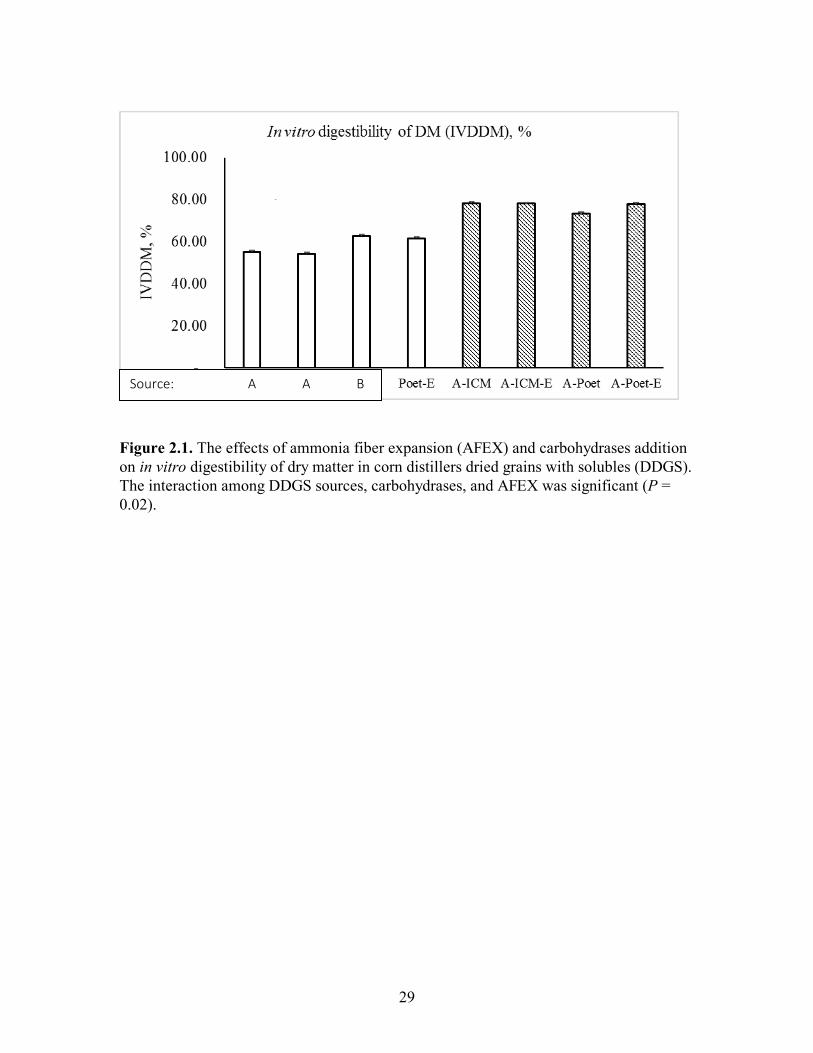

31
Figure 23 The effects of ammonia fiber expansion and carbohydrases addition on in vitro fermentation of dry matter in corn distillers dried grains with solubles (DDGS) The interaction among DDGS sources carbohydrases and AFEX was significant (P lt 001)
d
d
b
Source A A B