Embed Size (px)
Citation preview
Corrie Whisner F&N 453 11/20/06
TITLE: The effects of soy nut to peanut ratios on the properties of nut butter spreads ABSTRACT:
While peanut butter is one of a wide variety of nut spreads, it tends to be the most
popular among all ages. However, as obesity-related health concerns continue to rise, our
society has seen an increase in the number of low fat foods that are now available. To
help combat obesity, popular foods now come in versions with less or no fat and more are
sure to arise in the future. This project was designed to examine the affect of adding
different ratios of soy nuts to peanut butter in order to create a healthier nut spread.
Changes in texture, color and palatability were observed. These parameters were
evaluated using a Stable Micro Systems Texture Analyzer, Hunter Colorimeter and a
taste panel of college students. The Texture Analyzer results indicated that increasing
ratios of soy nuts in peanut butter do not significantly affect the texture of nut spreads. T-
testing indicated that Hunter Colorimeter values for a were significant when paired tests
were performed. Values for b did not present a significant difference between samples
and L values were considerably different between Variations 1 and 3 and also Variations
2 and 3. While texture and color are important physical characteristics to consumers,
taste appeal is equally important. Data from this project indicated that sample preference
was not significantly affected by differences in texture. However, the taste of the nuts
used in these spreads did cause variation among panelist preference.
1
INTRODUCTION:
Today, peanut butter is a major food staple among American kitchens. In recent
years, however, industry has made a wide variety of nut butters available, including
almond, cashew and macadamia nut spreads. These nuts, as well as the spreads made
from them, all have different nutrient compositions. Soy nuts have been found to have
fewer calories and less fat than peanuts. According to the Agricultural Research service
Nutrient Data Laboratory created by the USDA, one cup of peanuts has 854 kcal and 72.5
g of fat, 10.064 of which are saturated fats, while a cup of soy nuts has 438 kcal and
23.62g of fat with only 3.417g of the fat being saturated (ARS 2006; USDA 2006).
Due to the increasing prevalence of obesity among all age groups in America,
there is a need to lower fat intakes in these individuals. By lowering the fat content of
commonly consumed food items, total dietary fat can be lowered in these individuals.
This project was proposed in order to better the health of individuals in need of better
eating habits. By combining soy nuts and peanuts it is the goal of this experiment to
create a nut spread with less fat.
In addition to adding soy to lower the fat content, research has recently discovered
that soy products, including soy nuts, have other chemicals that may aid in and help
maintain a variety of health-related issues. These chemicals are known as
phytoestrogens, estrogen-like compounds found in plants. Defined into three categories,
isoflavones, coumestans, and lignans, these chemicals are diphenolic compounds capable
of estrogenic effects including estrogen receptor binding, induction of estrogen-
responsive genes, and stimulation of ER-positive cancer cell growth (Kurzer and Xu
1997). Of the three types of phytoestrogens, isoflavones are currently getting the most
2
attention for their effects on health. In a study performed by Merz-Demlow et al. soy
isoflavones were found to decrease LDL cholesterol levels in premenopausal women by
7.6 – 10.0% when they consumed high soy isoflavone diets (Merz-Demlow and others
2000). This study introduces the idea that consuming soy isoflavones may reduce the
risk of coronary heart disease. In a similar study, the isoflavones genistein and daidzein
decreased the oxidation of low density lipoproteins which may reduce the risk of
atherosclerosis (Tikkanen and Adlercreutz 2000). Other studies have found that
phytoestrogens act as antioxidants while also inhibiting blood vessel growth (Peterson
1995). Because blood vessel growth is important for the growth of tumors, the use of
phytoestrogens may have preventative mechanisms for the treatment or prevention of
cancers. However, more research is needed in this area to further validate these finding.
Also, the effects that soy isoflavones have on bone are currently under investigation. In a
study done by Greendale et al, a relationship was discovered linking soy phytoestrogen
consumption with a modest improvement in bone density and maintenance in
postmenopausal women (Greendale and others 2002).
It was the hope of this experiment to create a nut spread that will appeal in taste
while providing better nutrition. Because peanut butter tends to be a popular food item
across all age groups it would be more beneficial to consumers if it had more nutritional
benefits, including less fat. Because the taste and texture of this spread are so popular,
the proposed goal of this project was to provide a healthier version of a classic food while
maintaining a similar taste and texture to that of regular peanut butter. The use of the
same food processor for each sample would help in providing similar consistencies
among products. Using the rotary blade attachment in the food processor should create
3
creamy, homogenous nut spreads. Also, the addition of oil will heighten the liquidity and
ability to spread each sample.
The independent variables in this experiment were the different nut spread
variations while the dependent variables were texture and color. The dependent variables
are important in relation to consumer preference. This is because the appeal of a product
to consumers can be greatly affected by physical characteristics. By assessing the color
of the three nut spread variations, the version with an appearance most similar to plain
peanut butter can be found. Similar texture among products is also important because
peanuts may have different textural characteristics than soy nuts when homogenized.
The Texture Analyzer should provide a variety of measurements with which the three nut
spread variations can be compared. Texture measurements may explain how combining
nuts can affect the texture of nut spreads.
To reiterate the importance of both color and texture on a food’s physical
appearance, it is also important to create a product that appeals to the consumer’s taste
preference. By performing a sensory evaluation, a better understanding of the effects that
physical characteristics have on a consumer’s preference may be assessed. Questions
about the level of creaminess between samples, as well as a hedonic ranking of the three
samples, will be used. Assessment of the panel’s evaluation cards should provide
information regarding their preferences related to both product texture and overall taste.
By comparing results from the objective and subjective measurements used in this
experiment, a product can be chosen that will provide added nutritional benefits while
also appealing to the desires of the consumer. This will be done by accepting or rejecting
4
the null hypothesis which states that the nut butters are the same. Statistical analysis was
used to find relationships between nut ratio, texture, color, and personal preference.
METHODS:
Overall Design:
This project used three different variations of soy nuts and peanuts to create three
nut spreads. These spreads were created for three different trials (T1, T2, T3). The
following shows the recipes that were used to create these variations. The first variation
listed is the original recipe found on Peanut Butter Lovers website while the second two
variations are adjustments of this recipe that include the proper ratios of nuts.
Please also note that the recipe for Variation 3 was changed in Trials 2 and 3.
After performing the sensory taste panel in Trial 1 it was found that Variation 3 was very
difficult to spread and needed to be adjusted for both ease of spread and likeability. To
do this, 20ml of peanut oil was added to the nut spread instead of the original 15ml. This
amount is noted below in the recipe for Variation 3. All variations, their sensory ID
numbers and nut compositions can be seen below in Table 1.
Table1. Variation Numbers and Descriptions
Variation
Number
ID
Number Variation Description
1 757 100%Peanuts
2 324 25% Soy Nuts, 75% Peanuts
3 598 50% Soy Nuts, 50% Peanuts
5
Food Processor Peanut ButterSource: Peanut Butter Lovers (www.peanutbutterlovers.com/recipes/food_proc_pb.html) Variation 1-Number 757: 100% Peanut Butter Peanuts – 292g Peanut Oil – 15ml Salt – 3g Variation2-Number 324: Nut Spread with 75% Peanuts and 25% Soy Nuts Peanuts – 219g Soy Nuts – 46.5g Peanut Oil – 15ml Salt – 3g Variation 3-Number 598: Nut Spread with 50% Peanuts and 50% Soy Nuts Peanuts – 146g Soy Nuts – 93g Peanut Oil – 20ml Salt – 3g
Instructions: Using a metal rotary blade, process ingredients continuously for 2 to 3
minutes. The ground peanuts will form a ball which will slowly disappear. Continue to
process until the desired consistency is obtained. If necessary, stop machine and scrape
sides of container with a rubber spatula.
Procedures:
To maintain continuity between variations, the same procedure was followed for
each product. To begin, ingredients for each variation were weighed out and combined in
a bowl (a different bowl was used for each variation). Next, each variation was
homogenized continuously in a food processor for 2-3 minutes or until the desired
consistency was obtained. If clumping occurred on the sides of the machine, the food
processor was stopped and sides were scraped down with a rubber spatula. After
adequate consistency was attained, samples were put into individual GladWare containers
labeled with the appropriate identification numbers. The food processor was then washed
6
and dried thoroughly. The above steps were repeated until all variations were mixed and
put in their labeled GladWare containers. Upon finishing, the food processor and blades
were washed and dried well and returned to the store room.
Next, objective measurements were taken for both texture and color. Texture was
analyzed using the Stable Micro Systems Texture Analyzer with the cylinder probe
attached. The machine was set to a cream cheese setting because there was not a setting
for peanut butter and cream cheese was most similar in texture. Data collected from the
Texture Analyzer was for the force in grams required to penetrate the nut spread samples.
Three measurements were taken for each variation. The Hunter Colorimeter was used to
measure color differences among the three variations. L, a and b values were recorded
three times for each variation.
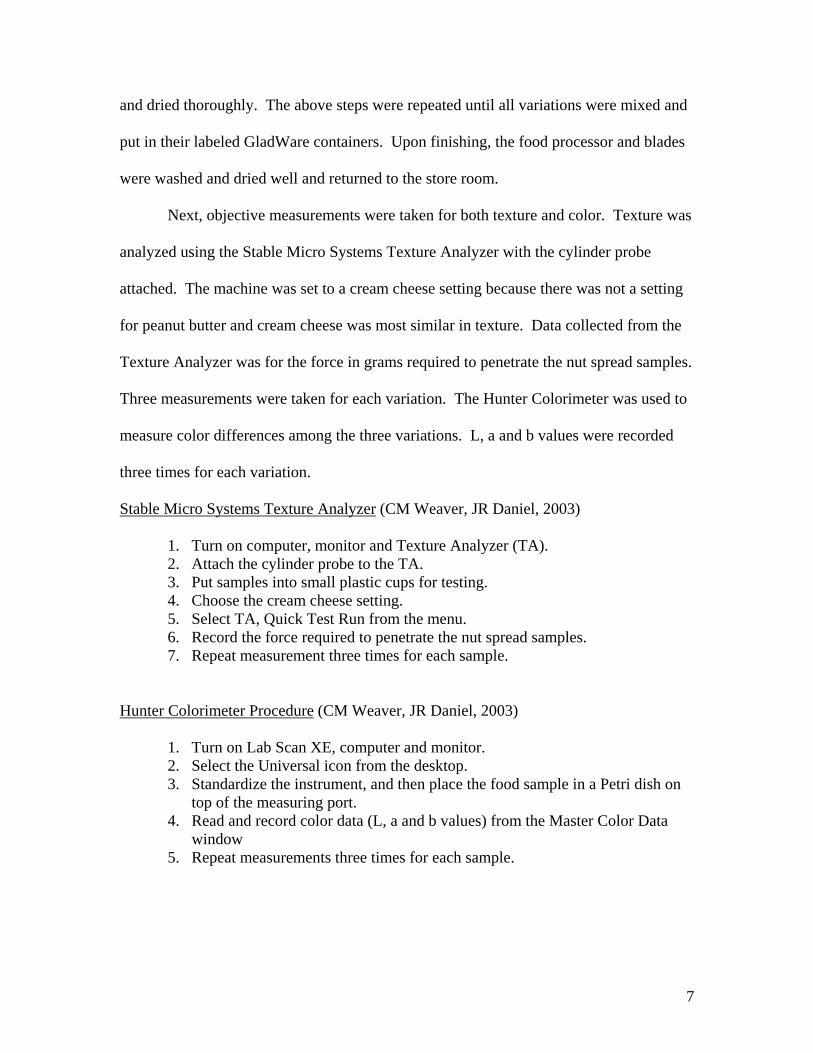
Stable Micro Systems Texture Analyzer (CM Weaver, JR Daniel, 2003)
1. Turn on computer, monitor and Texture Analyzer (TA). 2. Attach the cylinder probe to the TA. 3. Put samples into small plastic cups for testing. 4. Choose the cream cheese setting. 5. Select TA, Quick Test Run from the menu. 6. Record the force required to penetrate the nut spread samples. 7. Repeat measurement three times for each sample.
Hunter Colorimeter Procedure (CM Weaver, JR Daniel, 2003)
1. Turn on Lab Scan XE, computer and monitor. 2. Select the Universal icon from the desktop. 3. Standardize the instrument, and then place the food sample in a Petri dish on
top of the measuring port. 4. Read and record color data (L, a and b values) from the Master Color Data
window 5. Repeat measurements three times for each sample.
7
A taste panel was used to subjectively test the three nut spreads. Ten people for
each trial were asked to rate the three variations on a 9-point Structured Rating Scale.
Random 3-digit numbers were assigned to each sample and were labeled as indicated
above in the recipe variations. Panelists were also asked to rate the three samples in
order of preference using a Hedonic Scale (1 - liked the most, 2 - liked less, 3 - liked the
least). The taste panel consisted of both male and female college students. Crackers
were provided and the panelists were able to use a knife to spread the nut butters onto the
crackers for tasting. The panelist scorecard can be seen on page 6.
Replications:
Three trials of this experiment will be performed, each trial using each of the
three variations of nut butter. The sample containing no soy nuts will be referred to as
the control while the other two will be referred to by their variation numbers. Each trial
will undergo the same tests. Texture Analyzer and Hunter Colorimeter will be used to
objectively assess the dependent variables, texture and color while the sensory panel will
be used as a subjective measurement for texture and preference.
Although it had been planned that the same food processor would be used to make
all the nut butters for each trial, this did not occur. The food processor in lab was broken
during the first trial so a blender was used instead during the first trial. During the last
variation (598 or Variation 3) this blender broke and was therefore unavailable for use in
the subsequent trials. During the next two trials, a Cuisinart nut chopper/processor was
used to make the nut butters. This machine did not create as smooth of a texture as the
blender so differences among samples may have occurred due to the use of different
machines.
8
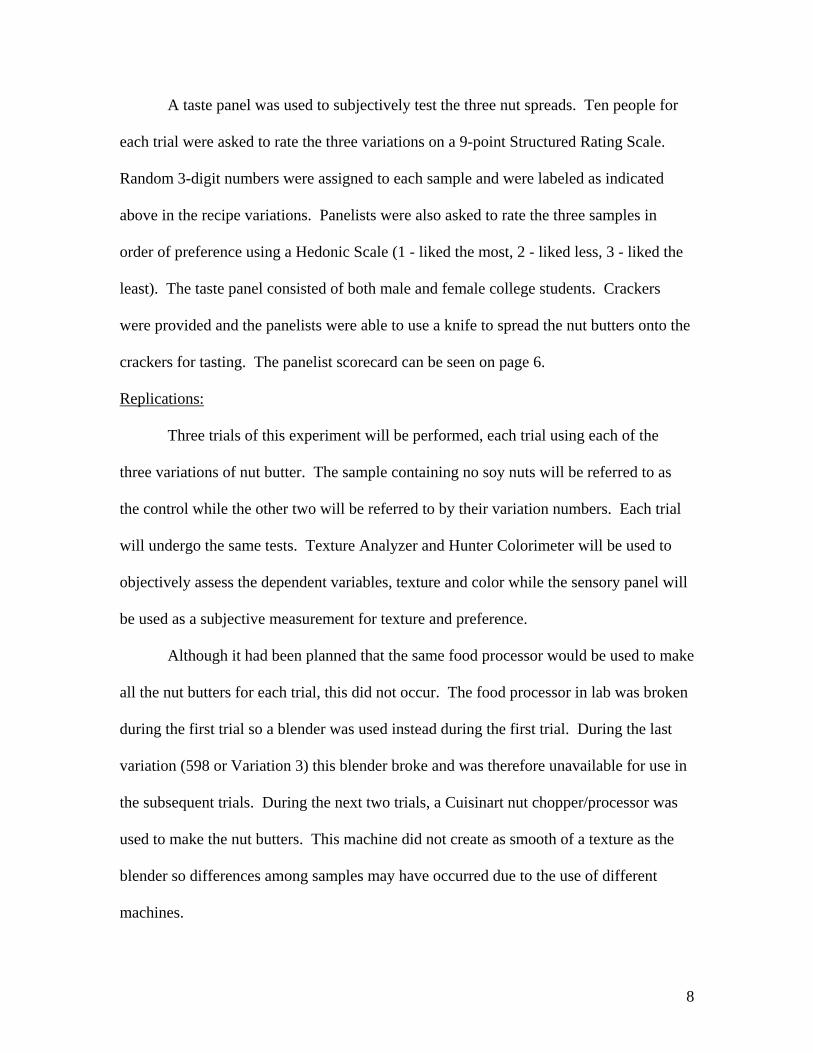
Sensory Evaluation Please taste each of the three nut butter samples in front of you. Using the scales below, please place a mark on the line to best describe your thoughts on each sample. 757
Dislike Slightly Like texture unacceptable Slightly texture very much texture like texture very much
Extremely Moderately Neither Moderately Extremely dislike dislike like nor like like
texture texture dislike texture texture 324
Dislike Slightly Like texture unacceptable Slightly texture very much texture like texture very much
Extremely Moderately Neither Moderately Extremely dislike dislike like nor like like
texture texture dislike texture texture 598
Dislike Slightly Like texture unacceptable Slightly texture very much texture like texture very much
Extremely Moderately Neither Moderately Extremely dislike dislike like nor like like
texture texture dislike texture texture Please rate the three samples in order of your preference. Rank the one you preferred most with a 1 and the one you liked least with a 3. 757 ___________ 324 ___________ 598 ___________ Additional Comments:
9
DISCUSSION:
All Texture Analyzer data was entered into Excel in order to evaluate the three
variations. Texture Analyzer data shows that the average force required to break the
surface of each nut butter sample increased with the increasing ratio of soy nuts to
peanuts. This can be seen by the increase from 12.53g for Variation 1 (100% peanuts) to
19.33g for Variation 3 (50% soy nuts). As the average TA values increased with
increasing soy nut concentration, so did the standard deviation. This could have been due
to sample 598 having larger pieces of soy nut left after homogenizing. It was noticed that
this sample was most difficult to make creamy because the soy nuts did not break up as
easily as the peanuts did. Because there were more soy nuts, this would allow for a
harder, less penetrable spread. Varying force results could have occurred if the TA probe
made contact with smoother parts during one test run and pieces of soy nut during other
test runs. The low standard deviation for Sample 1 could have been due to the ease of
chopping for peanuts. These nuts tended to break up more easily and therefore would
create a more uniform mixture for testing. All of these results can be seen below in
Figure 1.
P-values were calculated for paired variations in order to test the null hypothesis
that the samples textures are the same. These values were calculated using a t-test in
Excel and can be seen in Table 4. The P-values for comparing Variations 1 and 2,
Variations 1 and 3, and Variations 2 and 3 were all high indicating failure to reject the
null hypothesis. Therefore, it can be assumed that the textures of the samples are close
enough to be considered the same. From this comparison, we can assume that according
to texture, the three samples are the statistically the same.
10
Upon collecting data from the Hunter colorimeter, data was entered into Excel in
order to calculate the averages and standard deviations for the L, a, and b values. These
values can be viewed in the bar graphs labeled Figure 2, 3, and 4. The L values for
Variation 1 and 2 were pretty close indicating that the small amount of soy nuts added to
the spread did not make it much darker. However, the 3rd variation’s L value was slightly
lower than the other variations. This is most likely due to the larger addition of soy nuts
because they are darker and in larger ratios would have more of an affect on the darkness
of the spread. The standard deviation among samples did not change much indicating
that the samples were homogenized well and color was evenly distributed throughout the
sample. The a value indicates the levels of green or red in a substance. As the amount of
soy nut increased in the sample, the a value became higher indicating that there was more
red than green in the spread. The standard deviation was very small indicating again that
the sample was well mixed and the color was evenly distributed. The differences in these
values were fairly small, increasing by about a value of 1 between samples. The b value
is indicative of the amounts of yellow and blue in the sample. The values for b didn’t
seem to have a trend with increasing soy nut ratios. Here, Variation 2 and 3 were very
close, with Variation 2 being slightly higher. Variation 1 was lower than Variations 2
and 3.
After comparison of the significance values calculated in Excel (Tables 5-7), the
following relationships were found. L was found to be significantly different for Var1-
Var3 and Var2-Var3 pairs because the P-values were less than alpha (0.05). This
indicates that Variations 1 and 3, as well as Variations 2 and 3 differ enough in their
amount of white and black content that they can be considered different. The null
11
hypothesis that they are the same can be rejected as a result. However, Variations 1 and
2 were not different enough to be considered significant and therefore must be considered
equal. All P-values were much less than alpha for the color value a. The null hypothesis
would be rejected in these instances to indicate that the variations compared in Table 6
are significantly different from one another. This means that the samples were very
different in the levels of green and red they contained. Lastly, b values were not
significantly different for the comparisons so one would fail to reject the null and
consider the samples to be similar in reference to the amount of yellow and blue they
contain.
From the data collected during sensory panels, it can be seen that panelists
slightly liked both Variation 1 and Variation 2 and were between neither like nor dislike
and slightly dislike for Variation 3. The translated average numerical scores for
Variations 1 and 2 were 4.03 and 4.19 with very similar standard deviations, as shown in
Figure 5. Numerical data for average and standard deviation for the sensory tests can be
seen in Tables 2 and 3 below. This small difference may indicate that when compared to
plain peanut butter, a 25% addition of soy nuts does not affect the texture preference
among panelists. This result is only reinforced by the lack of significant t-test results for
texture mentioned above. Because both the subjective and objective data results show
that there is not a significant difference it can be assumed that Samples 1 and 2 are very
close in terms of texture and preference related to texture. The Hedonic Ranking Scale
tells us that according to taste, Variation 1 is preferred over Variations 2 and 3. The
difference between Variation 1 and Variation 2 is fairly large considering that a 3-point
scale was used.
12
Increasing soy nut ratios were found to have limited effects on texture and color.
Textural measurements had no significant effects on panelist preference. Generally, the b
color values lacked a significant correlation with preference. Comparisons between
Variations 1 and 3 and Variations 1 and 2 were fairly close to the significance level of
0.05. Comparison data can be seen in Table 7 below.
In general, L and a color values changed significantly with increasing soy nut
concentration. Color relationships are weaker than those for texture in predicting
consumer preference. This indicates the need for subsequent studies in which a more
extensive group of variables can be considered. Comparison of more variables would
allow for a better understanding of consumer preferences. For instance, nut quality,
harvesting techniques, and nut age could change consumer preference of nuts and nut
products. In a study performed on Macadamia nuts, Wall and Gentry found that kernel
maturity may influence the color of products. Their findings indicated that immature
kernels which contain higher amounts of sucrose and reducing underwent more extensive
browning during roasting than mature nuts (Wall and Gentry 2006).
This experiment could further be improved by making combination nut spreads
with nuts other than soy nuts. This would allow for further investigation of color, texture
and taste preferences for all nuts. Also, having a better food processor would aid in
creating equally homogenous spreads. Further investigations and changes such as these
would be a large help to industry in developing healthier products that still appeal to
consumers. Although the taste of soy nuts in this experiment did not seem to appeal to
tasters, they did seem slightly interested by the flavor. If other nut combinations were
13
investigated it may be possible to create a healthier yet appealing nut spread that the
obese population can use to lower their fat intakes.
RESULTS:
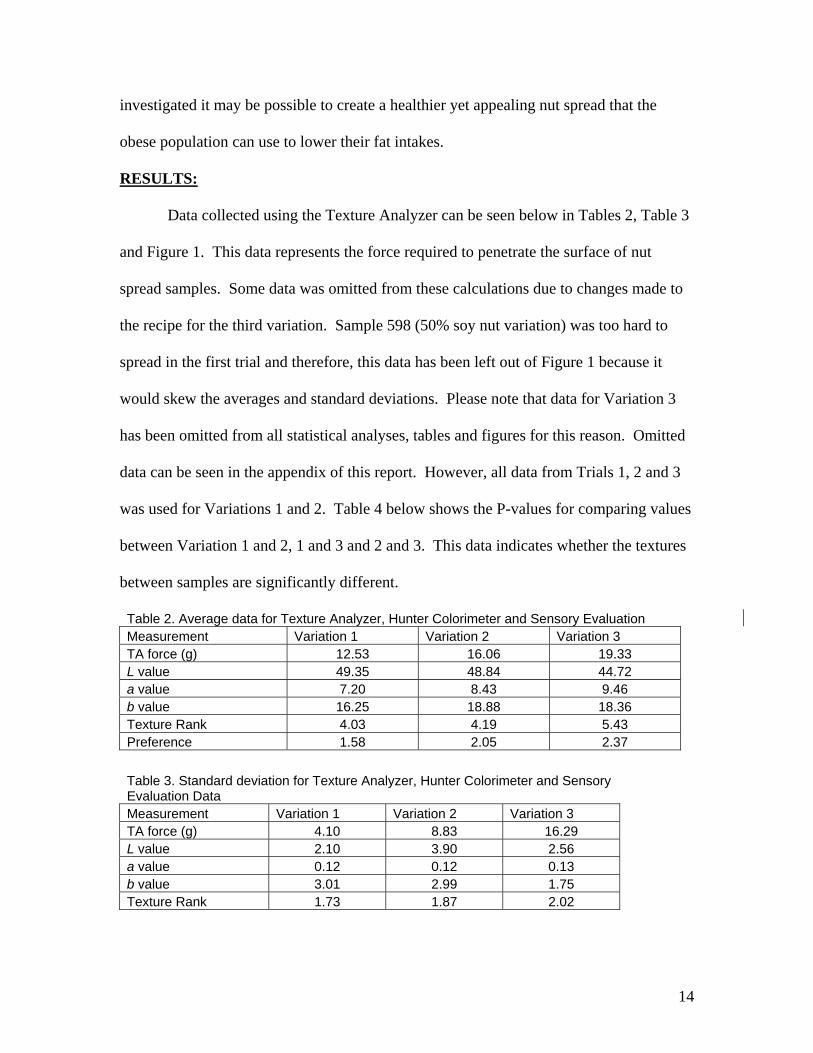
Data collected using the Texture Analyzer can be seen below in Tables 2, Table 3
and Figure 1. This data represents the force required to penetrate the surface of nut
spread samples. Some data was omitted from these calculations due to changes made to
the recipe for the third variation. Sample 598 (50% soy nut variation) was too hard to
spread in the first trial and therefore, this data has been left out of Figure 1 because it
would skew the averages and standard deviations. Please note that data for Variation 3
has been omitted from all statistical analyses, tables and figures for this reason. Omitted
data can be seen in the appendix of this report. However, all data from Trials 1, 2 and 3
was used for Variations 1 and 2. Table 4 below shows the P-values for comparing values
between Variation 1 and 2, 1 and 3 and 2 and 3. This data indicates whether the textures
between samples are significantly different.
Table 2. Average data for Texture Analyzer, Hunter Colorimeter and Sensory Evaluation Measurement Variation 1 Variation 2 Variation 3 TA force (g) 12.53 16.06 19.33 L value 49.35 48.84 44.72 a value 7.20 8.43 9.46 b value 16.25 18.88 18.36 Texture Rank 4.03 4.19 5.43 Preference 1.58 2.05 2.37
Table 3. Standard deviation for Texture Analyzer, Hunter Colorimeter and Sensory Evaluation Data Measurement Variation 1 Variation 2 Variation 3 TA force (g) 4.10 8.83 16.29 L value 2.10 3.90 2.56 a value 0.12 0.12 0.13 b value 3.01 2.99 1.75 Texture Rank 1.73 1.87 2.02
14
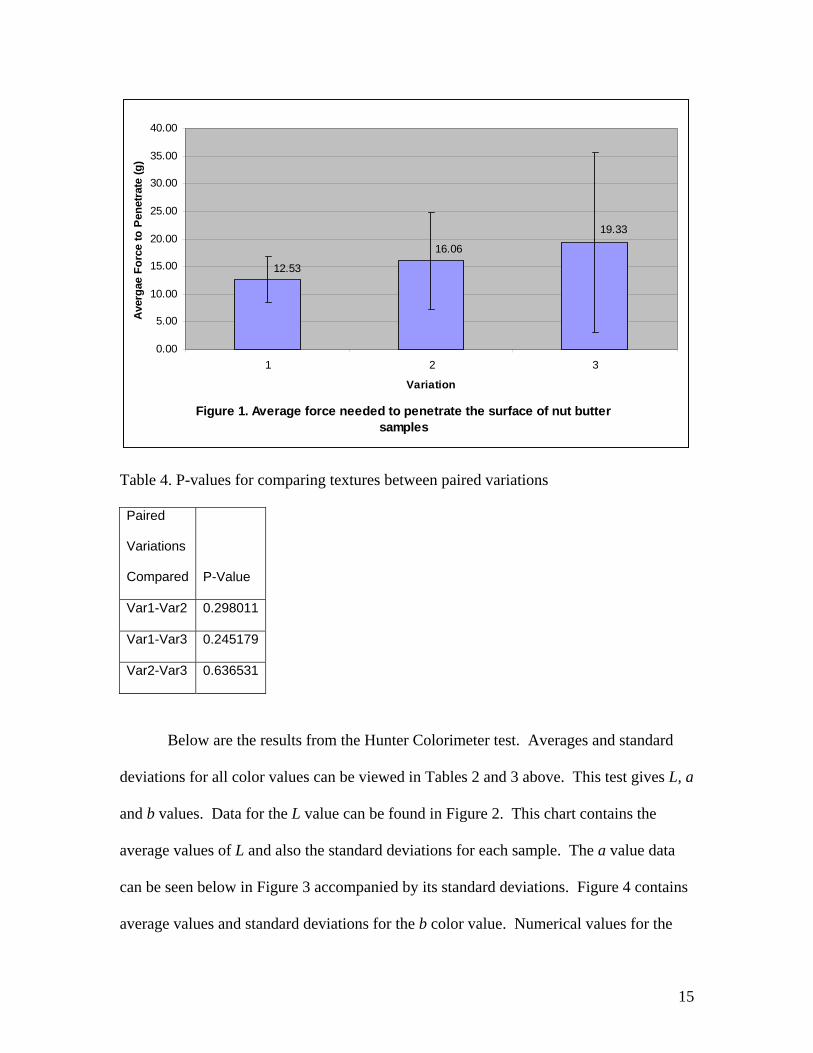
Figure 1. Average force needed to penetrate the surface of nut butter samples
19.33
16.06
12.53
0.00
5.00
10.00
15.00
20.00
25.00
30.00
35.00
40.00
1 2 3
Variation
Ave
rgae
For
ce to
Pen
etra
te (g
)
Table 4. P-values for comparing textures between paired variations
Paired
Variations
Compared P-Value
Var1-Var2 0.298011
Var1-Var3 0.245179
Var2-Var3 0.636531
Below are the results from the Hunter Colorimeter test. Averages and standard
deviations for all color values can be viewed in Tables 2 and 3 above. This test gives L, a
and b values. Data for the L value can be found in Figure 2. This chart contains the
average values of L and also the standard deviations for each sample. The a value data
can be seen below in Figure 3 accompanied by its standard deviations. Figure 4 contains
average values and standard deviations for the b color value. Numerical values for the
15
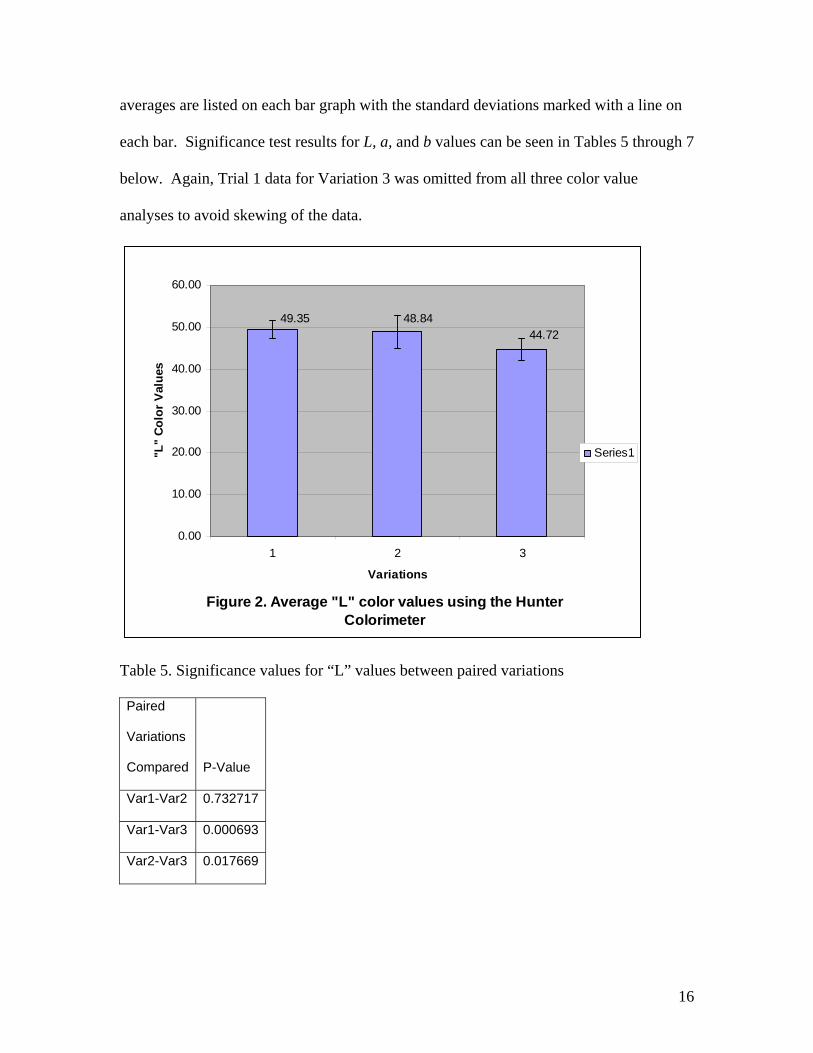
averages are listed on each bar graph with the standard deviations marked with a line on
each bar. Significance test results for L, a, and b values can be seen in Tables 5 through 7
below. Again, Trial 1 data for Variation 3 was omitted from all three color value
analyses to avoid skewing of the data.
Figure 2. Average "L" color values using the Hunter Colorimeter
44.7248.8449.35
0.00
10.00
20.00
30.00
40.00
50.00
60.00
1 2 3
Variations
"L"
Colo
r Val
ues
Series1
Table 5. Significance values for “L” values between paired variations
Paired
Variations
Compared P-Value
Var1-Var2 0.732717
Var1-Var3 0.000693
Var2-Var3 0.017669
16
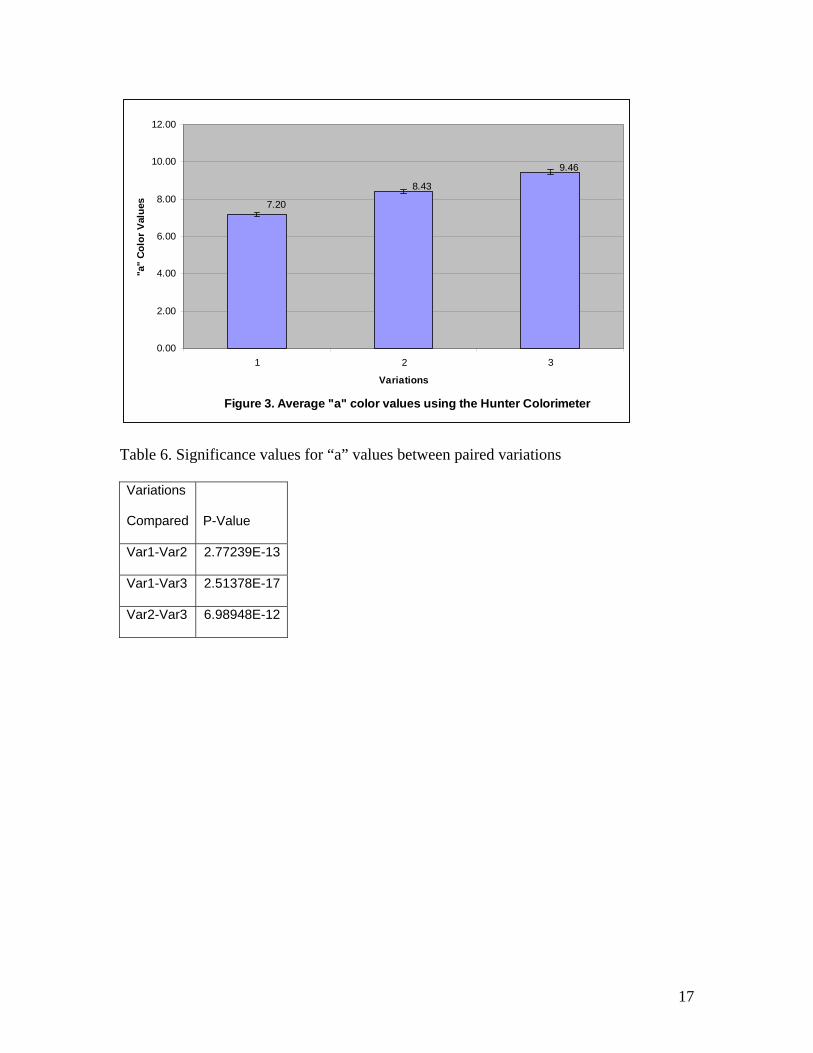
Figure 3. Average "a" color values using the Hunter Colorimeter
9.46
8.43
7.20
0.00
2.00
4.00
6.00
8.00
10.00
12.00
1 2 3
Variations
"a"
Colo
r Val
ues
Table 6. Significance values for “a” values between paired variations
Variations
Compared P-Value
Var1-Var2 2.77239E-13
Var1-Var3 2.51378E-17
Var2-Var3 6.98948E-12
17
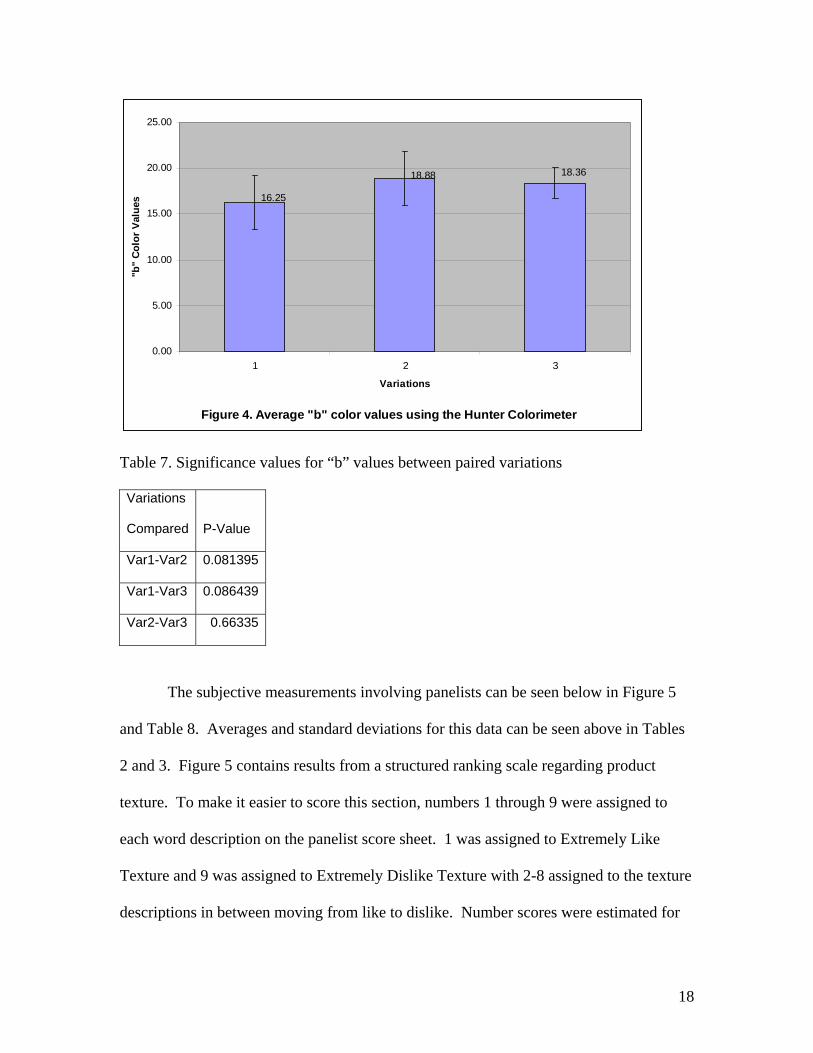
Figure 4. Average "b" color values using the Hunter Colorimeter
16.25
18.3618.88
0.00
5.00
10.00
15.00
20.00
25.00
1 2 3
Variations
"b"
Colo
r Val
ues
Table 7. Significance values for “b” values between paired variations
Variations
Compared P-Value
Var1-Var2 0.081395
Var1-Var3 0.086439
Var2-Var3 0.66335
The subjective measurements involving panelists can be seen below in Figure 5
and Table 8. Averages and standard deviations for this data can be seen above in Tables
2 and 3. Figure 5 contains results from a structured ranking scale regarding product
texture. To make it easier to score this section, numbers 1 through 9 were assigned to
each word description on the panelist score sheet. 1 was assigned to Extremely Like
Texture and 9 was assigned to Extremely Dislike Texture with 2-8 assigned to the texture
descriptions in between moving from like to dislike. Number scores were estimated for
18
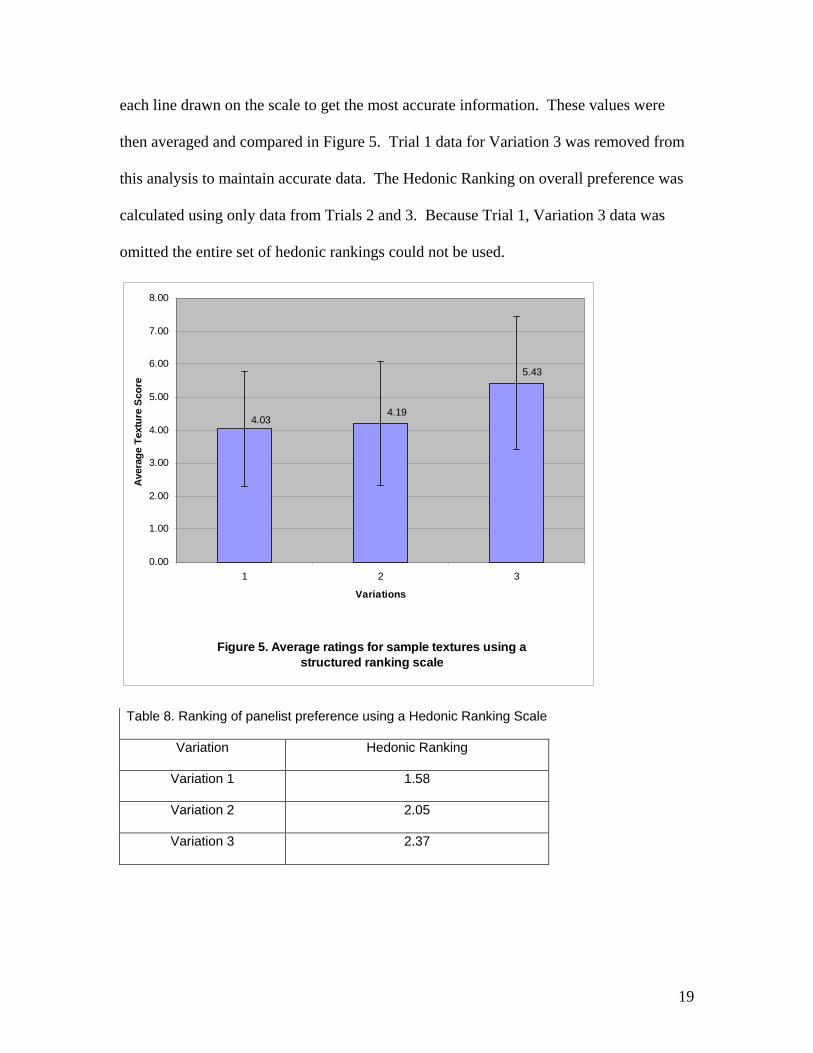
each line drawn on the scale to get the most accurate information. These values were
then averaged and compared in Figure 5. Trial 1 data for Variation 3 was removed from
this analysis to maintain accurate data. The Hedonic Ranking on overall preference was
calculated using only data from Trials 2 and 3. Because Trial 1, Variation 3 data was
omitted the entire set of hedonic rankings could not be used.
Figure 5. Average ratings for sample textures using a structured ranking scale
5.43
4.194.03
0.00
1.00
2.00
3.00
4.00
5.00
6.00
7.00
8.00
1 2 3
Variations
Aver
age
Text
ure
Sco
re
Table 8. Ranking of panelist preference using a Hedonic Ranking Scale
Variation Hedonic Ranking
Variation 1 1.58
Variation 2 2.05
Variation 3 2.37
19
REFERENCES:
Agricultural Research Service. 2006. What’s in the food you eat? (Date Accessed: 9/24/06) http://www.ars.usda.gov/is/pr/2005/051024.htm. Greendale, GA, FitzGerald, G, Huang, MH, Sternfeld, B, Gold, E, Seeman, T, Sherman, S, Sowers, M. 2002. Dietary soy isoflavones and bone mineral density: results from the study of women’s health across the nation. American Journal of Epidemiology 155: 746-754. Kurzer, M, Xu, X. 1997. Dietary Phytoestrogens. Annual Review of Nutrition 17: 353-381. Merz-Demlow, B, Nucan, A, Wangen, K, Xu, X, Carr, T, Phipps, W, et al. 2000. Soy isoflavones improve plasma lipids in normocholesterolemic, premenopausal women. American Journal of Clinical Nutrition 71: 1462-1469. PeanutButterLovers.com. Food Processor Peanut Butter Recipe. (Date Accessed: 9/4/06) (www.peanutbutterlovers.com/recipes/food_proc_pb.html Peterson, G. 1995. Evaluation of the biochemical targets of genistein in tumor cells. Journal of Nutrition 125: 784S-789S Tikkanen, MJ, Adlercreutz, H. Dietary Soy-Derived Isoflavone Phytoestrogens: Could they have a role in coronary heart disease prevention? Biochemical Pharmacology 60: 1-5. USDA, ARS. 2006. Agricultural Research Service Nutrient Data Laboratory. (Date Accessed: 9/24/06) http://www.nal.usda.gov/fnic/foodcomp/search/. Wall, MM, Gentry, TS. 2006. Carbohydrate composition and color development during drying and roasting of macadamia nuts (Macadamia integrifolia). Swiss Society of Food Science and Technology: 1-7.
20
APPENDIX:
Appended is Table 9 containing the average and standard deviation information
from Trial 1, Variation 3. This data was omitted from the analysis in the above tables
and figures to avoid skewing of the results.
Table 9. Variation 3 data averages and standard deviations from Trial 1
Measurement TA (g) Color L Color a Color b Texture Rank
Taste Preference
Average 92.63 41.32 9.36 16.04 5.56 2.55 St. Dev. 8.33 0.01 0.00 0.01 1.59 0.82
21


![Chemo-enzymatic synthesis routes for the production of bio ... · -2 kcal/mol-8 kcal/mol - 3 kcal/mol - 5 kcal/mol ∆G0‘: [H] [H] 4-step formation of 1,4 butandiol from glucose](https://img.pdfslide.us/doc/110x75/5f094cee7e708231d4262ba3/chemo-enzymatic-synthesis-routes-for-the-production-of-bio-2-kcalmol-8-kcalmol.jpg)


![DOC160315-20160315150713 · cooking] S 139 kcal (4 AB) • ltk .20g kicho-kicho.com 350 kcal 150g) ./J\äC4 *WÀJ] 475-6 0075-741-7138 17k 336 kcal](https://img.pdfslide.us/doc/110x75/5c68cadb09d3f2f5638c26b6/doc160315-cooking-s-139-kcal-4-ab-ltk-20g-kicho-kichocom-350-kcal.jpg)