Embed Size (px)
Citation preview
FEBRUARY 2020
RESEP WORKING PAPER
Socioeconomic Status and Class Size in South African Secondary Schools
Timothy Köhler
Stellenbosch Working Paper Series No. WP01/2020 Keywords: South Africa, class size, learner outcomes, education, human capital, school quality JEL Codes: I20, I21, I24, I28
Physical Address Research on Socio-Economic Policy (RESEP) Department of Economics Matieland 7602

Socioeconomic Status and Class Size in SouthAfrican Secondary Schools
TIMOTHY KÖHLER
Stellenbosch Economic Working Papers: WP01/2020
www.ekon.sun.ac.za/wpapers/2020/wp012020
January 2020
KEYWORDS: South Africa, class size, learner outcomes, education, humancapital, school qualityJEL: I20, I21, I24, I28
ReSEP (Research on Socio-Economic Policy)http://resep.sun.ac.za
DEPARTMENT OF ECONOMICSUNIVERSITY OF STELLENBOSCH
SOUTH AFRICA
A WORKING PAPER OF THE DEPARTMENT OF ECONOMICS AND THEBUREAU FOR ECONOMIC RESEARCH AT THE UNIVERSITY OF STELLENBOSCH
www.ekon.sun.ac.za/wpapers

Socioeconomic Status and Class Size in South AfricanSecondary Schools:
Evidence from the 2017/18 School Monitoring Survey and external
administrative data
Timothy Kohler1
January 2020
Abstract
The reduction of class size is frequently argued to be a relatively simple, cost-e↵ective
way to improve learner outcomes in a wide array of contexts. However, methodological
concerns regarding the appropriate use of observational data and endogeneity have led to a
lack of consensus on this relationship in the literature. In the South African context, most
studies which use observational data conclude that on average, greater class sizes are as-
sociated with poorer educational outcomes. However, given the country’s well-documented
bimodal education system, it is plausible to believe that such a relationship may depend on
where learners finds themselves in the system. Specifically, given that class size is highly
correlated with other measures of school quality, one may not find a significant relationship
once such characteristics are accounted for. In this light, this paper merges newly available,
school-level data from the 2017/18 School Monitoring Survey with external administrative
data to investigate whether the relationship between secondary school class size and learner
outcomes varies by school socioeconomic status. Using several learner outcome measures,
the findings suggest that although extreme class sizes are concentrated in poorer schools,
class size is only negatively associated with learner outcomes in wealthier schools. This
does not imply that class size does not matter. Rather, variation in class size appears to be
merely indicative of other important factors in poorer quality schools which influence learner
outcomes. This suggests that a class size reduction policy may only be e↵ective once other
factors relating to school quality are addressed.
1At the time of publication, Timothy Kohler was a researcher at the Development Policy Re-search Unit based in the University of Cape Town’s School of Economics, Rondebosch, 7701. Email:[email protected]. This paper was completed while the author was completing his Masters degree atStellenbosch University. The author would like to thank Professor Servaas Van der Berg in the Departmentof Economics at Stellenbosch University for his helpful comments and guidance.

Contents
1 Introduction 2
2 Literature review 2
2.1 The class size debate: do reductions in class size matter? . . . . . . . . . . . 2
2.2 Class sizes in the South African context . . . . . . . . . . . . . . . . . . . . . 4
3 Data and methodology 5
3.1 The 2017/18 School Monitoring Survey . . . . . . . . . . . . . . . . . . . . . 5
3.2 South Africa’s National Senior Certificate . . . . . . . . . . . . . . . . . . . . 6
3.3 Descriptive statistics . . . . . . . . . . . . . . . . . . . . . . . . . . . . . . . 7
3.4 Model specifications . . . . . . . . . . . . . . . . . . . . . . . . . . . . . . . 16
4 Model estimates 17
5 Conclusion 20
6 Appendix 24
1
1 Introduction
The reduction of class sizes is often argued to be one of the most simple and e↵ective ways
to improve learner outcomes. However, there is a lack of consensus in the literature on the
causal e↵ect of such reductions - a debate rooted in methodological concern. Many argue
that the education production function approach - the most popular of estimation strate-
gies in this literature - on non-experimental data yields biased estimates. This is due to
the fact that learners, parents, and teachers typically are not randomly assigned to schools
and classrooms. In response to this critique, experimental and quasi-experimental studies
have sought to yield more reliable estimates of the e↵ect of class size. Despite most of these
studies finding positive e↵ects from class size reduction, many assert that any evidence of
such e↵ects is merely indicative of other characteristics certain schools exhibit. Only obser-
vational studies in this regard exist in the South African context, a country whose public
schools - particularly those of a lower socioeconomic status (SES) - are characterised by
considerably large class sizes. The South African education system’s bimodal distribution
of learner outcomes is well-documented, and many studies stress the importance of factors
other than class size in improving learning. Using a unique dataset which combines Grade
12 examination data and new data from the 2017/18 School Monitoring Survey never-before
used, this paper empirically investigates the relationship between class size and learner out-
comes at the school-level in South African public secondary schools. In particular, it focuses
on whether this relationship depends on a school’s SES, given that there may be implications
for conventional school inputs and class size reduction policies if such heterogeneity exists.
2 Literature review
2.1 The class size debate: do reductions in class size matter?
One way to improve learner outcomes that is often thought to be e↵ective is by reducing
class sizes in schools (Altinok and Kingdon, 2012:203). From a public choice perspective, it
is argued that class size is an easier tool to manipulate relative to other school-related in-
puts (Angrist and Lavy, 1999:533). Indeed, self-reports from parents and teachers in survey
data are indicative of wide-spread preference for smaller classes (Pedder, 2006:219; Angrist
and Lavy, 1999:533). Proponents of smaller classes argue that they allow for higher-quality
learning opportunities, development of teacher-learner relationships, more individualised and
learner-centric instruction, increased teacher morale, and less learner misbehaviour (Chingos,
2013:413; Hattie, 2005:387). Although significant, positive estimates for class size reduction
have been found in some studies, several studies assert that it is not smaller class sizes which
2
positively a↵ect learner outcomes but rather other factors which schools with small class
sizes tend to exhibit. Because of this discrepancy in the literature, Pedder (2006:214) states
that policymakers are rightly informed that evidence of the causal e↵ect of class size is mixed
at best.
This lack of consensus is mainly rooted in valid methodological concerns. The use of ed-
ucation production functions on observational data serves as the most common approach to
estimating the relationship between class size and learner outcomes (Woesmann and West,
2006:697). However, in reality the assignment of learners and teachers to classrooms and
schools is typically non-random. These include unobserved parental preferences to send
their children to schools of certain types (Case and Deaton, 1999:1047) in certain neighbour-
hoods (Rivkin et al., 2005:418), or ensure that their children are taught in a particular class
(for example, with their peers or taught by a preferred teacher) (Li and Konstantopoulos,
2016:510). Schools may also use learners’ previous academic performance or another form
of assessment to assign them to a specific class (Rivkin et al., 2005:418). This means that
in such a model, class size will likely be correlated with some unobserved learner, parent,
or teacher characteristic(s). The key implication of such selection is that such estimates on
non-experimental data will likely be biased.
Given the above endogeneity concern, several studies have used experimental and quasi-
experimental methods to reliably estimate the causal e↵ect of class size on learner outcomes.
Most findings of these studies suggest that smaller class sizes do indeed have a significant,
positive e↵ect on learner outcomes (Krueger, 2003:F34; Juan and Visser, 2017:2). However,
the magnitudes of the estimates are often small and inconsistent (Chingos, 2013:412). Sev-
eral studies have also shown that the e↵ects tend to be larger for learners in lower grades
and those regarded as previously disadvantaged (Rivkin et al., 2005:449; Li and Konstan-
topoulos, 2016:503). Hattie (2005) also stresses that e↵ects vary depending on the size of the
reduction. For typical developing country contexts, this latter point is important given the
mean class sizes tend to be considerably larger than that of developed countries. Despite the
now substantial amount of experimental and quasi-experimental evidence yielding positive
class size reduction e↵ects, many remain unconvinced, mainly citing the influential literature
of Hanushek (1986, 1989, 1996, 1997, 1998) who asserted that there is no strong or consistent
relationship between school-related inputs such as class size and learner outcomes. However,
in a reanalysis of some of Hanushek’s early meta-analyses, Krueger (2003) concluded that the
author inappropriately placed a disproportionate weight on several studies that “frequently
used small samples and estimated misspecified models” (pg. F35).
3
Perhaps two of the most cited studies on class size are those of Krueger (1999) and
Angrist and Lavy (1999). The latter study used a quasi-experimental technique (a regression
discontinuity design) on observational data to exploit a maximum class size policy rule in
the Israeli school system. Their results highlighted a significant, positive e↵ect of a class
size reduction on Grade 4 and 5 (but not 3) learner test scores. In the former experimental
study - Project STAR (Student/Teacher Achievement Ratio) - learners in Tennessee were
randomly assigned into classrooms of various sizes from kindergarten through to Grade 3
in the mid-1980s. Although the gains were small, the results strongly supported class size
reductions to improve learner outcomes. Furthermore, there were long-term gains: learners
who were in smaller classes were more likely to graduate and get a degree in the STEM field.2
Although viewed as one of the most impressive studies of its kind (Li and Konstantopoulos,
2016:506), there are concerns pertaining to parental knowledge of the experiment and their
consequent choice to participate prior to the start of the experiment (Woesmann and West,
2006:698).
2.2 Class sizes in the South African context
Despite the large amount of research on class size e↵ects in the world, the vast majority has
been conducted in and for developed country contexts. The findings of these studies may
not be generalisable to developing countries given that, as mentioned previously, the typical
class size in the latter is on average considerably larger. Spaull (2016:2) asserts that it is
reasonable to hypothesise that class size reduction e↵ects from a higher level (for example,
60 to 40 learners) may di↵er from those at a lower level. In South African public schools,
it is well-documented that class sizes are very high, even by developing country standards
(Gustafsson and Mabogoane, 2012:356) and especially in schools that historically catered
for Black African learners (Howie, 2005:124). To the author’s knowledge, no experimental
or quasi-experimental study exists which seeks to estimate the causal e↵ect of class sizes
on learner outcomes in SA’s context. Despite the lack of causal evidence, legislation on
maximum class sizes does exist, although it is suggestive rather than coercive in nature.
The post-provisioning norms of 2016 (Government Gazette No. 3968) states that the ideal
maximum class size for South African public secondary schools is 37 for Grade 8 and 9. For
Grades 10 to 12, the recommended maximum varies by subject but is 35 and 37 for o�cial
languages and mathematics.
2Science, technology, Engineering, and Mathematics.
4
There are however several studies which use the popular education production function
approach on observational data. The earliest of these (Case and Deaton, 1999) uses ad-
ministrative data in combination with the 1993 Project for Statistics on Living Standards
and Development (PSLSD) survey data to investigate the relationship between several edu-
cational inputs and Black African learner outcomes. Although class size was not explicitly
examined, the authors argue that class size variation for these learners was mostly exoge-
nous owing to apartheid-era policies’ e↵ects on the population’s freedom of residential and
school choice. The authors found strong e↵ects of pupil-teacher ratios, similar to other find-
ings. Using the Trends in International Mathematics and Science Study (TIMSS) of 1999,
Howie (2005) found that 47% of the variation of South African learners’ mathematics test
scores is explained by just six classroom-level variables, one of which is class size (signifi-
cant and negatively related). Using TIMSS 2011, Visser et al. (2015) also found a negative
relationship. Juan and Visser (2017) used the same data and draw similar conclusions for
science test scores. Taylor and Yu (2006) found similar results for literacy test scores using
the Progress in International Reading and Literacy Study (PIRLS) 2006 data. However, it
should be noted that one ought to be cautious in interpreting some of the coe�cients in
these studies. This is because of the high degree of multi-collinearity between class size and
other factors, which may mean that if such factors are not controlled for, class size could act
as a sort of proxy for socioeconomic status. For instance, by using the Southern and Eastern
African Consortium for Monitoring Educational Quality (SACMEQ) III data, Spaull (2013)
found no significant relationship between class size and literacy or numeracy test scores once
such factors were controlled for (irrespective of whether the learners were in the so-called
functional or dysfunctional parts of SA’s education system).
3 Data and methodology
3.1 The 2017/18 School Monitoring Survey
This paper utilises data from two sources, the first being the 2017/18 School Monitoring
Survey (SMS). Conducted in 2017, the SMS is a national, cross-sectional survey of primary-
and secondary-school teachers, learners, and principals in public ordinary schools.3 To the
author’s knowledge, this is the first knowledgeable study to use the 2017/18 SMS data to
analyse the relationship of interest. Commissioned by the national Department of Basic Edu-
cation (DBE), the goal of the survey was to collect information not available in other datasets
and to investigate the progress of schools towards achieving the key goals and indicators of
3Special Needs Education Schools, Specialisation Schools, and private schools are excluded.
5

the DBE’s Action Plan 2019 and of the Medium-Term Strategic Framework 2014-2019.4
The survey consists of a total of five questionnaires administered to principals, Grade 3, 6,
9 and 12 teachers, and appropriate members of school sta↵ knowledgable of learner teaching
support material (LTSM) and learners with special educational needs (LSEN). Regarding
teachers, at least one Language teacher and one Mathematics teacher in Grades 3, 6, 9,
and 12 were interviewed for each school. Stratified by province and school quintile, random
samples of 1 000 primary and 1 000 secondary public ordinary schools were planned, re-
sulting in a final 1 976 schools consisting of 8 626 observations being successfully sampled.5
Unless indicated otherwise, school- and learner-level sample weights were used throughout
this analysis to ensure representativeness and adjust for stratum size.6
Although the SMS includes several questions administered to learners within the sampled
schools, such as the amount of learners who have workbooks and textbooks, the survey does
not include any data on a given learner, class, or school’s performance in terms of test scores.
In this light, a unique dataset is constructed for this paper by merging external, school-level
administrative data with the SMS data, as discussed in the next section.
3.2 South Africa’s National Senior Certificate
Commonly referred to as the matriculation exam, the National Senior Certificate (NSC)
serves as SA’s set of secondary school-leaving exams administered by the DBE in all public
schools at the end of Grade 12. The NSC data used in this paper is on the school-level
and contains each school’s (i) Education Management Information System (EMIS) number
which serve to identify every school in South Africa by a unique, eight-digit number, and
(ii) various performance measures, such as the mean Grade 12 mathematics mark and the
proportion of learners who have obtained an NSC pass. The former point is important, given
that the EMIS number for every school is included in the SMS data. For the purposes of
this analysis, NSC data for the year 2017 was merged to the SMS data using school EMIS
numbers. Considering the NSC examination takes place at the end of secondary school,
the SMS sample was restricted to include only those observations in secondary schools (i.e.
Grade 9 or 12). Most of the sample (97% of observations (4 759 of 4 866) or 97% of schools
(964 of 911)) could be matched in this regard.
4In particular, the survey focused on 13 of the 15 Action Plan indicators which were measured in the2011 School Monitoring Survey.
5The interested reader is referred to the 2017/18 SMS report for more information on the survey’s samplingdesign, available here: https://www.education.gov.za/Resources/Reports.aspx.
6The latter weights are used for teachers as observations, as suggested in the 2017/18 SMS report.
6
3.3 Descriptive statistics
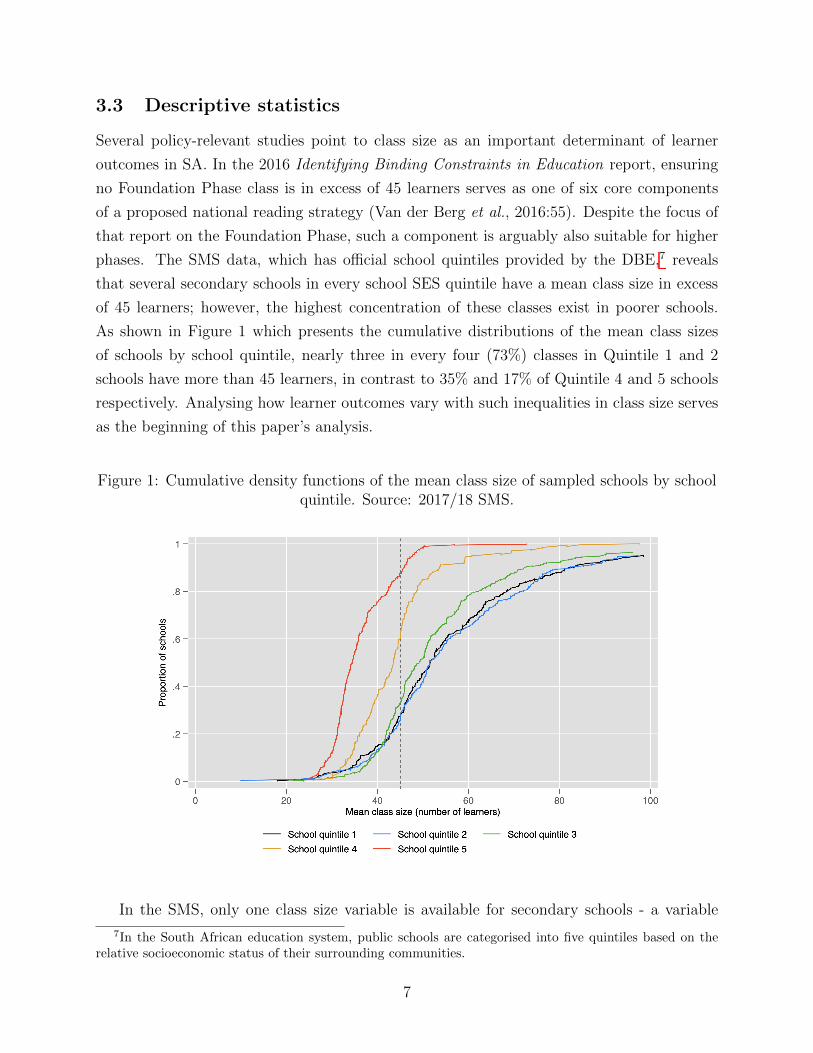
Several policy-relevant studies point to class size as an important determinant of learner
outcomes in SA. In the 2016 Identifying Binding Constraints in Education report, ensuring
no Foundation Phase class is in excess of 45 learners serves as one of six core components
of a proposed national reading strategy (Van der Berg et al., 2016:55). Despite the focus of
that report on the Foundation Phase, such a component is arguably also suitable for higher
phases. The SMS data, which has o�cial school quintiles provided by the DBE,7 reveals
that several secondary schools in every school SES quintile have a mean class size in excess
of 45 learners; however, the highest concentration of these classes exist in poorer schools.
As shown in Figure 1 which presents the cumulative distributions of the mean class sizes
of schools by school quintile, nearly three in every four (73%) classes in Quintile 1 and 2
schools have more than 45 learners, in contrast to 35% and 17% of Quintile 4 and 5 schools
respectively. Analysing how learner outcomes vary with such inequalities in class size serves
as the beginning of this paper’s analysis.
Figure 1: Cumulative density functions of the mean class size of sampled schools by schoolquintile. Source: 2017/18 SMS.
In the SMS, only one class size variable is available for secondary schools - a variable
7In the South African education system, public schools are categorised into five quintiles based on therelative socioeconomic status of their surrounding communities.
7
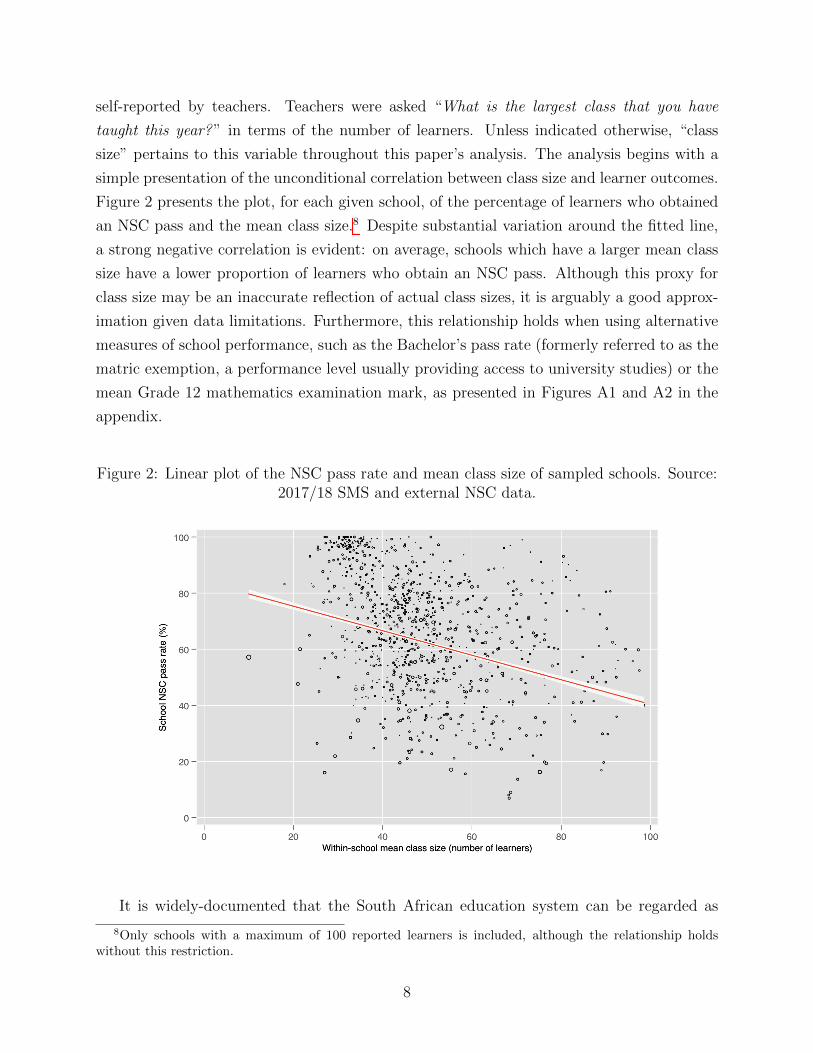
self-reported by teachers. Teachers were asked “What is the largest class that you have
taught this year?” in terms of the number of learners. Unless indicated otherwise, “class
size” pertains to this variable throughout this paper’s analysis. The analysis begins with a
simple presentation of the unconditional correlation between class size and learner outcomes.
Figure 2 presents the plot, for each given school, of the percentage of learners who obtained
an NSC pass and the mean class size.8 Despite substantial variation around the fitted line,
a strong negative correlation is evident: on average, schools which have a larger mean class
size have a lower proportion of learners who obtain an NSC pass. Although this proxy for
class size may be an inaccurate reflection of actual class sizes, it is arguably a good approx-
imation given data limitations. Furthermore, this relationship holds when using alternative
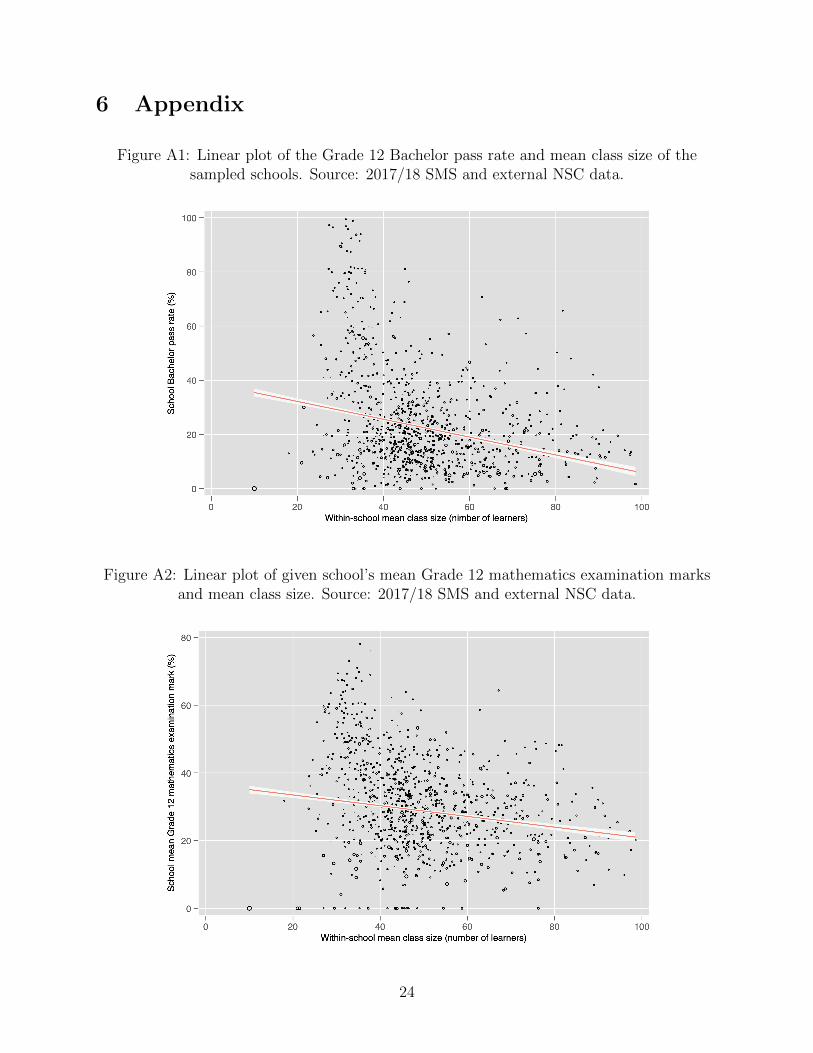
measures of school performance, such as the Bachelor’s pass rate (formerly referred to as the
matric exemption, a performance level usually providing access to university studies) or the
mean Grade 12 mathematics examination mark, as presented in Figures A1 and A2 in the
appendix.
Figure 2: Linear plot of the NSC pass rate and mean class size of sampled schools. Source:2017/18 SMS and external NSC data.
It is widely-documented that the South African education system can be regarded as
8Only schools with a maximum of 100 reported learners is included, although the relationship holdswithout this restriction.
8
dualistic in nature, consisting of a minority (about 25%) of learners attending mostly func-
tional schools, leaving the majority of learners in dysfunctional schools (Spaull, 2013:437).
These are considered as functional and dysfunctional in the sense that the former e↵ectively
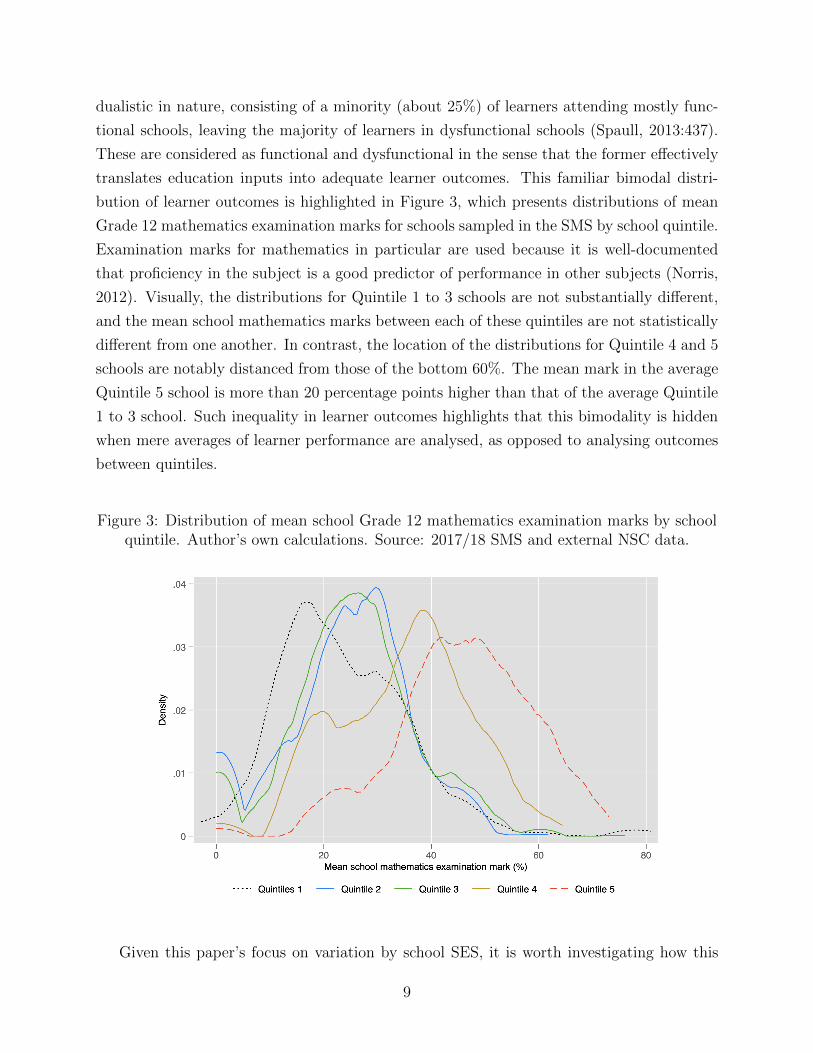
translates education inputs into adequate learner outcomes. This familiar bimodal distri-
bution of learner outcomes is highlighted in Figure 3, which presents distributions of mean
Grade 12 mathematics examination marks for schools sampled in the SMS by school quintile.
Examination marks for mathematics in particular are used because it is well-documented
that proficiency in the subject is a good predictor of performance in other subjects (Norris,
2012). Visually, the distributions for Quintile 1 to 3 schools are not substantially di↵erent,
and the mean school mathematics marks between each of these quintiles are not statistically
di↵erent from one another. In contrast, the location of the distributions for Quintile 4 and 5
schools are notably distanced from those of the bottom 60%. The mean mark in the average
Quintile 5 school is more than 20 percentage points higher than that of the average Quintile
1 to 3 school. Such inequality in learner outcomes highlights that this bimodality is hidden
when mere averages of learner performance are analysed, as opposed to analysing outcomes
between quintiles.
Figure 3: Distribution of mean school Grade 12 mathematics examination marks by schoolquintile. Author’s own calculations. Source: 2017/18 SMS and external NSC data.
Given this paper’s focus on variation by school SES, it is worth investigating how this
9

relationship between class size and school performance may di↵er for schools of di↵erent quin-
tile categories. Figure 4 presents the mean NSC pass rates, class sizes, and pupil-teacher
ratios (PTRs) by school quintile. PTRs were calculated based on the self-reported answers
of two questions from each school’s principal: “How many learners were enrolled in your
school?” and “How many teachers were employed at your school?” as of the end of Septem-
ber 2017.9 It is clear that wealthier schools on average have smaller class sizes and higher
NSC pass rates. As previously expressed, Quintile 1 to 3 schools do not di↵er significantly
from one another in these aspects, while there are 20 more learners in the average class in
the poorest 60% of schools relative to the wealthiest 20%.10 This coincides with a more
than 30 percentage point di↵erence in inter-quintile NSC pass rates: just 56% of learners in
Quintile 1 to 3 schools pass Grade 12 with an NSC, in contrast to 87% of learners in Quintile
5 schools. Including PTR in the figure allows one to assess whether it implies the same
thing as class size - the only di↵erence between the two variables relating to how teachers
are used. In contrast to class size, it is clear that mean PTRs are relatively constant across
the school SES distribution ranging from about 26-28 in Quintile 1 to 4 schools to 24 in
Quintile 5 schools respectively - all of which are not statistically significantly di↵erent from
one another. Expectedly, Figure 5 shows that the lower PTR in the average Quintile 5 school
is driven by a greater number of teachers (nearly 20 more) relative to the average Quintile 1
school. Despite such similar mean PTRs, striking realities exist for several poor schools. For
instance, there are two Quintile 2 secondary schools in the Eastern Cape which have about
1 050 learners but just 22 teachers.
9The definition of teachers here includes both School Governing Body and state-employed teachers, prin-cipals, and School Management Team members, teachers, or practitioners (including Grade R teachers). Itdoes not include administrative sta↵, cleaners, caretakers, security, or student teachers on practical.
10Specifically, the mean class sizes of Quintile 1, 2, and 3 schools are 56.34, 57.15, and 54.56 - all of whichare not statistically significantly di↵erent from one another. The mean class size of Quintile 5 schools is 37.
10

Figure 4: Mean NSC pass rate, class size, and pupil-teacher ratio by school quintile.Author’s own calculations. Source: 2017/18 SMS and external NSC data.
Figure 5: Mean number of learners, teachers, and pupil-teacher ratio by school quintile.Source: 2017/18 SMS and external NSC data.
11

Figure 6: Intra-quintile linear plots of the NSC pass rates and mean class sizes of sampledschools. Source: 2017/18 SMS and external NSC data.
What might be the reason(s) behind better learner outcomes in schools with lower mean
class sizes? It is plausible that schools which have higher mean class sizes exhibit other
characteristics (which are not evident in schools with lower mean class sizes) which have
adverse e↵ects on learner outcomes. If so, then any significant e↵ect of class size may merely
reflect the e↵ects of these factors. This is possible given that in SA’s context, as expressed
by Howie (2005:137), schools which have classrooms with large numbers of learners are also
those with poor conditions. This is indicative of the endogeneity concern in the literature
arising from the non-random assignment of learners and teachers to schools (Woessman and
West, 2006:596; Li and Konstantopoulos, 2016:510), so schools with di↵erent class sizes likely
di↵er by several other observable and unobservable factors. Considering the consensus in
the literature that teacher quality is one of the most important school-level determinants of
learner outcomes (Van der Berg et al., 2016:9; Shepherd, 2011:1; Spaull, 2013:443), Table 1
investigates how several teacher characteristics vary between Quintile 1 to Quintile 5 schools
(i.e. high to low mean class size schools). Investigating variation in teacher characteristics
by school quintile is important in this regard given that there is empirical evidence of teacher
self-selection into schools (Shepherd, 2011:14). The estimates in Table 1 are suggestive of
such selection, with wealthier schools employing a greater proportion of teachers with higher
12

qualifications, experience, confidence, and satisfaction, to name a few characteristics. About
one in every three teachers in Quintile 1 to 3 schools have a postgraduate degree, as opposed
to more than one in every two teachers in the Quintile 5 schools. The average teacher in
the latter schools have more than five additional years of teaching experience than the av-
erage teacher in Quintile 1 schools. Relative to those in poorer schools, the average teacher
in Quintile 5 schools also allocates, according to their self-reporting, eight more hours to
teaching in a given week. They are also more likely to have received training on supporting
learners with learning di�culties, as well as to teach classrooms where every learner has a
textbook. On the other hand, it is perhaps comforting to note that teachers in poorer schools
are more likely to participate in externally initiated professional development programmes
(administered by the DBE or other formal authorities), and more often use DBE workbooks
for classroom instruction.
Table 1: Select school and teacher characteristics by school quintile. Author’s owncalculations. Source: 2017/18 SMS.
School quintile
1 2 3 4 5 Total
School characteristics
Pupil-teacher ratio (PTR) 26.796 27.269 27.894 26.025 23.842 26.659
Mean class size (number of learners) 57.081 57.846 55.236 44.139 37.071 52.560
Teacher characteristics
Matric (%) 1.370 0.980 0.800 0.630 0.800 0.910
Diploma (%) 22.280 24.370 21.780 16.190 7.790 18.980
First Degree (%) 46.350 41.760 42.420 42.010 39.590 42.390
Postgraduate Degree (%) 30.000 32.890 35.000 41.170 51.810 37.720
Took mathematics in matric (%) 66.620 64.330 68.030 73.420 85.320 71.030
Mean years teaching this subject/phase 10.401 11.609 12.028 13.570 15.600 12.203
Very confident in teaching this 63.610 67.780 64.190 70.570 79.250 68.600
subject/phase (%)
Mean weekly teaching time (hours) 18.748 19.105 20.207 25.786 26.748 21.106
Teaching multi-grade class (%) 6.710 7.410 7.830 6.500 11.230 8.000
Participated in self-initiated 58.110 52.240 56.200 61.530 64.550 58.030
professional development (%)
Participated in school-initiated 65.410 64.670 65.330 72.980 81.380 69.320
13

Table 1: Select school and teacher characteristics by school quintile (continued). Author’sown calculations. Source: 2017/18 SMS.
School quintile
1 2 3 4 5 Total
professional development (%)
Participated in external-initiated 74.160 76.460 73.280 70.850 58.910 71.040
professional development (DBE) (%)
Participated in external-initiated 38.590 35.380 34.220 31.300 25.480 33.170
professional development (Other) (%)
Received training on supporting learners 39.950 39.160 41.670 47.730 53.030 43.840
with learning di�culties (%)
Very satisfied with support received 30.360 32.270 32.140 35.970 53.620 36.460
from HOD (%)
Often use DBE workbooks in classes (%) 8.090 11.210 11.120 14.650 6.930 10.300
Every learner has a textbook (%) 58.240 58.890 64.890 66.690 76.620 64.910
Given this paper’s focus on class size, one issue with the data presented in Table 1 is that
it presents variation in teacher characteristics by school quintile, as opposed to class size
quintile. Despite this, the observed inverse relationship between class size and school SES
as measured by school quintile categories means that variation in teacher characteristics by
class size quintile will likely exhibit the same overall patterns when school quintile is used:
schools with lower mean class sizes (i.e. mainly wealthier schools) tend to employ better
quality teachers, so to speak. Indeed, after categorising schools in the data into five groups
(quintiles) by mean class size, a strong negative Spearman correlation coe�cient of -0.502 (p-
value: 0.000) is found for these two quintile variables. Estimates for teacher characteristics
by class size quintile are presented in Table 2. As expected, in schools with a mean class
size in the top 20% of the class size distribution, the average teacher teaches a class of
just under 80 learners and is less likely to (i) have a postgraduate degree, (ii) have taken
mathematics in Grade 12, (iii) be very confident in teaching their subject or phase, and
(iv) have received training on supporting learners with learning di�culties. These estimates
suggest that, because class size appears to be highly correlated with other school-quality
related factors, it may be endogenous. The next section investigates this further.
14

Table 2: Select school and teacher characteristics by class size quintile. Author’s owncalculations. Source: 2017/18 SMS.
Class size quintile
1 2 3 4 5 Total
School characteristics
Pupil-teacher ratio (PTR) 20.280 26.190 27.707 28.879 29.068 26.687
Mean class size (number of learners) 30.247 40.249 46.139 53.646 79.250 52.560
Teacher characteristics
Matric (%) 0.670 0.470 0.460 0.780 1.790 0.910
Diploma (%) 12.390 17.300 19.630 22.620 20.820 18.980
First Degree (%) 38.460 40.150 43.160 44.050 44.460 42.390
Postgraduate Degree (%) 48.470 42.080 36.740 32.550 32.930 37.720
Took mathematics in matric (%) 80.560 77.970 72.330 64.040 65.010 71.030
Mean years teaching this subject/phase 13.460 12.531 12.408 12.126 11.030 12.203
Very confident in teaching this 78.160 67.580 66.610 66.280 66.730 68.600
subject/phase (%)
Mean weekly teaching time (hours) 23.456 24.283 23.878 19.168 17.238 21.106
Teaching multi-grade class (%) 9.270 8.970 8.000 5.760 8.330 8.000
Participated in self-initiated 60.530 60.460 58.930 56.240 55.610 58.030
professional development (%)
Participated in school-initiated 79.170 71.410 68.750 65.200 65.540 69.320
professional development (%)
Participated in external-initiated 57.760 70.200 71.310 76.300 75.390 71.040
professional development (DBE) (%)
Participated in external-initiated 27.930 30.340 30.660 36.940 37.150 33.170
professional development (Other) (%)
Received training on supporting learners 52.410 51.950 42.250 39.110 37.840 43.840
with learning di�culties (%)
Very satisfied with support received 52.000 36.920 30.070 30.030 36.300 36.460
from HOD (%)
Often use DBE workbooks in classes (%) 7.330 11.490 12.230 10.790 9.530 10.300
Every learner has a textbook (%) 84.330 70.030 66.690 59.330 52.650 64.910
15
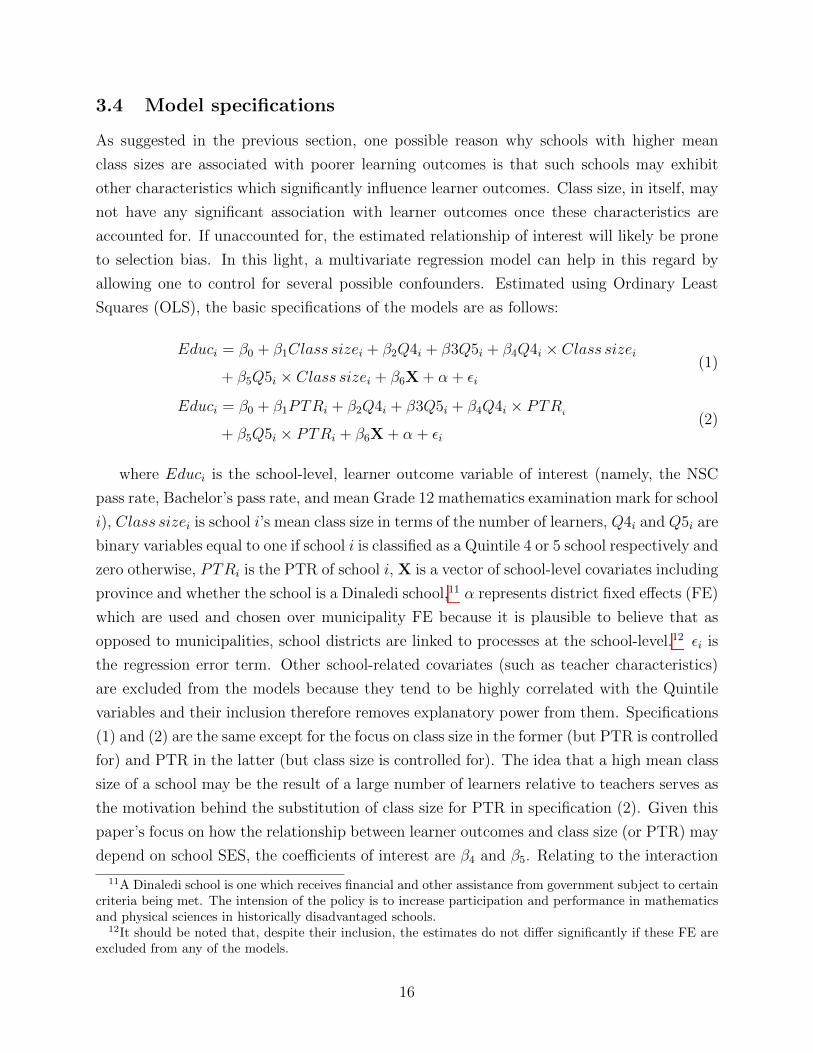
3.4 Model specifications
As suggested in the previous section, one possible reason why schools with higher mean
class sizes are associated with poorer learning outcomes is that such schools may exhibit
other characteristics which significantly influence learner outcomes. Class size, in itself, may
not have any significant association with learner outcomes once these characteristics are
accounted for. If unaccounted for, the estimated relationship of interest will likely be prone
to selection bias. In this light, a multivariate regression model can help in this regard by
allowing one to control for several possible confounders. Estimated using Ordinary Least
Squares (OLS), the basic specifications of the models are as follows:
Educi = �0 + �1Class sizei + �2Q4i + �3Q5i + �4Q4i ⇥ Class sizei
+ �5Q5i ⇥ Class sizei + �6X+ ↵ + ✏i(1)
Educi = �0 + �1PTRi + �2Q4i + �3Q5i + �4Q4i ⇥ PTRi
+ �5Q5i ⇥ PTRi + �6X+ ↵ + ✏i(2)
where Educi is the school-level, learner outcome variable of interest (namely, the NSC
pass rate, Bachelor’s pass rate, and mean Grade 12 mathematics examination mark for school
i), Class sizei is school i’s mean class size in terms of the number of learners, Q4i and Q5i are
binary variables equal to one if school i is classified as a Quintile 4 or 5 school respectively and
zero otherwise, PTRi is the PTR of school i, X is a vector of school-level covariates including
province and whether the school is a Dinaledi school,11 ↵ represents district fixed e↵ects (FE)
which are used and chosen over municipality FE because it is plausible to believe that as
opposed to municipalities, school districts are linked to processes at the school-level.12 ✏i is
the regression error term. Other school-related covariates (such as teacher characteristics)
are excluded from the models because they tend to be highly correlated with the Quintile
variables and their inclusion therefore removes explanatory power from them. Specifications
(1) and (2) are the same except for the focus on class size in the former (but PTR is controlled
for) and PTR in the latter (but class size is controlled for). The idea that a high mean class
size of a school may be the result of a large number of learners relative to teachers serves as
the motivation behind the substitution of class size for PTR in specification (2). Given this
paper’s focus on how the relationship between learner outcomes and class size (or PTR) may
depend on school SES, the coe�cients of interest are �4 and �5. Relating to the interaction
11A Dinaledi school is one which receives financial and other assistance from government subject to certaincriteria being met. The intension of the policy is to increase participation and performance in mathematicsand physical sciences in historically disadvantaged schools.
12It should be noted that, despite their inclusion, the estimates do not di↵er significantly if these FE areexcluded from any of the models.
16

terms, these coe�cients indicate how the conditional correlation between class size (or PTR)
and learner outcomes may depend on whether a school is a Quintile 4 or 5 school. Schools
in Quintiles 1 to 3 serve as the base variable in this regard, given that it was observed in the
previous section that several characteristics of these schools do not di↵er significantly from
one another. The results of these models are presented and discussed in the next section.
4 Model estimates
Table 3 presents the estimates of the models as per the aforementioned specifications. Mod-
els (1) to (5) are based o↵ specification (1). Model (1) - the simplest model - highlights a
negative unconditional correlation between mean class size and NSC pass rates of schools,
significant at the 1% level. However, once controls for school quintiles and their interac-
tions with class size are included in model (2), the significance of this estimate disappears
completely and its magnitude tends towards zero. The average Quintile 4 school is asso-
ciated with a 33.5 percentage point higher NSC pass rate relative to poorer schools, while
the coe�cient for the average Quintile 5 school is nearly double that of Quintile 4 schools
in magnitude (63.2) - both of which are statistically significant. This relationship does not
change significantly once other covariates and district FE are controlled for in model (3).
In this model, the estimates of interest suggest that, although no evidence for an overall
class size e↵ect is found, higher mean class sizes in wealthier schools are negatively related
to the NSC pass rate.13 This indeed suggests that the relationship between class size and
learner outcomes depends on school SES. For the average Quintile 5 school, an increase in
the mean class size of 20 learners - roughly the di↵erence in mean class size between Quintile
1 and 5 schools - is associated with a nearly 15.5 percentage point reduction in the NSC pass
rate.14 A similar relationship exists for Quintile 4 schools, although the association is less
than half as large and statistically insignificant. This suggests that class size reductions may
only be beneficial once other aspects of school quality - such as those that relate to teachers
- are addressed. This is in contrast to Woessman and West (2006:726) who propose that
the benefits of class size reductions are only realised in countries where the capabilities of
teachers appears low. Although not the focus of this paper, also of interest is the significant,
positive estimates for the Dinaledi school binary variable in all models.
13Similar results hold when individual dummy variables for each school Quintile are included in the modelas opposed to the current specification (not shown here).
14The presence of an interaction term implies that the association between class size and the dependentvariable depends on two coe�cients: the coe�cient for class size alone, and the coe�cient for the relevantinteraction term. The association in Model (3) here is computed as follows: 0.014 + (-0.786) = -0.772.Therefore, an increase in the class size of 20 learners implies a 20 x (-0.772) = 15.44 reduction in a school’sNSC pass rate, on average.
17

Models (4) and (5) show that a similar relationship between class size and learner out-
comes for wealthier schools holds for alternative outcome variables. In both models, the
magnitude of the coe�cient of the interaction term is not substantially di↵erent for Quintile
4 schools (but it is now statistically significant). For Quintile 5 schools, an increase in the
mean class size of 20 learners is associated with a 35.3 percentage point reduction in the
Bachelor pass rate - a magnitude double the size of that for the NSC pass rate. Consid-
ering Model (5), an increase in the mean class size of 20 learners is associated with a 4.7
and 11.0 percentage point reduction in the mean mathematics mark for Quintile 4 and 5
schools respectively. Additionally, the coe�cient for class size (irrespective of school quintile)
is significant for both the Bachelor’s pass rate and mean mathematics examination mark.
Importantly, the signs of these isolated class size estimates are positive, but very small in
magnitude and their possible causal e↵ect is thus likely to be negligible.. Turning our atten-
tion to PTRs, Models (6) to (8) are based on specification (2) and are suggestive of similar
conclusions as the preceding models. Unsurprisingly, the average Quintile 4 and 5 schools are
associated with having higher mean mathematics marks and NSC and Bachelor’s pass rates.
The estimates of interest have the same sign (negative) to those when class size is used;
however, the magnitudes are much larger. For the average Quintile 5 school, an increase in
the PTR of 10 learners per educator is associated with a 9, 20, and 8 percentage point reduc-
tion in the NSC pass rate, Bachelor’s pass rate, and mean mathematics mark respectively.
Similarly, the equivalent for the average Quintile 4 school is about a 9-13 percentage point
reduction. Although the estimates for wealthier schools are considerably larger, the overall
PTR estimate (irrespective of quintile) is significant and positively associated with all three
outcome variables. Finally, it should also be noted that the included covariates in models
(3) to (8) explain more than 50% of variation in the outcome variables.
Considering the previously observed bimodality in the South African education system
- a characteristic well-documented in the literature -, it is useful to analyse the relationship
between class size and school-level learner outcomes in a bimodal manner. More specifically,
it is useful to re-estimate the above regressions for distinct sub-samples of schools. Tables
4 and 5 present the class size and PTR estimates of specifications 1 and 2 for various
outcome variables and sub-samples. For brevity, each table presents only the estimates of
the variable of interest (mean class size or PTR) with their standard errors as well as each
model’s coe�cient of determination, while all other coe�cients are suppressed. Table 4 shows
that although class size is significantly and negatively associated with a school’s NSC pass
rate in general, disaggregation allows one to see that this association is driven by wealthier
18

Tab
le3:
OLSregression
sestimates
ofspecification
s1an
d2forseveralou
tcom
evariab
les.
Author’sow
ncalculation
s.Sou
rce:
2017/18SMSan
dexternal
NSC
data.
Depen
dentvariable:
NSC
passrate
Bachelor
Meanmaths
NSC
pass
Bachelor
Meanmaths
passrate
mark
rate
passrate
mark
(1)
(2)
(3)
(4)
(5)
(6)
(7)
(8)
Meanclasssize
-0.247
***
-0.035
0.01
40.05
0**
0.07
5***
(0.051
)(0.046
)(0.044
)(0.023
)(0.026
)Schoo
lqu
intile
433
.532
***
29.201
***
23.314
**23
.142
***
55.498
***
51.142
***
49.178
***
(10.33
0)(11.03
7)(10.06
4)(6.856
)(13.62
0)(13.75
7)(7.459
)Schoo
lqu
intile
563
.194
***
57.551
***
98.999
***
43.921
***
61.940
***
86.177
***
55.803
***
(6.322
)(7.103
)(10.72
1)(6.608
)(7.438
)(8.955
)(5.374
)Schoo
lqu
intile
4⇥
meanclasssize
-0.379
-0.347
-0.331
*-0.309
**(0.234
)(0.223
)(0.187
)(0.135
)Schoo
lqu
intile
5⇥
meanclasssize
-0.898
***
-0.786
***
-1.816
***
-0.624
***
(0.163
)(0.184
)(0.289
)(0.187
)Pupil-teacher
ratio(P
TR)
0.47
5***
0.34
4***
0.61
8***
(0.181
)(0.098
)(0.096
)Schoo
lqu
intile
4⇥
PTR
-1.576
***
-1.631
***
-1.512
***
(0.473
)(0.471
)(0.267
)Schoo
lqu
intile
5⇥
PTR
-1.370
***
-2.316
***
-1.440
***
(0.296
)(0.395
)(0.236
)Con
trols
NN
YY
YY
YY
DistrictFE
NN
YY
YY
YY
Con
stan
t75
.233
***
57.939
***
58.851
***
19.499
22.727
***
46.692
***
14.288
8.79
8(2.903
)(2.849
)(8.613
)(13.67
5)(7.345
)(10.67
9)(16.06
2)(9.129
)
R2
0.05
60.28
90.50
50.55
20.50
50.51
90.55
20.54
6N
475
9475
9475
9475
9475
9475
9475
9475
9
19
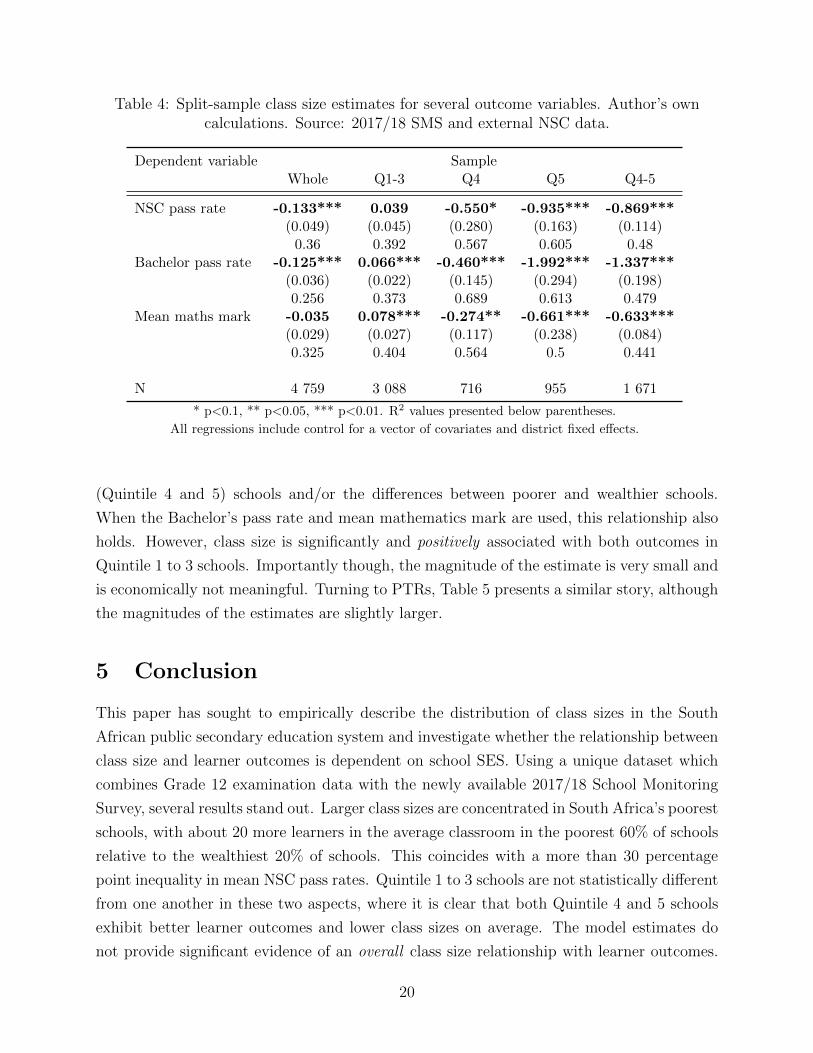
Table 4: Split-sample class size estimates for several outcome variables. Author’s owncalculations. Source: 2017/18 SMS and external NSC data.
Dependent variable SampleWhole Q1-3 Q4 Q5 Q4-5
NSC pass rate -0.133*** 0.039 -0.550* -0.935*** -0.869***(0.049) (0.045) (0.280) (0.163) (0.114)0.36 0.392 0.567 0.605 0.48
Bachelor pass rate -0.125*** 0.066*** -0.460*** -1.992*** -1.337***(0.036) (0.022) (0.145) (0.294) (0.198)0.256 0.373 0.689 0.613 0.479
Mean maths mark -0.035 0.078*** -0.274** -0.661*** -0.633***(0.029) (0.027) (0.117) (0.238) (0.084)0.325 0.404 0.564 0.5 0.441
N 4 759 3 088 716 955 1 671
* p<0.1, ** p<0.05, *** p<0.01. R2 values presented below parentheses.
All regressions include control for a vector of covariates and district fixed e↵ects.
(Quintile 4 and 5) schools and/or the di↵erences between poorer and wealthier schools.
When the Bachelor’s pass rate and mean mathematics mark are used, this relationship also
holds. However, class size is significantly and positively associated with both outcomes in
Quintile 1 to 3 schools. Importantly though, the magnitude of the estimate is very small and
is economically not meaningful. Turning to PTRs, Table 5 presents a similar story, although
the magnitudes of the estimates are slightly larger.
5 Conclusion
This paper has sought to empirically describe the distribution of class sizes in the South
African public secondary education system and investigate whether the relationship between
class size and learner outcomes is dependent on school SES. Using a unique dataset which
combines Grade 12 examination data with the newly available 2017/18 School Monitoring
Survey, several results stand out. Larger class sizes are concentrated in South Africa’s poorest
schools, with about 20 more learners in the average classroom in the poorest 60% of schools
relative to the wealthiest 20% of schools. This coincides with a more than 30 percentage
point inequality in mean NSC pass rates. Quintile 1 to 3 schools are not statistically di↵erent
from one another in these two aspects, where it is clear that both Quintile 4 and 5 schools
exhibit better learner outcomes and lower class sizes on average. The model estimates do
not provide significant evidence of an overall class size relationship with learner outcomes.
20
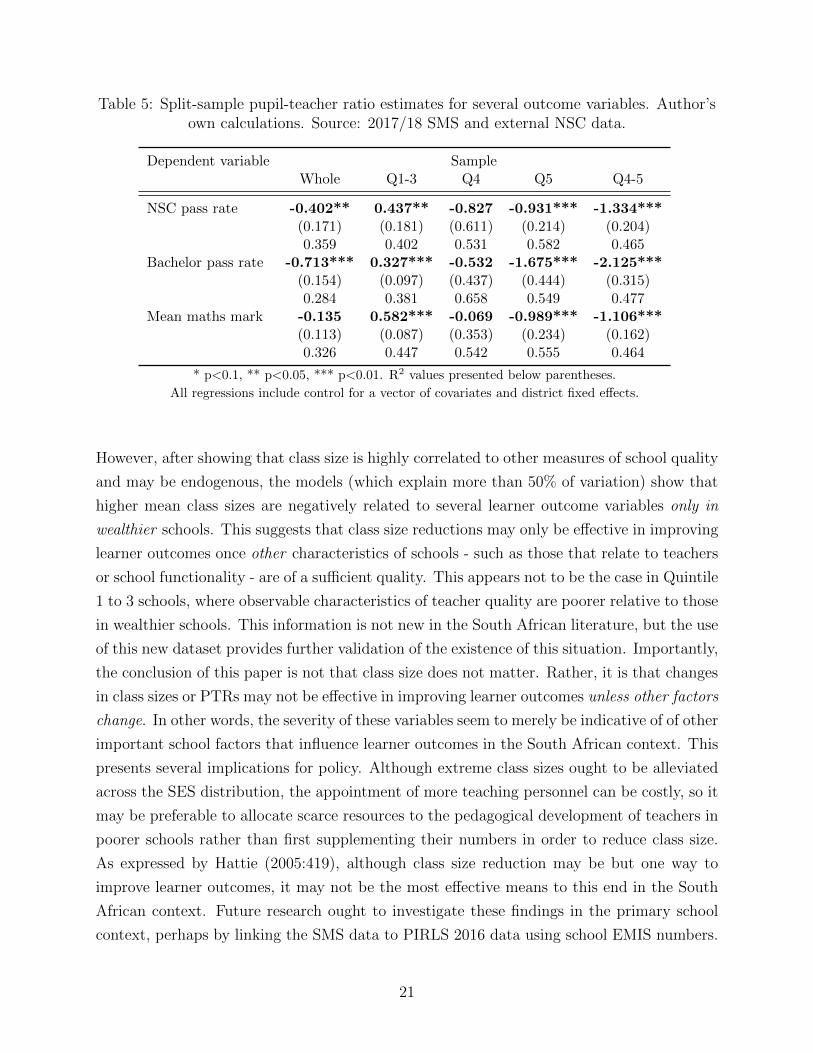
Table 5: Split-sample pupil-teacher ratio estimates for several outcome variables. Author’sown calculations. Source: 2017/18 SMS and external NSC data.
Dependent variable SampleWhole Q1-3 Q4 Q5 Q4-5
NSC pass rate -0.402** 0.437** -0.827 -0.931*** -1.334***(0.171) (0.181) (0.611) (0.214) (0.204)0.359 0.402 0.531 0.582 0.465
Bachelor pass rate -0.713*** 0.327*** -0.532 -1.675*** -2.125***(0.154) (0.097) (0.437) (0.444) (0.315)0.284 0.381 0.658 0.549 0.477
Mean maths mark -0.135 0.582*** -0.069 -0.989*** -1.106***(0.113) (0.087) (0.353) (0.234) (0.162)0.326 0.447 0.542 0.555 0.464
* p<0.1, ** p<0.05, *** p<0.01. R2 values presented below parentheses.
All regressions include control for a vector of covariates and district fixed e↵ects.
However, after showing that class size is highly correlated to other measures of school quality
and may be endogenous, the models (which explain more than 50% of variation) show that
higher mean class sizes are negatively related to several learner outcome variables only in
wealthier schools. This suggests that class size reductions may only be e↵ective in improving
learner outcomes once other characteristics of schools - such as those that relate to teachers
or school functionality - are of a su�cient quality. This appears not to be the case in Quintile
1 to 3 schools, where observable characteristics of teacher quality are poorer relative to those
in wealthier schools. This information is not new in the South African literature, but the use
of this new dataset provides further validation of the existence of this situation. Importantly,
the conclusion of this paper is not that class size does not matter. Rather, it is that changes
in class sizes or PTRs may not be e↵ective in improving learner outcomes unless other factors
change. In other words, the severity of these variables seem to merely be indicative of of other
important school factors that influence learner outcomes in the South African context. This
presents several implications for policy. Although extreme class sizes ought to be alleviated
across the SES distribution, the appointment of more teaching personnel can be costly, so it
may be preferable to allocate scarce resources to the pedagogical development of teachers in
poorer schools rather than first supplementing their numbers in order to reduce class size.
As expressed by Hattie (2005:419), although class size reduction may be but one way to
improve learner outcomes, it may not be the most e↵ective means to this end in the South
African context. Future research ought to investigate these findings in the primary school
context, perhaps by linking the SMS data to PIRLS 2016 data using school EMIS numbers.
21

References
Altinok, N. and Kingdon, G. New Evidence on Class Size E↵ects: A Pupil Fixed E↵ects
Approach.Oxford Bulletin of Economics and Statistics, 74(2): 203-234.
Angrist, N. and Lavy, V. Using Maimonides’ Rule to Estimate the E↵ect of Class Size on
Scholastic Achievement. The Quarterly Journal of Economics, 114(2): 533-575.
Case, A. and Deaton, A. 1999. School inputs and educational outcomes in South Africa.
The Quarterly Journal of Economics, 114(3): 1047-1084.
Chingos, M. M. 2013. Class size and student outcomes: Research and policy implications.
Journal of Policy Analysis and Management, 32(2): 411-438.
Gustafsson, M. and Mabogoane, T. 2012. South Africa’s economics of education: A stock-
taking and an agenda for the way forward. Development Southern Africa, 29(3): 351-364.
Hanushek, E. A.1986. The economics of schooling: production and e�ciency in public
schools. Journal of Economic Literature, 24(September): 1141-1177.
Hanushek, E. A. 1989. Expenditures, e�ciency, and equity role. American Economic Re-
view, 79(2): 46-51.
Hanushek, E. A. 1996. A more complete picture of school resource policies. Review of
Educational Research, 66: 397-409.
Hanushek, E. A. 1997. Assessing the e↵ects of school resources on student performance: an
update. Educational Evaluation and Policy Analysis, 19(2): 141-164.
Hanushek, E. A. 1998. The evidence on class size. Occasional Paper No. 98-1. class size. W.
Allen Wallis Institute of Political Economy, University of Rochester, Rochester, NY.
Hattie, J. 2005. The paradox of reducing class size and improving learning outcomes. In-
ternational Journal of Educational Research, 43(2005): 387–425.
Howie, S. J. 2005. Contextual Factors at the School and Classroom Level Related to Pupils’
Performance in Mathematics in South Africa. Educational Research and Evaluation, 11(2):
123-140.
Juan, A. and Visser, M. 2017. Home and school environmental determinants of science
achievement of South African students. South African Journal of Economics, 37(1): 1-10.
22

Krueger, A. B. 2003. Economic considerations and class size. The Economic Journal,
113(485): F34-F63.
Li, W. and Konstantopoulos, S. 2016. Class Size E↵ects on Fourth-Grade Mathematics
Achievement: Evidence From TIMSS 2011. Journal of Research on Educational E↵ective-
ness, 9(4): 503-530.
Norris, E. 2012. Solving the maths problem: international perspectives on mathematics
education. Royal Society for the encouragement of Arts, Manufactures and Commerce.
Pedder, D. 2006 Are small classes better? Understanding relationships between class size,
classroom processes and pupils’ learning. Oxford Review of Education, 32(2): 213-234.
Rivkin, S. G., Hanushek, E. A., and Kain, J. F. 2005. Teachers, schools, and academic
achievement. Econometrica, 73(2): 417–458.
Shepherd, D. 2015. Learn to teach, teach to learn: A within-pupil across-subject approach to
estimating the impact of teacher subject knowledge on South African grade 6 performance.
Stellenbosch Economic Working Paper Series. No. 01/15.
Spaull, N. 2013. Poverty & privilege: Primary school inequality in South Africa. Interna-
tional Journal of Educational Development, 33: 436–447.
Spaull, N. 2016. Excessive class sizes in the Foundation Phase. Policy Brief, Research on
Socio-Economic Policy, Department of Economics, Stellenbosch University.
Taylor, S. and Yu, D. 2009. The importance of socio-economic status in determining edu-
cational achievement in South Africa. Stellenbosch Economic Working Paper. No. 01/09.
Department of Economics, Stellenbosch University.
Van der Berg, S., Spaull, N., Wills, G., Gustafsson, M. and Kotze, J. 2016. Identifying
Binding Constraints in Education. Synthesis report for the Programme to Support Pro-
Poor Policy Development (PSPPD). Research on Socio-Economic Policy, Department of
Economics, Stellenbosch University.
Visser, M., Juan, A. and Feza, N. 2015. Home and school resources as predictors of math-
ematics performance in South Africa. South African Journal of Education, 35(1): 1-10.
Woessmann, L. and West, M.R. 2002. Class-size e↵ects in school systems around the world:
Evidence from between-grade variation in TIMSS. IZA Discussion Paper No. 485, Harvard
University, Program on Education Policy and Governance.
23
6 Appendix
Figure A1: Linear plot of the Grade 12 Bachelor pass rate and mean class size of thesampled schools. Source: 2017/18 SMS and external NSC data.
Figure A2: Linear plot of given school’s mean Grade 12 mathematics examination marksand mean class size. Source: 2017/18 SMS and external NSC data.
24