Embed Size (px)
Citation preview

Document of The World Bank
Report No: 73484-TP
Timor-Leste Social Assistance
Public Expenditure and Program Performance Report
June 24, 2013
Social Protection and Labor Human Development Sector Unit East Asia and Pacific Region
Pub
lic D
iscl
osur
e A
utho
rized
Pub
lic D
iscl
osur
e A
utho
rized
Pub
lic D
iscl
osur
e A
utho
rized
Pub
lic D
iscl
osur
e A
utho
rized
Pub
lic D
iscl
osur
e A
utho
rized
Pub
lic D
iscl
osur
e A
utho
rized
Pub
lic D
iscl
osur
e A
utho
rized
Pub
lic D
iscl
osur
e A
utho
rized

ACRONYMS AND ABBREVIATIONS BFP Bolsa Família Program BdM Bolsa da Mãe BMI Body Mass Index CCT Conditional Cash Transfer CPI Consumer Price Index DHS Demographic and Health Survey DNAS National Directorate for Social Assistance EAP East Asia and Pacific EGMA Early Grade Mathematics Assessment EGRA Early Grade Reading Assessment ESI Estimated Sustainable Income FAO Food and Agriculture Organization GDP Gross Domestic Product GNI Gross National Income GER Gross Enrollment Rate HIES Household Income and Expenditure Survey IDP Internally Displaced Persons IMF International Monetary Fund ILO International Labor Organization IVA Industry Value Added MIS Management Information System MTCI Ministry of Tourism, Commerce and Industry MoE Ministry of Education MoF Ministry of Finance MSS Ministry of Social Solidarity LFS Labor Force Survey LFPR Labor force participation rate NDP National Development Plan OECD Organization for Economic Cooperation and Development PF Petroleum Fund PMT Proxy Means Test PREM Poverty Reduction and Economic Management SA Social Assistance SEFOPE Secretary of State for Vocational Training and Employment SP Social Protection STAE Technical Secretariat for Electoral Administration TFR Total Fertility Rate TLSPS Timor-Leste Social Protection Survey TLSS Timor-Leste Living Standards Survey USAID United States Agency for International Development UN United Nations UNMIT United Nations Integrated Mission in Timor-Leste UNTAET United Nations Transitional Administration in East Timor USD United States Dollar

Regional Vice President: Axel van Trotsenburg
Country Director: Franz Drees-Gross
Sector Director: Xiaoqing Yu
Country Manager: Luis Constantino Sector Manager Jehan Arulpragasam
Task Team Leader: Nithin Umapathi

Table of Contents
Executive Summary ....................................................................................................................................... 1
Chapter 1: Context, Purpose and Conceptual Framework ........................................................................... 9
A. Context .............................................................................................................................................. 9
B. Purpose, Scope and Coverage of the Report .................................................................................. 10
C. Conceptual Framework ................................................................................................................... 11
Chapter 2: Risks and Vulnerability in the Bottom 40% ............................................................................... 15
A. Characteristics of Timor-Leste’s Poorest Households .................................................................... 15
B. Vulnerability and Risk Characteristics ............................................................................................. 18
Chapter 3: Origins and evolution of Social Assistance in Timor-Leste ........................................................ 24
A. Evolution of safety nets in Timor-Leste .......................................................................................... 24
B. Post-crisis changes in social assistance ........................................................................................... 26
C. The next generation of programs ................................................................................................... 30
Chapter 4: Social assistance sector expenditure review ............................................................................ 31
A. Introduction .................................................................................................................................... 31
B. Macroeconomic Background .......................................................................................................... 31
C. Levels and trends in aggregate public expenditures on social assistance ...................................... 34
D. Expenditure trends within social assistance sector ........................................................................ 41
E. Social Assistance Expenditures: Looking Forward .......................................................................... 44
Chapter 5: Assessing performance of individual programs ........................................................................ 46
A. Targeting Performance ................................................................................................................... 46
B. Equity .............................................................................................................................................. 50
C. Generosity ....................................................................................................................................... 53
Chapter 6: Welfare impacts of social assistance in Timor-Leste ................................................................ 56
A. National estimates of social assistance welfare impact ................................................................. 56
B. Impact on beneficiaries ................................................................................................................... 61
Chapter 7: Administration and implementation of programs .................................................................... 62
A. Administrative Responsibilities ....................................................................................................... 62
B. Identifying Beneficiaries: Distinguishing Beneficiaries from Non-Beneficiaries ............................. 64

2 | P a g e
C. Identifying Beneficiaries: Eligibility and Targeting .......................................................................... 65
D. Identifying Beneficiaries: Registration ............................................................................................ 66
E. Accessing Benefits: Communicating with Beneficiaries ................................................................. 69
F. Accessing Benefits: Payment Procedures ....................................................................................... 71
G. Making Appeals and Addressing Disputes ...................................................................................... 72
H. Managing, Monitoring and Evaluating Implementation ................................................................. 73
Chapter 8: Policy consideration for improving social assistance in Timor-Leste. ....................................... 74
Bibliography ................................................................................................................................................ 79
Annex 1: Summary of Non-MSS Social Assistance Programs ..................................................................... 82
Boxes
Box 1: An anti-poverty social assistance system in Brazil ........................................................................... 13
Box 2: A Focus on the Bottom 40% ............................................................................................................. 15
Box 3: Vulnerability and the Role of Familial Support ................................................................................ 25
Box 4: Changes to Bolsa da Mãe Eligibility Criteria .................................................................................... 28
Box 5: Measuring Economic Activity and Growth in Timor-Leste .............................................................. 32
Box 6: The Budget Preparation Process ...................................................................................................... 35
Box 7: The Timor-Leste Social Protection Survey (TLSPS) ........................................................................... 46
Box 8: Community Views on “Entitlement” to Transfers............................................................................ 72
Tables
Table 1: Trends in shocks 2006-2010 as reported by households .............................................................. 19
Table 2: Share of households reporting welfare loss, by type of shock (in %) ........................................... 22
Table 3: Share of households reporting ex-post coping strategies (in %) .................................................. 22
Table 4: Major features of the Elderly, Disability, and Bolsa da Mãe Programs ........................................ 27
Table 5: Veteran Payment Categories and Amounts (monthly) ................................................................. 28
Table 6: Budget for Social Assistance by Program ...................................................................................... 42
Table 7: Direct numbers of beneficiaries according to administrative records for the main programs .... 47
Table 8: Targeting of Elderly Pension ......................................................................................................... 49
Table 9: Targeting of Disability Pension ...................................................................................................... 49

3 | P a g e
Table 10: Share of people covered by each program by consumption group (Direct and indirect
beneficiaries) .............................................................................................................................................. 50
Table 11: How well off are the beneficiaries? - Proportion of recipients within expenditure quintiles (%)
.................................................................................................................................................................... 51
Table 12: Primary use of social assistance benefits as reported by households (in percent) .................... 55
Table 13: Impact of programs on population below the 40% consumption line (national population) .... 57
Table 14: Simulated potential welfare impact of program targeted to the poorest households .............. 58
Table 15: Simulated minimum cost of program targeted to the poorest households using a simple proxy
score for wealth status ............................................................................................................................... 58
Table 16: Impact on recipients.................................................................................................................... 61
Table 17: Documentation required at registration ..................................................................................... 66
Table 18: Most significant difficulty when applying for benefits (in % of recipients) ................................ 67
Table 19: Travel time to reach payment location (in % of recipients) ........................................................ 72
Table 20: Simulated minimum cost of a program targeted to the poorest households ............................ 75
Figures
Figure 1 A&B: Headcount rate and distribution of poorest households by household size (A), and by
number of children (B) ................................................................................................................................ 17
Figure 2: Age-Gender Pyramid, headcount and share of total population in poorest 40% ....................... 18
Figure 3: Percentage of households reporting shocks since 2010 by type and location ............................ 21
Figure 4: Trends in Government Budget, Non-oil GDP, and ESI + Domestic Revenue ............................... 33
Figure 5: Trends in monthly CPI and Recurrent as well as Total Expenditure ............................................ 33
Figure 6: Association between CPI and recurrent Expenditure .................................................................. 34
Figure 7: Social assistance spending in absolute values ............................................................................ 36
Figure 8: Social assistance spending as a share of ESI + Domestic Revenue ............................................. 36
Figure 9: Public spending on Social Assistance as a share of national budget ........................................... 37
Figure 10: Spending by different sectors as a share of national Budget 2012 ........................................... 37
Figure 11: Social Assistance Expenditure by Intervention Type ................................................................. 38
Figure 12: Social Assistance Intervention Type as a % of Budget ............................................................... 38
Figure 13: Total Social Assistance Expenditure as % of (non-oil) GDP ........................................................ 40
Figure 14: Social Assistance spending as a share of national budget across the Region ........................... 41
Figure 15: Absolute trends in largest Social Assistance Programs ............................................................. 42

4 | P a g e
Figure 16: Percentage of population affected by different programs ........................................................ 47
Figure 17: Percent of Beneficiaries in the poorest 20 percent ................................................................... 52
Figure 18: Pro-old or Pro-poor? - The relative reach of transfers (ratio of % 60+ to % poor reached by
transfers) ..................................................................................................................................................... 53
Figure 19: Generosity of social assistance .................................................................................................. 54
Figure 20: Relative size of annual benefits of the main cash transfer programs ....................................... 55
Figure 21: Proportion of poorest covered by different cash transfer programs ........................................ 60
Figure 22: Inter-ministerial Roles in MSS Social Assistance ........................................................................ 63
Figure 23: Who invited eligible household member to apply to Elderly Pension? ..................................... 64
Figure 24: Unexplained increase in elderly population between 2004 and 2010 ...................................... 68
Figure 25: Source of Information on Health and MSS Programs ................................................................ 70

i
ACKNOWLEDGEMENTS
This report is an outcome of a programmatic non-lending technical assistance to Timor-Leste’s
Ministry of Finance and Ministry of Social Solidarity.
The report was prepared by a team led by Nithin Umapathi (Economist, EASHS) and including
Pamela Dale (Social Protection Specialist, EASHS) and Lena Lepuschuetz (Junior Professional
Associate, EASHS). In large part the report benefited from the richness of evidence that resulted
from a year-long collaboration with the Ministry of Finance (particularly the Directorates General
for Statistics and State Finance) and Ministry of Social Solidarity, as well as interviews with the sub-
national implementation officers, community members and beneficiaries.
The authors would like to gratefully acknowledge the funding for the national household survey
from EAP PREM group, and especially thank Vivek Suri (Lead Economist, EASPR) and Habib Rab
(Senior Economist, EASPV) for their support. The team would like to thank Zurab Sajaia (DECCT)
for his technical support and guidance in implementing policy simulations. Further, the team is
grateful to Hans Anand Beck (Senior Economist, EASPR) and Martin Cumpa (Consultant, EASPR) for
providing the household expenditure aggregates and David Hook (Governance Specialist, EASPR)
for helpful discussions. The study benefited from extensive comments from Rita Fernandes
(Consultant, EASHS), Junko Onishi (M&E Specialist, EASHS), Truman Packard (Pacific CSC, EASHS),
Ruslan Yemtsov (Lead Economist, HDNSP) and Habib Rab (Senior Economist, EASPV), who peer-
reviewed the report. The team would like to take this opportunity to thank Jehan Arulpragasam
(Sector Manager, EAP Social Protection), Luis Constantino (Country Manager, Timor-Leste), Philip
O’Keefe (HD Lead Economist, EASHD), Truman Packard (Pacific Country Sector Coordinator) and
Xiaoqing Yu (Sector Director, EASHD) for their leadership and support during various stages of this
work. We are grateful to Malathi Velamuri (Consultant, EASHS) for proof-reading and Maya Razat
(Program Assistant, EASHD) for formatting the report.
The findings, interpretations, and conclusions expressed herein do not necessarily reflect the views
of the Board of Executive Directors of the World Bank or the Governments they represent.

1 | P a g e
Executive Summary
Following the 2006 crisis, the Government of Timor-Leste embarked on an ambitious expansion of
social assistance programs. A series of cash transfer programs was launched beginning of 2007,
including pensions for the veterans, elderly and disabled and a conditional cash transfer program
directed at female-headed households who send their children to school. The current mix of programs
reflects the multiple goals for social assistance in the aftermath of the crisis, and was central to
economic recovery, establishing security and building public trust in the government.
Social assistance expenditures expanded rapidly, resulting in a formal safety net and associated public
expenditure that extend beyond those usually found in low-income countries.1 Timor-Leste spends
around 15 percent of non-oil GDP, or 20 percent of the combined Estimated Sustainable Income (ESI) of
the Petroleum Fund and domestic revenues, on social programs and veteran payments, more than it
devotes to health, education or any other sector apart from infrastructure. Even when excluding veteran
payments, at 7 percent of non-oil GDP it is still one of the highest budget outlay ratios in the world,
surpassing that of nations with similar population size, poverty headcount, level of mineral resource
wealth and fragile state status. The large and growing budget for social assistance has been supported
by growing fiscal space from oil-fund revenues. More recently, however, the expenditure is increasingly
relying on spending in excess of the estimated sustainable income of the Petroleum Fund.
Since 2008, the government has chosen to take withdrawals in excess of the ESI from the Petroleum
Fund to support high levels of capital expenditures. This makes sense to the extent that developing
highly-needed infrastructure for the non-oil economy provides a higher return on the investment than
interest rates on the Petroleum Fund. However, arguably not all withdrawals in excess of ESI have been
invested productively. If this pattern of high excess withdrawals continues, if economic growth remains
below expectations, and if domestic revenue stays constant as a percentage of GDP, it is likely the
Petroleum Fund will be exhausted by 2026 (Ministry of Finance, 2011). Dramatic increases in public
expenditure have contributed to the steadily increasing inflation in Timor-Leste, which reached 17.7
percent in January of 2012. Inflation in the price of certain goods, in particular food, disproportionately
affects those in the poorest population who are not reached by any social assistance.
Though there is doubtless need for substantial social assistance investment to address high rates of
poverty, the current level of spending raises questions about long-term fiscal sustainability and
effectiveness in providing poverty protection.2 The current mix of social assistance programs were put
in place without consideration of a hard budget constraint or an overarching social assistance policy
vision. While this has allowed for wide political support, rapid response to emerging needs, and
experimentation, this comes with the risk of entrenching entitlements that will become increasingly
1 Timor-Leste was categorized as a low-income country until 2011. As a result of sharp increases in oil prices, it is
now categorized as a lower middle income country. 2 On January 11
th, 2012 Taur Matan Ruak, the Timor-Leste president delivered a speech to all staff at the
Presidential Palace indicative of the shift in objectives looking forward. “Timor-Leste has had stability and United Nations Mission has ended in the country, meaning totally we have led our own country, therefore, even though as leaders we face obstacles, we have to work hard to take people out of poverty,” he said.

2 | P a g e
difficult to meet. As the budget envelope for social assistance begins to decline due to the need to
shrink recurrent expenditure, there is a risk that the significant proportion of the budget devoted to
protection of special groups may limit the budget available for poverty reduction. In preparing for a
likely stagnation in budget growth over the next five years, the government will need to prioritize
among social assistance goals, and between social assistance and other national objectives.
There is an important role for social safety nets in Timor-Leste to help poor households move out of
the inter-generational poverty trap. Poverty, hunger and child malnutrition remain principal
developmental issues. According to the Global Hunger Index, which measures national hunger as a
percent of the population, Timor-Leste ranked 75th among the 81 countries surveyed (IFPRI, 2011). The
scale and character of poverty in Timor-Leste is associated with diverse and deep vulnerabilities for
much of the population. The 0-5 year-old group of children confronts major risks which impair their
development and contributes to a cycle of inter-generational poverty traps. Child growth stunting for
this age group, a widely regarded composite proxy of lifetime income and productivity, is one of the
highest levels in the world at around 58 percent (DHS, 2010). It takes a child on average nearly 12 years
to finish primary education, and children do not appear to gain the most fundamental skills in the first
few years in school.
Social safety nets can also play a role in reducing vulnerability to the most significant risks to well-
being. When households are not resilient to endure shocks, coping with their consequences might
become progressively more difficult, especially if coping strategies entail asset depletion and
undercutting human capital investments. The sensitivity of poverty measures highlights a series of
important risks resulting from (i) natural disasters, (ii) economic disturbances in employment, income
and prices, and (iii) household specific shocks like disability and illnesses. Nationally, almost all Timorese
households report experiencing at least one type of shock from 2010 to 2011, with 93 percent of
households having suffered from more than one type of shock (TLSPS, 2011). The majority of these
households report having suffered welfare loss and reacting through the sale of productive assets like
livestock or premature disposal of harvest. All this underscores the importance of effective safety nets
to prevent households from falling into a poverty trap. Notwithstanding expansive Government
spending on cash transfers, the report highlights the limited role of publicly-provided assistance as a risk
coping mechanism, in particular when households have to face health and life-cycle shocks. The share of
households relying on informal coping strategies far outweighs that of households relying on assistance
from Government or non-government organizations (NGOs).
Welfare enhancement does not appear commensurate with the amount of resources spent on social
assistance.3 The report presents the first estimates of impact from the main cash transfer programs
using the World Bank implemented Timor-Leste Social Protection Survey (2011), though it recognizes
that poverty reduction was a secondary objective of many of the first generation of social protection
programs in Timor-Leste; the first concern was spending for stabilization. Analysis shows that in 2011,
social assistance spending prevented the percent of households with per capita monthly consumption of
3 There was no official poverty estimate for 2011 at the time of report preparation.

3 | P a g e
US$ 32 or less from increasing from 40 to 45 percent4. This 5 percentage point reduction is almost
entirely due to the elderly pension program, which is the only program providing national-level welfare
improvement. Timor-Leste’s 5 percent reduction compares well to 3 percent in Philippines, 0.9 percent
in Malaysia, or 0.1 percent in Cambodia, but it was achieved at a disproportionately higher cost: 15
percent of non-oil GDP, compared to the approximate average of 1 percent of GDP spent in East Asia
and Pacific Region comparator countries. The US$ 112 million budgeted by the Timor-Leste government
on the main social transfer programs translates to an average cost of US$ 489 per year to bring a low-
income individual above the US$ 380 per capita yearly expenditure.
There are three primary explanations for the low levels of national welfare improvement from social
assistance. First, as chapter 4 demonstrates, 60 percent of the total social assistance budget is
consumed on veteran payments, which are high value benefits received by too few beneficiaries to
allow for any sizeable impact on the number of people living below US$ 32/month. The annual veterans’
benefit amount ranged from US$ 2,760 to US$ 9,000 per annum, and was distributed to 1 percent
(2011) of the population. The second biggest program, pensions for the elderly and people with
disabilities, consumed 20 percent of the total social assistance budget. While the elderly benefits have
successfully reduced the number of people living below US$ 32/month among the elderly, the younger
population remains largely outside the reach of social assistance. Among the remaining programs, the
Bolsa da Mãe CCT program consumed 1.6 percent of the budget and achieved negligible reduction in
the number of people living below this level. The second reason for the low impact of social assistance is
that although categorical targeting aimed at the veterans, elderly, disabled and families with children
overlaps with the poorest population, the current mix of cash transfer programs is not reaching a
significant proportion of the bottom 40 percent. 60 percent of the bottom two quintiles is not reached
by any of these programs. Finally, though Bolsa da Mãe has the potential for appreciable impact, it is
too small in coverage relative to the size of eligible population. The size of the Bolsa da Mãe benefit is
also too low to affect household welfare status. Chapter 2 shows that the proportion of the population
with larger numbers of children is over-represented in the bottom 40 percent. Analysis of generosity
also shows that in the case of Bolsa da Mãe the value of the benefit relative to the average household
expenditure is very low, representing 3 percent of the average household budget. This is smaller than
the international practice for CCT programs, which on average cover 10-15 percent of the total
expenditure.
Importantly, however, social assistance need not be the only, or even the main, instrument in the
multi-pronged strategy to improving household welfare. Especially in a context where a high
proportion of the population is living with limited access to economic and social opportunities,
addressing low incomes requires a broader approach that facilitates economic growth. It is unrealistic to
rely on cash transfer programs as the core strategy for economic development and poverty reduction in
Timor-Leste. This report should be seen in that broader context. While improving the efficiency and
4 The threshold of US$ 32 per person per month corresponds to the bottom 40 percent. The underlying indicator of
living standards is total per capita expenditure derived from total household expenditure4 reported in the most
recent Household Income and Expenditure Survey (HIES, 2011).

4 | P a g e
fiscal sustainability of social assistance and veteran payments, the government of Timor-Leste may
consider stressing other complementary developmental inputs such as education, health,
entrepreneurship, trade, and agriculture interventions.
Program Implementation
Despite a comparatively high level of social assistance spending, Timor-Leste has an underdeveloped
safety net system. Timor-Leste faces challenges typical of fragile and low-income countries in
administering and implementing social assistance programs. These challenges include, inter alia, the lack
of an overarching social assistance policy framework, administrative capacity constraints (civil service
capacity, interagency coordination), limited infrastructure (roads, communication networks, banking),
and management of information, all of which can undermine the effectiveness of social assistance
targeting, payment, monitoring and controls. Current administrative systems are not cost-effective, with
parallel systems duplicating tasks for each program. Moving to a systems approach would help
strengthen coordination and integration of the cash transfer programs. A review of the implementation
process identified the following areas in need of attention:
Identification – Accurately identifying and registering beneficiaries is a challenge in Timor-Leste. The
current practice includes use of birth certificates and national electoral cards, but these identity systems
are prone to error and have been subject to manipulation, and in some cases do not reach the full
beneficiary population. An on-going effort to issue a national identity card, which contains both personal
identifying information and biometric data, looks promising in terms of becoming Timor-Leste’s unique
identifier. However, the roll-out process for these identity cards has been slow, and the government will
face challenges in linking the national ID to current social assistance benefits.
Eligibility and Targeting - While the elderly and disability program is categorically targeted, Bolsa da
Mãe is poverty targeted, using a simple vulnerability scoring system, as well as subject to budget-
determined enrolment caps. This contributes to different levels of targeting complexity. In 2011/12 the
Bolsa da Mãe program, including the targeting system, was redesigned and the new targeting system
was rolled out for the 2013 payment year. The targeting system was not in place during the preparation
of this report; therefore, the report is inconclusive as to whether the new Bolsa da Mãe targeting
system is robust, efficient and cost-effective for a large scale-up of the program.
Payment transactions - Timor-Leste’s limited banking infrastructure inhibits efficient and secure
payment delivery. Payments are largely delivered under armed escort to each of 65 sub-districts on pre-
identified payment days. In some districts, bank payments through the National Commercial Bank of
Timor-Leste are being piloted, as is a “mobile banking” system using retrofitted vehicles. Regardless of
the payment mechanism, infrequent payment cycles impede consumption smoothing. More than half of
survey respondents reported that discovering the date and location of the payment was the most
significant problem faced to receive payments. For the elderly, access to the payment location was the
second most commonly reported difficulty; nearly one-third of elderly respondents reported a travel
time of over 90 minutes to reach the payment location. Identifying lower-cost and timely means of
payment delivery will continue to be a challenge and an area of priority for MSS.
5 | P a g e
Management Information, Monitoring and Evaluation - The Ministry of Social Solidarity has recognized
the need for enhanced information management and program monitoring, as program scope and
budgets grow. Since the rapid roll out of the cash transfer programs, implementation of these programs
was never viewed in the light of standardization or consolidation. A standardized Management
Information System covering five MSS programs (Bolsa da Mãe, elderly pension, disability pension,
disaster management, and Internally Displaced Persons) is currently under development through a
World Bank-financed project, the Social Protection Administration Project, funded by the Rapid Social
Response Multi-Donor Trust Fund, and is the first initiative within the Ministry to adopt a standardized,
integrated system for most cash transfer programs. The enhanced MIS system and database review are
expected to greatly improve MSS’s ability to implement core cash transfers transparently and efficiently,
rapidly identify and correct errors, and effectively monitor program implementation
Key recommendations
1. Address large exclusion of the poorest from main cash transfer programs by defining a national
social assistance framework and a roadmap for developing safety nets.
Around the world, social assistance plays an important role in helping poor households move out of
poverty. Poverty in Timor-Leste remains a key challenge which requires a rethink of national social
assistance policy. Development of an overarching national social assistance policy framework, with
appropriate and well-defined targets, would help the government to move towards a more effective
social assistance system. Such a policy framework would represent a national vision and provide guiding
principles on how to address specific vulnerabilities, and respond to shocks and extreme poverty. It
would also allow the Ministry for Social Solidarity to identify gaps in the current mix of social assistance
programs, reform or consolidate the existing programs to effectively prioritize among multiple social
assistance needs and plan for an appropriate budgetary and administrative commitment.
2. Implement a more effective anti-poverty policy by investing in a single program that targets the
poorest households and shares administrative sub-systems.
Bolsa da Mãe is a logical candidate for an integrated anti-poverty program, but requires development
and refinement of basic administrative systems needed for identification, enrollment, targeting,
monitoring and evaluation. It is important to note that among other things, re-design of Bolsa da Mãe
requires development of targeting tools such as a cost-effective assessment of household poverty,
additional MIS functionality, and design of an appropriate household-level structure of benefits. A major
advantage of building on the Bolsa da Mãe program is that it is the only program in the country that
plays a promotional role by aiming to build human capital through promotion of school attendance. If
designed appropriately, the same sub-systems currently used by the program can be harnessed to
expand its role to promote better health, nutrition, and skills development. The report provides a menu
of policy options that vary by cost of the program and benefit size for a prototypical program targeted to
the poorest households.

6 | P a g e
3. Move from fragmented implementation processes to a common administrative system.
A systems approach involves developing one core program management function under, for example,
the Bolsa da Mãe program, with other programs sharing the system. These functions may encompass
different program operational processes such as targeting, beneficiary registries, cash delivery
mechanisms, monitoring and reporting mechanisms, and evaluation of program effectiveness.
Linkages with the National ID system - Lack of standardized personal identifiers make
management of beneficiary databases problematic, as it is difficult to detect duplications of
registries and fragmented information on the same individuals. The government is currently
developing a unified national ID system under an initiative by the Ministry of Justice. Once the
system is established, linking the program beneficiary database with the National ID system will
open up a huge potential for the programs’ database management.
Targeting - An objective, transparent, accountable and affordable targeting system will allow the
government to effectively target programs at the eligible households, with admissible levels of
inclusion and exclusion errors. Although the initial cost for setting up the targeting system may be
relatively high, once an effective system is set up, it can be widely used by different programs,
including social assistance programs, scholarships, free or subsidized health care, and other social
protection programs, leading to a more coherent national social assistance policy.
Enrollment - Program enrollment could be conducted via a regular targeting survey or via ongoing
on-demand applications, in which potential beneficiaries visit the program office to file an
application form to be assessed for program eligibility. This process is already being implemented
at a small scale for Bolsa da Mãe, and through the village chiefs for the elderly and disability
programs. A unification of this application system as well as notification of the results of program
eligibility assessment could reduce the cost as well as improve transparency of the programs.
Beneficiary database - Through a standardized MIS, program beneficiary databases should be
migrated into a unified platform, allowing for database reviews to identify overlapping
beneficiaries. Updating the beneficiary data should also be a synchronized process, with changes in
status of eligibility, migration, death, and birth reflected for all program databases.
Payments - Given the poor availability of financial institutions, developing alternative cash
distribution mechanism may be a longer-term goal. Nevertheless, there are affordable
technological solutions that may be adopted such as the use of handheld devices at the cash
distribution point with an option of using biometrics for beneficiary identification, which will greatly
enhance the accountability of the current cash distribution. These systems can also be shared
among cash transfer programs to reduce duplication and improve efficiency.
Grievance redressal - Grievance redress systems that allow the public to file complaints through
phone calls, text messages, or other electronic means are not yet developed for any of the

7 | P a g e
programs. Grievance redress is an integral component of most cash transfer programs around the
world to ensure program accountability by listening to the voice of the beneficiaries and the public
at large. Once set up the system could be linked to the standardized MIS, ensuring that all programs
monitor the grievances filed and report any remedial actions taken.
Communication - Effective communication strategies and implementation of communication
activities to improve awareness of programs, their objectives, eligibility, and entitlements can
strengthen accountability and transparency of program implementation. Standardized
communication strategies and unified use of different media will ensure cost effectiveness as well
as consistent messaging.
Monitoring and Evaluation - Current reporting monitors the achievement of planned activities,
centering on the development of an Annual Action Plan and use of standardized forms. This system
could be strengthened to include program implementation, process monitoring, information on
whether benefits are reaching the intended beneficiaries or not, and a feedback mechanism.
Annual or biannual evaluation on the impact of these cash transfer programs could also inform
policy makers and program managers of the effectiveness of existing programs. More broadly, MSS
may consider moving towards an evidence-based approach to inform social protection policy and
to support the government in design and implementation of social protection programs. Such an
approach will require systematic efforts to generate quality data and knowledge.
4. Improve linkages between social assistance and human capital outcomes.
It is recommended that Ministry of Social Solidarity (MSS) adopts a clear promotional role for social
assistance as a key principle to guide its policy and performance evaluation. Timor-Leste faces huge
human capital challenges, including malnutrition rates that are among the highest in the world, low
educational attainment for children and youth, and high maternal and child mortality rates. These early
developmental barriers stifle well-being and limit the potential for productive capacity in the future. As
petroleum fund resources diminish in the coming years, investments made now to improve human
capital will determine the quality of labor force entrants in the future. Social assistance can play a
pivotal role in encouraging poor households to make investments in their children in the short-term that
will have high return on investment in the long-term, for individuals, households, and the economy.
Existing programs such as Bolsa da Mãe exemplify this type of promotional approach: the program aims
to provide resources to poor families contingent upon enrolling their children in schools and ensuring
they are fully vaccinated. However, prior to a significant scale up, Bolsa da Mãe requires further efforts
to improve the payment delivery mechanism, administrative efficiency, household co-responsibilities,
benefit levels, and smarter targeting of vulnerable groups. Overall, to achieve higher impact, the
program will require a higher budgetary allocation to cover a much greater share of eligible households.
To accelerate the growing human capital role of the current social assistance, the government may also
choose to expand the range of promotional programs for which it will need to establish clear human
capital objectives backed by simple, easily monitorable co-responsibilities that may be linked to key
policy priority areas. Examples of such co-responsibilities include school attendance, health center visits,

8 | P a g e
preventive check-ups, vaccinations, weight monitoring, education sessions, and positive behaviors for
improved child nutrition. Importantly, such incentives accorded by the MSS will require strong inter-
Ministerial effort related to supply of the relevant services. Greater promotional role of the social
assistance will not be fully effective without an adequate and accessible supply of public services.
5. Review financial sustainability and introduce cost control measures for veteran pension
expenditures.
The current levels of Government spending on cash transfers to veterans raise questions about long-
term fiscal sustainability. The expenditure review of public finances presents a soaring cost of veteran
cash transfers. The budget for these benefits increased from US$ 0.2 million to US$ 113.8 million in a
span of five years, resulting in a planned annual expenditure of ten percent of non-oil GDP in 2012, and
is expected to increase further.5 Cumulatively to date, over US$ 185 million has been disbursed in direct
cash transfers to veterans. The fiscal burden is growing rapidly from extremely high levels of per capita
benefit payments as well as a very large outstanding list of applications. Currently, 11,000 veterans are
receiving benefits, and in a country of one million people there are approximately 100,000 outstanding
applications. Even if a fraction of this pool is accepted, it would result in a large additional fiscal burden
as budget would have to be allocated to cover backdated payments. The scheme requires a review, and
a fiscal sustainability analysis to guide its design. As a general rule, any entitlement program is resistant
to sudden cut-backs, but changes are needed soon so they can be incremental and politically
acceptable. At the very minimum, the program requires reviewing the approach to survivors’ benefits,
and in future, any ad-hoc increases in benefit levels should be avoided by legislatively fixing the benefit
levels for an extended period of time.
5 Budget execution rates for veteran payments were substantially lower than expected in 2011, but were still
equivalent to 5 percent of non-oil GDP.

9 | P a g e
Chapter 1: Context, Purpose and Conceptual Framework
A. Context
The Democratic Republic of Timor-Leste is a young, post-conflict nation endowed with significant oil
revenues. In the aftermath of the 2006-07 social and political crisis characterized by outbreaks of
violence, an unstable political environment and a contracted economy, Timor-Leste emerged with a
renewed focus on provision of security, promotion of economic recovery, and restoration of institutions.
These efforts were funded largely by oil wealth; Timor-Leste is the second most oil-dependent economy
in the world after South Sudan, and revenues from oil production contribute 90 percent towards the
government's total budget. Excessive reliance on oil revenues means that Timor-Leste's current
development strategy is exposed to external factors.
While per capita GDP of around USD$ 4,048 in 2011 would classify the country as Lower Middle
Income, this figure does not reflect commensurate living standards. Non-oil GDP per capita of USD$
810 is more representative of the actual living standards, which places the country in the low-income
range but with a sovereign Petroleum Fund (PF) which has the potential to promote Timor-Leste out of
low-income status. The poverty rate, officially recorded at 49 percent (World Bank, 2008), remains very
high despite sustained double digit economic growth and substantial social assistance spending. Timor-
Leste’s level of human development has been ranked as low (134th out of 187 countries in 2012) by the
UNDP’s Human Development Index.
Timor-Leste has one of the highest birth rates in the world (2.41 percent population growth) with over
44 percent of the population below 15 years of age (Timor-Leste Census, 2010). As a result of the very
high share of the population below 15 years old and the low employment-population ratio, compared to
other East Asian and Pacific (EAP) countries, Timor-Leste has a high dependency ratio. There are 96
people outside the working-age range (below 15 and over 64) for every 100 people in the working-age
range. This implies a huge burden on the current working-age population, and places tremendous
pressure on social protection policies. The challenges of employing this rapidly expanding urbanizing
population are immense; over 470,000 individuals are likely to enter the labor market anytime over the
next 4 to 18 years. While this demographic dividend is expected to continue until 2030 (World Bank,
2012), representing a potentially huge window of opportunity for the country’s economic development,
it also remains a serious challenge in terms of building the requisite capacity to absorb all these future
workers into the job market.
Since the 2006 crisis, the Government of Timor-Leste has shown a clear commitment to social
assistance. A series of cash transfer programs was launched at the beginning of 2007, including pensions
for the veterans, elderly and disabled, and a conditional cash transfer program directed at female-
headed households that send their children to school. Social assistance expenditures expanded rapidly,
resulting in a formal safety net and associated public expenditure that extend beyond the share usually
found in low-income countries. Currently, Timor-Leste spends around 15 percent of non-oil GDP, or 20
10 | P a g e
percent of the combined Estimated Sustainable Income6 and domestic revenues, on social programs,
one of the highest ratios in the world. The government continues to demonstrate firm commitment to
social assistance through the recently enacted civil service pension law and efforts to expand the Bolsa
da Mãe conditional cash transfer program.
These social assistance programs serve a variety of purposes, from rewarding those who made
sacrifices in the independence struggle, to protecting vulnerable groups. Against the background of a
post-conflict environment, damaged capacity for service delivery and limited financial infrastructure in
the aftermath of the 2006 conflict, the government instituted the current set of social programs. These
programs have arguably contributed to the provision of security, public trust in the government and
economic recovery.
Despite expansive spending on the safety net since 2007, Timor-Leste continues to lag behind in a
range of social and economic indicators, and principal risks faced by most vulnerable groups remain a
significant challenge. Social assistance receives one of the highest fiscal priorities; in the original 2012
budget, Timor-Leste allocated US$ 112 million on various MSS cash transfer programs, or US$ 892 on
average per beneficiary, more than it devotes to health, education or any other sector apart from
infrastructure. Yet, poverty, hunger and child malnutrition remain principal social protection issues.
According to the Global Hunger Index (IFPRI, 2011) which measures the national hunger incidence as a
percentage of the population, Timor-Leste was ranked 75th among the 81 countries surveyed in 2011.
These deprivations are further compounded by the country’s vulnerability to natural disasters.
Globally, poverty persistence is closely related to major life-cycle disadvantages resulting in low
human capital outcomes, and yet large-scale poverty remains unaddressed by current social
protection efforts. Chronic poverty is associated with child malnutrition and low educational
achievement, which in turn perpetuate the inter-generational cycle of poverty. Major risks faced by the
0-5 year old children include the damaging effects of malnutrition and poor infantile care, which impairs
their development. According to the 2009-10 Demographic and Health Survey, growth stunting among
children less than 5 years old in Timor-Leste is 58 percent, one of the highest levels in the world.
Notably, this has increased since 2003. Only 53 percent of children aged 12-23 months are fully
immunized against infectious diseases including diphtheria, polio, and measles. At 64 per 1000 births,
the child mortality rate is very high compared to other countries with a similar income level. Partly due
to such developmental disadvantages, it takes a child on average nearly 12 years to finish primary
education, and children do not appear to gain the most fundamental skills in the first few years in
school. A 2010 Early Grade Reading Assessment found that more than 70 percent of pupils at the end of
grade 1 could not read a single word of the simple text passage they were asked to read; 40 percent of
children were not able to read a single word at the end of grade 2.
B. Purpose, Scope and Coverage of the Report
This expenditure review and performance evaluation report is part of the technical assistance
provided to Timor-Leste’s Ministry of Social Solidarity in response to the lack of any national level
6 Explained in detail in Chapter 4.

11 | P a g e
evaluation of the safety nets system since its inception. To that end, this study seeks to assess the
social assistance policy, as well as the performance of the main MSS social assistance programs. More
specifically, the aims are to: (1) determine whether existing programs are efficient, effective and
sufficient in addressing main vulnerabilities; (2) assess the adequacy and composition of the allocation
of financial resources for delivery of government social assistance; (3) review operational and
administrative issues; and (4) make recommendations for improving the delivery of social safety nets.
Some of the questions that this report seeks to answer include: What are the main risks facing the
vulnerable groups in Timor-Leste? What types of programs are in place to address those risks? Is the
range of programs and their financial allocations appropriate for the country’s needs? Is the institutional
arrangement adequate? Are these programs effective and reaching the intended beneficiaries? Are they
implemented cost-effectively?
The report takes stock of the current safety nets using the most up-to-date data available, including
the nationally representative Household Income and Expenditure Survey (2011), Timor-Leste Social
Protection Survey (2011), Demographic and Health Survey (2010) and Labor Force Survey (2010) as well
as the latest budget and program information from the Ministries of Social Solidarity and Finance.
C. Conceptual Framework
While social protection policies are generally designed to provide protection for individuals and
families, they can be broadly transformative foundations for inclusive growth and social stability.
Around the world, these policies play an important role in guaranteeing a minimum level of economic
security as a basic citizen right. This basic economic security includes relief from poverty and risk
management policies that help households build resilience to cope with different income shocks. To
prevent long-term poverty, these safety nets are also designed to promote opportunities for families to
invest in their health and education, which will increase families’ long term earning capacity and
improve the ability to manage risk. Properly designed social protection programs can provide an
affordable, broad-based foundation for inclusive growth and social stability.
As good practice, safety nets programs should be informed by the country’s current living standards
and the prevalence of different types of household risks, and be guided in their design by well-defined
government objectives. Clear national social assistance policy priorities are essential for designing a
social protection system appropriate for the country. Such policy objectives should be representative of
broader principles of the social contract between the state and its citizens. Importantly, clear
government goals inform national indicators to track the performance of social assistance policy and
guide the design of the specific approaches for identifying eligible groups and establishing generosity of
benefits.
A set of programs may not necessarily make up a coherent system of social protection if these
programs do not complement each other, or leave significant coverage gaps. International experience
shows that many countries have too many programs, with low coverage, low benefits, fragmented and
insufficiently coordinated administrative systems and high operational costs. It is not unusual among
low-income countries to see government efforts to assist their people not through systems of social

12 | P a g e
protection but through use of small, uncoordinated and unconnected programs that focus on small
specific groups or specific objectives. And despite their high cost and administrative efforts, such
programs leave significant proportions of the population without adequate poverty relief or improved
economic security. A practical way to systematically think of social protection is along the analogy of a
system or a portfolio of coherent programs that ensures that there are no gaps in coverage and
duplication, and that these programs can share administrative systems and complement one another.
In such a broad framework, specific programs are adopted to achieve policy objectives such as reducing
poverty, increasing school enrollment, and eradicating malnutrition, and monitored against program
specific benchmark indicators.
This report is benchmarked against the following attributes of a good safety net system:
1) Appropriate to the needs of the country with very high levels of poverty, low levels of human capital and high risks of exposure to income shocks.
2) Adequate and accessible to cover the neediest groups, and provide meaningful benefits that are not too low relative to the poverty line and not too high to discourage work and endanger fiscal sustainability. Individual programs must aim to cover the entire target population.
3) Equitable in treatment of beneficiaries in terms of access to the benefits and size of the benefit. The poorest households often are the ones that have the biggest difficulties in participating in social programs, and a safety net that does not respond to that is not equitable.
4) Cost-effective and efficient management that channels most of the budget to their intended beneficiaries by utilizing economies of scale through common administrative systems and avoiding departmental fragmentation.
5) Sustainable financially, administratively and politically in relation to overall public spending goals and the country’s priorities.
Brazil, where the Bolsa Família program has demonstrated significant gains in poverty reduction as
well as support for children at a cost of around 0.5 percent of GDP, provides an illustrative example
(Box 1) for Timor-Leste. There are many such examples that can provide lessons to Timor-Leste, from
Chile, the Philippines, Indonesia, China, Mexico, India, Ethiopia and many others. The World Bank has
extensive experience in supporting partner countries to move from fragmented approaches towards
more coherent safety nets systems, and to improve poverty protection by successfully reorienting
resources in support of stronger anti-poverty systems. This is achieved through customized country-
specific technical assistance, capacity building, and facilitation of country-to-country knowledge
exchanges.

13 | P a g e
Box 1: An anti-poverty social assistance system in Brazil
Brazil started off with many small programs that did not meaningfully contribute to the achievement of
national developmental targets, and through an impressive re-think of their social assistance policy, it
was able to achieve remarkable levels of poverty reduction and economic growth. In 1988, the Brazilian
Constitution conferred the right to minimum social protection and played a central role in defining the
notion of a basic level of income for its citizens and the related principles of rights and entitlements. By
the early 2000s, Brazil initiated a number of national programs such as Bolsa Escola, Bolsa Alimentação,
Auxílio Gás, Cartão Alimentação covering gas and food subsidy, health and education transfers. These
programs were implemented by several agencies and were marked by low coverage, multiple eligibility
criteria, benefit levels and isolated data systems. The government recognized the need for clear policy
objectives, and converged on poverty relief, education and health as basic social rights, which made it
clearer that current programs were not performing effectively when judged against these objectives. To
improve the efficiency and coherence of these multiple programs, the Bolsa Família Program (BFP) was
launched in 2003. The BFP targets poor and extreme poor families throughout the country. To date, the
BFP has achieved some exceptional targeting results, with 73 percent of transfers going to the poorest
quintile and 94 percent going to the poorest two quintiles. The figure below displays the number of
beneficiaries across different programs and over time, demonstrating gradual consolidation of the four
existing national programs into a single, means-tested cash transfer that would reach 24 percent of
Brazil’s population (44 million people) by 2007. Merging the four programs into a single program
allowed for better use of funds through consolidation of systems, registries and rules from different
ministries and most importantly, improved the anti-poverty effect through significant coverage.
Source: Ministry of Social Development and Fight against Hunger, Brazil 2012
1,150,228
10,557,996
9,048,745
149,930 0
2,000,000
4,000,000
6,000,000
8,000,000
10,000,000
12,000,000
out/03 dez/04 out/05 out/06 out/07 out/08 dez/08
Qu
anti
dad
e d
e Fa
míli
as (
milh
ões
)
PBF
Gás
BES
PCA
BAL

14 | P a g e
The report is organized as follows: Chapter 2 describes the attributes of the poorest 40 percent and the
main vulnerabilities and risks that low-income families in Timor-Leste face. Chapter 3 provides a
historical overview of the social assistance policy and programs that emerged after the 2006-2007
conflict. A summary of levels and trends in aggregate public expenditure on safety nets, composition of
spending as well as program-specific budget analysis is presented in Chapter 4. Chapter 5 assesses
performance of the safety nets by analyzing coverage, targeting effectiveness, and generosity. Building
on the findings of performance analysis, Chapter 6 examines impact and targeting efficiency using
simulation techniques. Chapter 7 assesses implementation capacity, and business processes, and in
particular, the following: ID systems, enrollment, payments arrangements and monitoring and
evaluation. Chapter 8 concludes with implications for social response and policy considerations.

15 | P a g e
Box 2: A Focus on the Bottom 40%
At the time of report preparation, an updated poverty estimate and profile for Timor-Leste was not available. In order to conduct impact analysis of social assistance, it was therefore necessary to select an alternative population subset. In selecting which subset to use for this analysis, the authors considered international comparability and commonly used international benchmarks. The authors chose to study the poorest 40 percent of the population in terms of their total per capita expenditure. This population subset is used exclusively to assess the impact of the main social assistance programs and should not be confused with the official poverty line used for statistical purposes of counting the poor. The bottom 40 percent corresponds to US$ 32 per capita per month, or approximately US$ 1/day. The underlying indicator of living standards is total per capita expenditure derived from total household expenditure reported in the most recent Household Income and Expenditure Survey (HIES, 2011). Total expenditure was constructed by aggregating all reported food expenditures, self-produced food valued at market prices, non-food items, services and housing expenses, but excludes durable goods in view of their rare occurrence and measurement difficulties. It is adjusted for differences in regional prices and seasonality effects. The “bottom 40%” measure has the advantage that it is widely used in cross-country comparisons, has the potential to capture both groups who are poor and those who are at risk for poverty, and approximates a level of expenditure (US$ 1 per day) that is widely seen as a measure of extreme poverty. To demonstrate which sections of the society are left out and which are benefiting from social assistance, chapters 5 and 6 of the report rely extensively on this population subset and present benefit incidence for different expenditure groups (quintiles). However, it is important to note that Timor-Leste is a lead player in the ongoing efforts to define the post-2015 MDG targets, which are likely to include commitments to eradicate extreme poverty and provide a level of social protection to a yet-to-be-defined portion of the population. As the post-MDG targets become clear, Timor-Leste may shift the focus of its social protection programs to target population subsets in keeping with these international commitments.
Chapter 2: Risks and Vulnerability in the Bottom 40%
A. Characteristics of Timor-Leste’s Poorest Households
Timor-Leste is endowed with significant oil revenues, but the 2011 GDP per capita figure of US$ 4,048
does not reflect commensurate living standards. The majority of the population is engaged in
subsistence agriculture and the incidence of poverty is very high. Understanding the nature of poverty,
risks and vulnerabilities in Timor-Leste is vital for development of meaningful safety nets. This chapter of
the report aims to provide the most up-to-date diagnostic assessment of the various risks associated
with life-cycle, natural, economic and socio-political shocks. The analysis will identify unaddressed gaps
in coverage of current social assistance programs, and will be considered in the context of current
resource allocations.

16 | P a g e
Timor-Leste has shown impressive double-digit economic growth in recent post-conflict years, yet
widespread poverty, hunger and child malnutrition remain dominant vulnerabilities. The first poverty
assessment for independent Timor-Leste in 2001 registered 40 percent of the population below the
poverty line. By 2007, the poverty headcount increased to 49.9 percent, partly due to prevailing drought
conditions and the 2006/07 political crisis. Since the 2007 poverty assessment, direct observations on
household expenditures are not available, and in 2009-2010 the World Bank imputed the range for the
national poverty prevalence to be between 39 percent and 43 percent (World Bank, 2010). According to
the more recent Global Hunger Index, which measures national hunger as a percent of the population,
Timor-Leste ranked 75th among the 81 countries surveyed (IFPRI, 2011). Child growth stunting, a widely
regarded composite proxy of lifetime income and productivity, was around 58 percent (DHS, 2010), one
of the highest levels in the world.
The scale and character of poverty in Timor-Leste is associated with diverse and deep vulnerabilities
for much of the population. Food insecurity, malnutrition and micronutrient deficiency, especially in
young children, are serious problems in Timor-Leste, fueling a poverty trap that is likely to persist across
generations if left unaddressed. The 0-5 year old children face major risks. These include poor infantile
care and inadequate diet, both of which impair their development and contribute to chronic inter-
generational poverty. Preventing biological retardation of growth at early stages of life will permanently
increase incomes of the poor by putting them on a sustained earnings growth path that goes beyond
mere financial transfers. About 38 percent of children suffer from anemia, most often caused by poor
diet, malaria, and intestinal worms. Both malnutrition and anemia put children at risk of infections and
impaired ability to learn and succeed in school. Only 53 percent of children aged 12-23 months are fully
immunized against serious infectious diseases, including diphtheria, polio, and measles. About 23
percent have not received any vaccinations. The mortality rate for children is very high (64 per 1000
births). These figures are not only a cause of great concern for the families, but also have worrying
implications for the Timorese society in achieving the most essential functional capabilities, reflected by
a very low human development index (ranked 134 out of 187, United Nations, 2012).
Who are Timor-Leste’s poorest households? Knowing key characteristics of low-income households
helps to ensure that poverty-focused social assistance programs are well targeted. Poverty profiles can
be useful for planning sub-national budget allocations and for comparisons with current social
assistance resource allocations that can inform coverage gaps of existing programs. As noted in Box 2,
updated 2012 poverty figures were unavailable at the time of writing. Instead, in the coming analysis,
the authors examine the characteristics associated with the bottom two expenditure quintiles – the
poorest 40 percent of the population. The poorest two quintiles in Timor-Leste live primarily in rural
areas (76 percent). There are multiple correlates associated with membership in the lowest expenditure
groups, but of these some have a particularly strong link - namely, household size and demographic
composition, number of children, and age of the household head.
Household size and composition is a strikingly strong predictor of membership in the bottom 40
percent. Figure 1 shows the positive relationship between household size, composition and the share
and distribution of households in the lowest expenditure groups. Presence in the bottom 40 percent is
relatively rare for households with 1-3 members but rises substantially and averages between 31 – 48

17 | P a g e
percent among households with 5-7 members. In fact, as shown in Figure 1A, the population living in
households with at least 6 members represents 85 percent of the bottom two quintiles. Likelihood of
being among the bottom 40 percent increases with number of children.
Figure 1 A&B: Headcount rate and distribution of poorest households by household size (A), and by number of children (B)
Source: SP Household Income and Expenditure Survey, 2011
Low-income distribution has a very strong connection to the age profile (Figure 2). The large
proportion of the bottom two quintiles (29 percent) represented by children is particularly worrying.
About 59 percent of the poorest quintiles are between 0-19 years old. The proportion of the poorest
represented by the age group 60+ is lowest (around 6 percent of the poorest). This profile highlights
relative success in tackling old age poverty; it also points to a substantial need to address the needs of
children and youth through social policy. Limited earning opportunities for youth hamper income
security and increase the risks of social unrest and long-term poverty. This raises an important social
assistance coverage gap that is discussed in Chapter 5. While most social assistance spending is focused
on the elderly and working-age population through programs such as elderly pensions and veteran
payments, a disproportionately small amount of resources are earmarked for children and poverty relief
for younger age groups. It is also noteworthy that judging by the symmetry of the age-gender pyramid in
Figure 2, likelihood of membership in the poorest two quintiles is not significantly different between
male and female populations.
0%
10%
20%
30%
40%
50%
60%
70%
80%
1 2 3 4 5 6 7 ormore
Headcount Proportion of the bottom 40%
0%
10%
20%
30%
40%
50%
60%
0 1 2 3 or more
Headcount Proportion of the bottom 40%

18 | P a g e
Figure 2: Age-Gender Pyramid, headcount and share of total population in poorest 40%
Source: SP Household Income and Expenditure Survey, 2011
B. Vulnerability and Risk Characteristics
A significant share of the population with expenditure currently above US$ 32/month remains highly
vulnerable to falling below it.7 The distribution of per-capita household consumption is clustered
around this mark, making transitions in and out of the poorest quintiles particularly responsive to
declines in household consumption from adverse shocks. The size of the population identified as “near-
poor” does depend on which expenditure level is chosen as a starting point. A 10 percent upward
adjustment of the expenditure level would increase the “poor” population by 22 percent, and a 20
percent upward adjustment would bring a 40 percent increase. These results suggest a disproportionate
sensitivity of the number of poor households to changes in the expenditure level chosen for analysis.
The sensitivity to changes in the chosen expenditure level highlights a series of important risks
resulting from (i) natural disasters (ii) economic disturbances in employment, income and prices, and
(iii) household-specific shocks like disability and illnesses. Nationally, almost all Timorese households
report having experienced at least one type of shock from 2010 to 2011, with 93 percent of households
7 US$ 32/month corresponds with the higher end of the expenditure of the bottom 40 percent.
42
44
43
44
35
34
27
34
38
46
42
39
31
29
24
16
42
24
.
43
45
44
39
36
32
35
45
38
37
38
27
30
23
25
42
35
30
68 Poverty Rate, Female Male, Poverty Rate
5
10
20
30
40
50
60
70
80
90
95
Age
in y
ea
rs
5
10
20
30
40
50
60
70
80
90
95
Ag
e in
ye
ars
11 9 7 4 2 0 2 4 7 9 11
Share in total population, %
Total Population
Poor Population
Data1
% in poorest 40%, Female Male, % in poorest 40%

19 | P a g e
having suffered from more than one type of shock8 (TLSPS, 2011). The analysis of the types of risks faced
by households, their impact and the strategies adopted to cope with the consequence of these shocks is
a critical step in understanding whether shocks have translated into a transitory decline in well-being or,
instead, these shocks will have a long lasting impact on households’ well-being and development. Such
an understanding would also represent an important milestone in building a poverty reduction strategy
for Timor-Leste and, in particular, in the development of safety nets aimed at reducing household
poverty and vulnerability. The following analysis of trends in the incidence of shocks, their severity and
coping strategies is based on specially designed shocks, health and disability modules from the Timor-
Leste Social Protection Survey 2011 and the 2008 Timor-Leste Living Standards Measurement Survey
(TLSS).
One of the biggest shocks to incomes is from natural disasters. Timor-Leste is prone to floods, droughts
and landslides. As shown in Table 1, natural disasters are among the most frequent types of shock,
affecting 64 percent of households, a 15-point decrease from 2007 levels (TLSLS, 2007). As the majority
of the population lives in rural areas and relies on rain-fed farming for generating incomes9, natural risks
play a paramount role in shaping the vulnerability of Timorese households. Household survey data
clearly reflects the relevance of this natural shock; 73 percent of the rural households interviewed
recalled having suffered from drought consequences compared to the national figure of 64 percent.
Table 1: Trends in shocks 2006-2010 as reported by households
Type of shocks % of HHs that experienced such a shock
2007 Data for comparison
Natural and biological 63.7 78.5
Droughts 0.6 62.5
Floods, mudslides, storms 52.2 21.4
Earthquakes, volcanic eruptions, tsunami 1.1 2.1
Pest infestation, crop and livestock diseases 35.4 41.9
Economic 85.4 67.8
Decline in prices or demand for commodities that you sell 3.4 25.9
Increase in prices/shortages of inputs/services you use 6.9 13.1
Increase in prices of food/other essential commodities consumed 82.2 55.9
Loss of job or reduction in number of hours of work of any member 0.6 1.8
Unexpected reduction in wages/salaries 0.6 0.1
Socio-political 5.0 29.3
Crime (robbery, theft) 2.8 16.0
Ethnic or religious conflict 0.2 6.1
Political violence 0.6 14.4
Confiscation of property or forced resettlement 2.1 0.2
8 In the case that a household had experienced more than one shock of the same type over the period, the
respondent was asked to provide information only referring to the shock having affected the household the most. 9 In 2001, less than one fifth of all plots were irrigated and one quarter of them had year-round irrigation (The
World Bank, 2003).

20 | P a g e
Life Cycle and Health Shocks 7.1 12.8
Divorce, abandonment, or internal or extended family disputes 1.0 0.7
Serious illness, injury or death of a household member 6.2 12.3
Source: Timor-Leste Social Protection Survey, 2011
As shown in Table 3, the incidence of economic shocks has increased significantly since 2006-07 and
constitutes the most common type of shock. The “economic risk” category included shocks related to
commodity price volatility, and household specific changes to labor market outcomes such as job loss,
reduction of working hours and delayed payments. The main shock reported under this category is an
increase in prices of food and other essential commodities. The price shocks affected 82 percent of
households in 2010 compared to 56 percent in 2006-07. Notably, compared to 2007, producers of
agricultural outputs are less affected by incidents of downward price shocks and decline in demand.
According to the TLSPS 2011 there, has been appreciable improvement in the socio-political
environment, with just 5 percent of households reporting socio-political shocks since 2010 compared
to almost one-third of households during 2006-07. Recurrent violence and socio-political instability that
affected the country over the last ten years represents another major source of household vulnerability.
In 1999, after Timor-Leste overwhelmingly voted in favor of independence, violence erupted throughout
the country, causing the displacement of more than three quarters of the population and destruction
and damage to about 70 percent of physical infrastructure. Political and social unrest exploded again in
2006 and in February-March 2007, leading to further waves of arson and internal displacement10.
Crime, confiscation of property and forced resettlement were the main risks.
Health risks, which represent another relevant source of vulnerability, have declined: 6.2 percent of
households in the 2011 sample experienced serious illness, injury or death of at least one member, as
opposed to 12.3 percent in 2006-07. Household income may be severely and negatively affected as a
result of illness and death of economically active members, both because these shocks reduce
household labor endowments and because they trigger additional medical and other associated
expenses. Given the post-conflict nature of Timor-Leste, disability is likely to represent another
significant source of vulnerability, limiting the ability of household members to work. According to the
latest Timor-Leste Census (2010), disability rates are only 4.6 percent, much lower than suggested by
data from other developing countries, and significantly lower than the 15 percent international
comparison figure cited by the UN (2011). This discrepancy is likely due to differences in definition, with
the Census Data, for instance, not allowing for psychological disabilities. Experts hypothesize that
disability in Timor-Leste might in fact be significantly higher than the international average and
particularly high among the poorer population. In order to evaluate the targeting of current disability
benefits (Chapter 5), this report defines disability as being completely unable or having a lot of difficulty 10
Several critical factors have contributed to conflict in Timor-Leste. These include high levels of unemployment, especially among youth and veterans from the resistance period; inadequate access to reliable information; corruption and nepotism within local and national government; poor communication between the government and communities; poor infrastructure; limited transportation possibilities; mistrust, lack of shared experiences, and weak social cohesion between and among communities; perception of physical insecurity; lack of food security; resource scarcity; and a legacy of violent conflict which has imparted to communities a tendency to use violence in resolving conflicts (CICR, 2004).

21 | P a g e
in seeing, hearing, walking, self-care, or communication. Under this definition, 3.7 percent of the
population is disabled, with the share being 5.1 percent of the poorest expenditure quintile compared to
2 percent in the wealthiest quintile.
In general, the exposure to shocks varies geographically between urban and rural areas, depending on
the nature of the risks and on the resources locally available. As shown in Figure 3, the incidence of
natural shocks is highest among rural households, whereas households living in urban areas are more
likely to experience shocks related to adverse economic conditions or disruptive socio-political events. In
Timor-Leste, economic activities in rural areas are largely informal, with most of the rural population
being self-employed in subsistence agriculture. In this context, rural households are likely to be less
dependent on market exchanges and, as a result, less likely to be affected by economic shocks.
Figure 3: Percentage of households reporting shocks since 2010 by type and location
Source: Timor-Leste Social Protection Survey, 2011
In the following analysis, (self-reported) income and asset losses have been used as a crude proxy for
the severity of shocks. The TLSPS 2011 vulnerability module collected information on whether each type
of shock was associated with income and/or asset losses and, whenever applicable, on the monetary
value of such losses. As shown in Table 2, the majority of households report to have suffered “some”
welfare loss as a consequence of the shock. Natural and economic shocks were the sources of welfare
losses for the highest share of households. Households responded to shocks by running down their
assets (Table 3), a response that is likely to further strain their productivity and push them deeper into a
poverty trap. The primary means of coping with a shock was through the sale of productive assets like
livestock, or premature disposal of harvest.
0
20
40
60
80
100
Natural & biologicalEconomic Socio-political Life cycle
Rural
Urban

22 | P a g e
Table 2: Share of households reporting welfare loss, by type of shock (in %)
Natural & biological Economic Socio-political Life cycle
Housing 12.4 1.0 5.6 1.7
Crops 67.3 86.8 9.6 5.4
Livestock 28.0 10.8 36.3 46.3
Land 3.7 1.0 35.0 2.4
Health 0.6 1.1 3.1 25.3
Source: Timor-Leste Social Protection Survey, 2011
Table 3: Share of households reporting ex-post coping strategies (in %)
Natural & biological Economic Socio-political Life cycle
Informal: Self Help or self-insurance
Spent savings 85.4 85.5 80.1 88.1
Sold goods (jewelry, furniture, car) 1.6 0.4 1.9 4.2
Sold harvest in advance 56.5 40.5 33.1 37.7
Sold animals 70.5 61.2 46.5 55.2
Reduced Consumption of some Products
40.9 48.4 28.9 32.0
Informal Insurance- Risk Sharing
Borrowed money from relatives/friends
40.6 42.3 24.8 40.5
Formal: Market- Based or Publicly provided
Borrowed money from institution 1.7 0.6 0.0 1.9
With help from NGOs 2.4 1.1 0.0 0.7
With help from Government program
5.3 4.0 10.4 8.2
Source: Timor-Leste Social Protection Survey, 2011
The share of households relying on informal coping strategies (Table 3) far outweighs that of
households relying on assistance from Government or NGOs. Among self-help and self-insurance
coping mechanisms, selling productive assets such as livestock is the most prevalent strategy adopted by
the vast majority of households. Besides selling assets, a consistently high share of households also
reports running down their savings. Looking at informal risk sharing mechanisms, the adoption of
specific coping strategies varies between different shock categories. Despite expansive Government
spending and a sizeable number of NGOs, Table 3 also highlights the limited role of publicly-provided
assistance as a risk coping mechanism, in particular when households have to face health and life-cycle
idiosyncratic shocks. The choice of a coping mechanism depends on the type of shock (covariate or
23 | P a g e
idiosyncratic), availability of formal safety nets and on the specific local socio-economic context that
shapes the cost and the effectiveness of each coping instrument. Formal credit market imperfections
common in developing countries limit the use of formal market-based insurance, leaving people to rely
largely on self-insurance and/or on informal help. When households are not resilient to endure shocks,
coping with their consequences might become progressively more difficult, especially if coping
strategies entail asset depletion and undercutting human capital investments.
24 | P a g e
Chapter 3: Origins and evolution of Social Assistance in
Timor-Leste
A. Evolution of safety nets in Timor-Leste
Upon gaining its independence in May of 2002, the fledgling Democratic Republic of Timor-Leste faced
substantial economic and social challenges. At the time of the 2001 living standards survey, nearly 40
percent of the new nation’s population lived below the national poverty line (World Bank, 2003).
Poverty was particularly pronounced in rural areas, and among orphans, female-headed households,
and households with high dependency ratios. Persistent food insecurity, exacerbated by severe
droughts, undermined household welfare and hampered early efforts to improve health and nutrition.
The Constitution of the new state expressed a commitment to a strong government role in providing
social assistance to the population. The Constitution explicitly states that “every citizen is entitled to
social assistance and security in accordance with the law” and envisions the promotion, as far as is
possible given the state’s natural resource endowments, of “the establishment of a social security
system” (Democratic Republic of Timor-Leste, 2002).11 Protections in the Constitution include special
support to women during pregnancy, promotion of safe and appropriately remunerative work, and
adequate housing.12 Beyond these overarching protections, the Constitution includes discussion of the
state’s role in supporting specific sub-groups of the population, including veterans of the resistance and
their survivor families, children, youth, the elderly, and the disabled.13
In keeping with Constitutional commitments, the leaders of the first government envisioned broad-
based social assistance programs, though budgetary realities and capacity constraints necessitated a
staggered approach to launching these efforts. The first National Development Plan (NDP), released in
2002, committed the state to “establish a social safety net to reduce the burden on those in society who
are unable to work or help themselves” (Democratic Republic of Timor-Leste, 2002b, pg. 20). The
vulnerable groups discussed in this context included women in difficult circumstances (such as widows
or survivors of domestic violence), the elderly, veterans, refugees, the very poor, prisoners, children,
and people with disabilities. Retirement and disability insurance programs were discussed as a future
area for support, to be implemented as budget became available.
11
Section 56 (Social Security and Assistance). 12
Sections 39 (Family, Marriage, and Maternity); 50 (Right to Work); and 58 (Housing), respectively. 13
Sections 11 (Valorisation of Resistance); 18 (Child Protection); 19 (Youth); 20 (Senior Citizens); and 21 (Disabled Citizens), respectively.

25 | P a g e
Box 3: Vulnerability and the Role of Familial
Support
While certain populations have been identified by the
government as ‘vulnerable’ based on key characteristics
(e.g., poverty, orphan or widowhood, disability), there is
no overarching definition of vulnerability. Though each of
these characteristics is likely associated with higher levels
of vulnerability, respondents to a qualitative survey on
social assistance were most likely to define vulnerable
individuals as those without adequate means of familial or
community support. Traditional exchange relationships
among households reinforce kinship bonds and establish
networks of obligation and care, which can be tapped into
in times of food shortage or other crisis, in the absence of
formal social support from government or civil society.
Social assistance in the NDP featured most prominently as a strategy to mitigate the risk of social
unrest and instability stemming from poverty, vulnerability and inequality, though it was also seen as
a means to lessen the burden of poverty.14 The first social assistance programs launched by the new
government – disaster risk management
and rice distribution – were explicitly
listed under the category of “security” in
the NDP Poverty Reduction Strategy.15
Social assistance was a means of
“strengthening community solidarity
through the creation of a system of
protecting people”, promoting unity in
the young nation (Democratic Republic
of Timor-Leste, 2002b, pg. 130). The
security objective of early social
assistance efforts was made more
explicit with the release of the NDP Road
Map in 2003. This document, an attempt
to operationalize the NDP, committed
nearly one-half of all social assistance
expenditures to programs benefitting
veterans, with the remainder of the support focused on food security, disaster recovery, vocational
training, and (to a much lesser extent) child protection.
The government’s limited budget envelope and weak civil service capacity necessitated a phased
approach to developing government-led social assistance programs, and the early years after
independence saw few, and largely ad hoc, efforts. The first government preferred to avoid direct
financial support, and initial social assistance efforts provided non-cash benefits to households. Rice
distribution and school feeding programs, heavily supported by donors, provided for basic food needs
and encouraged school attendance. Unemployment was targeted through a small public works program,
as well as vocational training, small business loans and scholarships directed towards veterans. Disaster
relief programs provided emergency aid, rehabilitated homes and replaced lost household goods, and
non-governmental organizations received grants to assist communities in disaster prevention and
preparedness. Together, these programs provided the foundation for social assistance efforts in Timor-
Leste.
14
The link between poverty and conflict still features in the language at senior levels of government in Timor-Leste. As recently as 19 September 2012, newly-elected President José Maria Vasconcelos stated that "… if we continue living in this situation [of poverty], it will threaten the security of the country”. (East Timor Legal Blogspot, “Poverty a Threat to Security, says President Taur Matan Ruak”, accessed on 1 October 2012 at http://easttimorlegal.blogspot.com/2012/09/poverty-threat-to-security-say.html. 15
Other categories in the strategy paper are “Opportunities for Economic Participation”, “Basic Social Services”, and “Empowerment”.

26 | P a g e
B. Post-crisis changes in social assistance
In 2006-2007, a political crisis in Timor-Leste caused an outbreak of violence that resulted in at least
37 deaths, displaced approximately 150,000 people, and contributed to a sharp decline in GDP and an
increase in poverty.16 Though the causes of the crisis are multifold, observers have noted that the
failure to meet high post-independence expectations by delivering a peace dividend, particularly for
veterans of the independence struggle, contributed by fueling frustration and perceptions of corruption
in the distribution of social benefits. The immediate post-crisis environment was characterized by poor
service delivery and substantial economic hardship. A 2007 living standards survey revealed that nearly
half of the population lived below the poverty line, with one-third experiencing extreme poverty (World
Bank and National Directorate of Statistics, 2008). Poverty rates were particularly high among
individuals with less than primary education, in the center of the country, and in rural areas, where
there is a high concentration of underemployed farmers and poor access to health and education
services. Poverty was also higher among some population subsets; in particular, female-headed
households and children.17 In contrast, the elderly comprised a small share of the poor population.
In an effort to deliver a highly-visible peace dividend, the government of Timor-Leste ramped up social
assistance in the aftermath of the crisis, putting in place a series of programs designed to rapidly
resettle the displaced, lower tensions, and promote social cohesion.18 The government’s National
Recovery Strategy (NRS), launched in late-2007, sought to aid post-crisis recovery through five pillars:
transitional shelter and housing, social protection, security and stability, local socio-economic
elopement, and confidence-building/reconciliation activities. Most budget and attention was
concentrated on the first pillar; registered families whose houses were destroyed received up to US$
4,500 from the Ministry of Social Solidarity (MSS) in order to rebuild homes. Through this program, the
MSS and other NRS partners were able to close all internally-displaced person (IDP) camps and return
the displaced to their homes by the end of 2010. Payments to “petitioners” – soldiers who left their
barracks in 2006 to protest perceived discrimination in the armed forces, and were later dismissed,
sparking clashes – were also made as part of the post-crisis reconciliation package.
By early 2008, as the economy began to recover and the Petroleum Fund balance rose in response to
high global fuel prices, the government began to implement its first cash transfer programs targeted
at vulnerable populations. The first of these programs were transfers for the elderly and people with
disabilities, managed under the National Directorate of Social Security in the Ministry of Social
Solidarity.19 These programs initially provided payments of US$ 20 per month for individuals over 60
16
Non-oil GDP per capita was on the decline before the onset of the crisis, despite an ever-growing per capita GNI; however, GDP declined further as a result of the crisis. 17
For any given household size, female-headed households were found to be poorer than male-headed households. However, because female-headed households were on average smaller, they are less poor overall than male-headed households. 18
For further discussion on the government of Timor-Leste’s use of public financial management policies, including spending on social protection, to secure stability, see Porter and Rab (2010), Timor-Leste’s Recovery from the 2006 Crisis: Some Lessons, WDR 2010 Background Note, Washington, DC: The World Bank. 19
The “Idosos e Invalidos” programs were approved in Decree Law 19/2008, and began in January 2008.

27 | P a g e
years of age, and persons with severe and permanent disabilities rendering them unable to work.20 The
MSS also launched the Bolsa da Mãe, or ‘Mother’s Purse’, program in 2008. Modeled after Brazil’s Bolsa
Família, Bolsa da Mãe provided small cash grants to children in vulnerable households on a conditional
basis, to assist with the cost of school-related expenses. Additionally, the MSS continued its social
assistance through a variety of on-demand social support programs: disaster recovery programs,
provision of funeral cars, support to victims of domestic violence, prisoner counseling, child protection
services, health services for the critically ill, and other humanitarian assistance programs.
Table 4: Major features of the Elderly, Disability, and Bolsa da Mãe Programs21
Target Population
Benefit Amount Coverage Conditionality Implementing Agency
Elderly Elderly (60+) US$30/month, paid in a lump sum once per year
84,569 (2012)
None National Directorate of Social Security (MSS)
Disabled 18+ with severe disabilities (Class III or IV per WHO)
US$30/month, paid in a lump sum once per year
5,558 (2012)
None National Directorate of Social Security (MSS)
Bolsa da
Mãe
(design
in 2012)
School-going children who are orphans, living in single-parent households or in large families
Primary students: US$40/year; Pre-Secondary and Secondary: US$80/year; University (domestic/ international): US$160/240 per year, paid once per year
15,150 (2012)
School attendance, proven through submission of report card and letter from school headmaster
National Directorate for Social Reinsertion (MSS)
Source: Program Documents and Interviews with MSS program officials
20
The payment amount was increased to US$ 30/month in 2010. 21
Note that this table represents characteristics of the programs at the time of the Social Protection Survey and qualitative research. However, the programs underwent changes both before the study (e.g., increased payment amounts) and after (e.g., revised Bolsa da Mãe criteria). For more on the revisions to the Bolsa da Mãe program, please see Box 3.

28 | P a g e
Box 4: Changes to Bolsa da Mãe Eligibility Criteria
As of 2012, Bolsa da Mãe’s targeting criteria, conditionalities, and benefit amounts have been
adjusted. Rather than targeting individual children within a household, the transfer is now
provided to vulnerable families, who are identified and ranked through a vulnerability scoring
exercise. Household vulnerability scores are based on a series of indicators, including household
size, health and disability, education level of household members, income source, land ownership,
and distance to services. Households will be resurveyed every two years to identify changes in
vulnerability, and those who are no longer eligible will be phased out.
Under the revised criteria, benefit amounts will be based on the number of children aged 0-17
who meet program criteria. For children 0-6, parents must show vaccination certificates. Children
6-17 must prove school enrollment and attendance, and receive a pass grade. Parents will receive
a benefit for a maximum of five children per household. For a single child, the benefit is set at
US$5/month; households with 2 children receive US$10/month, and those with 3 or more receive
US$15/month.
2008 also saw the first distribution of cash payments to veterans and survivor families, who had been
identified through a nationwide validation exercise. Though providing a substantial benefit, veterans’
transfer payments were not designed as part of the nation’s social assistance strategy, but were rather
put in place as recognition for past service, and compensation for the hardship suffered during the
independence struggle. As shown in Table 5, few veterans received assistance in the program’s first
years, as participants are required to undergo an evaluation process prior to receiving certification of
eligibility. However, the number of veteran pension recipients is expected to continue to rise in the
short-term, as the pending applications (currently over 100,000) is evaluated.22
Table 5: Veteran Payment Categories and Amounts (monthly)
2008 2009 2010 2011 201223
Superior Pension24 # of recipients
7 10 13 14 15
Benefit amount
$750 $750 $750 $750 $750
22
Timor-Leste’s Ministry of Finance is undertaking a study to project the number of veterans who will receive benefits over the next few years. 23
The veteran beneficiary numbers are updated on a monthly basis. The numbers in this table represent the most recent figures at the time of the report. 24
Payment to veterans distinguished for their outstanding contribution to independence.

29 | P a g e
Special Retirement25
# of recipients
211 235 236 236 735
Roster 1 Benefit amount
$340-550 $460-575 $460-575 $460-575
$460-575
Roster 2 $255-340 $345-460 $345-460 $345-460
$345-460
Special Subsistence26
# of recipients
190 269 313 395 7651
Benefit amount
$85-120 $276-345 $276-345 $276-345
$276-345
Survival27 # of recipients
1593 3455 8427 10266 13801
Benefit amount
$120-288 $230-288 $230-288 $230-288
$230-288
One-Off Payments # of recipients
0 0 0 0 15502
Benefit amount
$1380
TOTAL RECIPIENTS 2011 3969 9456 10911
22202 plus 15502 one-off
TOTAL BUDGET $3.5m $15m $45.4m $37.6m $123.1m Source: Discussion with MSS Secretariat of State for Veterans Affairs, 12 October 2012
The government also continued its substantial investment in food security, putting in place a Food
Security Fund to regulate the price of food staples and meet excess demand. In the 2009 budget year,
US$ 41 million was allotted to the Ministry of Tourism, Commerce and Industry for the purchase of rice
and maize, distribution of rice, and subsidization to reduce market prices. The government’s food
security investment was designed to address annual rice deficits, which contributed to at least one
month of low food consumption in 80 percent of the rural population (World Bank 2010). However, the
Fund was not able to address the larger issue of consistently low crop yields; as of the 2012 budget year,
the government continues its investment in the Food Security Fund, though at a lower level than in
2008, reflecting the cessation of price subsidies.
25
Payment to veterans with at least 15 years of full time participation in the struggle (roster 1= 20+ years, roster 2 = 15-20 years). 26
Payments to those with 8-14 years of full time participation in the independence struggle, and those who were injured as a result of that participation. 27
Payments to surviving spouse, orphans regardless of age, parents, or siblings of those who died in the independence struggle, or who received the special retirement or special subsistence payment and have since died.

30 | P a g e
Though the government has made notable successes in developing its first generation of social
assistance programs, the urgency with which they were launched contributed to a lack of an
overarching program strategy, and insufficient attention to operational processes and guidelines to
ensure appropriate targeting, program management, and accountability. The Ministry of Social
Solidarity alone implements four major cash transfer programs reaching an estimated one-third of the
population, with a US$ 128 million budget for 2012. While the MSS has the largest and clearest social
assistance role, it is by no means the only government agency implementing this agenda; programs
under the heading of social assistance are currently being implemented by at least five agencies.28 To
date, there has been no overall assessment of the effectiveness of social assistance spending in reaching
target groups. Program monitoring tools – databases, monitoring and evaluation systems, grievance
redress systems, operational reviews – are not yet fully functional. Going forward, the MSS in particular
is prioritizing development of a more unified social protection system and has shown the initiative to
adjust programs to improve targeting and performance. The Ministry is also scaling up existing
programs, and making efforts to improve overall implementation.
C. The next generation of programs
Looking forward, the government of Timor-Leste aims to both improve the design of its current social
assistance efforts, and introduce new programs to address the remaining gaps. Chief among the
programs currently under development is an MSS-designed civil service pension system, which entered
into law in mid-2012. Though most aspects of pension implementation are still being determined, it is
expected to be a pay-as-you-go system that will offer a replacement rate of 75 percent of average wage
after nine years of service. As of 2015, the government aims to expand the pension to cover all workers
in the formal sector. Though the civil service pension represents a fulfillment of commitments under the
original National Development Plan, and Timor-Leste is unusual among lower middle-income countries
in not having a civil service pension system in place, the new system will have substantial cost
implications for the government, and will raise the overall social protection bill substantially.
In line with its 2011-2030 Strategic Development Plan, the government will work to develop a mix of
programs that both address immediate sources of poverty, and prevent the intergenerational
transmission of poverty. As the government confronts the possibility of a shrinking budget, legacy
programs, and demographic change that may necessitate a push towards expanding basic social services
and addressing growing unemployment, important choices will need to be made about the structure of
social assistance in Timor-Leste. The next section delves further into the fiscal position of the
government’s social assistance spending, reviewing trends in social assistance and placing this spending
in the context of overall budget expansion and uncertainty in projections for non-oil GDP growth.
28
In addition to the fleet of MSS programs, the Food Security Fund is being implemented through the Ministry of Tourism, Commerce, and Industry; school feeding under the Ministry of Education; pensions for former public office holders under the Ministry of Finance; and labor-based public works under the Secretary of State for Vocational Training and Employment.

31 | P a g e
Chapter 4: Social assistance sector expenditure review
A. Introduction
This chapter summarizes public expenditures on social assistance since Timor-Leste embarked on its
ambitious expansion of social assistance programs in 2007. The expenditure overview is based on
administrative data from the Ministry of Social Solidarity, Treasury and the Ministry of Finance. For the
purpose of this review, social assistance is largely defined as non-contributory cash and in-kind transfers
that include household cash transfer programs, public works, and food programs. The list of social
assistance programs included in these aggregates is not exhaustive due to data constraints; however,
the review accounts for the largest programs in terms of budget size. Current budget categories enable
considerable disaggregation of social assistance starting from aggregate expenditures, by type of
Ministry, type of social spending, and by specific programs.
In this analysis, transfers for veterans of the independence struggle are included in the social
assistance spending data. The government has a long-standing commitment to provide for veterans and
their families, enshrined in the 2002 Constitution.29 Though veteran transfers are intended in part to
reward those with long service in the resistance, and thus are not strictly social assistance expenditures,
political leaders in Timor-Leste have framed these transfers as part of the state’s efforts to address
poverty and vulnerability.30 A precedent exists for including veteran benefits in analyses of social
assistance.31 Veteran transfers in Timor-Leste are not, however, targeted to poor households and should
not be considered as an effective alternative to a targeted national anti-poverty program.
B. Macroeconomic Background
Timor-Leste has an unusual macroeconomic environment. It is in the early stages of a transition from
an oil-based to a non-oil based economy. Non-oil GDP growth averaged 11.6 percent in the last five
years and double-digit growth is expected to continue in the medium term. This growth is dominated by
public spending financed by oil revenues which are estimated to be US$ 1.7 billion in 2012, or 155
29
Relevant clauses include 11.3 and 11.4. 30
For example, then-President Jose Ramos-Horta was quoted in a 2007 interview in the Australian publication The Age as saying "I wish to inject as much money as possible into the rural economy to help the poor through simple, direct cash transfers to the elderly, widows and war veterans." (Aarons, M. 2007. “Timor’s Future: Xanana Gusmão and Jose Ramos-Horta”, The Age, accessed on 25 September 2012 on http://www.themonthly.com.au/monthly-essays-mark-aarons-timors-future-xanana-gusmao-and-jose-ramos-horta-591. President Ramos-Horta similarly included a message of the need for social pensions for veterans and other vulnerable groups as a poverty reduction method in a February 2009 speech to the UN Security Council (Ramos-Horta, J. 19 Feb 2009.“Timor-Leste, Challenges in Nation-Building and Peace Consolidation”, Address to the UN Security Council, accessed on 25 September 2012 at http://reliefweb.int/sites/reliefweb.int/files/resources/C15E104A9C8B291CC125756700344213-full_report.pdf). More recently, in a June 2012 campaign speech, Prime Minister Kay Rala Xanana Gusmão lamented the persistent poverty rates among Timor-Leste’s veterans. 31
For example, see World Bank social assistance public expenditure reviews of Albania (2005), Algeria (2000), Bosnia and Herzegovina (2000), Moldova (2005), and Serbia (2005).

32 | P a g e
Box 5: Measuring Economic Activity and Growth in Timor-Leste
Non-oil vs. oil GDP: Throughout this report, the authors refer to non-oil, rather than oil, GDP. Monitoring of economic activity and growth in Timor-Leste focuses on non-oil GDP, as this is a better proxy for income of the average Timorese than total GDP, which includes the oil sector.
There are almost no direct links from the petroleum sector to the rest of the economy. All petroleum production is off-shore and outsourced to foreign companies. Petroleum revenues flow into Timor-Leste’s off-shore petroleum fund, from which a portion is drawn through the government budget, benefiting the non-oil sector.
The recently published 2004-2010 National Accounts for Timor-Leste provide measures of both total and non-oil GDP. The dominance of oil sector GDP in total GDP (nearly 80% of total GDP in 2010) levels and growth is evident. However, the dominance of oil-sector GDP, which is subject to movements in the volume and price of oil produced, makes total GDP a volatile comparator.
Finally, the policy dialogue in Timor-Leste is focused on how to develop the non-oil economy in Timor-Leste as a sustainable revenue base when revenues from oil fields currently under production run out. Comparisons of public spending to non-oil GDP also provide a better measure of potential impact than comparisons to total GDP. (This is, however, not relevant for public spending on transfers, as these are not GDP augmenting.)
Estimated Sustainable Income + Domestic Revenues: The ESI, calculated on an annual basis, represents the amount that can be spent from the Petroleum Fund in a particular year without depleting its long-term balance. When combined with domestic revenues, this is a measure of the “estimated sustainable spending” for a given year.
percent of non-oil GDP. Oil revenues are expected through 2026 only and revenues are generally
expected to decline.
The government maintains a petroleum fund to secure revenues from petroleum development. All
revenues from petroleum development, including royalties and taxes, are deposited directly into the
Petroleum Fund. Each year, the National Parliament withdraws money from the Fund to make up
shortfalls in the State Budget and to invest in the development of Timor-Leste. An Estimated Sustainable
Income (ESI) is calculated on an annual basis; the ESI represents the amount that Timor-Leste can spend
from the Fund without depleting its long-term balance. Since 2008, the government has chosen to take
withdrawals in excess of the ESI from the Petroleum Fund to support high levels of capital expenditures.
This makes sense to the extent that developing highly-needed infrastructure for the non-oil economy
has a higher return on investment than interest rates on the petroleum fund. However, arguably not all
withdrawals in excess of ESI have been invested productively. If this pattern of high excess withdrawals
continues, it is likely the Petroleum Fund will be exhausted rapidly once new oil revenues cease. A
recent fiscal sustainability analysis undertaken by the National Directorate of Budget of the Ministry of
Finance (2011) shows that the Petroleum Fund and ESI would reach zero in 2026 if growth in
expenditure is not constrained and non-oil economic growth is below expectations. Even under a

33 | P a g e
scenario of high economic growth, strong domestic revenue growth, sharp cuts in capital expenditure
after 2016 and low recurrent maintenance costs, the model shows that recurrent expenditure (which
includes salaries and wages for civil servants, goods and services, and public transfers) will have to be
cut in real terms to achieve fiscal sustainability by 2022. These scenarios assume no new oil wells
beginning production.
Figure 4: Trends in Government Budget, Non-oil GDP, and ESI + Domestic Revenue
Source: World Bank staff calculations using RDTL government budget documents and Ministry of Finance
macroeconomic projections
Figure 5: Trends in monthly CPI and Recurrent as well as Total Expenditure
Source: ‘Analysis of Inflation in Timor-Leste’, February 2012, Ministry of Finance
0
200
400
600
800
1,000
1,200
1,400
1,600
1,800
2008 (rect) 2009 2010 (rect) 2011 2012
Mill
ion
s
non-oil GDP Total Government Budget ESI + Domestic Revenue

34 | P a g e
Figure 6: Association between CPI and recurrent Expenditure
Source: ‘Analysis of Inflation in Timor-Leste’, February 2012, Ministry of Finance
Dramatic increases in public expenditure have contributed to the steadily increasing inflation in
Timor-Leste. Inflation in the price of certain goods, in particular food, is disproportionately affecting
those in the poorest segment of the population who are not reached by any social assistance. Inflation
reached 17.7 percent in January of 2012 (measured as CPI in the capital, Dili) (World Bank, 2012) and a
recent brief by the Ministry of Finance shows a clear positive association between CPI and recurrent
expenditures (Figure 6). Such high rates of inflation, particularly in the price of staple foods, can
undermine the poverty-reducing effects of social assistance expenditures.
C. Levels and trends in aggregate public expenditures on social assistance
Timor-Leste’s substantial budget allocation to social assistance, and the diversity of programs funded,
reflects the multiple goals of social assistance in the country, though these have not yet been
articulated in a unified national social assistance policy. The Constitution emphasizes protection to
vulnerable groups, including the elderly, people with disabilities, and children, and is regularly raised by
political leaders and civil servants as a national priority and obligation.32 Natural and man-made
disasters force attention to social assistance to restore lost assets, provide for survival needs, and
maintain stability. With persistently high poverty rates, poverty reduction is a growing focus of Timor-
Leste’s social assistance efforts, though surprisingly, the government does not at present have national
poverty reduction targets.
32
A continuing policy of support for these vulnerable groups was reiterated by the Prime Minister in his speech presenting the program of the newly-elected Fifth Constitutional Government on 12 September 2012.

35 | P a g e
Box 6: The Budget Preparation Process
Timor-Leste’s fiscal year coincides with the calendar year. Though changes have recently been
made to the budget making process, as of the time of report writing, it was as follows:
The Government determines the “overall fiscal envelope” for the upcoming year, as well
as overall spending priorities. The Budget Office, located within the Ministry of Finance
(MOF), and then prepares a budget call circular outlining the budget process and
timetable.
The budget call is circulated to each Ministry, as a formal invitation to start preparing
budget submissions. Each Ministry prepares an Annual Action Plan, reflecting the
activities and objectives for the coming budget year, as well as a full package of budget
documentation. The Budget Office analyses each submission and prepares a brief for the
Budget Review Committee (BRC).
The BRC, consisting of the Prime Minister, Minister of Finance, and other senior Ministers
selected by the Prime Minister, reviews submissions and invites Ministries to defend their
submission. Based on the submissions and the overall fiscal envelope, the BRC forms a
proposed budget for submission to the Council of Ministers.
By 15 October, the BRC submits the budget to the National Parliament for review.
Parliamentary Commissions review relevant portions of the budget, accepting comments
from Ministers and other stakeholders, and prepare a report to Parliament. Parliament
debates the budget and, if desired, proposes amendments.
Once the budget is passed, the President of Parliament submits to the President of the
Republic for signature. The budget becomes law after promulgation in the Journal of the
Republic.
Source: Ministry of Finance, Summary of the Budget Process (2012)
Timor-Leste’s public expenditures on social assistance increased significantly beginning in 2008.
Figures 7 and 8 show trends in public expenditures on social assistance, which increased from US$ 109
million in 2008 to a projected US$ 160 million in the 2012 original budget.33 Though social assistance as
a share of non-oil GDP, and of combined Estimated Sustainable Income and domestic revenue, has
declined slightly from its 2010 peak of 17 percent and 25 percent respectively, it remains very high at
around 15 percent of non-oil GDP, and 20 percent of ESI and domestic revenue, in 2012.34
33
This figure reflects the amount budgeted for social assistance, rather than execution. Execution of the MSS transfer budget was 99 percent in 2009, falling slightly to 97 percent in 2010 and dropping to 74 percent in 2011 because of low rates of veteran payments budget execution. As of the second quarter of 2012 (latest data available), MSS transfer budget execution was 61.8 percent. 34
As depicted in the graphs, social assistance spending shifted from primarily non-MSS spending in 2008, to clear MSS-dominated social assistance as of 2011 and 2012. In part, this reflects the movement of the veteran transfers from the Ministry of Finance to MSS in 2009, and the reduction in spending on the Food Security Fund as of 2011, as the government stopped subsidization of rice.

36 | P a g e
Figure 7: Social assistance spending in absolute values
Figure 8: Social assistance spending as a share of ESI + Domestic Revenue
Source: World Bank staff calculations using Timor-Leste State Budgets 2008-2012.35
Total social assistance expenditure in Timor-Leste is approximately 9 percent of the national budget in
2012, more than that for any other sector apart from infrastructure. Budget allocations on social
assistance as a share of the national budget have actually declined since their peak in 2009, but this is
due to a five-fold increase in overall government expenditure in the past five years. In absolute terms,
the social assistance budget has continued to rise and is currently at an all-time high, though when the
budget for veteran transfers is excluded, the pattern is considerably more varied.36 Approximately three-
quarters of the social assistance budget is concentrated in MSS-delivered programs. In the 2012 original
budget, the MSS has been allocated 8 percent of the total budget, compared to 6 percent to the
Ministry of Education, 3 percent to the Ministry of Health, and 1 percent to the Ministry of Agriculture
and Fisheries (Figure 10).
35
“MSS Main” is an aggregate of the public transfer budget for the MSS Directorates that house the elderly, disability, Bolsa da Mãe, and veterans’ programs. “MSS Other” includes the private transfer budget for the remainder of the Ministry of Social Solidarity’s Directorates. For the “Non-MSS” category, spending on social protection cannot be surmised simply by using the “private transfer” category of the budget, because (particularly in the 2008 and 2009 budget years) this category included non-transfer spending, and some spending on private transfers was included under other budget categories. Therefore, the authors use the precise budget amount for the social protection programs studied, based on program documents and discussions with program staff. 36
Excluding veteran transfers, the social assistance budget envelope decreased slightly between 2009 and 2010, and fell by 46 percent between 2010 and 2011, before increasing by 47 percent in the 2012 budget year.
0
20
40
60
80
100
120
140
160
180
2008 rect. 2009 2010 rect. 2011 2012Soci
al A
ssis
tan
ce E
xp.
in $
mill
ion
s
MSS Other MSS Main (Ag3) Non-MSS (Ag4)
0%
5%
10%
15%
20%
25%
30%
2008 rect. 2009 2010 rect. 2011 2012
Exp
en
dit
ure
s as
sh
are
of
ESI+
Do
me
stic
Re
ven
ue
MSS Other MSS Main (Ag3) Non-MSS (Ag4)

37 | P a g e
Figure 9: Public spending on Social Assistance as a share of national budget
Source: World Bank staff calculations using RDTL State Budgets 2008-2012.
Figure 10: Spending by different sectors as a share of national Budget 2012
Source: Authors’ calculations using data from the RDTL State Budget 2012: Budget Overview (Book 1).
The composition of social assistance spending in Timor-Leste has not followed a clear, consistent
trajectory; while the budget for veteran transfers continues to expand, relative investment in Timor-
Leste’s `permanent’ social assistance programs has remained unchanged.37 The initial increase in social
37
The increase in the budget for veteran pensions is due largely to on-going approvals of pending applications.
0%
2%
4%
6%
8%
10%
12%
14%
16%
18%
20%
2008 2008 rect 2009 2010 rect 2011 2012 proj
Exp
en
dit
ure
as
a sh
are
of
nat
ion
al b
ud
get
MSS Other MSS Main (Ag3) Non-MSS (Ag4)
8%
6% 3%
9%
1% 1%
45%
27%
Ministry of Social Solidarity
Ministry of Education and Culture
Ministry of Health
Ministry of Infrastructure
Ministry of Ag and Fisheries
Secretary of State for ProfessionalTraining and Employment
Infrastructure Fund
Other
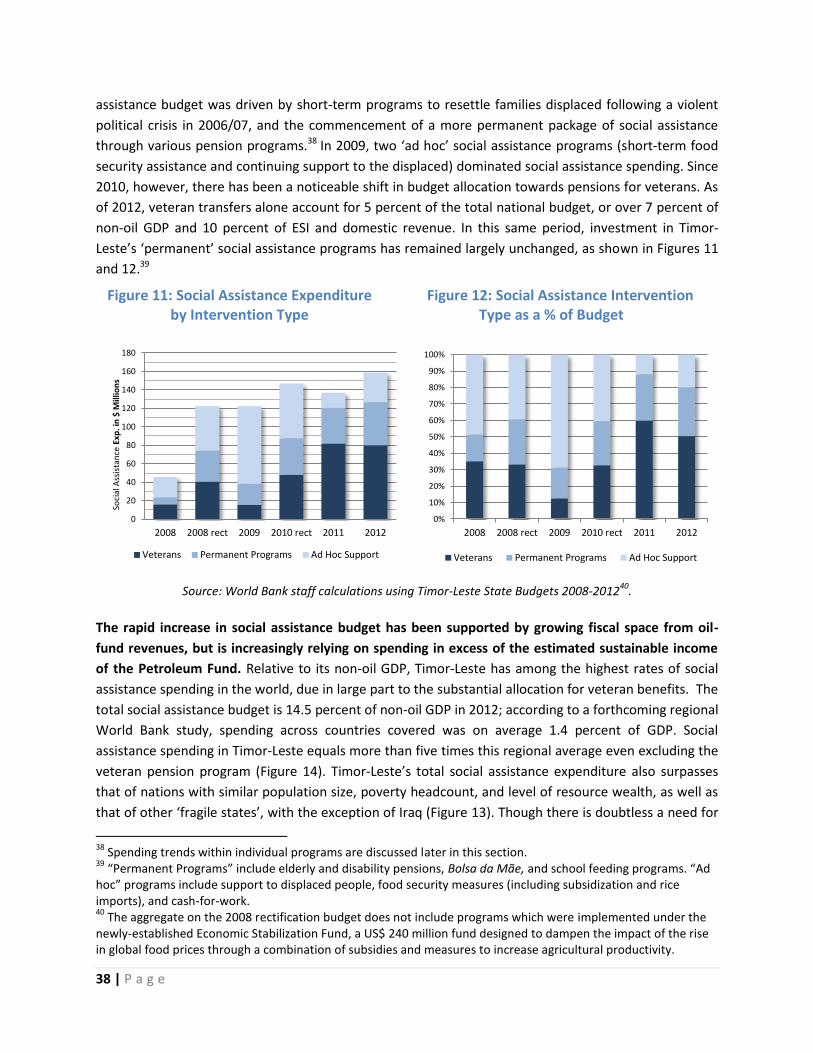
38 | P a g e
assistance budget was driven by short-term programs to resettle families displaced following a violent
political crisis in 2006/07, and the commencement of a more permanent package of social assistance
through various pension programs.38 In 2009, two ‘ad hoc’ social assistance programs (short-term food
security assistance and continuing support to the displaced) dominated social assistance spending. Since
2010, however, there has been a noticeable shift in budget allocation towards pensions for veterans. As
of 2012, veteran transfers alone account for 5 percent of the total national budget, or over 7 percent of
non-oil GDP and 10 percent of ESI and domestic revenue. In this same period, investment in Timor-
Leste’s ‘permanent’ social assistance programs has remained largely unchanged, as shown in Figures 11
and 12.39
Source: World Bank staff calculations using Timor-Leste State Budgets 2008-201240
.
The rapid increase in social assistance budget has been supported by growing fiscal space from oil-
fund revenues, but is increasingly relying on spending in excess of the estimated sustainable income
of the Petroleum Fund. Relative to its non-oil GDP, Timor-Leste has among the highest rates of social
assistance spending in the world, due in large part to the substantial allocation for veteran benefits. The
total social assistance budget is 14.5 percent of non-oil GDP in 2012; according to a forthcoming regional
World Bank study, spending across countries covered was on average 1.4 percent of GDP. Social
assistance spending in Timor-Leste equals more than five times this regional average even excluding the
veteran pension program (Figure 14). Timor-Leste’s total social assistance expenditure also surpasses
that of nations with similar population size, poverty headcount, and level of resource wealth, as well as
that of other ‘fragile states’, with the exception of Iraq (Figure 13). Though there is doubtless a need for
38
Spending trends within individual programs are discussed later in this section. 39
“Permanent Programs” include elderly and disability pensions, Bolsa da Mãe, and school feeding programs. “Ad hoc” programs include support to displaced people, food security measures (including subsidization and rice imports), and cash-for-work. 40
The aggregate on the 2008 rectification budget does not include programs which were implemented under the newly-established Economic Stabilization Fund, a US$ 240 million fund designed to dampen the impact of the rise in global food prices through a combination of subsidies and measures to increase agricultural productivity.
Figure 11: Social Assistance Expenditure by Intervention Type
Figure 12: Social Assistance Intervention Type as a % of Budget
0
20
40
60
80
100
120
140
160
180
2008 2008 rect 2009 2010 rect 2011 2012
Soci
al A
ssis
tan
ce E
xp. i
n $
Mill
ion
s
Veterans Permanent Programs Ad Hoc Support
0%
10%
20%
30%
40%
50%
60%
70%
80%
90%
100%
2008 2008 rect 2009 2010 rect 2011 2012
Veterans Permanent Programs Ad Hoc Support

39 | P a g e
substantial social assistance investment in Timor-Leste to address high rates of poverty, the current level
of spending raises questions about long-term fiscal sustainability and poverty impact of the current
program mix.
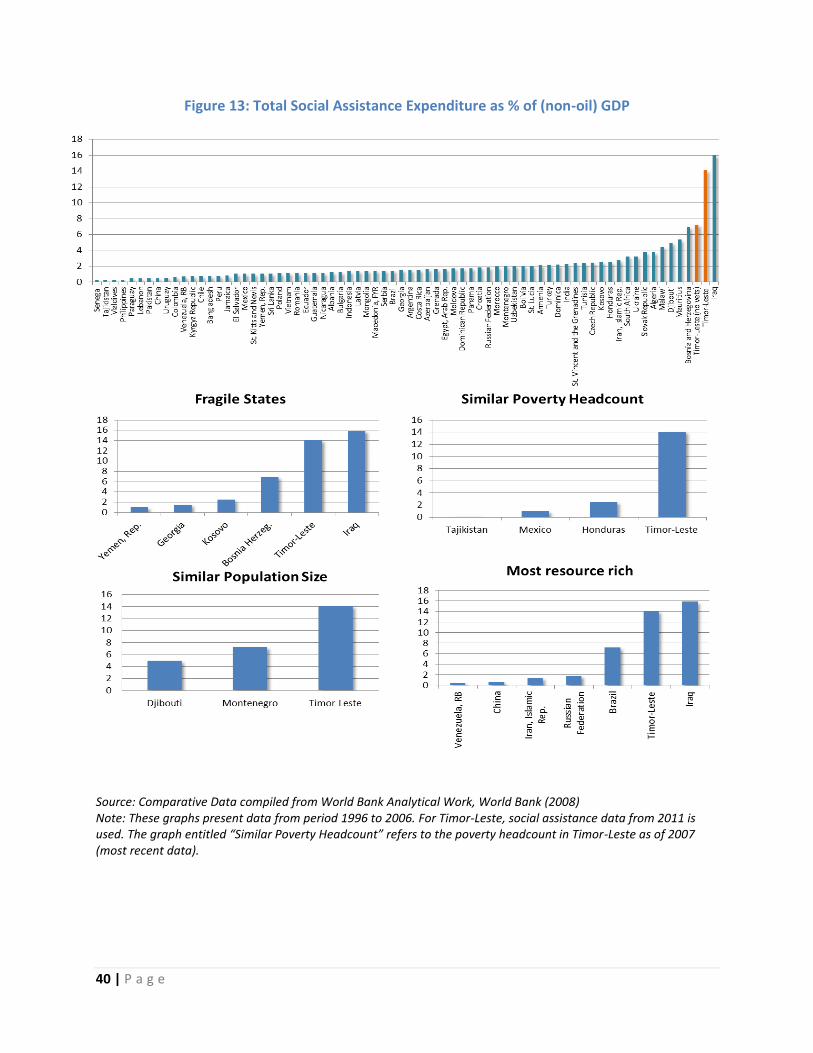
40 | P a g e
Figure 13: Total Social Assistance Expenditure as % of (non-oil) GDP
Source: Comparative Data compiled from World Bank Analytical Work, World Bank (2008) Note: These graphs present data from period 1996 to 2006. For Timor-Leste, social assistance data from 2011 is used. The graph entitled “Similar Poverty Headcount” refers to the poverty headcount in Timor-Leste as of 2007 (most recent data).

41 | P a g e
Figure 14: Social Assistance spending as a share of national budget across the Region
Source: ‘A unique and diverse region: Taking stock of Social Assistance Performance in East Asia and Pacific’, World Bank 2012
D. Expenditure trends within social assistance sector
There has been considerable variability in the budget for social assistance programs since 2008,
though there is a trend towards concentration of funding in several large programs. Figure 15 (next
page) shows trends in absolute spending of the biggest programs in the past four years. In 2009, the
Food Security Fund consumed the largest share of central social assistance expenditures, peaking at US$
40 million before steadily declining to US$ 9 million in 2012. Transfers to Internally Displaced People
under the National Directorate for Social Assistance (DNAS) accounted for US$ 33 million in 2009, but
DNAS funding declined drastically after the displaced were resettled in 2010; transfer funding for a
variety of DNAS humanitarian programs is just US$ 0.9 million in 2012. The budget for veteran payments
increased dramatically since 2009 with increases in new approvals for eligibility; moreover, it is
estimated that well over 100,000 applicants are still awaiting verification of their status (International
Crisis Group, 2011).41 In 2012, the budget for veterans’ pensions absorbs over half of total social
assistance expenditure in Timor-Leste. Three remaining MSS-managed programs – elderly and disability
pensions, and Bolsa da Mãe – consume an additional 24 percent of the 2012 social assistance budget.
Cash-for-work programs, which have previously been implemented with heavy donor support and
funding, have experienced variations in budget; the 2012 budget for public works programs is almost
41
It is unlikely that many of these applications will be approved, but the further budget increases are expected as the verification process for veteran status continues.
0%
1%
2%
3%
4%
5%
6%
7%
8%
9%
10%
Thailand(2010)
Philippines(2009)
Indonesia(2010)
Malaysia(2009)
Timor-Leste(2012)
Timor-Leste(2012
includingveterans)

42 | P a g e
US$ 21 million, or 13 percent of the social assistance budget in 2012. The remaining social assistance
expenditures are shared by at least four public institutions, as shown in Table 6. 42
Figure 15: Absolute trends in largest Social Assistance Programs
Source: World Bank staff calculations using RDTL State Budgets 2008-2012
Table 6: Budget for Social Assistance by Program43
Central Government Social Assistance Budget by program (in USD, and as a % of
overall government budget)
2008 (rect) 2009 2010 (rect) 2011 2012
Ministry of Social
Solidarity: Directorate
for Social Reinsertion
(Primarily Bolsa da Mãe
and child protection)
1,400,000
(0.2%)
2,650,000
(0.4%)
5,025,000
(0.6%)
2,362,000
(0.2%)
2,970,000
(0.2%)
42
This is likely a low estimate. The social assistance programs analyzed in this report, as described in Table 8, include only large and well-known sources of social assistance. Smaller programs (e.g., scholarship programs, overseas medical treatment, price subsidies) are implemented by a large number of Ministries and government agencies and are not captured here. 43
Programs explained in the Annex 1.
0
10
20
30
40
50
60
70
80
90
2009 2010 (rect) 2011 2012
Pu
blic
Exp
en
dit
ure
in $
Mill
ion
s
Transfers from DNRS (Primarily Bolsa da Mae)
Transfers from DNAS (Formerly IDP resettlement, now wider social and humanitarian support)
Transfers from DNSS (Primarily Elderly and Disability Pensions)
Transfers from DNACLN (Primarily Veteran Pensions)
Cash for Work (Secretary of State for Vocational Training and Employment)
Food Security Fund (Ministry of Tourism, Commerce and Industry)
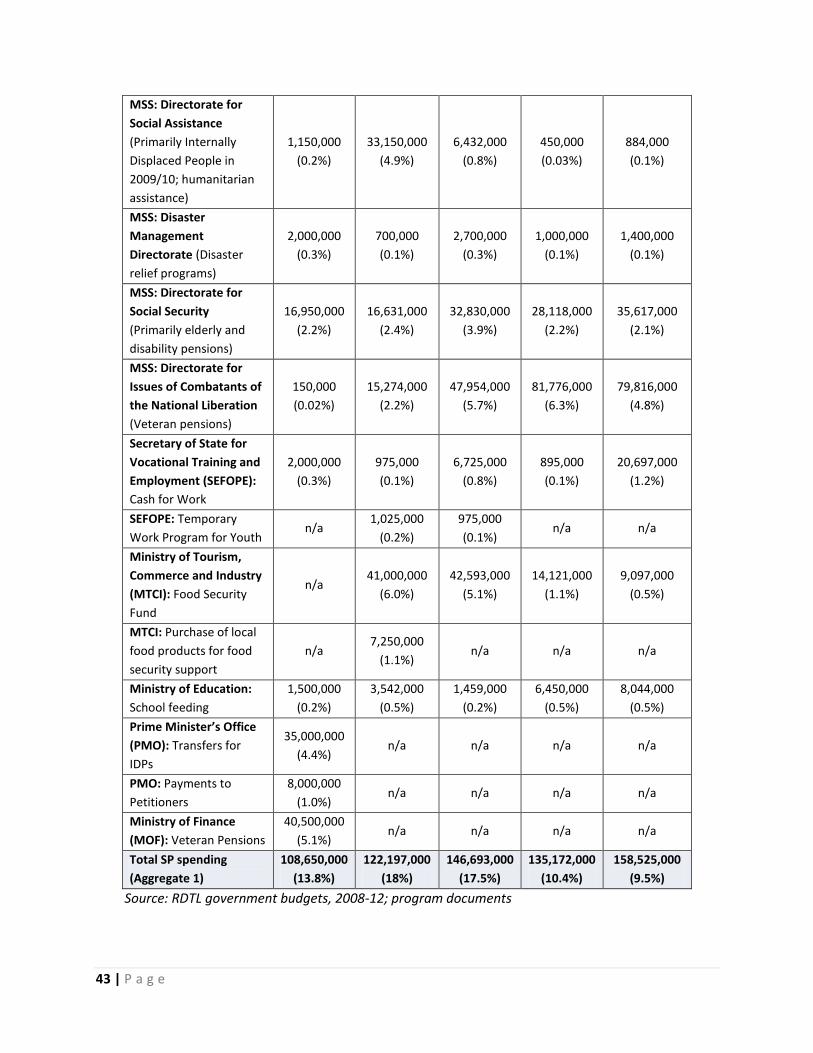
43 | P a g e
MSS: Directorate for
Social Assistance
(Primarily Internally
Displaced People in
2009/10; humanitarian
assistance)
1,150,000
(0.2%)
33,150,000
(4.9%)
6,432,000
(0.8%)
450,000
(0.03%)
884,000
(0.1%)
MSS: Disaster
Management
Directorate (Disaster
relief programs)
2,000,000
(0.3%)
700,000
(0.1%)
2,700,000
(0.3%)
1,000,000
(0.1%)
1,400,000
(0.1%)
MSS: Directorate for
Social Security
(Primarily elderly and
disability pensions)
16,950,000
(2.2%)
16,631,000
(2.4%)
32,830,000
(3.9%)
28,118,000
(2.2%)
35,617,000
(2.1%)
MSS: Directorate for
Issues of Combatants of
the National Liberation
(Veteran pensions)
150,000
(0.02%)
15,274,000
(2.2%)
47,954,000
(5.7%)
81,776,000
(6.3%)
79,816,000
(4.8%)
Secretary of State for
Vocational Training and
Employment (SEFOPE):
Cash for Work
2,000,000
(0.3%)
975,000
(0.1%)
6,725,000
(0.8%)
895,000
(0.1%)
20,697,000
(1.2%)
SEFOPE: Temporary
Work Program for Youth n/a
1,025,000
(0.2%)
975,000
(0.1%) n/a n/a
Ministry of Tourism,
Commerce and Industry
(MTCI): Food Security
Fund
n/a 41,000,000
(6.0%)
42,593,000
(5.1%)
14,121,000
(1.1%)
9,097,000
(0.5%)
MTCI: Purchase of local
food products for food
security support
n/a 7,250,000
(1.1%) n/a n/a n/a
Ministry of Education:
School feeding
1,500,000
(0.2%)
3,542,000
(0.5%)
1,459,000
(0.2%)
6,450,000
(0.5%)
8,044,000
(0.5%)
Prime Minister’s Office
(PMO): Transfers for
IDPs
35,000,000
(4.4%) n/a n/a n/a n/a
PMO: Payments to
Petitioners
8,000,000
(1.0%) n/a n/a n/a n/a
Ministry of Finance
(MOF): Veteran Pensions
40,500,000
(5.1%) n/a n/a n/a n/a
Total SP spending
(Aggregate 1)
108,650,000
(13.8%)
122,197,000
(18%)
146,693,000
(17.5%)
135,172,000
(10.4%)
158,525,000
(9.5%)
Source: RDTL government budgets, 2008-12; program documents

44 | P a g e
E. Social Assistance Expenditures: Looking Forward
As discussed earlier in this section, social assistance in Timor-Leste serves multiple purposes. Though
poverty reduction is an implicit aim across each of the social assistance programs summarized in the
preceding paragraphs, only Bolsa da Mãe is explicitly targeted towards poor and vulnerable households.
In some cases, important political economy concerns drove allocation of social assistance; most notably
with cash transfers for internally displaced persons, which were designed to promote social stability in a
period immediately following the crisis, though funding was also intended to replace and repair
damaged assets.
The legacy of Timor-Leste’s disparate social assistance goals, coupled with the lack of an overriding
social assistance policy vision, is a comparatively high level of social assistance spending but with an
underdeveloped safety net system. A coherent safety net system would contribute to improvements in
efficiency of program implementation, enhance coverage (particularly for the most poor), and improve
responsiveness to many of the risks, both manmade and natural, that have previously caused spikes in
social assistance spending in Timor-Leste (World Bank, 2012b). Such a system would increase the
effectiveness of the current social assistance spending, which is designed to promote resilience against
the negative impact of shocks such as disability or old age. At the same time, an effective safety net
system would identify areas where resources could best be directed in order to address chronic poverty
and promote human capital development.
As the budget envelope for social assistance begins to decline due to the need to shrink recurrent
expenditure, there is a risk that the significant proportion of the budget devoted to protection for
special groups (e.g., veterans, the elderly) may limit the budget available for poverty reduction. The
number of elderly in Timor-Leste is expected to grow by approximately 10,000 individuals between now
and 2025; even without a change in the elderly pension benefit to keep it in line with inflation, this
implies an additional investment of up to several million each year for elderly pensions. In time, this
program is intended to become a social pension to provide minimum protection against old-age poverty,
specifically for informal sector workers. Retirees in the civil service and private sector will be covered
under a new entitlement program, the recently approved contributory worker’s pension.44 Though this
system will rectify an important gap in Timor-Leste’s social assistance framework, the worker’s pension
will also entail new financial liabilities, the most substantial of which will come on board after petroleum
revenues have tailed off. In its current form, the worker’s pension is estimated to have a real cost of
approximately 20 percent of payroll, some portion of which will be borne by the government.45
Payments for veterans and their survivors will also continue to represent a substantial financial outlay. If
44
The recently-passed pension scheme prioritizes creation of a civil service pension, with plans to expand coverage to the private sector beginning in 2015. 45
Wiener, Mitch (June 2012), Financial Analysis for the Temporary Social Security Regime Regarding Old Age, Disability and Death for State Workers in Timor-Leste, unpublished draft.

45 | P a g e
even a fraction of the current backlogged applications for veteran benefits are found to be valid, this
could lead to an increase of tens of millions in yearly veteran pension payments.46
Over the next five years, Timor-Leste will thus face a substantial challenge to create an adequate
safety net which protects the vulnerable, prevents declines into poverty, and provides better
opportunities to move out of poverty while keeping budget growth in check. Due in part the post-crisis
imperative, long-term budgetary implications were not a major factor in determining the current mix of
social assistance programs. While this has allowed for wide political support, rapid response to emerging
needs, and experimentation, this comes with the risk of entrenching entitlements that will become
increasingly difficult to meet. In preparing for a likely stagnation in budget growth over the next five
years, government will need to make important choices about prioritization among social assistance
goals, and between social assistance and other national priorities. Chapter 5 will discuss the impact of
the current mix of social assistance programs in Timor-Leste, and how the country’s social assistance
resources might be used to bring about clear, measurable gains in poverty reduction and increases in
opportunity.
46
Timor-Leste’s Ministry of Finance is currently undertaking an analysis and projection of the cost of veteran benefits over time.

46 | P a g e
Chapter 5: Assessing performance of individual
programs
This chapter examines the performance of social assistance through the lenses of targeting, equity
and adequacy of the main cash transfer programs. This chapter presents the first detailed household
level diagnostic of Bolsa da Mãe transfers, elderly, disability and veteran pensions with a focus on: (i)
targeting accuracy across eligible groups (ii) share of population receiving benefits by expenditure
quintiles, and (iii) generosity of the transfer in proportion to the beneficiary households’ total
expenditures. To achieve these objectives the analysis relies on the first Timor-Leste Social Protection
Survey (see Box 7).
A. Targeting Performance
What is the relative size of the main programs ranked by the share of population affected? Coverage
of population by social assistance programs in Timor-Leste varies considerably. Size of the program is
one of the key factors that will affect the scale of national poverty relief. The TLSPS provides in-situ
information about household participation, indicating how much of the population is affected directly
and indirectly. The results, presented in Figure 16, show that 33 percent of the population was
benefiting from at least one of the programs. Most of this incidence can be attributed to the universal
elderly pension that affected 29 percent of the population. 47 The size of the other programs tends to be
47
Every individual living in a household where at least one household member receives benefits is treated as affected by that social assistance program.
Box 7: The Timor-Leste Social Protection Survey (TLSPS)
In 2011, the government of Timor-Leste (Ministry of Finance, National Directorate of Statistics and
Ministry of Social Solidarity) in collaboration with the World Bank, conducted the first Timor-Leste
Social Protection Survey to obtain data on the welfare of Timorese households and effectiveness of
current social assistance programs. The survey is nationally representative and covered all districts.
In total, 2083 households from Timor-Leste’s thirteen districts were interviewed. The survey was
designed to assess the initial experience of the “Bolsa da Mãe”, Elderly Pension as well as Disability
Pension programs including their socialization, population coverage and participation, profiling of
beneficiaries as well as the experience of accessing the programs. In addition, the survey collected
information about shocks and vulnerabilities, disability and health status. Participants according to
the survey data are defined as those that reported receiving cash transfers from the main programs
in the 12 months prior to the survey visit. It should be noted that TLSPS was designed to be merged
with the 2011 Household Income and Expenditure survey (HIES). The households who had received
the HIES questionnaire were revisited by the TLSPS team about 2-4 weeks later to administer the
TLSPS questionnaire. This enables extensive analysis using the welfare information collected by the
HIES.

47 | P a g e
very small; Bolsa da Mãe and the disability pension affect around 2.2 percent and 2.3 percent of the
population, respectively.48 The direct number of beneficiaries is also reported in Table 7 using
administrative data, and shows that in 2011, as a share of all cash transfer beneficiaries, elderly
pensioners account for 74 percent, compared to Bolsa da Mãe and veterans which was 12 and 10
percent respectively.
Figure 16: Percentage of population affected by different programs
Source: Timor-Leste Social Protection Survey, 2011
Table 7: Direct numbers of beneficiaries according to administrative records for the main programs
Number of Beneficiaries 2009 2010 2011 2012
Bolsa da Mãe 8,723 13,458 13,908 15,000
Elderly pensions 72,675
83,645 84,623 84,569
Disability pension 4,154 5,539 5,558
Veteran pension 3,976 9,102 10,953 27,960
Total Beneficiaries 89,374 110,359 115,023 133,087
Source: Ministry of Social Solidarity, 2012
Is social assistance reaching the intended beneficiaries?
There are a number of approaches for directing cash transfers to a particular group, usually based on an
assessment of categorical eligibility – by age, disability or household head’s gender; or means tests –
48
The government is currently in the process of changing the targeting procedure for Bolsa da Mãe. The review team’s assessment occurred in this transition stage and covers the old implementation of Bolsa da Mãe.
2%
29%
2% 2%
33%
0%
5%
10%
15%
20%
25%
30%
35%
Bolsa da Mae Elderly Pension Disability Pension Veteran Pension At least one SAprogram
(excluding veteranpensions)

48 | P a g e
based on verification of household income. Alternatively, one can use proxy means tests, a statistical
technique used to impute household income from a set of easily observable characteristics when
income is difficult to measure. As a general rule, in low income countries, categorical and proxy means
eligibility tests are more common than direct income verification due to weaker administrative
capacities and high levels of informality in labor markets.
MSS cash transfer programs are mostly categorical, with the exception of Bolsa da Mãe, and are not
designed to target poor households. The current safety nets programs in Timor-Leste are targeted to
specific groups such as the elderly and disabled, war veterans and vulnerable households with children.
The advantage of this approach is that it is easier to identify and verify eligibility, and administrative
costs are lower. However, while these groups may overlap with poverty, the association may not be
perfect and it may leave a significant proportion of poor households unprotected while including many
non-poor households. The challenge is to strike the right balance among groups to serve while
minimizing the extent of coverage gaps among the poorest population.
Which households are receiving elderly, disability pensions or Bolsa da Mãe benefits? Are transfers
reaching the intended beneficiaries?49 For any social assistance program, a central concern is the extent
to which the programs are reaching the intended beneficiaries. The effectiveness of social programs is
often measured by the accuracy in reaching the eligible households. The target groups of interest
selected for this analysis are informed by program objectives, and include the elderly and disabled. The
analysis relies on explicit program eligibility rules to assess the program specific targeting performance,
by estimating exclusion and inclusion errors. Exclusion error measures the proportion of eligible
individuals who did not receive benefits among the eligible population, while inclusion error is
calculated as the proportion of ineligible beneficiaries who received the benefit.
The elderly pension program is relatively well targeted. According to the eligibility rules of the universal
elderly pension, everyone from age 60 upwards is entitled to the elderly pension benefit50 (unless they
are already receiving a veteran benefit), and the program is widely socialized.51 According to Table 8,
which displays the national exclusion error, 13 percent of the eligible population claimed not to be
receiving the pension.52 The inclusion error appears remarkably low; only 0.2 percent of non-elderly
received a pension. This is a noteworthy achievement in a country faced with challenging circumstances
for transferring payments, and low institutional capacity for operational support.53
49
What are the average characteristics of households that receive the transfers? After controlling for a variety of socio-economic factors we find that participation is significantly more likely for households that are eligible. There is no definitive pattern in regression coefficients indicating that transfers are focused on households with other specific characteristics. 50
To prevent double dipping elderly beneficiaries of veteran pensions are not eligible for the social pension. 51
As discussed in Chapter 7, constraints in documentation and administrative records mean that age is not as easily verified as in other countries. 52
Survey respondents had to show their ID verifying age, but simply report the ages of all other household members. 53
Although the TLSPS indicates relatively low exclusion and inclusion errors among pension recipients, there is some suggestive evidence about age misrepresentation using fraudulent IDs. As discussed in Chapter 7 (Figure 27) there was a significant and unexplained jump in the cohort size that became 60 years of age in 2010 Census

49 | P a g e
Table 8: Targeting of Elderly Pension
Age 60+ Age <60
Reported receiving pension benefit 87.4% of 60+ 0.2% of <60
Reported not receiving pension benefit 12.6% of 60+ 99.8% of <60
Source: Timor-Leste Social Protection Survey, 2011
The elderly pension targeting performance varies by residence, as a higher number of eligible people
were excluded in urban areas (18.7 percent) than in rural areas (11.6 percent). Exclusion error also
drastically varies between districts: low in the east of the country (2 percent in Lautem, 7 percent in
Baucau), 15 percent in Dili, and highest in the western areas (26 percent in Ainaro and 27 percent in
Covalima).
A large proportion of the eligible population is not benefiting from the disability pension. Table 9
displays targeting performance, showing that 86 percent of persons with disabilities do not receive the
disability pension. To evaluate the targeting of disability pensions, the report relies on self-reported
disabilities from the TLSPS 2011. Disability was measured based on functional limitations - being
completely unable or having a lot of difficulty in seeing, hearing, walking, self-care or communicating.
This definition uses a high severity threshold and is a lower bound estimate of a more moderate
definition for disability prevalence. According to this definition, the disability prevalence rate is 3.6
percent in Timor-Leste. This is lower than the 4.6 percent estimate based on the Timor-Leste Census
(2010). It is also much lower than the 10-12 percent rates suggested by some recent estimates (Mont,
2007) for developing countries (namely Brazil, Ecuador, India, Nicaragua and Vietnam), or the United
Nations (2011) cited figure of 15 percent.
Table 9: Targeting of Disability Pension
Disabled Not Disabled
Receiving disability benefit 14.2% of Disabled 0.54% of Not Disabled
Not receiving disability benefit 85.8% of Disabled 99.46% of Not Disabled
Source: Timor-Leste Social Protection Survey, 2011 Note: Includes individuals above the age of 17, since eligibility criteria require someone to be 18+ to
qualify for a disability pension.
compared to the size of the same cohort in 2004 Census. Disproportional immigration of older population to Timor-Leste is a plausible explanation for this cohort size increase but is improbable. Therefore the survey based inclusion error might understate the true extent of the inclusion error if age was also misrepresented in this survey.

50 | P a g e
B. Equity
In Timor-Leste, there were important socio-political motives for the introduction of cash transfers that
were not exclusively linked to poverty reduction objectives. However, the focus of the following
assessment is narrower: to assess whether the benefits reach the population in the bottom 40 percent,
and inform the broader issue of what social protection improvements are required for Timor-Leste to
protect its poorest. Among Timor-Leste’s programs, only Bolsa da Mãe requires poverty as an eligibility
requirement. The elderly pension is universal and given to everyone above the age of 60, the disability
pension is targeted at the disabled who are incapable of working, and veteran pensions are given to
veterans from the independence struggle. This section evaluates equity of current safety nets by
assessing to what extent benefits are reaching the lowest expenditure groups.
Despite the expansive social assistance spending, benefits from Timor-Leste’s four main cash transfer
programs (elderly, disabled, Bolsa da Mãe, and veterans) are not reaching a large proportion of the
bottom 40 percent. Table 10 presents the evidence that there are considerable gaps in coverage; 61
percent of the bottom two quintiles and 56 percent of the poorest 20 percent are not receiving any
assistance from the main cash transfer programs. Concurrently, social assistance reached 23 percent of
the population in the richest quintile. While overall coverage rates are highest among the poorest
quintile, there is considerable variation in coverage across the three main programs. Among the poorest
20 percent of the population, coverage rates are highest for elderly pensions (39 percent), but very low
for other programs. Bolsa da Mãe and disability pension coverage rates of the bottom quintile of the
population are 3.2 and 3.6 percent respectively; the figure for veteran pensions is 2.3 percent.
Table 10: Share of people covered by each program by consumption group (Direct and indirect beneficiaries) 54
1
st Quintile 2
nd Quintile 3
rd Quintile 4
th Quintile 5
th Quintile
Monthly average real per capita consumption in US$
19.8 28.0 35.5 45.7 75.0
Bolsa da Mãe 3.2 3.2 3.1 0.8 0.9
Elderly Pension 39.3 33.5 26.4 25.0 21.0
Disability Pension 3.6 3.1 0.9 2.2 1.7
Veteran Pension55
2.3 1.0 2.2 1.5 1.9
All social assistance (excluding Veteran
43.9 38.8 30.3 29.1 23.0
54
Direct beneficiaries are the recipients of the transfers who themselves obtained the benefit. Indirect beneficiaries include other members of a household in which at least one member received the transfer. 55
For the other three programs reported positive payment amounts are used to define participation. Since the questionnaire does not ask for payments received from veteran pensions, here the question on whether someone does participate in the program is used to determine participation and coverage.

51 | P a g e
Pensions)
Source: Timor-Leste Social Protection Survey, 2011
Notes: Quintiles of household per capita using pre-transfer level of expenditure (In the case of veterans, post-transfer consumption is used). Program coverage is the portion of population in each group that receives the transfer.
Another way to view benefit incidence is to ask about the share of the lowest-expenditure groups as a
proportion of all social assistance beneficiaries. Table 11 presents the share of households (as a
proportion of all beneficiaries) receiving transfers, ranked from the poorest to richest groups, using
quintiles of expenditure. Households that fell in the poorest group (bottom 20 percent) accounted for 27
percent of all beneficiaries, compared to 14 percent accounted for by the richest group (top 20 percent).
Figure 17 demonstrates that in comparison to other countries in the East Asia and Pacific region, Timor-
Leste’s performance is average. In Malaysia and Cambodia, coverage rates of the poor population are 54
and 49 percent respectively. An examination of the remaining expenditure quintiles shows that about
half of all participants are drawn from the poorest 40 percent of the population, indicating that benefits
are only moderately pro-poor, as half of all the beneficiaries are from higher quintiles (top 60 percent).
This pattern is remarkably similar across all the three programs. This is equivalent to 56 percent of the
budget share of the main three programs going to the top 50 percent and 44 percent going to the
bottom 50 percent. Therefore, not only is the majority of the poorest population not covered by these
programs, but a sizable share of spending goes to the wealthiest households, reflecting the significantly
larger volume of categorical over mean-tested benefits among Timor-Leste’s social assistance programs.
Table 11: How well off are the beneficiaries? - Proportion of recipients within expenditure quintiles (%)
Total per capita expenditure
Poorest 20% 2nd
Quintile 3rd
Quintile 4th
Quintile Richest 20%
Bolsa da Mãe 31.7 27.5 27.2 5.7 7.9
Elderly Pension 26.7 23.8 17.1 18.0 14.5
Disability Pension 30.8 32.5 2.7 19.5 14.6
All social assistance (excluding Veteran Pension)
26.7 23.9 17.4 17.7 14.4
Source: Timor-Leste Social Protection Survey, 2011
Notes: Quintiles of household per capita using pre-transfer level of expenditure. Beneficiaries’ incidence shows the proportion of beneficiaries in each expenditure group.

52 | P a g e
Figure 17: Percent of Beneficiaries in the poorest 20 percent
Source: ‘A unique and diverse region: Taking stock of Social Assistance Performance in East Asia and Pacific’, World Bank 2012
Timor-Leste spends disproportionately more resources on adults than on children, despite higher
prevalence of households with children among the poorest groups. Elderly and disability pensions
received a budget of over US$ 35 million in 2012, whereas the only program targeted at families with
children received less than one-tenth of this amount. Households with more than four children under
the age of 16 make up 40 percent of the bottom two quintiles.
The elderly pension in Timor-Leste reaches more of its elderly than its poorest. It is useful to examine
how other countries weigh social concerns for the poorest population versus concerns for the elderly
population. Figure 18 shows the ratio of the 60+ population reached by transfers, to the share of people
in the bottom 40 percent reached by social assistance programs. Countries with values greater than 1
for such a ratio can be seen to be more pro-old than pro-poor in the distribution of their transfers. As
was shown in Table 8, in Timor-Leste 87.4 percent of the elderly receive transfers through the elderly
pension. On the other hand, only 40.2 percent of the poorest 40 percent are covered by one of the three
main cash transfer programs. Thus, the ratio presented in Figure 18 would be around the magnitude of
2.17 for Timor-Leste, placing it in the five most pro-old countries listed.
54.0% 49.1% 47.0%
29.5% 26.5% 26.5% 25.7%
22.9% 20.5%
0%
10%
20%
30%
40%
50%
60%
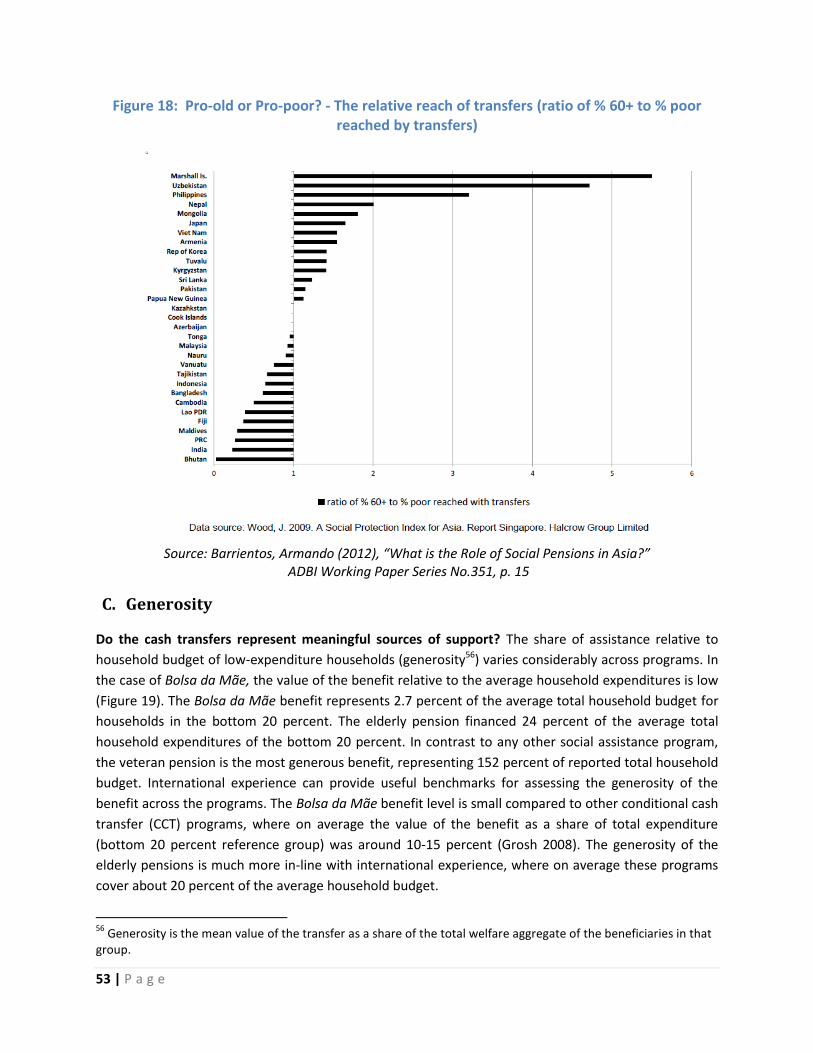
53 | P a g e
Figure 18: Pro-old or Pro-poor? - The relative reach of transfers (ratio of % 60+ to % poor reached by transfers)
Source: Barrientos, Armando (2012), “What is the Role of Social Pensions in Asia?”
ADBI Working Paper Series No.351, p. 15
C. Generosity
Do the cash transfers represent meaningful sources of support? The share of assistance relative to
household budget of low-expenditure households (generosity56) varies considerably across programs. In
the case of Bolsa da Mãe, the value of the benefit relative to the average household expenditures is low
(Figure 19). The Bolsa da Mãe benefit represents 2.7 percent of the average total household budget for
households in the bottom 20 percent. The elderly pension financed 24 percent of the average total
household expenditures of the bottom 20 percent. In contrast to any other social assistance program,
the veteran pension is the most generous benefit, representing 152 percent of reported total household
budget. International experience can provide useful benchmarks for assessing the generosity of the
benefit across the programs. The Bolsa da Mãe benefit level is small compared to other conditional cash
transfer (CCT) programs, where on average the value of the benefit as a share of total expenditure
(bottom 20 percent reference group) was around 10-15 percent (Grosh 2008). The generosity of the
elderly pensions is much more in-line with international experience, where on average these programs
cover about 20 percent of the average household budget.
56
Generosity is the mean value of the transfer as a share of the total welfare aggregate of the beneficiaries in that group.

54 | P a g e
Figure 19: Generosity of social assistance
Source: Timor-Leste Social Protection Survey, 2011
Note: Generosity is the mean value of the transfer received divided by total household expenditure. This
share is calculated separately for the bottom 20% expenditure group and for the general population.
* The calculation for veteran pensions based on official benefit structure but weighted by actual
beneficiary population (US$ 3187 per year) from administrative records, since benefit amounts for
veterans were not recorded in the TLSPS, 2012.
The program-specific transfer amounts can also be compared to other indicators that contrast the
benefit adequacy against the economic situation and appropriateness for Timor-Leste. These
indicators include the average wage, per capita GDP and the 40 percent consumption line (Figure 20).
Veterans’ transfers are a very large source of income, estimated to be over 426 percent of the per capita
non-oil GDP, 241 percent of average wage and 838 percent of the consumption line of the poorest
groups. The elderly pension and Bolsa da Mãe account for 44 percent and for 10 percent of per capita
non-oil GDP respectively.
3.5%
23.8% 13.8%
136.9%
2.7%
13.2% 7.9%
96.8%
0%
20%
40%
60%
80%
100%
120%
140%
160%
Bolsa da Mae Elderly Pension Disability Pension Veteran Pensions*
Generosity to Poorest Quintile Generosity over whole population

55 | P a g e
Figure 20: Relative size of annual benefits of the main cash transfer programs
Source: Timor-Leste Social Protection Survey, 2011 and Labor Force Survey, 2010
Note: 2010 GDP per capita was US$ 810, according to IMF Country Report No. 12/24, February 2012.
How do households use the social assistance transfers? Table 12 shows that most households use
transfers on essential consumption. Most of the Bolsa da Mãe households reported that they spend the
benefit on education and health expenses, which is consistent with the conditionality imposed by the
program. Elderly pension transfers are largely spent on food, and education; disability transfers are
primarily spent on food.
Table 12: Primary use of social assistance benefits as reported by households (in percent)
Food Health Education Purchase of Livestock or Assets
Other
Bolsa da Mãe 0.0 6.0 91.1 0.0 2.9
Elderly Pension 88.4 13.4 28.1 6.4 10.7
Disability Pension
77.9 7.6 5.0 4.3 5.1
Source: Timor-Leste Social Protection Survey, 2011
10% 44% 44%
426%
6% 28% 28%
241%
21% 94% 94%
838%
Bolsa da Mae Disability Pension Elderly Veteran Pension
Ratio of benefit to non-oil GDP
Ratio of benefit to average wage
Ratio of benefit to the 40% consumption line

56 | P a g e
Chapter 6: Welfare impacts of social assistance in Timor-
Leste
What is the welfare impact of Timor-Leste’s expansive spending on social assistance? Poverty is a key
concern of the government of Timor-Leste, which raises an important question of effectiveness of social
programs in averting poverty. In 2011, the Timor-Leste government allocated US$ 112 million on the
main MSS cash transfer programs that reached over 30 percent of the population. On average, this is
equal to US$ 892 per beneficiary, or three times the monetary value of the official 2007 poverty line.57
Yet, one out of every two people in Timor-Leste was counted as poor (World Bank, 2008).58 Though the
lack of updated poverty figures impedes a full estimate of national poverty impact, the coming chapter
uses the expenditure level of the bottom two expenditure quintiles (i.e., poorest 40 percent) to estimate
the potential impact of social assistance.
The analysis relies on an accounting framework to estimate how much social assistance contributed to
improving the welfare of the bottom 40 percent, using the TLSPS and HIES (2011) data that includes
information on household expenditures and public cash transfers received. This is achieved by
comparing the pre-transfer position in relation to the 40 percent consumption line to actual post-
transfer position and assumes that per capita expenditures among beneficiary households are reduced
by the amount they receive in assistance. The simulated changes in welfare are examined for the entire
population at the national level, as well as more specifically among beneficiary households, where a
higher impact is expected.
A. National estimates of social assistance welfare impact
The analysis shows that the three main social assistance programs (Bolsa da Mãe, elderly and
disability pensions) reduced the portion of the population under the 40 percent consumption line by 5
percentage points. These estimates indicate that national-level welfare improvement does not appear
commensurate with the amount of resources spent on cash transfers. Table 13 shows that many cash
transfer social assistance programs had negligible impact on national welfare measures. The elderly
pension is the only program significantly reducing the proportion of the population below the 40
percent consumption line. This program prevented the number of people falling below the 40 percent
consumption line from increasing by 5 percentage points (or by 13 percent) from 40 percent to 45
percent. Bolsa da Mãe transfers and disability pensions had no significant impact on the headcount
ratio. The analysis also shows that the national effects on the intensity measure and the severity
measure are similarly small, indicating that transfers did not improve the welfare of the very poor.
57
Chapter 3 on social assistance public expenditure provides a detailed overview of aggregate spending during 2007 to 2012. 58
Post 2007 official estimate of poverty is unavailable.

57 | P a g e
Table 13: Impact of programs on population below the 40% consumption line (national population)
Headcount59
Intensity Measure60
Severity Measure61
Baseline 40.0% 9.9% 3.4%
Increase if programs were discontinued62
(change in percentage points)
Bolsa da Mãe 0.0 0.0 0.0
Elderly Pension 5.0 2.0 1.1
Disability Pension 0.4 0.1 0.1
Without all three social assistance transfers
5.3 2.2 1.2
Source: Timor-Leste Social Protection Survey, 2011 and SP Household Income and Expenditure Survey, 2011
Why are measures of national welfare improvement so low despite the size of public expenditure on
social assistance? Poverty reduction is maximized when transfers are reaching the majority of the poor,
and when the benefit level is adequate in size to bring the poor individual up to or over the poverty line
(or in this case, the 40 percent consumption line).63 The report singles out the three most important
explanations responsible for the low levels of welfare improvement: first, as chapter 3 demonstrates, 71
percent of the total social assistance budget is consumed by veteran benefits, which are overly generous
towards very few beneficiaries for any sizeable impact. Secondly, although categorical targeting aimed
at the veterans, elderly, disabled and families with children overlaps with the poorest population, it has
left a large proportion of the poorest households outside these categories. Finally, Bolsa da Mãe has the
potential to reduce poverty but is too small in coverage relative to the size of eligible population. The
size of the Bolsa da Mãe benefit level relative to the intensity measure is also too low to affect welfare
status.
The bulk of social assistance spending is concentrated on veteran payments that benefited 1 percent
of Timor-Leste’s population directly (10,953 veterans, MSS 2011). The official annual benefit amount
ranged from US$ 2,760 to US$ 9,000 depending on the type, and was on average around US$ 3,187 per
59
The headcount shows the percent of the population living on less than US$ 32/month. 60
The intensity measure is the sum of the individual differences between the US$ 32/month and actual expenditures. 61
The severity measure averages the square of the intensity measure, thereby more heavily weighting expenditure levels that fall farther below the US$ 32/month line. 62
Simulated impact estimated by comparing actual numbers below the US$ 32/month line to simulated numbers below in the absence of social assistance. Pre-transfer total per capita expenditure is calculated after subtracting the transfers from total expenditure of the beneficiary households. 63
At this stage in the analysis the report focuses on the total value of transfers only and not the entire budget allocation that includes additional cost of administration which is another source of “leakage”.

58 | P a g e
year per beneficiary. A rough calculation demonstrates that although US$ 44 million64 was spent on
veteran pensions in 2011, this spending could only have marginal impact on the proportion of the
population with expenditures below US$ 32/month. Even under the assumption that every single
beneficiary was poor before receiving the transfer, the transfers would have resulted only in a 1
percentage point decrease in the headcount. For comparison, although the elderly and disability
pension consumed US$ 32 million in total in 2011, this transfer achieved a reduction in those with
expenditures below US$ 32/month of 5.3 percentage points.
Table 14: Simulated potential welfare impact of program targeted to the poorest households
Reduction in population under US$ 32/month
% under US$ 32/ month (Baseline: 40)
Monthly Transfer Amount
# of Beneficiaries
Coverage of Poorest 40%
Program Budget (excluding admin costs)
% of non-oil GDP
% of Budget
% of oil GDP
% of ESI + DR
-10% 36 $19.5 49,819 10.7% 11,661,115 1.2% 0.9% 0.4% 1.5%
-20% 32 $11.8 185,061 34.1% 26,184,852 2.7% 2.0% 0.8% 3.3%
-30% 28 $17.7 174,022 32.2% 37,010,890 3.8% 2.8% 1.2% 4.6%
-40% 24 $12.7 333,531 54.7% 50,285,144 5.2% 3.9% 1.6% 6.3%
Source: World Bank staff calculations using SP- HIES 2011 and TLSPS 2011
Note: Variables used in the PMT model to identify the population below US$ 32/month include
household size, gender of household head, urban residence, number of children, number of livestock,
education and employment status of household head, age of household head, type of toilet facilities and
dwelling size.
Table 15: Simulated minimum cost of program targeted to the poorest households using a
simple proxy score for wealth status
Reduction in population under US$ 32/month
% under US$ 32/ month (Baseline: 40)
Monthly Transfer Amount
# of Beneficiaries
Coverage of Poorest 40%
Program Budget (excluding admin costs)
% of non-oil GDP
% of Budget
% of oil GDP
% of ESI + DR
-10% 36 $12.2 90,308 17.3% 13,250,977 1.4% 1.0% 0.4% 1.7%
-20% 32 $11.7 182,564 30.8% 25,585,401 2.6% 2.0% 0.8% 3.2%
-30% 28 $17.6 188,915 31.8% 39,975,936 4.1% 3.1% 1.2% 5.0%
-40% 24 $12.7 346,516 53.3% 52,717,028 5.4% 4.0% 1.6% 6.6%
Note: Simulations using TLSPS and SP-HIES 2011
Note: Same as Table 16 but fewer predictors used in the PMT model which only includes household size,
gender of household head, urban residence, number of children and number of livestock.
64
This figure represents the 2011 executed budget, rather than the much higher (US$ 81.78 million) allocation.

59 | P a g e
Table 14 presents alternative designs for a program targeted to the poorest households, which vary in
their cost and impact on the proportion of the population with expenditures below US$ 32/month.
This simulation uses proxy means test methodology as a targeting mechanism, with the baseline and
resultant reduction based on the consumption level of the bottom 40 percent. The table shows that a
program with a US$37 million budget and a per capita benefit of US$18 could achieve a reduction of 30
percent and cover a third of the poorest.65 The simulations offer a menu of options with different
tradeoffs in terms of the size of the budget, per capita benefit and proportion of the poorest covered.
Therefore, the highly generous veteran benefit carries an enormous opportunity cost as measured by
the groups that could have been covered but remain excluded from social assistance.
Table 15 presents the simulation using a simpler score to proxy household eligibility. The only
information used here for targeting is household size, urban or rural location, district, number of
children, and gender of household head, as well as the number of certain animals owned. Using such a
simple targeting mechanism achieves similar results in terms of budget requirements. This shows that
the targeting criteria can be simple but comparably effective. The optimal benefit level to achieve a 10
percent reduction in those below US$ 32/month is much lower using a simple score that has a higher
error in identifying the poor. When using the more accurate score, it is optimal to give a higher benefit
level to fewer beneficiaries since the very poorest can be identified with less error. In the case of the
simpler targeting mechanism, it is more cost-effective to give a lower benefit to more individuals since
there is a larger targeting error. This illustrates how optimal design of the program can depend on the
targeting mechanism adopted. The remaining explanations below focus on the impact of the residual
budget that was consumed by elderly and disability pensions and Bolsa da Mãe.
Benefit incidence analysis shows that a high proportion of the poorest population is not covered by
current eligibility rules and therefore did not receive any cash transfers. The programs are reaching 40
percent of the poorest, leaving 60 percent outside of these safety nets. Figure 21 (next page) shows that
there was considerable variation in coverage of the poorest across different programs. The elderly
pension is responsible for the dominant share of poorest households reached (35 percent). In contrast,
Bolsa da Mãe and disability pensions cover only three percent of the poorest.
Bolsa da Mãe and disability pensions are too small in their coverage scale to make an appreciable
impact on the number of people falling below US$ 32/month. As was shown in Chapter 3, the share of
households in the bottom two quintiles among households with large numbers of children is
considerably higher than average. 17 percent of families with no children under the age of 16 are in the
poorest populaton, compared to 24 percent of families with one child, 32 percent of families with two
children, 42 percent of those with three children, 40 percent of those with four and 56 percent of
families with more than four children. In fact, 40 percent of the poorest two quintiles lives in households
with more than four children. Yet, Bolsa da Mãe, the only program targeted at households with children,
consumes just 2 percent of the total social assistance budget, and reaches about 2.2 percent of the
population. Similarly, while average disability rates are estimated at around 4.6 percent (Timor-Leste
65
Simulation excludes administrative costs.

60 | P a g e
Census, 2010), disability pensions are only reaching 1.3 percent of the population (MSS, 2012). Neither
program is sufficiently large to cover the target groups.66
While the benefit level for Bolsa da Mãe is very small to result in a significant household-level welfare
impact, the veteran pensions represents extremely high benefits per person received by very few
beneficiaries. Analysis of generosity (see Chapter 4) showed that the ratio of average benefits to total
consumption from Bolsa da Mãe payment represents only 3.5 percent of the total household budget of
the bottom quintile. In contrast, the veteran pensions are estimated at 152.4 percent of average
household budget, or almost 10 times the consumption level of the bottom 40 percent. The elderly
pension is the only program with significant rates of the poorest covered and adequate benefit levels.
Timor-Leste achieved a larger welfare impact relative to other countries but it was achieved at
disproportionately higher cost. Timor-Leste’s 5 percentage point reduction compares well to 3
percentage points in Philippines, 0.9 percentage points in Malaysia, or 0.1 percentage points in
Cambodia. But Timor-Leste also spent an extraordinarily high amount on social assistance and veteran
payments - 15 percent of non-oil GDP, compared to 1 percent of GDP spent on average among other
countries in the region. In 2011, Timor-Leste’s government budgeted US$ 112 million for the main social
transfer programs. In comparison, the intensity measure was only US$ 43 million, which translates to an
average cost of US$ 489 per year to bring a person above the US$ 384 per capita expenditure line.
66
In the case of disability pensions this can be seen as exclusion error since all disabled are eligible to receive the benefit. In the case of Bolsa da Mãe program funds are very limited and thus it was never the intention to reach all poor single mothers, merely a certain quota.
Figure 21: Proportion of poorest covered by different cash transfer programs
Source: Timor-Leste Social Protection Survey, 2011 and HIES, 2011
3.2 3.3
35.2
40.2
0
5
10
15
20
25
30
35
40
45
Bolsa da Mae Disabililty Pension Elderly Pension All three transfers
Co
vera
ge r
ate
of
the
po
or
(%)

61 | P a g e
B. Impact on beneficiaries
This section addresses the question of size of the impact on the population with expenditure under US$
32/month for households that received cash transfers. While national estimates include beneficiary and
non-beneficiary households, household-level impact estimates are expected to be higher on households
directly benefiting from the programs.
Elderly and disability pensions had a major impact on beneficiary households, while the percent of
Bolsa da Mãe beneficiaries under the 40 percent consumption line of US$ 32/month remains largely
unchanged. Without the elderly benefit, as much as 55.1 percent67 of the elderly would have
expenditure levels of under US$ 32 per capita per month. This translates into a 17.5 percentage point or
87 percent, increase prevented for individuals living in households receiving elderly pensions. In the case
of the disability pension, there is a reduction of 17.5 percentage points in those living below this level
(61 percent increase prevented). Although the number of Bolsa da Mãe beneficiaries with expenditures
under US$ 32/month is very high, analysis shows very little impact on these numbers, highlighting the
small size of Bolsa da Mãe transfers in comparison to other programs.
Table 16: Impact on recipients
Bolsa da Mãe Recipients Elderly Pension Recipients
Disability Pension Recipients
Headcount Intensity
Measure Headcount
Intensity
Measure Headcount
Intensity
Measure
Actual 2011
Figures 59.2% 15.6% 37.6% 9.3% 45.8% 13.1%
Increase if programs were discontinued
(in percentage points)
Bolsa da Mãe 0.0 1.6 0.0 0.0 0.0 0.0
Elderly Pension 0.0 0.5 17.5 7.1 5.8 0.7
Disability Pension 0.0 0.0 0.5 0.0 17.5 4.4
Without all three
social assistance
transfers
0.0 2.1 17.5 7.1 17.5 5.3
Source: Timor-Leste Social Protection Survey, 2011 and Household Income and Expenditure Survey, 2011
67
Elderly households on average have 6 household members. A household receiving a transfer of 360 dollars per year translates on average to 60 dollars per person.

62 | P a g e
Chapter 7: Administration and implementation of
programs
Timor-Leste faces challenges typical of fragile and low-income countries in administering and
implementing social assistance programs. These challenges include, inter alia, the lack of an
overarching social assistance policy framework, administrative capacity constraints (civil service
capacity, interagency coordination), limited infrastructure (roads, communication networks), and data
constraints, all of which can undermine the effectiveness of social assistance targeting, payment,
monitoring and controls. Timor-Leste’s natural resource wealth allows more fiscal space for
implementing social assistance programs than nations with similar GDP per capita. However,
persistently high rates of poverty and vulnerability point to the need for an appropriate mix of
programs, implemented efficiently and in a manner heedful of the current administrative and
implementation capacity.
A. Administrative Responsibilities
The implementation of government social assistance programs for the elderly, people with
disabilities, and vulnerable households rests primarily with the Ministry of Social Solidarity, in
partnership with other government agencies, civil servants at the national and sub-national level, and
community leaders. As depicted in Figure 22, MSS maintains overall responsibility for program
communications, eligibility determination, targeting and registration, and complaints and appeals. Data
verification and monitoring of conditionalities, where applicable, is conducted in cooperation with the
Ministries of Education and Health68, and the Technical Secretariat for Electoral Administration (STAE)69,
which issues birth certificates and the electoral registration card that serves as a national identification
card.70 The Ministry of Finance delivers all payments (in partnership with MSS Finance staff) and is
responsible for payment reconciliation; however, communication regarding payment periods and
identity verification at the payment site are the responsibility of the MSS and sub-national authorities
under the direction of the Ministry of State Administration.
68
As discussed later in this section, health and education conditionality under the Bolsa da Mãe program at the time of the survey were “soft”, with limited and inconsistent enforcement. However, staff of the Ministries of Health and Education did participate to a limited extent in enforcing the conditionality. 69
Administratively located under the Ministry of State Administration and Territorial Management. 70
The STAE-issued electoral ID is currently the sole national identification card. However, the Ministry of Justice has begun issuance of a national identity card for individuals over 12 years of age. This card is intended to take the place of the electoral ID once issuance is complete. This is discussed in more detail later in this section.

63 | P a g e
Figure 22: Inter-ministerial Roles in MSS Social Assistance
The Ministry of Social Solidarity maintains staff at the central, district, and sub-district level to aid
program implementation. Social Animators, located administratively under the Directorate for Social
Reinsertion in MSS (the Directorate responsible for the Bolsa da Mãe program), are the sole sub-district
level interface with beneficiaries. Their role is primarily as a conduit of information regarding program
eligibility and payments, though they also assist with registration and local-level administration for all
MSS programs. Social Animators report to district-based Child Protection Officers (CPOs) and Social
Security Focal Points, who collect and review program applications, approve workplans, and provide a
link from the sub-district to central MSS staff.
Community leaders play a prominent role in all aspects of program implementation, though they are
not staff of, and have no accountability to, MSS. Though publicly elected, suco (village) leaders are not
part of the local government structure. However, they receive funding from the state to implement
duties falling within their mandate (largely ceremonial, though also including some aspects of local
development). Suco leaders are bound by strong traditional accountabilities to the communities they
serve, though reports of abuse of power are not uncommon. Due to their accessibility and (often)
descendancy from traditionally powerful families, suco leaders are an important interface between
citizen and state. As such, suco leaders play a leading role in program communication, targeting,
registration, payment, and appeals for all MSS programs; Figure 23 shows the importance of the suco
chief (chefe) in registering for the elderly pension program.

64 | P a g e
Figure 23: Who invited eligible household member to apply to Elderly Pension?
Source: Timor-Leste Social Protection Survey, 2011
The multiple agencies responsible for implementation of MSS-managed programs, and in particular
reliance on non-governmental bodies for key roles, can present an accountability challenge. MSS
depends on civil servants from counterpart institutions to understand their role and perform it
effectively in order for social assistance programs to function properly. Supply-side problems – for
example, lack of medical personnel at health centers, or errors in STAE data collection and registration –
have a direct, negative impact on MSS programs. Similarly, MSS’s reliance on community leaders for
program implementation roles, while pragmatic, can introduce the potential for bias or manipulation in
beneficiary selection, in the absence of adequate safeguards.71
B. Identifying Beneficiaries: Distinguishing Beneficiaries from Non-
Beneficiaries72
Accurately identifying and registering beneficiaries is a common challenge in low-capacity
environments. Common identification documents in developing countries include birth certificates,
driver’s licenses, or residency cards. However, these are not part of a common identification system
since these IDs are often not linked by a common unique identifier, can be inconsistent and subject to
manipulation. Moreover, they can result in qualified beneficiaries falling through the cracks and not
being identified (Pazmino, 2012). An appropriate unique identified in a social assistance program will
allow for differentiation of beneficiaries and non-beneficiaries for various programs as well as tracking
of beneficiaries throughout the program cycle (registration, payment, monitoring, and exit/ graduation).
71
For example, a pilot social network analysis exercise conducted by the World Bank in one sub-district in Timor-Leste found that beneficiaries with a kinship relationship to a suco or aldeia (hamlet) chief were eight times more likely to learn about, and register for, MSS social assistance benefits in the first year of the program than those who did not have such a relationship. 72
This section relies heavily on information provided in an internal report by Nathalie Pazmino on national identity systems.
7.8%
94.5%
7.1% 5.9% 16.4%
1.4% 0%
10%20%30%40%50%60%70%80%90%
100%

65 | P a g e
At present, Timor-Leste does not have a single, unique identification system. For social assistance
benefits, the most common ID is the STAE-issued electoral card, which contains a photo and basic
identifying information. The STAE card is widely available and commonly used, but problems have been
reported with data errors (e.g., incorrect birthdates) and duplicate or fraudulent cards. In 2008, the
RDTL government, under the Registry and Notary Services Directorate of the Ministry of Justice, began
issuing a national identity card. The national ID includes a unique, randomly generated number for each
registrant, and contains both personal identifying information and biometric data. The national ID links
to a demographic management information system (DMIS), which is intended to compile information on
births, deaths, marriage, divorce, adoption, good conduct, and nationality.
The national identity card has strong potential to become Timor-Leste’s unique identifier for social
assistance programs. However, roll-out of the identity card has been slow and erratic, with just 30,000
IDs (out of a population of 1.1 million) issued to date. Issuance of new cards is currently stalled as a
result of a dispute over the ownership of IT system source codes. Even assuming rollout is reenergized
and the national ID effectively reaches all the eligible population73, the government will face challenges
linking the national ID to current social assistance benefits. This is because individuals’ electoral ID
numbers are currently not linked to the national ID number in the DMIS. However, given the importance
of a unique identifier for properly identifying social assistance beneficiaries, linking the national and
electoral IDs should be a priority.
C. Identifying Beneficiaries: Eligibility and Targeting
The three main Ministry of Social Solidarity transfer programs are designed to meet the needs of
specific populations. The programs for the elderly (60+) and adults (18+) with disabilities are intended
as social security to provide a basic subsistence income. Because there are no government-provided or
private-sector-provided worker’s pensions in Timor-Leste, these transfers are the primary formal safety
net for the elderly and disabled.74 In contrast, Bolsa da Mãe provides a combination of poverty
alleviation and promotion of better opportunities, focusing specifically on families in need.
The differing objectives of the programs contribute to varying levels of targeting complexity. For the
elderly pension program, any Timorese citizen residing in Timor-Leste who has reached 60 years of age
is eligible, regardless of income. For the disability benefit, individuals must be over 18 years old and
must have a permanent physical or mental disability that renders them unable to work. In both cases,
community leaders and social animators use community meetings or house-to-house visits to identify
individuals who are likely to meet the eligibility criteria, and request that they apply. Targeting for Bolsa
da Mãe is more complicated, as it involves a less easily observable eligibility criteria (“vulnerability”) and
uses an enrollment cap. At the time of the Social Protection Survey, Bolsa da Mãe was targeted towards
poor and vulnerable households meeting basic conditions for children’s school attendance and
73
The national ID will be issued to citizens 17 years of age and older, and those 12-17 upon demand. 74
As of June 2012, a civil service pension system has been put in place in Timor-Leste, though it is not yet operational. The government plans to extend the civil service pension to the formal sector gradually, beginning in 2015. The elderly transfer will likely remain as social security for workers in the informal sector.

66 | P a g e
performance.75 MSS allocated a fixed number of slots per sub-district, and relied on sub-district level
MSS staff and community leaders to identify the most vulnerable beneficiaries using a “visual
assessment of poverty”.76 However, as of 2012, MSS has introduced a vulnerability score to improve the
accuracy and transparency of targeting.
In practice, targeting at present is implemented primarily at the community level; this has advantages,
but can also add complications. In the context of Timor-Leste, where there are strong family networks
of support and obligation, community leaders may be better able to provide information about families
receiving alternate forms of social support, or remittances from relatives living in Dili or abroad.
Community-based targeting allows programs to effectively capture this “local knowledge”.77 However,
there is potential for bias or mistargeting of benefits, particularly if adequate checks and balances are
not in place.
D. Identifying Beneficiaries: Registration
Registration, including collection and verification of required documentation, takes place largely at
the community level, using standard application forms. Eligibility is verified through submission of
supporting documentation, as described in Table 17. The required documentation is, for the most part,
obtainable at the local level. However, accessing an election card requires travel to the district center;
certificates of disability are issued free of charge at Ministry of Health-operated health posts by trained
medical staff.
Table 17: Documentation required at registration
Elderly Pension Disability Pension Bolsa da Mãe
Proof of Identity Electoral Card (issued by STAE) Electoral Card (issued by STAE) of mother; birth certificate of child(ren)
Proof of Residence Letter from village chief
Proof of Age Electoral Card (issued by STAE); in some cases, beneficiaries indicated birth or baptism certificate was required as secondary proof
Birth certificate of child(ren)
75
Bolsa da Mãe criteria and implementation changed in late-2011, with the introduction of a vulnerability scoring methodology, and revised conditionalities. See Box 3 for more information. 76
According to community leaders interviewed, in practice eligible households are registered on a first-come-first-served basis, given that most families live close to or under the poverty line. 77
Some conditional cash transfer programs, such as Mexico’s Oportunidades, include a community validation of the beneficiary list. Nicaragua's Atención a Crisis allowed for communities to make a 3 percent adjustment in the beneficiary list based on local knowledge. (Bastagli, F. (Dec 2009). From Social Safety Net to Social Policy?: The Role of Conditional Cash Transfers in Welfare State Development in Latin America. International Policy Centre for Inclusive Growth Working Paper Number 60.)

67 | P a g e
Other Documentation
None required Medical certificate proving severe disability (issued by Ministry of Health)
At the time of the survey, certification by headmaster of child’s school attendance and grades. Beginning 2012, proof of vaccination (children 0-5) and certification of school attendance and grades (6-17).
Though required documentation is minimal, errors and complications with documents can prove
challenging during registration. Survey respondents cited documentation as the most significant
difficulty in the application stage, far outpacing difficulties with accessing the registration location or
determining one’s eligibility.
Table 18: Most significant difficulty when applying for benefits (in % of recipients)
Finding out if eligible
Documentation Attitude of Program officials
Access to location
Bolsa da Mãe 9.9 83.4 0.0 6.7 (0.0 for urban, 9.3%for rural)
Elderly Pension
14.7 69.5 4.5 11.4 (3.5 for urban, 12.7 for rural)
Disability Pension
17.6 73.4 2.5 5.9 (0.0 for urban, 7.8 for rural)
Source: Timor-Leste Social Protection Survey, 2011
Certifying mental disability, for example, is difficult given the lack of appropriately trained mental health
personnel in Timor-Leste. Obtaining school performance results for Bolsa da Mãe requires effective
school record-keeping. Respondents in the qualitative study of MSS programs noted that errors in the
personal information listed on the electoral card were particularly pervasive and difficult to correct. In
some cases, these errors reportedly prevented eligible individuals from receiving benefits. However,
there is also a possibility that these errors could contribute to ineligible individuals accessing benefits.
For example, as shown in Figure 24, there was a significant and unexplained jump in the population over
60 years of age between the 2004 and 2010 Census years.

68 | P a g e
Figure 24: Unexplained increase in elderly population between 2004 and 2010
Source: Timor-Leste Census of Population and Housing, 2004 and 2010
The cohort aged 60+ in 2010 was significantly larger compared to the same cohort measured in 2004,
before the establishment of the elderly pensions (in 2008). This was driven by a more than 60 percent
increase in the population listed as born between 1941 and 1950 between the two survey years. The
magnitude of the jump is extremely unlikely without errors in the electoral cards or misrepresentation
of age. Only an exceptionally large, disproportionate immigration of elderly could provide an alternative
explanation, but is not supported by experience on the ground. To prevent this and similar problems
stemming from inaccurate or incomplete documentation in the future, the Ministry of Social Solidarity is
holding joint verification sessions with STAE and the Ministry of Health to verify the accuracy of the
registration data.
Verification and approval procedures for each of the Ministry of Social Solidarity benefits are currently
centralized, though there are plans to transfer registration responsibilities to the regional level once a
fully-functional MIS is in place.78 Though the majority of benefit applications are received at the sub-
district level or below, data entry, verification, and generation of beneficiary lists is performed by the
national database unit in MSS. Sub-district level staff are unable to access the registration database to
78
The Ministry of Social Solidarity recently completed a tender for a firm to design a comprehensive MIS covering five MSS programs (Bolsa da Mãe, elderly pensions, disability pensions, Disaster Management, and Internally Displaced Persons). The development of the MIS is supported by the World Bank’s Social Protection Administration Project, a US$ 1.455m Rapid Social Response multi-donor trust funded grant.
0
20,000
40,000
60,000
80,000
100,000
120,000
140,000
160,000
Population born in these years according to 2004 Census
Population born in these years according to 2010 Census

69 | P a g e
verify receipt of applications centrally, inform applicants of any additional data needed to complete
their applications, or confirm registration status. In practice, applicants learn of their registration status
only when payment lists are posted. In the future, MSS hopes to minimize the delay in responding to
requests for status updates by allowing offline database access through the MIS system currently under
development.
E. Accessing Benefits: Communicating with Beneficiaries
MSS does not currently have a communication strategy; communication with beneficiaries is largely
done around significant program events (e.g., registration periods, payment times) through community
meetings or door-to-door visits to those who are eligible to apply or are receiving a transfer. This is a
time-consuming process, and relies heavily on the support of community leaders. It is also prone to
error, as community leaders who may have limited understanding of the programs may pass on
inaccurate information, contributing to confusion and allegations of misallocation of benefits. Despite
the inefficiency, door-to-door visits by community leaders are an important means of reaching
beneficiaries.
Infrastructure constraints, lack of mobility and low levels of literacy pose obstacles to effective
communication between MSS and potential beneficiaries. In Timor-Leste, a literacy rate of 51% for
adults (as of 2007) renders many potential beneficiaries unable to read posted program notices or fill
out registration forms without assistance.79 For potential beneficiaries in rural areas, long distances, lack
of public transportation and poor quality roads make some villages largely inaccessible, particularly in
the rainy season. For beneficiaries of MSS social assistance benefits, who are by definition elderly,
disabled, or poor, barriers to accessing information may be particularly acute.
The Ministry of Social Solidarity has made use of media to overcome communication obstacles, with
some success. In a 2010 survey, 54 percent of respondents reported that community leaders were the
main source of information on MSS programs; radio (42 percent) and television (33 percent) were the
next most common (United Nations Integrated Mission in Timor-Leste, 2011). Community leaders were
also named the most trustworthy source of information. These numbers are particularly interesting
when viewed in comparison to other government social programs. As shown in Figure 25, survey
respondents named government health centers as their main source of health-related information; in
contrast, government staff, including MSS sub-national staff, did not feature among the main sources of
information for social assistance programs.
79
Timor-Leste Survey of Living Standards, 2007, accessed via data.worldbank.org on 6 June 2012.

70 | P a g e
Figure 25: Source of Information on Health and MSS Programs
Source: UNMIT, Timor-Leste Communication and Media Survey, 2011
Mobile phone-based communication mechanisms could prove useful as a communication tool in the
future. Mobile phone penetration rates at the household level in Timor-Leste reached 61 percent in
2010, with substantial variation among districts and according to household characteristics. Blast texting
options are available, and can be customized according to the characteristics of the mobile’s owner.
However, costs for making calls or sending SMS messages are high by regional standards, and SMS-
based communication, which has been used in other developing countries, is unlikely to be sufficient on
its own in Timor-Leste.80
Communication from potential beneficiaries to the Ministry of Social Solidarity remains a weak point.
MSS has had some success in sharing information with eligible individuals. A key gap at present is
facilitating potential beneficiaries to address queries, suggestions, appeals, and grievances to MSS.
Communication to MSS are largely conducted in person through Social Animators (or community leaders
as their proxy). Most correspondence stops at this level, regardless of whether it has resulted in a clear
response from MSS. Introduction of additional avenues for community-to-MSS communication would
facilitate an effective two-way dialogue.
80
Kenya and India in particular have had success with SMS-based communication technologies.
0% 10% 20% 30% 40% 50% 60%
Don't Know
Never Received
Others
Music
Friends and Neighbors
Newspapers
TVTL
Radio Timor-Leste
Community Leaders
Health Center
Don't Know
Never Received
Other
Friends and Neighbors
Newspapers
TVTL
Radio Timor-Leste
Community Leaders
Source of Information
MSS
So
cial
Pro
gram
s
H
eal
th P
rogr
ams

71 | P a g e
F. Accessing Benefits: Payment Procedures
Timor-Leste’s limited banking infrastructure inhibits payment delivery. As of 2009, just 38 percent of
the population reported a bank branch or microfinance institution within their sub-district (Bankable
Frontiers Associates, 2009). Several development partners are assisting the government to evaluate
options for branchless banking, but at present, these systems are insufficient to allow MSS to reach all
program beneficiaries. Beginning 2012, MSS is delivering social assistance payments via mobile banking
on a trial basis in six districts, using retrofitted vehicles to carry benefits to remote locations. Identifying
lower-cost means of payment delivery will continue to be a challenge and an area of priority for MSS.
Due to infrastructure limitations, payments are largely delivered by hand by joint Ministry of Finance-
Ministry of Social Solidarity payment teams.81 Biannually (annually for Bolsa da Mãe), MSS develops
payment lists with all approved beneficiaries, broken down by sub-district. Payment lists are shared with
District Administrators (employed under the Ministry of State Administration) and sub-national MSS
staff, who are responsible for circulating and posting the final payment lists. Payment lists are also
submitted to the Ministry of Finance, which releases the budget needed for the payment cycle.
Payments are then delivered under armed escort to each of 65 sub-districts on pre-identified payment
days.
Following verification of identity, payments are delivered to beneficiaries or, in some cases, their
proxies. Beneficiary identity is verified with an electoral card and confirmed by suco chiefs. Beneficiaries
are required to acknowledge receipt of the transfer using a signature or fingerprint; no receipts are
issued during the payment process. Beneficiaries who are unable to receive the transfer in person are
permitted to designate proxies, though the process is ill-defined and varies among sub-districts. In some
cases, beneficiaries reported that only family could serve as proxies; in others, friends, community
leaders, and representatives from religious institutions were named as proxies. The paperwork required
for proxy payments also varies, with some respondents reporting that an authorizing letter was
required, and others reportedly needing only the beneficiary’s electoral card.
The payment process is generally well-implemented, despite substantial constraints and some
recurring problems. More than half of survey respondents reported that discovering the date and
location of the payment was the most significant problem in receiving payments. Documentation and
identity verification problems were also frequently cited, particularly for recipients of the disabled
pension (44 percent) and Bolsa da Mãe (34 percent). For the elderly, access to the payment location was
the second most commonly reported difficulty (22 percent of respondents); nearly one-third of elderly
respondents reported a travel time of over 90 minutes to reach the payment location, and a quarter
paid more than US$1 for transport.
81
Many veteran payments, which are substantially larger than other MSS social assistance benefits, are also largely delivered via bank accounts. Transfers for Bolsa da Mãe are also being delivered through mobile banking on a trial basis.

72 | P a g e
Box 8: Community Views on “Entitlement” to Transfers
The social compact in Timor-Leste is still under negotiation, and contradictory views of the state’s
role in protection emerged from interviews. There is a combination of dependence on the state and
low expectations for a state response. There is a clear demand for government response to
emergencies such as food shortages or damage to property during flooding. Veteran pension
benefits, which were earned through service or sacrifice, are also seen as an entitlement, which
contributes to discontent with the prohibition on receiving both elderly and veteran benefits.
However, for most respondents, elderly and disability pensions and Bolsa da Mãe are seen not as
entitlements, but examples of the state’s benevolence in sharing “its [the state’s] wealth”. Though
respondents objected to perceived unfairness in the selection or registration processes, the lack of a
sense of entitlement contributed to a reluctance to appeal program decisions.
Table 19: Travel time to reach payment location (in % of recipients)
Source: Timor-Leste Social Protection Survey, 2011
Less commonly reported problems include incomplete or partial payments, relations with program
officials, extra payments, and security. Additionally, some beneficiaries reported that the infrequency of
payments and inability to receive money in a bank account limited savings opportunities.
G. Making Appeals and Addressing Disputes
Reports of grievances related to social assistance transfer payments are rare; however, developing an
effective appeal and oversight mechanism remains a priority. Currently, none of the three MSS social
assistance transfers has a formal appeals process in place. Community members with questions or
complaints about the program generally raise their concerns with community leaders, who then follow
up with the Social Animator or Sub-District Administrator. However, respondents to the qualitative
study of social assistance benefits reported that in most cases local authorities were unable to answer
their questions, and they were most commonly advised to “wait and see”. More frequently, however,
respondents did not raise their concerns to any implementers. Common reasons include lack of
information on to whom to address a question or appeal, feelings of disempowerment, concerns about
retaliatory denial of future benefits, belief that concerns would not be addressed, or feeling that the
payment was a gift for which one should be grateful (described further in Box 8).
A successful grievance and appeal mechanism for social assistance will link institutions and oversight
bodies to manage complaints. Appeals and enquiries can be handled by the line Ministry responsible for
program implementation. However, for reports involving conflict of interest, corruption, or misuse of
30 minutes or less 30-90 minutes 90 minutes
Bolsa da Mãe 60.0 21.8 18.2 Elderly Pension 34.2 35.0 30.8 Disability Pension 38.5 44.5 16.9

73 | P a g e
funds, it may be appropriate to engage other Ministries (such as the Ministry of Finance) and potentially
independent anti-corruption bodies, to appropriately investigate and address claims.
H. Managing, Monitoring and Evaluating Implementation
The Ministry of Social Solidarity has recognized the need for enhanced information management and
program monitoring, as program scope and budgets grow. The Ministry is currently undertaking a
review of program databases to assess the availability and quality of data, and has issued a tender for
the design of a comprehensive MIS system covering five MSS programs (Bolsa da Mãe, elderly pension,
disability pension, disaster management, and Internally Displaced Persons). This system will hold and
manage all beneficiary information, allow for cross-checks and updates to household information,
monitor transactions and transaction history, track exit/graduation criteria, allow for grievance
management, and generate up-to-date reports on all aspects of program implementation. The system
will also enable web interface from the six MSS regional offices, as well as offline data entry capability.
The enhanced MIS system and database review are expected to greatly improve MSS’s ability to
implement core cash transfers transparently and efficiently, rapidly identify and correct errors, and
effectively monitor program implementation.
The Ministry of Social Solidarity is in the process of developing a comprehensive Monitoring and
Evaluation (M&E) System. This system will be particularly useful in understanding and tracking the
implementation of social assistance benefits. It will enable management to make informed decisions
about program implementation by evaluating processes, results and progress, and providing alerts when
errors in implementation are occurring. An effective M&E system will also help MSS to identify and
explain errors that might prevent social assistance spending from having its predicted impact, and thus
improve the overall implementation of MSS’s social assistance cash transfers.

74 | P a g e
Chapter 8: Policy consideration for improving social
assistance in Timor-Leste.
This chapter outlines recommendations for the development of a social assistance system in Timor-Leste
which broadly outlines three policy directions: addressing large exclusion of the poor from social
assistance, improving administrative processes to move from fragmented implementation processes
towards a more coherent national safety nets system, and managing recurrent costs of veteran benefits
towards a financially sustainable path.
1. Address large exclusion of the poorest 20 percent from main cash transfer programs.
Around the world, protection from poverty is one of the central objectives for a national safety nets
system. Poverty in Timor-Leste remains a key challenge where nearly half the population lives below the
poverty line (2007). Yet, despite the disproportionately high contribution of social assistance spending
to the national budget, a large proportion of the poorest population is left outside the reach of the main
social assistance programs, especially the poorest households with children. This requires the
development of an overarching national social assistance strategy within a framework for national social
protection. Such a policy framework would represent a national vision and guiding principles on how to
address specific vulnerabilities, respond to shocks and extreme poverty. It would also allow the Ministry
for Social Solidarity to identify gaps in the current mix of social assistance programs, reform or
consolidate the existing programs to effectively prioritize among multiple social assistance needs and
plan for an appropriate budgetary and administrative commitment.
2. Implement a more effective anti-poverty policy can start by investing in a single program that
targets poor households.
Bolsa da Mãe is a logical candidate for an integrated anti-poverty program, but it requires development
and refinement of basic administrative systems needed for identification, enrollment, monitoring and
evaluation. Importantly, Bolsa da Mãe will require effective and affordable targeting approaches for
assessment of household poverty as well as additional MIS functionality. The household benefit will
need to be designed accordingly to maximize poverty reduction using a financially sustainable budget.
Once this is proven to function cost-effectively with admissible degree of inclusion and exclusion errors,
a scale up of Bolsa da Mãe will require a budgetary commitment to cover a significant proportion of the
poor. Other countries can provide an indication of costs; for example, anti-poverty programs such as the
Brazilian Bolsa Família or the Mexican Oportunidades cost around 0.5 percent of GDP.
The tables below provide an example of cost simulations of a prototypical program targeted to the
poorest households. The model generates the minimum cost to achieve a welfare impact, optimizing
over benefit level as well as number of people in the bottom 40 percent covered. Table 20 shows that to
achieve a 10 percent reduction in those living on under US$ 32/month (from 40 to 36 percent) implies a

75 | P a g e
per capita benefit of US$ 19.5 per month and total cost of cash transfers equal to US $ 11.6 million or
1.2 percent of non-oil GDP.
Table 20: Simulated minimum cost of a program targeted to the poorest households
Reduction in population under US$ 32/month
% under US$ 32/ month (Baseline: 40)
Monthly Transfer Amount
# of Beneficiaries
Coverage of Poorest 40%
Program Budget (excluding admin costs)
% of non-oil GDP
% of Budget
% of oil GDP
% of ESI + DR
-10% 36 $19.5 49,819 10.7% 11,661,115 1.2% 0.9% 0.4% 1.5%
-20% 32 $11.8 185,061 34.1% 26,184,852 2.7% 2.0% 0.8% 3.3%
-30% 28 $17.7 174,022 32.2% 37,010,890 3.8% 2.8% 1.2% 4.6%
-40% 24 $12.7 333,531 54.7% 50,285,144 5.2% 3.9% 1.6% 6.3%
Note: Simulations using TLSPS and SP-HIES 2011
Note: Table shows minimum costs to achieve certain percentage reductions in poverty maximizing over
benefit amount and number of beneficiaries
These estimates depend on the chosen expenditure level, but analysis can be extended to determine
costs of targeting sub-groups such as the poorest 15, 20, 30 percent, or any fraction of an official
poverty line depending on national objectives and availability of fiscal resources. The table shows the
aggregated cost of transfers that does not include the administrative costs. Such costs vary; for example,
in Mexico’s Oportunidades they are about 6 percent and for Brazil’s Bolsa Família, they are 12 percent. A
major advantage of building on the Bolsa da Mãe program is that it is the only program in the country
that plays a promotional role by aiming to build human capital through promotion of school attendance.
If designed appropriately, the same sub-systems can be harnessed to expand its role to promote better
health, nutrition, and skills development.
3. Improve linkages between social assistance and human capital outcomes.
It is recommended that Ministry of Social Solidarity (MSS) adopts a clear promotional role for social
assistance as a key principle to guide its policy and performance evaluation. Timor-Leste faces huge
human capital challenges, including malnutrition rates that are among the highest in the world, low
educational attainment for children and youth, and high maternal and child mortality rates. These early
developmental barriers stifle well-being and limit the potential for productive capacity in the future. As
petroleum fund resources diminish in the coming years, investments made now to improve human
capital will determine the quality of labor force entrants in the future. Social assistance can play a
pivotal role in encouraging poor households to make investments in their children in the short-term that
will have high return on investment in the long-term, for individuals, households, and the economy.
Existing programs such as Bolsa da Mãe exemplify this type of promotional approach: the program aims
to provide resources to poor families contingent upon enrolling their children in schools and ensuring
they are fully vaccinated. However, prior to a significant scale up, Bolsa da Mãe requires further efforts

76 | P a g e
to improve the payment delivery mechanism, administrative efficiency, household co-responsibilities,
benefit levels, and smarter targeting of vulnerable groups. Overall, to achieve higher impact, the
program will require a higher budgetary allocation to cover a much greater share of eligible households.
To accelerate the growing human capital role of the current social assistance, the government may also
choose to expand the range of promotional programs for which it will need to establish clear human
capital objectives backed by simple, easily monitorable co-responsibilities that may be linked to key
policy priority areas. Examples of such co-responsibilities include school attendance, health center visits,
preventive check-ups, vaccinations, weight monitoring, education sessions, and positive behaviors for
improved child nutrition. Importantly, such incentives accorded by the MSS will require strong inter-
Ministerial effort related to supply of the relevant services. Greater promotional role of the social
assistance will not be fully effective without an adequate and accessible system of public services.
4. Move from fragmented implementation processes to a common administrative system.
Since the rapid roll out of the cash transfer programs since 2007, program implementation of each of
the cash transfer programs was never viewed in the light of standardization or consolidation among the
various programs executed by the Ministry. Current administrative systems are not cost-effective, with
parallel systems conducting similar tasks for each program.82 A systems approach involves developing
one core program management function under, for example, the Bolsa da Mãe program, with other
programs sharing the system aiming to strengthen coordination and integration of the cash transfer
programs. These functions may encompass different operational processes such as targeting,
beneficiary registry, cash delivery mechanisms, monitoring and reporting mechanisms, and evaluation of
program effectiveness. Specific recommendations are as follows:
Linkages with the National ID system - Lack of standardized personal identifiers make management of
beneficiary databases problematic as it is difficult to detect duplications of registries and fragmented
information on the same individuals. The government is currently developing a unified national ID
system under an initiative by the Ministry of Justice. Once the system is established, linking the program
beneficiary database with the National ID system will open up huge opportunities, not only for the
programs’ database management but for larger social policy development in the long-term.
Targeting - An objective, transparent, accountable and affordable targeting system will allow the
government to effectively target programs at eligible households, with admissible levels of inclusion and
exclusion errors. Although the initial cost for setting up the targeting system may be relatively high, once
an effective system is set up, it can be widely used by different programs, including social assistance
programs, scholarships, free or subsidized health care, and other social protection programs, leading to
a more coherent national social assistance policy.
82
The standardized Management Information System currently under development through a World Bank financed Social Protection Administration Project, is the first initiative within the ministry to adopt a standardized, integrated system for all cash transfer programs. The modular nature of the MIS allows considerable flexibility in the level of standardization and consolidation to be pursued by the programs.
77 | P a g e
Enrollment - Program enrollment could be conducted via a regular targeting survey or via ongoing on-
demand applications, in which potential beneficiaries visit the program office to file an application form
to be assessed for program eligibility. This process is already being implemented at a small scale for
Bolsa da Mãe, and through the village chiefs for the elderly and disability programs. A unification of this
application system as well as notification of the results of program eligibility assessment could reduce
the cost as well as improve transparency of the two programs.
Beneficiary database - Through the standardization of the MIS, program beneficiary databases should
be migrated into a unified platform, allowing the databases to identify overlapping beneficiaries.
Updating the beneficiary data should also be a synchronized process, with changes in status of eligibility,
migration, death and birth, reflected for all program databases.
Cash delivery and payments - Given the dearth of financial institutions, developing alternative cash
distribution mechanisms may be a longer-term goal. Nevertheless, there are affordable technological
solutions that may be adopted such as the use of handheld devices at the cash distribution point with an
option of using biometrics for beneficiary identification, which will greatly enhance the accountability of
the current cash distribution. These systems can also be shared among cash transfer programs to reduce
duplication and improve efficiency.
Grievance redressal - Grievance redress systems that allow the public to file complaints through phone
calls, text messages, or other electronic means are not yet developed for any of the programs.
Grievance redress is an integral component of most cash transfer programs around the world and is
crucial to ensure program accountability. Once set up, the system could be linked to the standardized
MIS, ensuring that all programs monitor the grievances filed and any remedial action taken.
Communication - Effective communication strategies and implementation of communication activities
to improve awareness of programs, their objectives, eligibility, and entitlements can strengthen
accountability and transparency of program implementation. Standardized communication strategies as
well as unified use of different media will ensure cost effectiveness as well as consistent messaging.
Monitoring and Evaluation - Current reporting monitors the achievement of planned activities,
centering on the development of an Annual Action Plan, and use of standardized forms. This system
could be strengthened to include program implementation, process monitoring, information on whether
benefits are reaching the intended beneficiaries or not, and a feedback mechanism. Annual or biannual
evaluation on the impact of these cash transfer programs could also inform policy makers and program
managers of the effectiveness of existing programs. More broadly, MSS may consider moving towards
an evidence-based approach to inform social protection policy and to support the government in design
and implementation of social protection programs. Such an approach will entail systematic efforts to
generate quality data and knowledge.

78 | P a g e
5. Review financial sustainability and introduce cost controls on veteran pensions.
The current levels of Government spending on cash transfers to veterans raises questions about long-
term fiscal sustainability, as the budget envelope for social assistance begins to decline due to the need
to shrink recurrent expenditure. There is a risk that the significant proportion of the budget devoted to
protection of veterans may limit the budget available for poverty reduction. The expenditure review of
public finances demonstrated an inexorable rise in the cost of veteran cash transfers. The budget for
these benefits increased from US$ 0.2 million to US$ 82 million in a span of 4 years, amounting to an
annual expenditure of 9 percent of non-oil GDP in 2011. To date, more than US$ 110 million has been
disbursed in direct cash transfers to veterans. The burden is rising from both extremely high levels of per
capita benefit payments as well as a very large outstanding list of applications. Currently 11,000
veterans are receiving benefits that range from US$ 230 to US$ 750 per month. Moreover, there are an
estimated 100,000 outstanding applications, which is an overwhelming number in a country of one
million people. Even if a fraction of this pool is accepted, it would result in a large additional fiscal
burden as budget would have to be allocated to cover backdated payments. It is outside the scope of
this study to prescribe specific recommendations regarding the veteran benefits. This is a difficult task
requiring extensive and focused technical assistance and involves the process of re-verification, financial
planning, review and, if necessary, amendments to legislation governing eligibility, definitions of
benefits and payment structure, reinforcing the system of checks for fraudulent claims, as well as for
addressing grievances. Most importantly this requires a political consensus, but it should be noted that
by targeting such a large proportion of funds to a very small sub-population, the government is risking
political sustainability of social assistance as large sections of the population, especially the poorest, are
missing out. It is important to note that a very complex web of legislation has already created legal
rights for all existing veterans that may not be possible to reverse, and re-verification efforts risk
creating new tensions. Nevertheless, the current scheme requires a review, and a fiscal sustainability
analysis to guide its design. As a general rule, any entitlement program is resistant to sudden cut-backs,
but changes are needed soon so they can be incremental and politically acceptable. At the very
minimum the program requires review of the generosity of the survivors’ benefits, and a moratorium on
any ad-hoc increases in benefit levels by legislatively fixing the benefit levels for an extended period of
time.

79 | P a g e
Bibliography
Bankable Frontiers Associates (2009), “The potential for new technologies and branchless banking
models to expand access to financial services in Timor-Leste”, Draft, Asian Development Bank, Dili,
Timor-Leste
Barrientos, Armando (2012), “What is the Role of Social Pensions in Asia?”, ADBI Working Paper Series
No.351
Democratic Republic of Timor-Leste (2011), “Timor-Leste Strategic Development Plan 2011-2030”, Dili,
Timor-Leste
Democratic Republic of Timor-Leste (2002), “Constitution of the Democratic Republic of Timor-Leste”,
Dili, Timor-Leste
Democratic Republic of Timor-Leste (2002b), “National Development Plan”, Dili, Timor-Leste
Democratic Republic of Timor-Leste, Ministry of Finance (2012), “Analysis of inflation in Timor-Leste”,
Dili, Timor-Leste
Democratic Republic of Timor-Leste, Ministry of Finance (2012b), “State Budget 2012. Book 1: Budget
Overview”, Dili, Timor-Leste
Democratic Republic of Timor-Leste, Ministry of Finance (2011), “State Budget 2011. Book 1: Budget
Overview”, Dili, Timor-Leste
Democratic Republic of Timor-Leste, Ministry of Finance (2011b), “Fiscal Year 2011. Budget Execution
Report for the Full Year”, Dili, Timor-Leste
Democratic Republic of Timor-Leste, Ministry of Finance (2010), “State Budget 2010. Book 1: Budget
Overview”, Dili, Timor-Leste
Democratic Republic of Timor-Leste, Ministry of Finance (2010b), “Fiscal Year 2010. Budget Execution
Report for the Full Year”, Dili, Timor-Leste
Democratic Republic of Timor-Leste, Ministry of Finance (2009), "General Budget of the State and State
Plan for 2009. 1 January to 31 December 2009", Dili, Timor-Leste
Democratic Republic of Timor-Leste, Ministry of Finance (2009b), “Fiscal Year 2009. Budget Execution
Report up to the Fourth Quarter”, Dili, Timor-Leste
Democratic Republic of Timor-Leste, Ministry of Finance (2008), “State Budget 2008. Book 1: Budget
Overview”, Dili, Timor-Leste
Democratic Republic of Timor-Leste, Ministry of Finance (2008b), “Fiscal Year 2008. Budget Execution
Report up to the Fourth Quarter”, Dili, Timor-Leste

80 | P a g e
Grosh et al (2008), “For Protection & Promotion: The design and implementation of effective safety
nets”, World Bank, Washington DC
IMF (2008), “Democratic Republic of Timor-Leste: Staff Report for the 2008 Article IV Consultation”,
International Monetary Fund, Washington DC
Independent Evaluation Group (2011), “Timor-Leste Country Program Evaluation, 2000-2010”, The
World Bank Group, Washington DC
International Crisis Group (2011), “Timor-Leste’s Veterans: An Unfinished Struggle?”, Asia Briefing No.
129, ICG: Dili/Jakarta/Brussels
International Food Policy Research Institute (IFRPI) (2011), “Global Hunger Index, The challenge of
hunger: taming price spikes and excessive food price volatility”, Bonn, Washington DC, Dublin
Mont D. (2007), “Measuring Disability Prevalence”, Social Protection Discussion Paper Nr. 0706, The
World Bank, Washington DC
National Statistics Institute (Direcção Nacional de Estatística – DNE) Timor-Leste (2011), “Household
Income and Expenditure Survey”, Dili, Timor-Leste
National Statistics Institute (Direcção Nacional de Estatística – DNE) Timor-Leste (2011b), “Timor-Leste
Social Protection Survey”, Dili, Timor-Leste
National Statistics Institute (Direcção Nacional de Estatística – DNE) Timor-Leste (2010), “Demographic
and Health Survey”, Dili, Timor-Leste
National Statistics Institute (Direcção Nacional de Estatística – DNE) Timor-Leste (2010b), “Labor Force
Survey”, Dili, Timor-Leste
National Statistics Institute (Direcção Nacional de Estatística – DNE) Timor-Leste (2010c), “Timor-Leste
Census”, Dili, Timor-Leste
United Nations Development Program (UNDP) (2011), “Human Development Index”,
http://hdr.undp.org/en/statistics/
United Nations Development Program (UNDP) (2011b), “Timor-Leste Human Development Report 2011:
Managing natural resources for human development”, Dili, Timor-Leste
United Nations Integrated Mission in Timor-Leste (2011), “Timor-Leste communication and media
survey”, Dili, Timor-Leste, Retrieved from: http://unmit.unmissions.org/Portals/UNMIT
/Media_Survey_Report_CPIO_FINAL_ENG.pdf
Wiener, Mitch (forthcoming), “Financial Analysis for the Temporary Social Security Regime Regarding
Old Age, Disability and Death for State Workers in Timor-Leste”, The World Bank, Jakarta, Indonesia

81 | P a g e
World Bank (forthcoming), “A unique and diverse region: Taking stock of Social Assistance Performance
in East Asia and Pacific”, Washington DC
World Bank (2012), “East Asia and Pacific Economic Update, May 2012: Capturing New Sources of
Growth”, Washington DC, Accessed online on 6 July 2012,
http://www.worldbank.org/en/news/2012/05/23/east-asia-and-pacific-economic-update-may-2012.
World Bank (2012b), “Resilience, Equity, and Opportunity: Social Protection and Labor Strategy 2012-
2022”, Washington DC
World Bank (2010), “Violence in the City: Understanding and Supporting Community Responses to
Urban Violence”, Washington DC
World Bank and Directorate of National Statistics (2008), “Timor-Leste: Poverty in a Young Nation.
Preliminary Draft”, Dili, Timor-Leste
World Bank (2003), “Main report. Vol.1 of Timor-Leste – Poverty Assessment: poverty in a new nation-
analysis for action”, Washington DC

82 | P a g e
Annex 1: Summary of Non-MSS Social Assistance
Programs
Cash for work (TIM Works) Implemented by: Secretary of State for Vocational Training and Employment with funding and technical support from the International Labor Organization Description: Provides poor individuals in rural communities with short-term labor-intensive work opportunities, compensated at a rate of US$ 3/day. TIM Works projects emphasize opportunities for women and youth in particular. The project is designed to provide an average of 44 paid days of work to each individual employed under the program. Temporary Work Program for Youth Implemented by: Secretary of State for Vocational Training and Employment, with support from the ILO Description: This program provides for (i) youth (ages 15-29) employment policy development; (ii) career information, guidance and counseling for youth, and information on employment and training opportunities through Youth Career Centers; (iii) youth employment in labor-intensive public works; and (iv) vocational training, accreditation, and skills-based employment opportunities. Food Security Fund Implemented by: Ministry of Tourism, Commerce, and Industry Description: Designed to combat food shortage and high prices for food staples. Originally, the Fund covered the cost of purchasing rice and maize, and supplied food staples at subsidized prices in local markets, particularly in rural areas. As of 2011, the subsidies have ended, though food imports continue. Though intended as a poverty prevention measure, subsidized food was sold on the open market, and was thus available to non-poor populations as well. School Feeding Implemented by: Ministry of Education (lead), with past support from the World Food Program. Description: This program, designed to combat hunger and encourage higher rates of school attendance, provides for one hot meal per day to children in primary, pre-secondary, and secondary schools. Payments to Petitioners Implemented by: Office of the Prime Minister Description: The ‘petitioners’, a group of armed forces members who left the military to protest perceived discrimination, a dispute which contributed to the 2006/07 crisis, were provided with a grant of US$ 8,000 each to encourage them to de-camp from a Dili-based IDP camp and return to their homes.