Embed Size (px)
Citation preview

TIMELESS LEARNINGPOLICY & PRACTICE

STEVEN J. ADAMOWSKI, PH.D.Superintendent Hartford Public Schools

3
National Academy Foundation
2010 Leadership SummitJuly 9, 2010
Career Academies in a Systemic Education Reform Strategy: The Hartford Experience

4
Hartford’s Context
• In the second wealthiest state in the U.S.*
• The second poorest city per capita in the country*
• With the greatest achievement gap of all 50 states**
• 93% student poverty rate***
* 2000 Census** National Assessment of Educational Progress (NAEP)***As measured by eligibility for free lunch
5
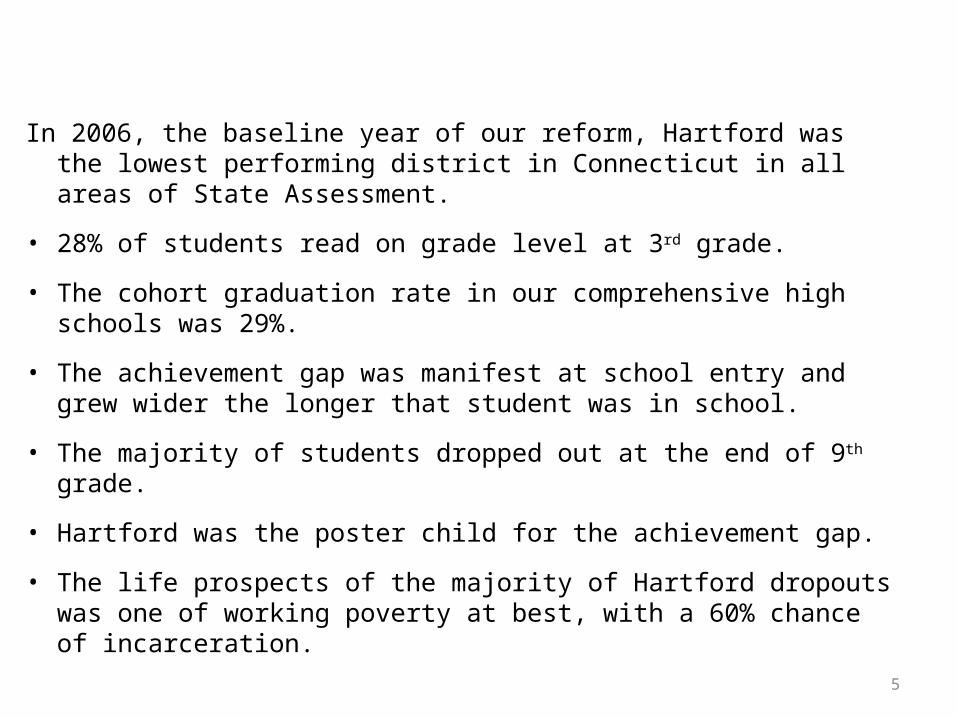
In 2006, the baseline year of our reform, Hartford was the lowest performing district in Connecticut in all areas of State Assessment.
• 28% of students read on grade level at 3rd grade.
• The cohort graduation rate in our comprehensive high schools was 29%.
• The achievement gap was manifest at school entry and grew wider the longer that student was in school.
• The majority of students dropped out at the end of 9th grade.
• Hartford was the poster child for the achievement gap.
• The life prospects of the majority of Hartford dropouts was one of working poverty at best, with a 60% chance of incarceration.

6
Vision
From a bureaucratic, dysfunctional, low-performing school system to…
…a system of high-performing, distinctive schools of choice. The attainment of Hartford students in reading, math, science, and college readiness will be reflective of the high educational outcomes of the State of Connecticut.

THE BIG QUESTION
Incremental Improvements
FundamentalChange
MoreResources
EffectiveManagement
ManagedInstruction
PerformanceEmpowerment
(Portfolio)
Managed Performance Empowerment (MPE)
OutsideExpertise
Command&
ControlPrograms
SalariesFacilities
Technology
Choosing A Theory of Action

8
Two Pillars of Reform
Managed Performance Empowerment
Theory of Action
An “All Choice”System of Schools
Hartford’s Education Reform

9
The Managed Performance Empowerment Theory of Action
• The District defines its relationship with each school on the basis of the school’s performance.
• High-performing and/or significantly improving schools are given considerable autonomy and freedom from bureaucratic operating constraints.
• Chronically low-performing schools that fail to improve are subject to District intervention, redesign, closure or replacement with higher-performing school models.
10
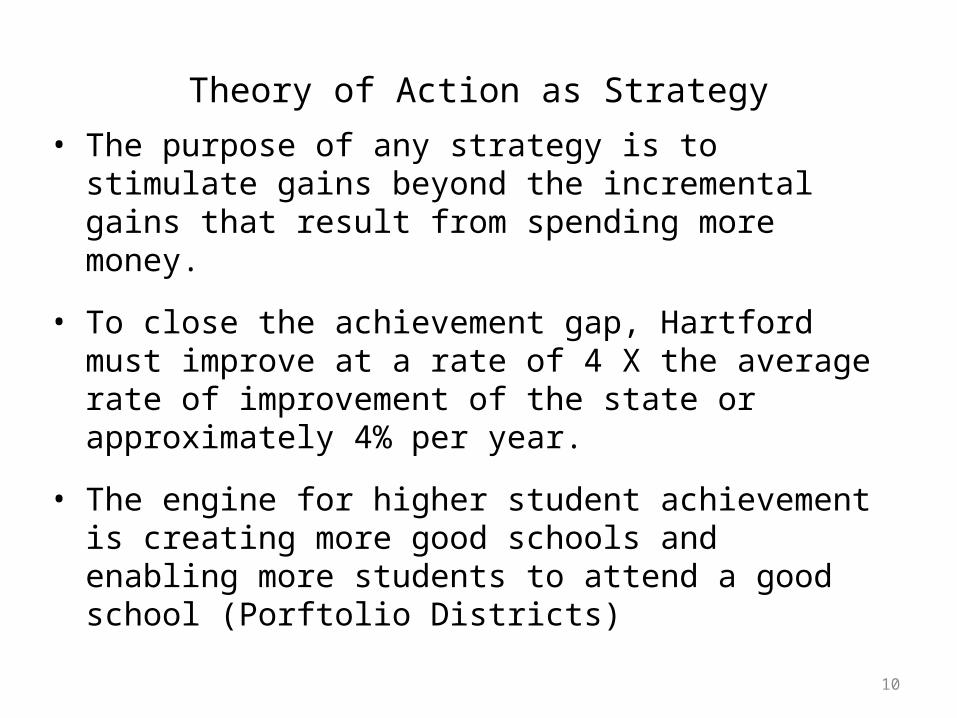
Theory of Action as Strategy
• The purpose of any strategy is to stimulate gains beyond the incremental gains that result from spending more money.
• To close the achievement gap, Hartford must improve at a rate of 4 X the average rate of improvement of the state or approximately 4% per year.
• The engine for higher student achievement is creating more good schools and enabling more students to attend a good school (Porftolio Districts)

11 Schools not consisting of a grade that participates in the CMT or CAPT : Bulkeley Upper , HPHS Freshman Academy 09/22/09

12
• “Every organization is perfectly designed to get the results it is getting.” Peter Drucker That is true for all of our organizations.
• The past ten years have taught us a lot about successful urban school reform.
• How do we apply what we know to redesigning an educational system that can close the achievement gap?
• How do you design a school in which 80% to 90% of achievement is due to school effects?
13
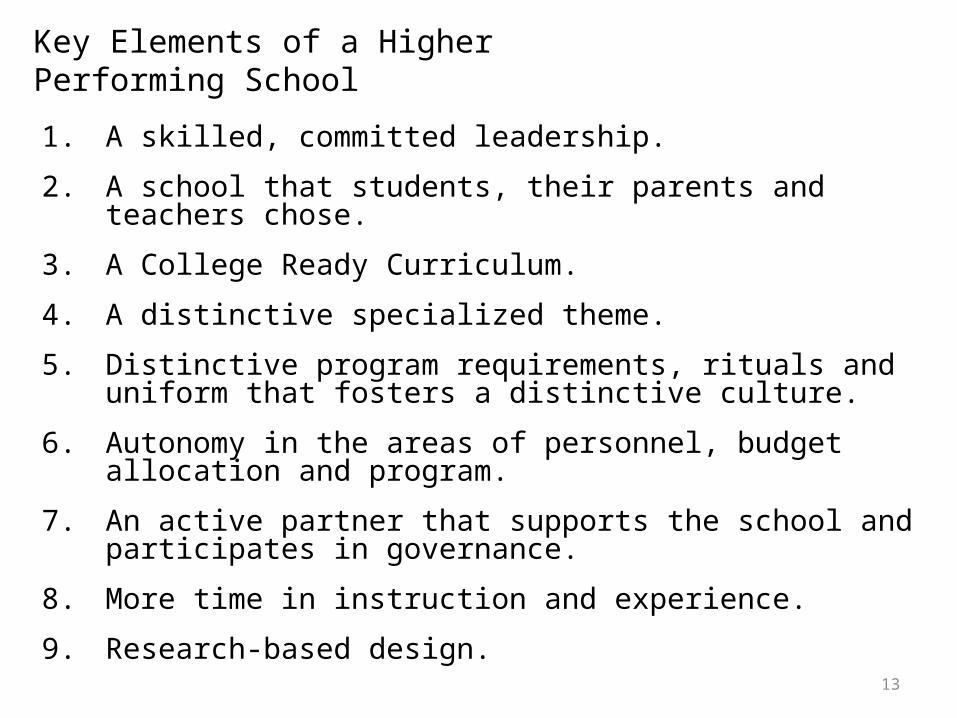
1. A skilled, committed leadership.
2. A school that students, their parents and teachers chose.
3. A College Ready Curriculum.
4. A distinctive specialized theme.
5. Distinctive program requirements, rituals and uniform that fosters a distinctive culture.
6. Autonomy in the areas of personnel, budget allocation and program.
7. An active partner that supports the school and participates in governance.
8. More time in instruction and experience.
9. Research-based design.
Key Elements of a Higher Performing School
14
1. Rigor
2. Relevance
3. Relationship
The 3 R’s of High School Reform
15
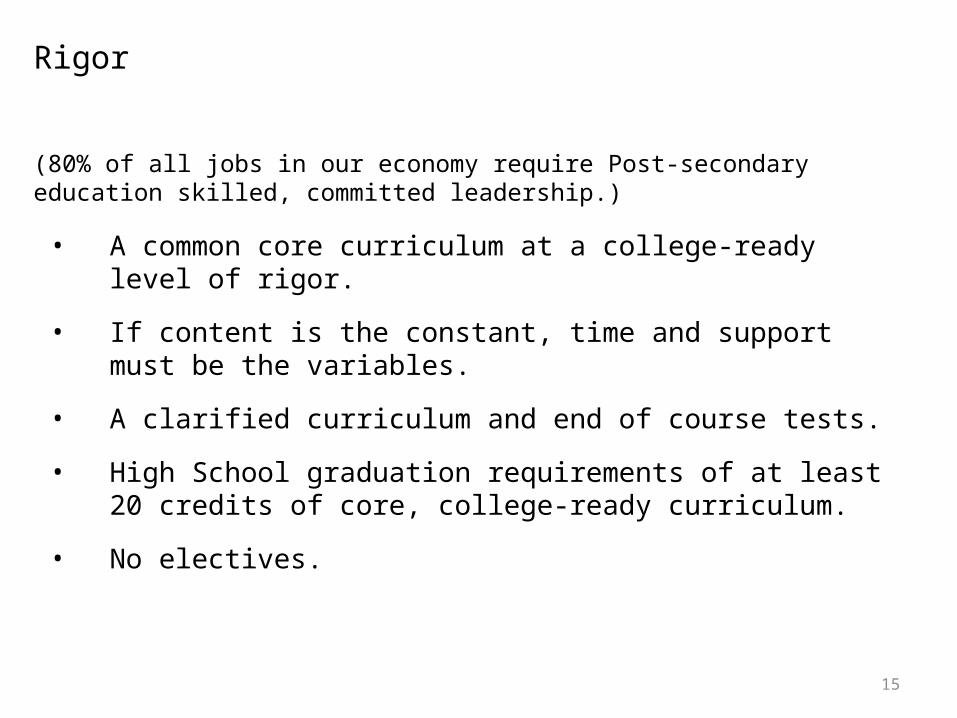
• A common core curriculum at a college-ready level of rigor.
• If content is the constant, time and support must be the variables.
• A clarified curriculum and end of course tests.
• High School graduation requirements of at least 20 credits of core, college-ready curriculum.
• No electives.
Rigor
(80% of all jobs in our economy require Post-secondary education skilled, committed leadership.)

16
• At least 5 credits of industry-based curriculum on the school’s theme.
• A “compensated” internship as capstone.
• Advisory Board support and co-governance.
Relevance
(Students are more motivated when they chose a program that address their interests, and career or post-secondary aspirations.)
17
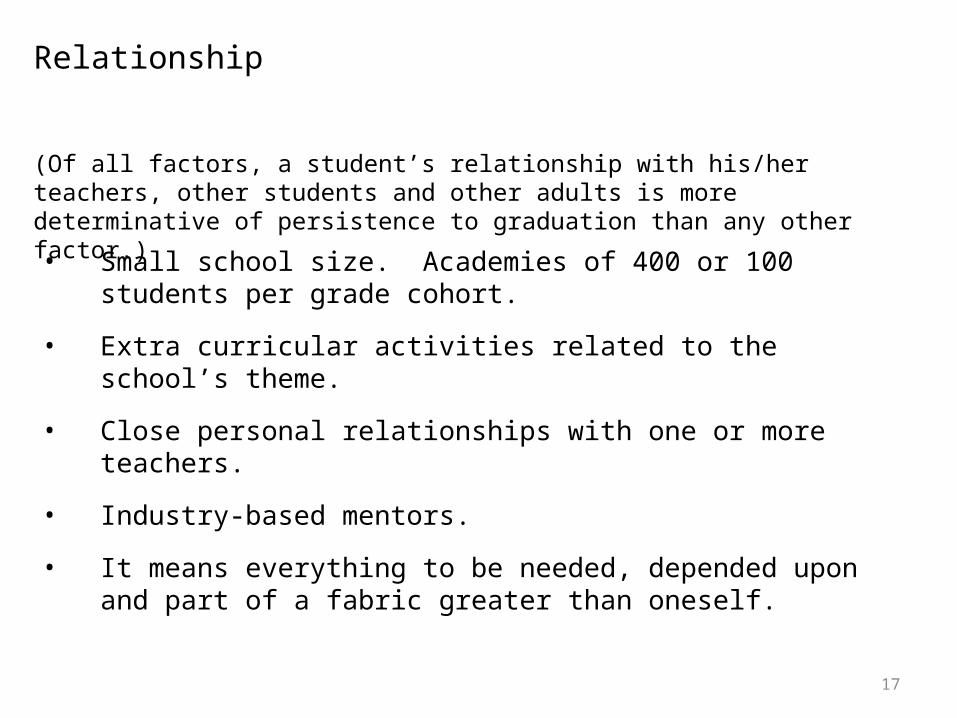
• Small school size. Academies of 400 or 100 students per grade cohort.
• Extra curricular activities related to the school’s theme.
• Close personal relationships with one or more teachers.
• Industry-based mentors.
• It means everything to be needed, depended upon and part of a fabric greater than oneself.
Relationship
(Of all factors, a student’s relationship with his/her teachers, other students and other adults is more determinative of persistence to graduation than any other factor.)

18
Pathways to Technology (IT)
Engineering and Green Technologies (Engineering)
High School, Inc. (Insurance and Banking)
Our goal is to have all our NAF Schools reach “Distinguished Academy” status by 2012.
Hartford’s NAF Academies Lead the Way in High School Reform
19
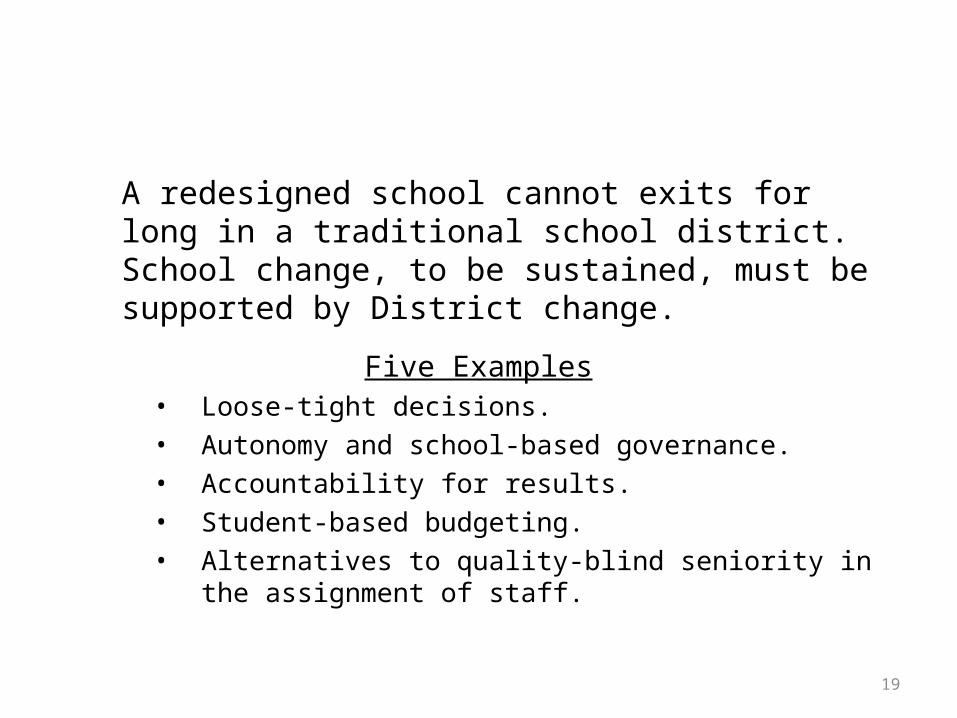
A redesigned school cannot exits for long in a traditional school district. School change, to be sustained, must be supported by District change.
Five Examples• Loose-tight decisions.• Autonomy and school-based governance.• Accountability for results.• Student-based budgeting.• Alternatives to quality-blind seniority in the
assignment of staff.
20
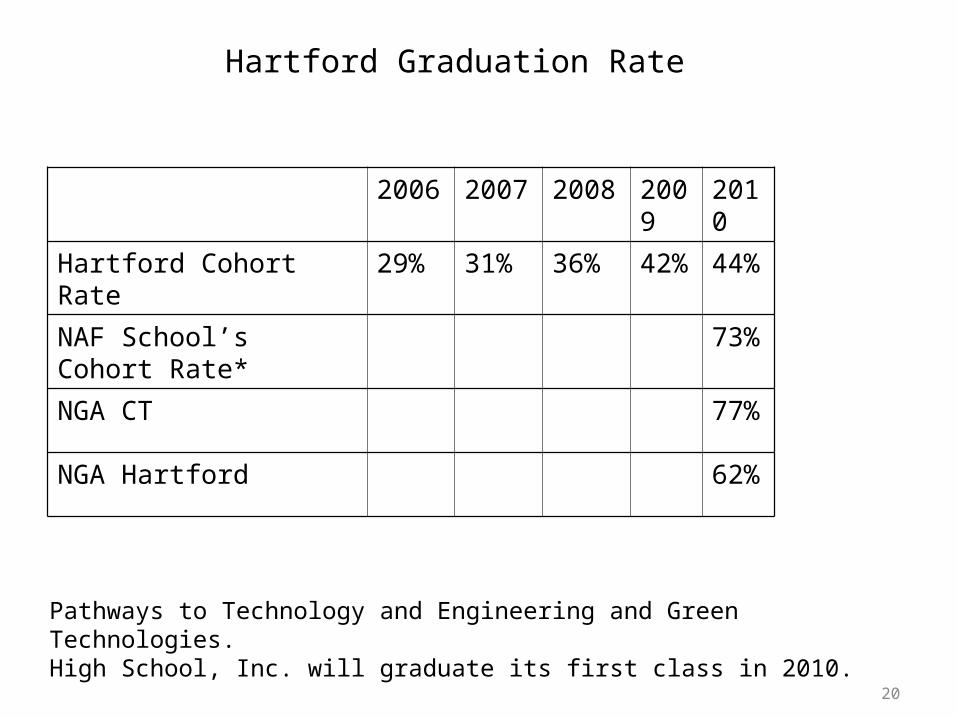
Hartford Graduation Rate
2006 2007 2008 2009
2010
Hartford Cohort Rate 29% 31% 36% 42%
44%
NAF School’s Cohort Rate*
73%
NGA CT 77%
NGA Hartford 62%
Pathways to Technology and Engineering and Green Technologies. High School, Inc. will graduate its first class in 2010.
21
2.1
1.7
0.5
2.3
0.7
0
0.5
1
1.5
2
2.5
Hartford New Haven Bridgeport Waterbury Stamford
Statewide Average
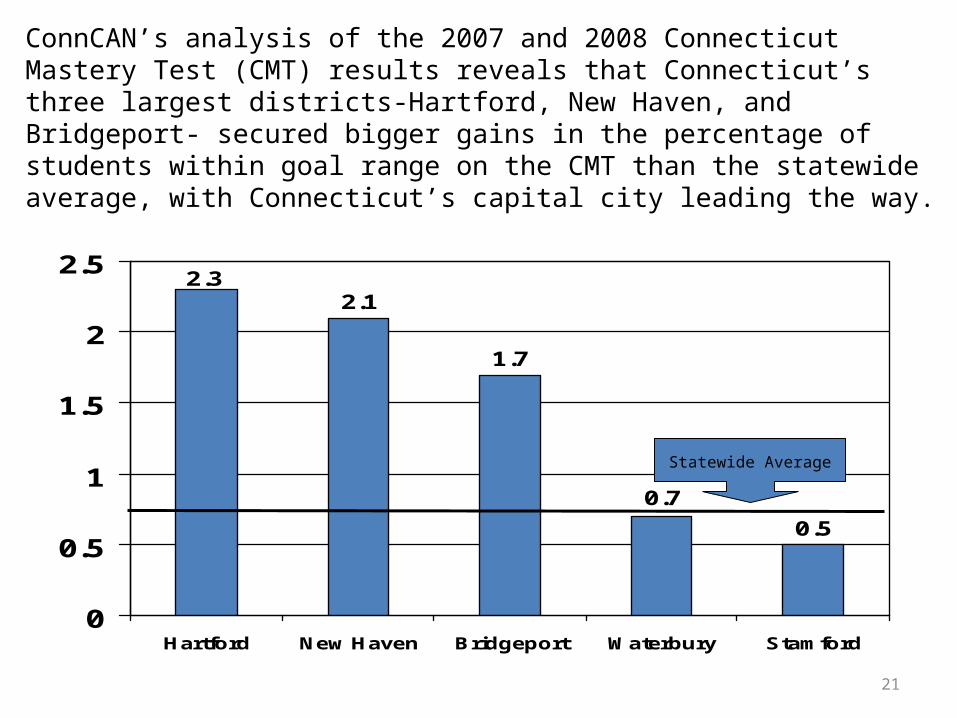
ConnCAN’s analysis of the 2007 and 2008 Connecticut Mastery Test (CMT) results reveals that Connecticut’s three largest districts-Hartford, New Haven, and Bridgeport- secured bigger gains in the percentage of students within goal range on the CMT than the statewide average, with Connecticut’s capital city leading the way.
22
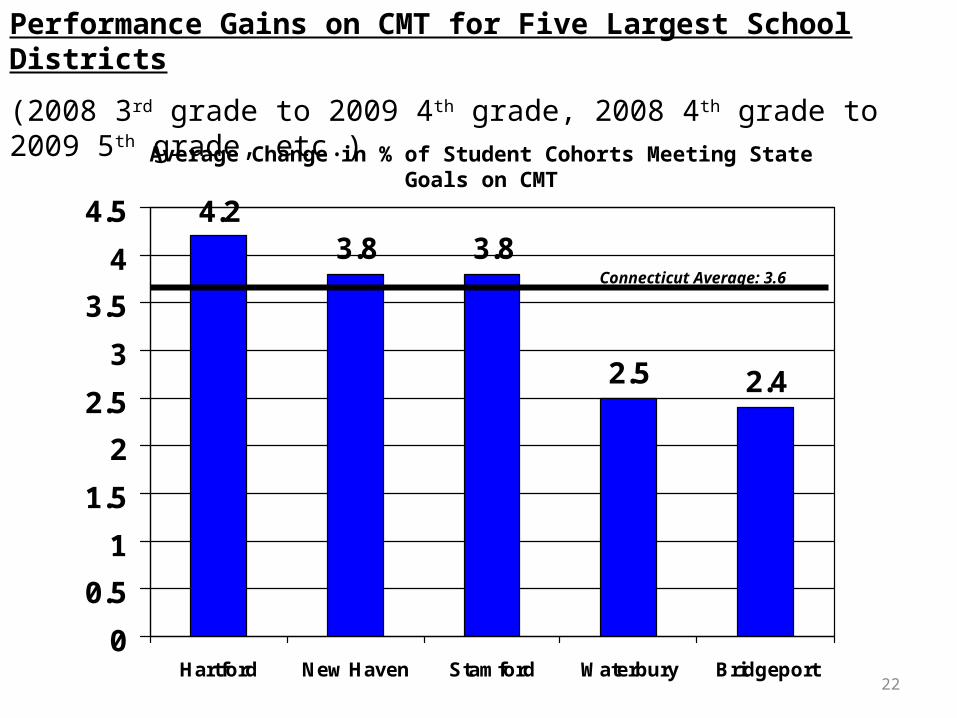
Performance Gains on CMT for Five Largest School Districts
(2008 3rd grade to 2009 4th grade, 2008 4th grade to 2009 5th grade, etc.)
4.23.8 3.8
2.5 2.4
0
0.5
1
1.5
2
2.5
3
3.5
4
4.5
Hartford New Haven Stamford Waterbury Bridgeport
Connecticut Average: 3.6
Average Change in % of Student Cohorts Meeting State Goals on CMT
2323
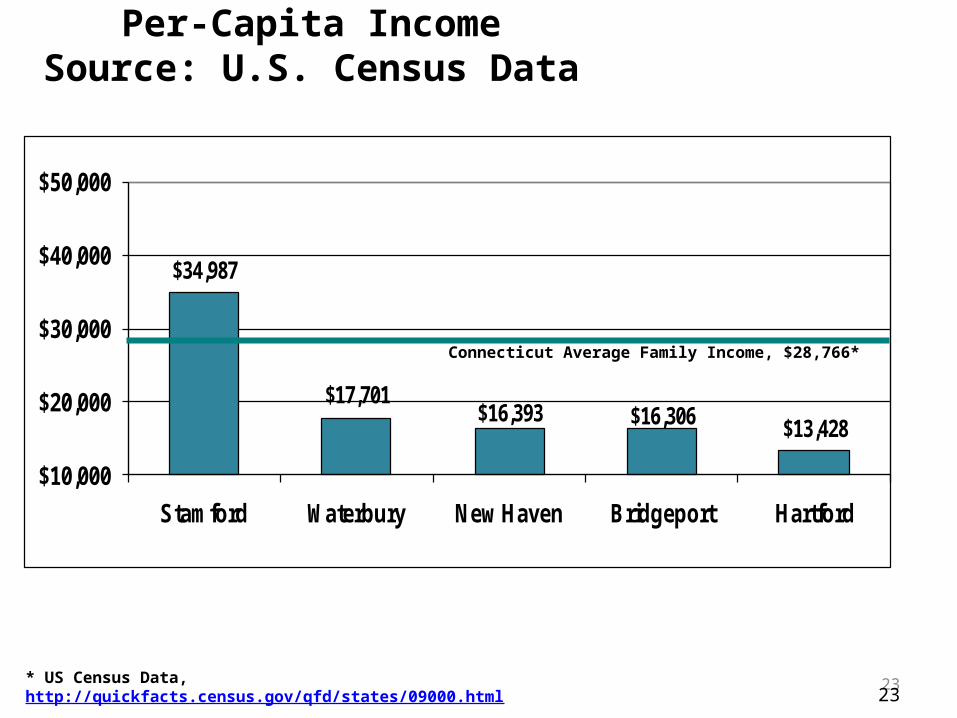
Per-Capita IncomeSource: U.S. Census Data
$34,987
$17,701$16,393 $16,306 $13,428
$10,000
$20,000
$30,000
$40,000
$50,000
Stamford Waterbury New Haven Bridgeport Hartford
Connecticut Average Family Income, $28,766*
* US Census Data, http://quickfacts.census.gov/qfd/states/09000.html

24
“Every organization is perfectly designed to get the results it is getting.”
Peter Drucker
NAF is the implementation engine for a high school design capable of closing the achievement gap for students regardless of income and family background.