Embed Size (px)
Citation preview
TILT TESTING OF TWO HEAVY VEHICLES
AND RELATED PERFORMANCE ISSUES
Hans Prem, Luan Mai, Lazslo (Les) Brusza
Mechanical System Dynamics Pty Ltd
Mechanical System Dynamics Pty Ltd
Queensland Transport
Dr Hans Prem
Director and Senior Consultant
14 Browning Drive, Templestowe, VIC 3106, Australia
+61 3 9841 6485
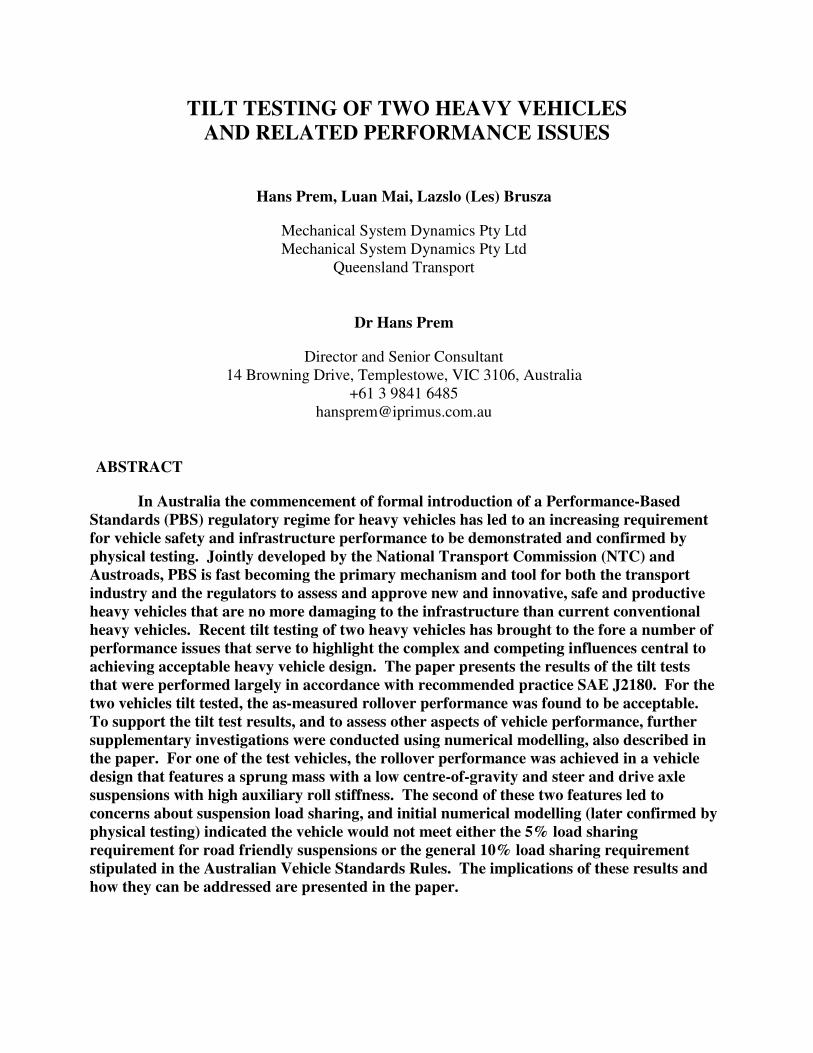
ABSTRACT
In Australia the commencement of formal introduction of a Performance-Based
Standards (PBS) regulatory regime for heavy vehicles has led to an increasing requirement
for vehicle safety and infrastructure performance to be demonstrated and confirmed by
physical testing. Jointly developed by the National Transport Commission (NTC) and
Austroads, PBS is fast becoming the primary mechanism and tool for both the transport
industry and the regulators to assess and approve new and innovative, safe and productive
heavy vehicles that are no more damaging to the infrastructure than current conventional
heavy vehicles. Recent tilt testing of two heavy vehicles has brought to the fore a number of
performance issues that serve to highlight the complex and competing influences central to
achieving acceptable heavy vehicle design. The paper presents the results of the tilt tests
that were performed largely in accordance with recommended practice SAE J2180. For the
two vehicles tilt tested, the as-measured rollover performance was found to be acceptable.
To support the tilt test results, and to assess other aspects of vehicle performance, further
supplementary investigations were conducted using numerical modelling, also described in
the paper. For one of the test vehicles, the rollover performance was achieved in a vehicle
design that features a sprung mass with a low centre-of-gravity and steer and drive axle
suspensions with high auxiliary roll stiffness. The second of these two features led to
concerns about suspension load sharing, and initial numerical modelling (later confirmed by
physical testing) indicated the vehicle would not meet either the 5% load sharing
requirement for road friendly suspensions or the general 10% load sharing requirement
stipulated in the Australian Vehicle Standards Rules. The implications of these results and
how they can be addressed are presented in the paper.
TILT TESTING OF TWO HEAVY VEHICLES
AND RELATED PERFORMANCE ISSUES
Hans Prem, Luan Mai, Lazslo (Les) Brusza
Mechanical System Dynamics Pty Ltd
Mechanical System Dynamics Pty Ltd
Queensland Transport
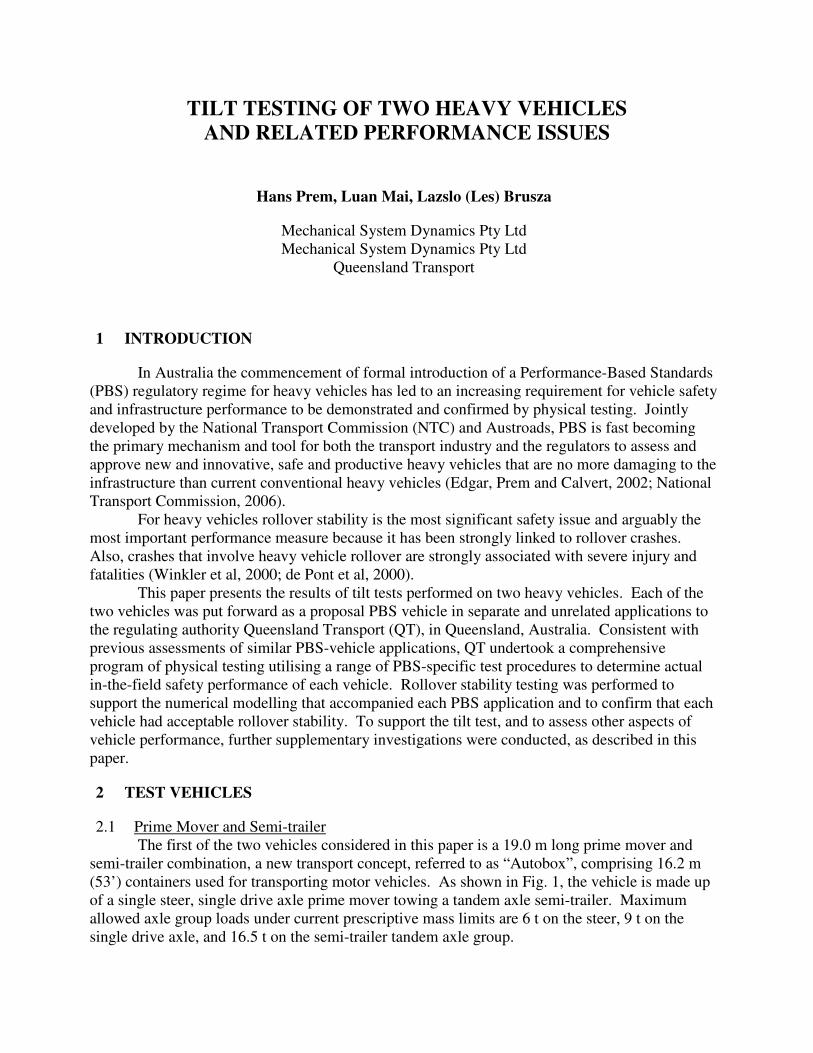
1 INTRODUCTION
In Australia the commencement of formal introduction of a Performance-Based Standards
(PBS) regulatory regime for heavy vehicles has led to an increasing requirement for vehicle safety
and infrastructure performance to be demonstrated and confirmed by physical testing. Jointly
developed by the National Transport Commission (NTC) and Austroads, PBS is fast becoming
the primary mechanism and tool for both the transport industry and the regulators to assess and
approve new and innovative, safe and productive heavy vehicles that are no more damaging to the
infrastructure than current conventional heavy vehicles (Edgar, Prem and Calvert, 2002; National
Transport Commission, 2006).
For heavy vehicles rollover stability is the most significant safety issue and arguably the
most important performance measure because it has been strongly linked to rollover crashes.
Also, crashes that involve heavy vehicle rollover are strongly associated with severe injury and
fatalities (Winkler et al, 2000; de Pont et al, 2000).
This paper presents the results of tilt tests performed on two heavy vehicles. Each of the
two vehicles was put forward as a proposal PBS vehicle in separate and unrelated applications to
the regulating authority Queensland Transport (QT), in Queensland, Australia. Consistent with
previous assessments of similar PBS-vehicle applications, QT undertook a comprehensive
program of physical testing utilising a range of PBS-specific test procedures to determine actual
in-the-field safety performance of each vehicle. Rollover stability testing was performed to
support the numerical modelling that accompanied each PBS application and to confirm that each
vehicle had acceptable rollover stability. To support the tilt test, and to assess other aspects of
vehicle performance, further supplementary investigations were conducted, as described in this
paper.
2 TEST VEHICLES
2.1 Prime Mover and Semi-trailer
The first of the two vehicles considered in this paper is a 19.0 m long prime mover and
semi-trailer combination, a new transport concept, referred to as “Autobox”, comprising 16.2 m
(53’) containers used for transporting motor vehicles. As shown in Fig. 1, the vehicle is made up
of a single steer, single drive axle prime mover towing a tandem axle semi-trailer. Maximum
allowed axle group loads under current prescriptive mass limits are 6 t on the steer, 9 t on the
single drive axle, and 16.5 t on the semi-trailer tandem axle group.

To accommodate the motor vehicles on two decks within the containers there are two
different nominal construction heights for the containers, 3.2 m and 3.5 m. Consequently, the
Autobox concept vehicle requires operational heights of 4.3 m and 4.6 m, respectively. The
containers have a capacity to carry 6 motor vehicles; 3 on each of the floor and upper deck.
The PBS evaluation and tilt test was performed on the 4.6 m high variant, which has the
highest centre-of-gravity (CG). General views of the vehicle are shown below in Fig. 2.
Fig. 1 - Side view drawing of the Autobox prime mover (typical) and semi-trailer
combination (supplied courtesy of Bisitecniks Pty Ltd).
Fig. 2 - General views of the Autobox vehicle and loading operations
(supplied courtesy of Bisitecniks Pty Ltd and Toll Holdings Pty Ltd)
A number of different prime movers can be used having different suspensions, whereas
the semi-trailer runs on BPW airbag suspensions model ALU/30K.
2.2 8x4 Rigid Truck Road Tanker
The second of the two vehicles considered in this paper is a road tanker, comprising an
8x4 rigid truck towing a five-axle dog-trailer, having an overall length of 22 m and a Gross
Combination Mass (GCM) of 55 t. The vehicle is shown in side view below in Fig. 3.
Fig. 3 - Side view drawing of the 8x4 truck and 5-axle dog-trailer road tanker
(reproduced from Australasian Transport News, 2005).
The original test schedule called for both the 8x4 rigid truck as well as the five-axle dog-
trailer to be tilt tested. However, due to problems with logistics on the day tilt testing was to take
place only the truck could be made available. Therefore, the test results presented in this paper
are for the rigid truck only. The test vehicle as supplied is shown below in Fig. 4, partially on the
tilt table and the approach ramp.
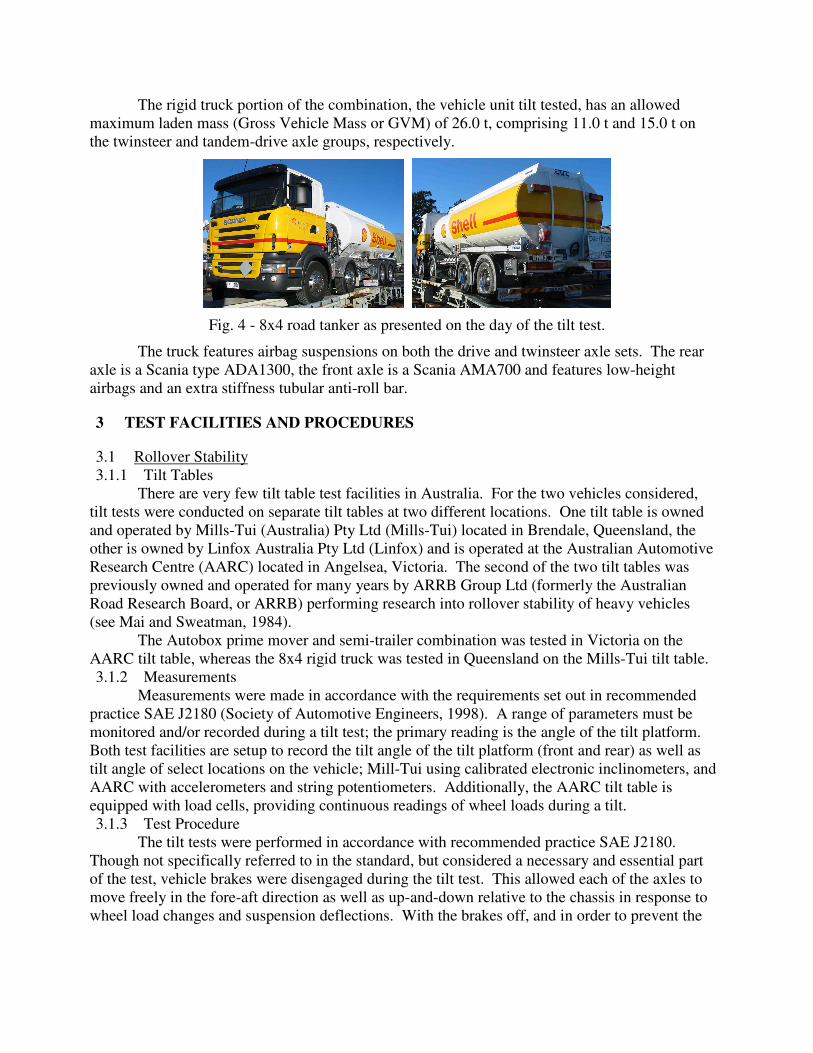
The rigid truck portion of the combination, the vehicle unit tilt tested, has an allowed
maximum laden mass (Gross Vehicle Mass or GVM) of 26.0 t, comprising 11.0 t and 15.0 t on
the twinsteer and tandem-drive axle groups, respectively.
Fig. 4 - 8x4 road tanker as presented on the day of the tilt test.
The truck features airbag suspensions on both the drive and twinsteer axle sets. The rear
axle is a Scania type ADA1300, the front axle is a Scania AMA700 and features low-height
airbags and an extra stiffness tubular anti-roll bar.
3 TEST FACILITIES AND PROCEDURES
3.1 Rollover Stability
3.1.1 Tilt Tables
There are very few tilt table test facilities in Australia. For the two vehicles considered,
tilt tests were conducted on separate tilt tables at two different locations. One tilt table is owned
and operated by Mills-Tui (Australia) Pty Ltd (Mills-Tui) located in Brendale, Queensland, the
other is owned by Linfox Australia Pty Ltd (Linfox) and is operated at the Australian Automotive
Research Centre (AARC) located in Angelsea, Victoria. The second of the two tilt tables was
previously owned and operated for many years by ARRB Group Ltd (formerly the Australian
Road Research Board, or ARRB) performing research into rollover stability of heavy vehicles
(see Mai and Sweatman, 1984).
The Autobox prime mover and semi-trailer combination was tested in Victoria on the
AARC tilt table, whereas the 8x4 rigid truck was tested in Queensland on the Mills-Tui tilt table.
3.1.2 Measurements
Measurements were made in accordance with the requirements set out in recommended
practice SAE J2180 (Society of Automotive Engineers, 1998). A range of parameters must be
monitored and/or recorded during a tilt test; the primary reading is the angle of the tilt platform.
Both test facilities are setup to record the tilt angle of the tilt platform (front and rear) as well as
tilt angle of select locations on the vehicle; Mill-Tui using calibrated electronic inclinometers, and
AARC with accelerometers and string potentiometers. Additionally, the AARC tilt table is
equipped with load cells, providing continuous readings of wheel loads during a tilt.
3.1.3 Test Procedure
The tilt tests were performed in accordance with recommended practice SAE J2180.
Though not specifically referred to in the standard, but considered a necessary and essential part
of the test, vehicle brakes were disengaged during the tilt test. This allowed each of the axles to
move freely in the fore-aft direction as well as up-and-down relative to the chassis in response to
wheel load changes and suspension deflections. With the brakes off, and in order to prevent the
vehicle from rolling off the table (in the fore-aft direction), one wheel was chocked and a pair of
“X” safety straps placed loosely between the steer axles and the tilt table.
3.2 Static Load Sharing Effectiveness
Following the tilt tests conducted on the second vehicle, concerns about the effectiveness
of suspension static load sharing were raised, as discussed later in this paper. To evaluate static
loading sharing, and in the complete absence of formal test procedures in the regulations (see
later), a test previously developed by Mechanical System Dynamics Pty Ltd (MSD) was
employed, which involves traversing a standard bump profile, shown below in Fig. 5, at creep
speed; not faster than 2 km/h in order to maintain static or quasi-static load conditions. To test for
effective static load sharing that would be consistent and in accord with the Regulations – and
other studies – it was necessary to traverse the test profile twice. In the first pass the bump is
placed in only the left or right wheelpath, causing a disturbance to individual tyres (or dual tyres).
This was designed to test individual tyre load variations as stipulated in the Regulations
(Commonwealth of Australia, 1999). In the second pass the bump is placed simultaneously in
both wheel paths, causing entire individual axles in the group to be raised and lowered. This is
designed to test load sharing between axles. Though static load sharing between axles is not
called for specifically in the Regulations, it appears to be the performance parameter that is most
often, if not exclusively, measured and reported (see, for example, National Road Transport
Commission, 1996).
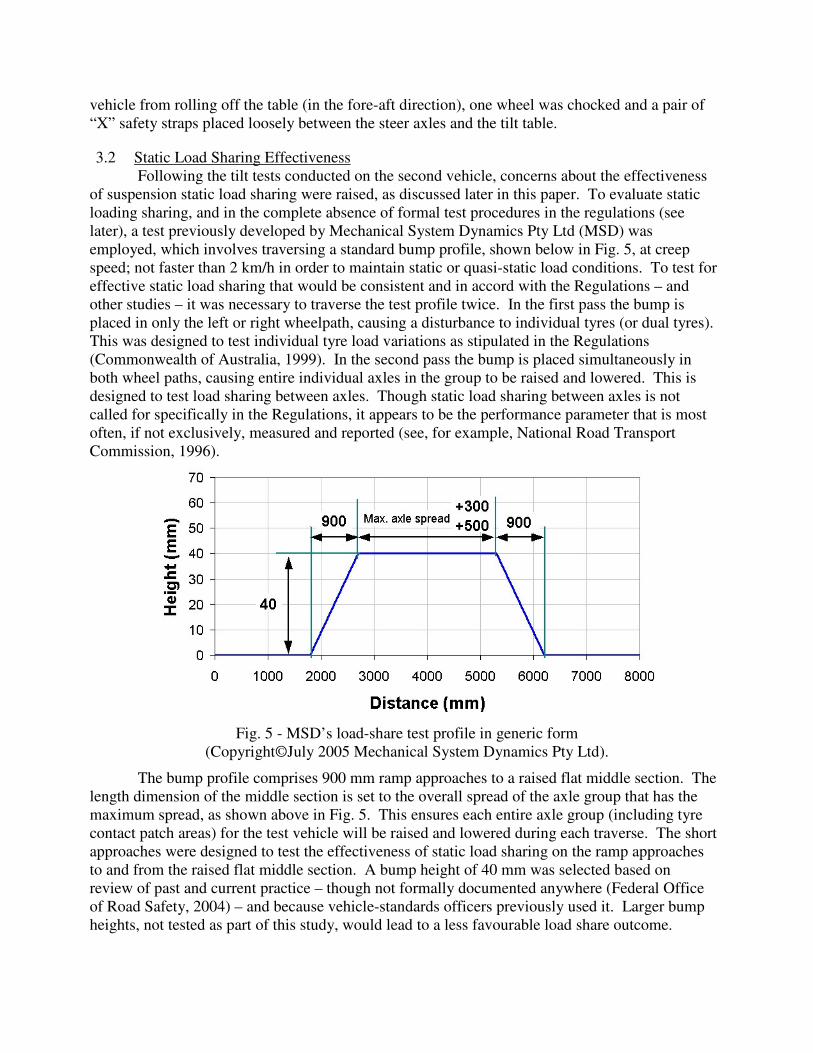
Fig. 5 - MSD’s load-share test profile in generic form
(Copyright©July 2005 Mechanical System Dynamics Pty Ltd).
The bump profile comprises 900 mm ramp approaches to a raised flat middle section. The
length dimension of the middle section is set to the overall spread of the axle group that has the
maximum spread, as shown above in Fig. 5. This ensures each entire axle group (including tyre
contact patch areas) for the test vehicle will be raised and lowered during each traverse. The short
approaches were designed to test the effectiveness of static load sharing on the ramp approaches
to and from the raised flat middle section. A bump height of 40 mm was selected based on
review of past and current practice – though not formally documented anywhere (Federal Office
of Road Safety, 2004) – and because vehicle-standards officers previously used it. Larger bump
heights, not tested as part of this study, would lead to a less favourable load share outcome.
Two low-speed traversals (single and dual bumps) are sufficient to test the effectiveness of
the load sharing systems of all axle groups to distribute static loads. The method can also be used
to assess interactions between axle groups and their load share systems, as well as identify whole-
of-vehicle issues that may impact on load sharing effectiveness.
4 NUMERICAL MODELS
The physical testing was preceded and later supplemented by numerical modelling and
simulation, as described elsewhere in the relevant sections of this paper. Numerical models were
created of both vehicles using the ADAMS multi-body dynamics simulation software package
(MSC.Software, 2006) and the MSD Atruck™ toolbox. Mechanical properties were assigned to
the models consistent with the performance of actual components and information sourced from
manufacturers, component suppliers, published reports and the literature, or derived from first
principles.
Specific component level performance data could not be obtained for all parameters, and
some simplifications to the models were inevitable. For example, the main sprung mass and
chassis components were treated as rigid elements even though MSD’s Atruck™ toolbox has
provision for flexible bodies to be incorporated. Suspensions and tyre elements in each model are
non-linear incorporating state-of-the-art features. General views of the two numerical models are
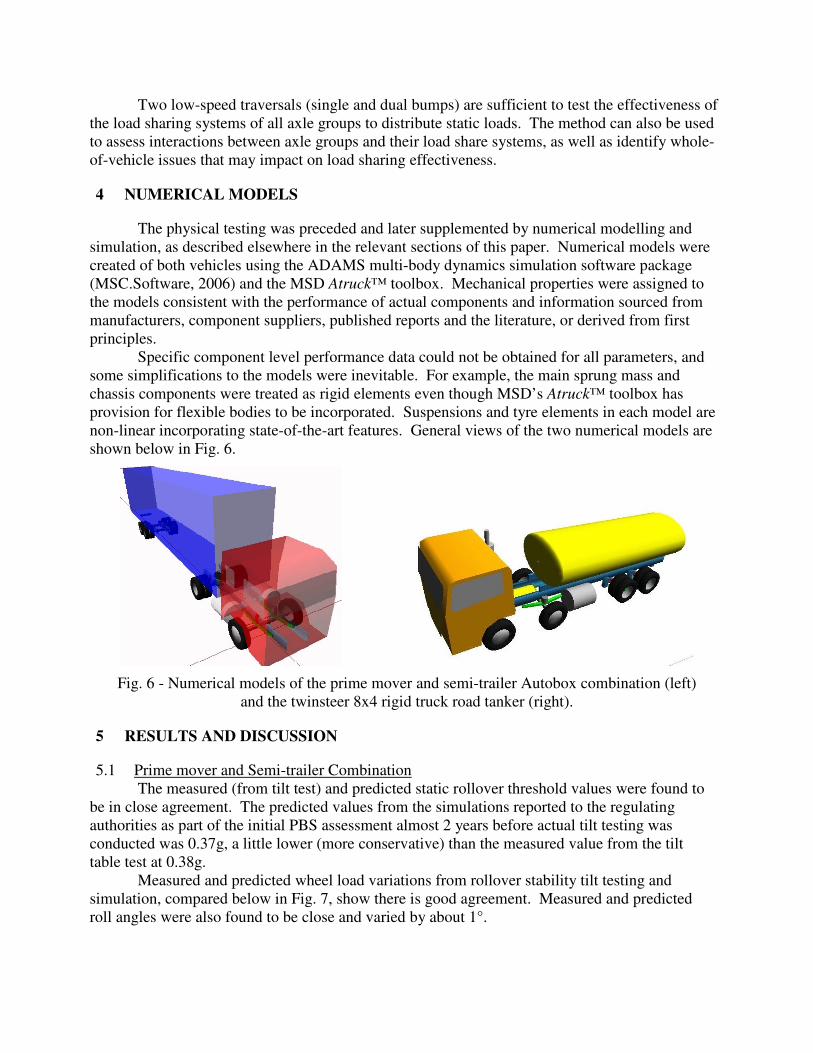
shown below in Fig. 6.
Fig. 6 - Numerical models of the prime mover and semi-trailer Autobox combination (left)
and the twinsteer 8x4 rigid truck road tanker (right).
5 RESULTS AND DISCUSSION
5.1 Prime mover and Semi-trailer Combination
The measured (from tilt test) and predicted static rollover threshold values were found to
be in close agreement. The predicted values from the simulations reported to the regulating
authorities as part of the initial PBS assessment almost 2 years before actual tilt testing was
conducted was 0.37g, a little lower (more conservative) than the measured value from the tilt
table test at 0.38g.
Measured and predicted wheel load variations from rollover stability tilt testing and
simulation, compared below in Fig. 7, show there is good agreement. Measured and predicted
roll angles were also found to be close and varied by about 1°.
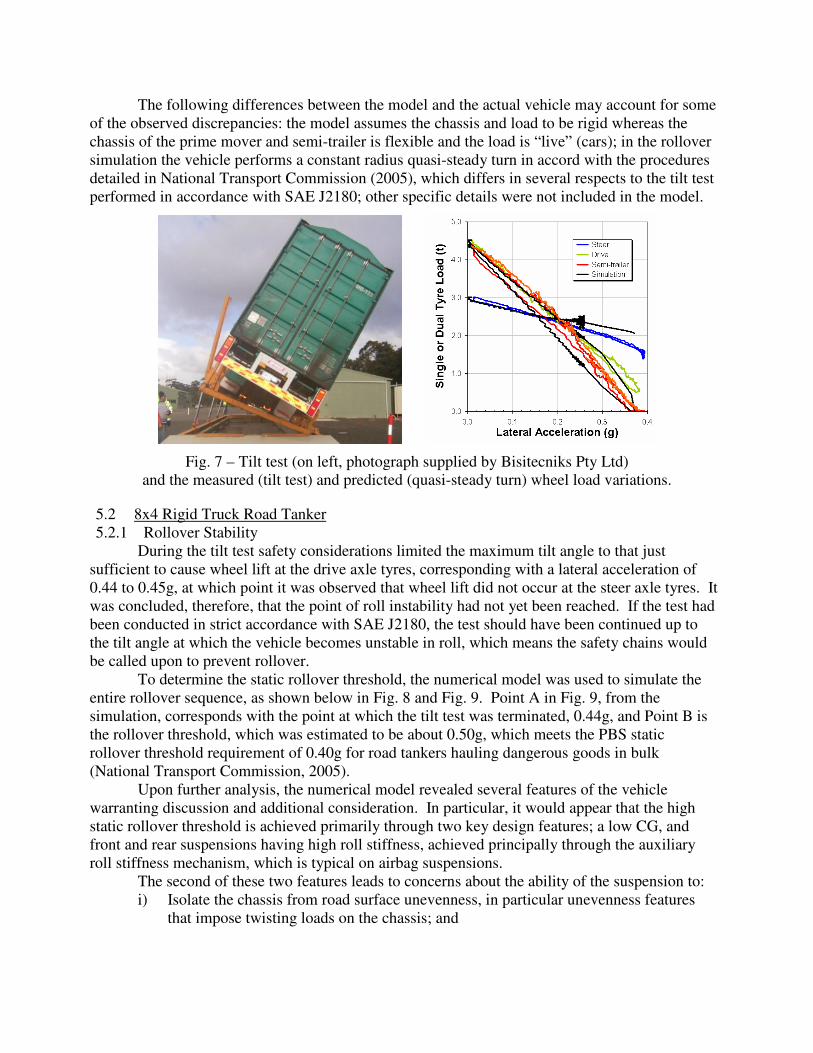
The following differences between the model and the actual vehicle may account for some
of the observed discrepancies: the model assumes the chassis and load to be rigid whereas the
chassis of the prime mover and semi-trailer is flexible and the load is “live” (cars); in the rollover
simulation the vehicle performs a constant radius quasi-steady turn in accord with the procedures
detailed in National Transport Commission (2005), which differs in several respects to the tilt test
performed in accordance with SAE J2180; other specific details were not included in the model.
Fig. 7 – Tilt test (on left, photograph supplied by Bisitecniks Pty Ltd)
and the measured (tilt test) and predicted (quasi-steady turn) wheel load variations.
5.2 8x4 Rigid Truck Road Tanker
5.2.1 Rollover Stability
During the tilt test safety considerations limited the maximum tilt angle to that just
sufficient to cause wheel lift at the drive axle tyres, corresponding with a lateral acceleration of
0.44 to 0.45g, at which point it was observed that wheel lift did not occur at the steer axle tyres. It
was concluded, therefore, that the point of roll instability had not yet been reached. If the test had
been conducted in strict accordance with SAE J2180, the test should have been continued up to
the tilt angle at which the vehicle becomes unstable in roll, which means the safety chains would
be called upon to prevent rollover.
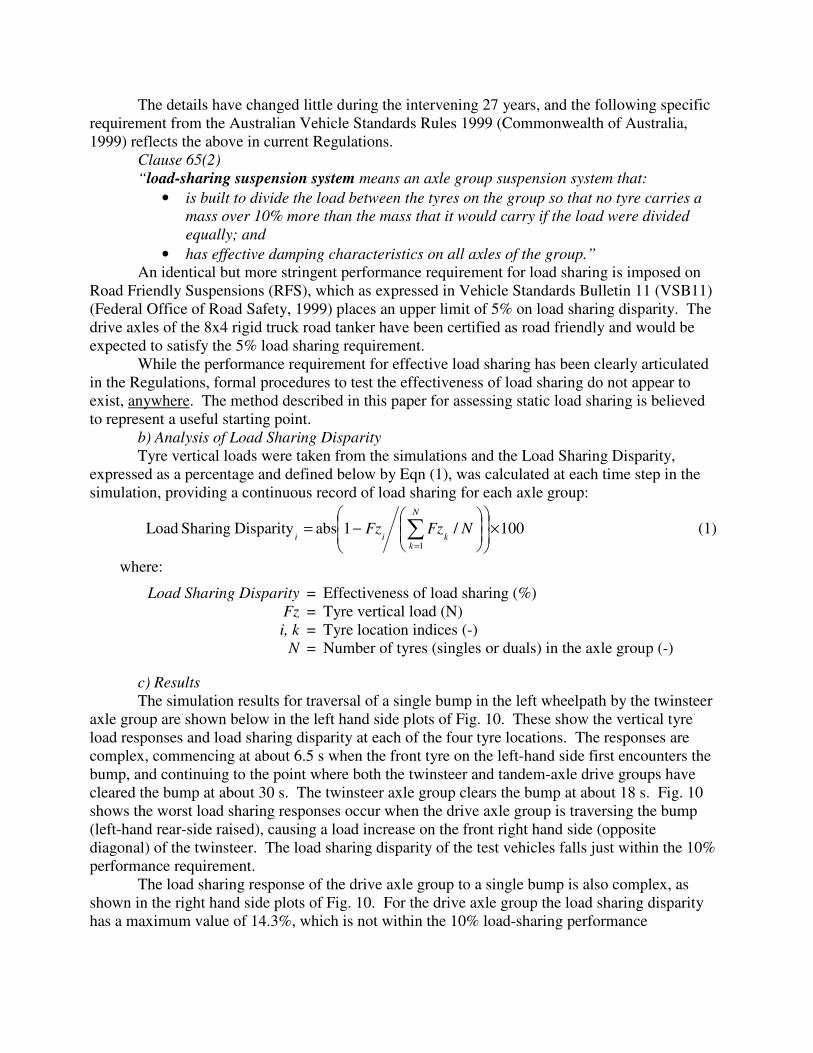
To determine the static rollover threshold, the numerical model was used to simulate the
entire rollover sequence, as shown below in Fig. 8 and Fig. 9. Point A in Fig. 9, from the
simulation, corresponds with the point at which the tilt test was terminated, 0.44g, and Point B is
the rollover threshold, which was estimated to be about 0.50g, which meets the PBS static
rollover threshold requirement of 0.40g for road tankers hauling dangerous goods in bulk
(National Transport Commission, 2005).
Upon further analysis, the numerical model revealed several features of the vehicle
warranting discussion and additional consideration. In particular, it would appear that the high
static rollover threshold is achieved primarily through two key design features; a low CG, and
front and rear suspensions having high roll stiffness, achieved principally through the auxiliary
roll stiffness mechanism, which is typical on airbag suspensions.
The second of these two features leads to concerns about the ability of the suspension to:
i) Isolate the chassis from road surface unevenness, in particular unevenness features
that impose twisting loads on the chassis; and
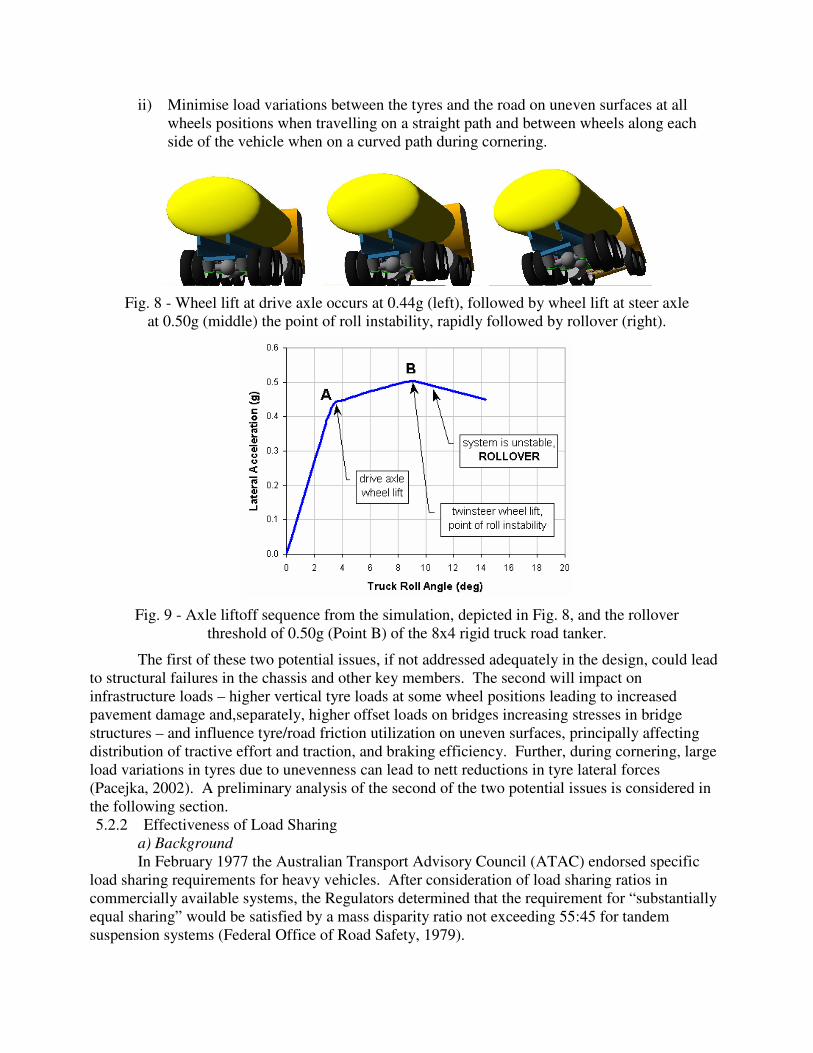
ii) Minimise load variations between the tyres and the road on uneven surfaces at all
wheels positions when travelling on a straight path and between wheels along each
side of the vehicle when on a curved path during cornering.
Fig. 8 - Wheel lift at drive axle occurs at 0.44g (left), followed by wheel lift at steer axle
at 0.50g (middle) the point of roll instability, rapidly followed by rollover (right).
Fig. 9 - Axle liftoff sequence from the simulation, depicted in Fig. 8, and the rollover
threshold of 0.50g (Point B) of the 8x4 rigid truck road tanker.
The first of these two potential issues, if not addressed adequately in the design, could lead
to structural failures in the chassis and other key members. The second will impact on
infrastructure loads – higher vertical tyre loads at some wheel positions leading to increased
pavement damage and,separately, higher offset loads on bridges increasing stresses in bridge
structures – and influence tyre/road friction utilization on uneven surfaces, principally affecting
distribution of tractive effort and traction, and braking efficiency. Further, during cornering, large
load variations in tyres due to unevenness can lead to nett reductions in tyre lateral forces
(Pacejka, 2002). A preliminary analysis of the second of the two potential issues is considered in
the following section.
5.2.2 Effectiveness of Load Sharing
a) Background
In February 1977 the Australian Transport Advisory Council (ATAC) endorsed specific
load sharing requirements for heavy vehicles. After consideration of load sharing ratios in
commercially available systems, the Regulators determined that the requirement for “substantially
equal sharing” would be satisfied by a mass disparity ratio not exceeding 55:45 for tandem
suspension systems (Federal Office of Road Safety, 1979).
The details have changed little during the intervening 27 years, and the following specific
requirement from the Australian Vehicle Standards Rules 1999 (Commonwealth of Australia,
1999) reflects the above in current Regulations.
Clause 65(2)
“load-sharing suspension system means an axle group suspension system that:
• is built to divide the load between the tyres on the group so that no tyre carries a
mass over 10% more than the mass that it would carry if the load were divided
equally; and
• has effective damping characteristics on all axles of the group.”
An identical but more stringent performance requirement for load sharing is imposed on
Road Friendly Suspensions (RFS), which as expressed in Vehicle Standards Bulletin 11 (VSB11)
(Federal Office of Road Safety, 1999) places an upper limit of 5% on load sharing disparity. The
drive axles of the 8x4 rigid truck road tanker have been certified as road friendly and would be
expected to satisfy the 5% load sharing requirement.
While the performance requirement for effective load sharing has been clearly articulated
in the Regulations, formal procedures to test the effectiveness of load sharing do not appear to
exist, anywhere. The method described in this paper for assessing static load sharing is believed
to represent a useful starting point.
b) Analysis of Load Sharing Disparity
Tyre vertical loads were taken from the simulations and the Load Sharing Disparity,
expressed as a percentage and defined below by Eqn (1), was calculated at each time step in the
simulation, providing a continuous record of load sharing for each axle group:
100/1abs Disparity Sharing Load1
×
−= ∑
=
NFzFz
N
kkii
(1)
where:
Load Sharing Disparity = Effectiveness of load sharing (%)
Fz = Tyre vertical load (N)
i, k = Tyre location indices (-)
N = Number of tyres (singles or duals) in the axle group (-)
c) Results
The simulation results for traversal of a single bump in the left wheelpath by the twinsteer
axle group are shown below in the left hand side plots of Fig. 10. These show the vertical tyre
load responses and load sharing disparity at each of the four tyre locations. The responses are
complex, commencing at about 6.5 s when the front tyre on the left-hand side first encounters the
bump, and continuing to the point where both the twinsteer and tandem-axle drive groups have
cleared the bump at about 30 s. The twinsteer axle group clears the bump at about 18 s. Fig. 10
shows the worst load sharing responses occur when the drive axle group is traversing the bump
(left-hand rear-side raised), causing a load increase on the front right hand side (opposite
diagonal) of the twinsteer. The load sharing disparity of the test vehicles falls just within the 10%
performance requirement.
The load sharing response of the drive axle group to a single bump is also complex, as
shown in the right hand side plots of Fig. 10. For the drive axle group the load sharing disparity
has a maximum value of 14.3%, which is not within the 10% load-sharing performance
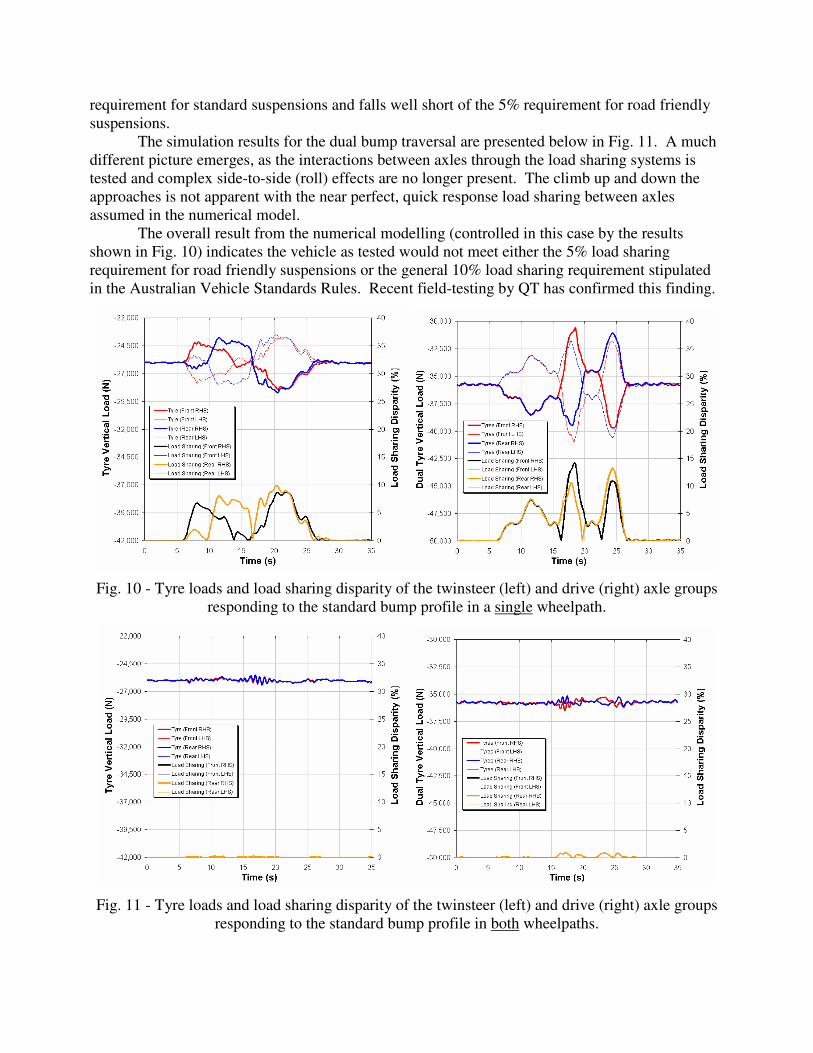
requirement for standard suspensions and falls well short of the 5% requirement for road friendly
suspensions.
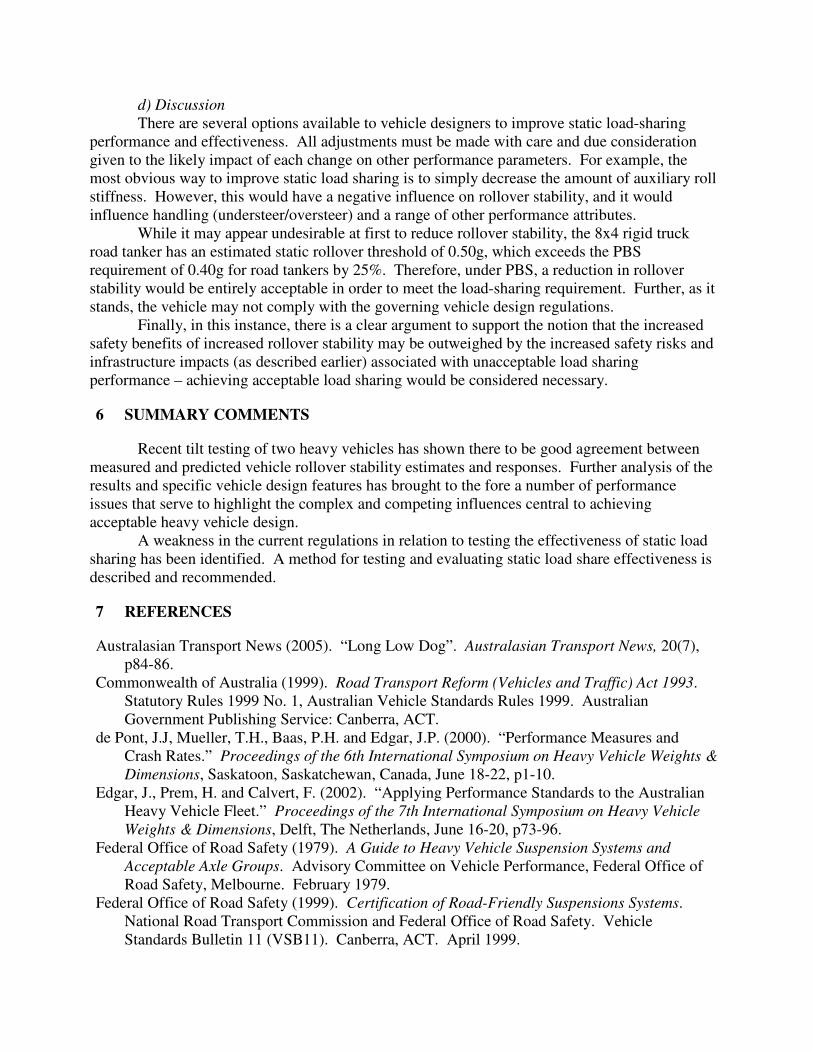
The simulation results for the dual bump traversal are presented below in Fig. 11. A much
different picture emerges, as the interactions between axles through the load sharing systems is
tested and complex side-to-side (roll) effects are no longer present. The climb up and down the
approaches is not apparent with the near perfect, quick response load sharing between axles
assumed in the numerical model.
The overall result from the numerical modelling (controlled in this case by the results
shown in Fig. 10) indicates the vehicle as tested would not meet either the 5% load sharing
requirement for road friendly suspensions or the general 10% load sharing requirement stipulated
in the Australian Vehicle Standards Rules. Recent field-testing by QT has confirmed this finding.
Fig. 10 - Tyre loads and load sharing disparity of the twinsteer (left) and drive (right) axle groups
responding to the standard bump profile in a single wheelpath.
Fig. 11 - Tyre loads and load sharing disparity of the twinsteer (left) and drive (right) axle groups
responding to the standard bump profile in both wheelpaths.
d) Discussion
There are several options available to vehicle designers to improve static load-sharing
performance and effectiveness. All adjustments must be made with care and due consideration
given to the likely impact of each change on other performance parameters. For example, the
most obvious way to improve static load sharing is to simply decrease the amount of auxiliary roll
stiffness. However, this would have a negative influence on rollover stability, and it would
influence handling (understeer/oversteer) and a range of other performance attributes.
While it may appear undesirable at first to reduce rollover stability, the 8x4 rigid truck
road tanker has an estimated static rollover threshold of 0.50g, which exceeds the PBS
requirement of 0.40g for road tankers by 25%. Therefore, under PBS, a reduction in rollover
stability would be entirely acceptable in order to meet the load-sharing requirement. Further, as it
stands, the vehicle may not comply with the governing vehicle design regulations.
Finally, in this instance, there is a clear argument to support the notion that the increased
safety benefits of increased rollover stability may be outweighed by the increased safety risks and
infrastructure impacts (as described earlier) associated with unacceptable load sharing
performance – achieving acceptable load sharing would be considered necessary.
6 SUMMARY COMMENTS
Recent tilt testing of two heavy vehicles has shown there to be good agreement between
measured and predicted vehicle rollover stability estimates and responses. Further analysis of the
results and specific vehicle design features has brought to the fore a number of performance
issues that serve to highlight the complex and competing influences central to achieving
acceptable heavy vehicle design.
A weakness in the current regulations in relation to testing the effectiveness of static load
sharing has been identified. A method for testing and evaluating static load share effectiveness is
described and recommended.
7 REFERENCES
Australasian Transport News (2005). “Long Low Dog”. Australasian Transport News, 20(7),
p84-86.
Commonwealth of Australia (1999). Road Transport Reform (Vehicles and Traffic) Act 1993.
Statutory Rules 1999 No. 1, Australian Vehicle Standards Rules 1999. Australian
Government Publishing Service: Canberra, ACT.
de Pont, J.J, Mueller, T.H., Baas, P.H. and Edgar, J.P. (2000). “Performance Measures and
Crash Rates.” Proceedings of the 6th International Symposium on Heavy Vehicle Weights &
Dimensions, Saskatoon, Saskatchewan, Canada, June 18-22, p1-10.
Edgar, J., Prem, H. and Calvert, F. (2002). “Applying Performance Standards to the Australian
Heavy Vehicle Fleet.” Proceedings of the 7th International Symposium on Heavy Vehicle
Weights & Dimensions, Delft, The Netherlands, June 16-20, p73-96.
Federal Office of Road Safety (1979). A Guide to Heavy Vehicle Suspension Systems and
Acceptable Axle Groups. Advisory Committee on Vehicle Performance, Federal Office of
Road Safety, Melbourne. February 1979.
Federal Office of Road Safety (1999). Certification of Road-Friendly Suspensions Systems.
National Road Transport Commission and Federal Office of Road Safety. Vehicle
Standards Bulletin 11 (VSB11). Canberra, ACT. April 1999.
Federal Office of Road Safety (2004). Personal Communication. Vehicle Standards, Federal
Office of Road Safety, Department of Transport and Regional Services. Canberra ACT.
Mai, V.K.L. and Sweatman, P.F. (1984). Articulated Vehicle Stability – Phase II Tilt Tests and
Computer Model. ARRB Internal Report AIR 323-2. Australian Road Research Board:
Vermont South, Vic.
National Road Transport Commission (1996). Mass Limits Review – Technical Supplement No.
1: Definition and Compliance Aspects. National Road Transport Commission: Melbourne,
Vic.
National Transport Commission (2005). Rules for Assessment of Potential Performance-Based
Standards Vehicles: Discussion Paper. National Transport Commission: Melbourne,
Australia.
National Transport Commission (2006). “Performance-Based Standards”.
<http://www.ntc.gov.au>. (January 11, 2006). National Transport Commission, Melbourne,
Australia.
Pacejka, H.B. (2002). Tyre and Vehicle Dynamics. Butterworth-Heinemann, Oxford.
Society of Automotive Engineers (1998). A Tilt Table Test Procedure for Measuring the Static
Rollover Threshold for Heavy Trucks. SAE Recommended Practice J2180, Society of
Automotive Engineers: Warrendale, PA, United States.
Winkler, C.B., Blower, D., Ervin, R.D. and Chalsani, R.M. (2000). Rollover of Heavy
Commercial Vehicles. SAE Research Report. Society of Automotive Engineers, Inc.:
Warrendale, PA, United States.