Embed Size (px)
Citation preview
7th International Symposium on Heavy Vehicle Weights & Dimensions
Delft, The Netherlands, June 16 - 20,2002
PUTTING THE DRIVER IN THE VEHICLE PERFORMANCE EQUATION WITH ON-ROAD TESTING
Peter Sweatman Roaduser Systems Pty Ltd, 76 - 80 Vella Drive, Sunshine, VIe, Australia
ABSTRACT
The engineering peiformance of heavy vehicles is a critical element in their access to road systems. Increasingly,
vehicle peiformance must be assessed before permits are granted, or regulations are changed, to allow more
productive vehicles to operate on public roads. This is especially true for the larger and heavier vehicle
combinations.
Heavy vehicle peifonnance is usually assessed in open-loop manoeuvres under certain sets of conditions.
Extensive use of computer simulation has been made for this purpose. However, in order to adequately assess
larger vehicle combinations, or problem vehicles, it is often necessary to carry out dynamic testing under typicaL
on-road operating conditions. This allows measurement of vehicle performance plus certain aspects of driver
steering pelfonnance.
This paper will present the results of several recent studies carried out by Roaduser Systems where both vehicle
and driver peiformance have been measured under actual on-road operating conditions. Results are presented for
a range of vehicle configurations from tractor-semi-trailers through double traiLer combinations (including B
doubles) to multi-trailer combinations.
The test results are presented in such a way as to encourage benchmarking of on-road vehicle peiformance and to
encourage the use of some common measures for comparing vehicles from around the world.
1 INTRODUCTION
The productivity and safety of heavy vehicle operations, and the way in which they are regulated, depend on their
engineering performance. Engineering performance describes vehicle behaviour in terms of its ability to start, stop
and turn and its impacts on infrastructure including pavements and bridges.
Vehicle performance assessment has become a useful tool in a world where creep in vehicle limits, albeit based on
rational periodic review, has run its course. Performance assessment has become essential in the issue of permits
for larger and/or unusual vehicle combinations. Specialisation in road freight vehicles is also creating a myriad of
vehicle configurations which defy prescriptive regulation because prescriptive limits rely in part on knowing the
vehicle configuration in advance.
Heavy vehicle safety and community acceptance is a major public policy issue. While vehicle engineering
performance directly affects a small but significant number of truck accidents (typically 10 % or less), it also has a
pervasive effect on many other truck accidents which are currently attributed to "driver error"; mass accident
investigation data currently offers poor insight into accident causation and countermeasures, but we do know that
truck accidents are highly multi-factor, especially in urban areas. This means driver-vehicle-environment
interactions often come into play.
Depending on whether we need a screening tool prior to letting a vehicle on the road, an alternative to prescriptive
limits (performance-based standards) or means of investigating truck safety issues after they are manifested we
require different types of performance measures. Some measures pertain to the vehicle only and some to the
driver-vehicle and driver-vehicle-road interaction. It is prudent to avoid permitting or proliferating the worst
performing vehicles (according to vehicle-based measures) and it is equally prudent to minimise the potential for
poor driver-vehicle-environment performance.
The latter is more difficult to measure. While a range of vehicle measures and road measures have been
developed, driver measures are few and far between. The current Australian project to develop performance-based
481
standards (PBS), as an alternative form of regulation to prescriptive standards, has collected and refined available
performance measures (1). Recent major Australian safety investigations (2,3) have attempted to apply
performance measures to the identification of systemic safety issues related to truck on-road behaviour.
This paper presents stability and control performance measures which select from and go beyond the current
"PBS" measures and have provided insight into on-road safety and acceptability issues. This is necessary because
remarkably little physical testing of the PBS measures has been carried out.
2 ON-ROAD PERFORMANCE MEASUREMENT
On-road performance measurements have been carried out for a range of vehicle configurations from tractor-semi
trailers through doubles combinations (including B-doubles) to multi-trailer roadtrains. The performance
measurements vary in scope and intent and include:
• Vehicle parameters - measures which are properties of vehicle sub-systems (such as suspensions) and are not
affected by the manoeuvre or operating environment
• Vehicle performance measures - measures which are a property of the entire vehicle system, apply to a
particular manoeuvre and are not intended to be affected by the operating environment
• Driver-vehicle performancelinteraction measures - measures which are a property of the driver-vehicle
interaction and reflect the operating environment.
2.1 Tractor-Semi-Trailers
Tractor-semi-trailers were tested (2) in response to complaints about unsafe handling. All testing was carried out
under typical on-road operating conditions and the range of performance measures included:
• Vehicle parameters (steering ratio, suspension roll steer coefficient, front axle bump steer coefficient)
• Vehicle performance measures (understeer coefficient, roll gradient, response transfer functions)
• Driver-vehicle performance measures (rms steering angle, dominant steering frequency, rms responses (yaw
and lateral acceleration)).
The following vehicle parameters were able to differentiate problem vehicles from benchmark vehicles:
• Suspension roll steer coefficient
• Suspension roll stiffness and roll centre height
• Front axle bump steer coefficient.
The following vehicle performance measures were able to differentiate problem vehicles from benchmark vehicles:
• Understeer coefficient
• Roll gradient.
The following driver-vehicle performance measures were able to differentiate problem vehicles from benchmark
vehicles:
• Rms steering wheel angle
• Dominant steering frequency
• Rms tractor yaw rate.
This work showed that poor values of certain vehicle parameters (suspension and steering) flowed through to poor
performance measures for the vehicle system (handling and stability) and these in turn caused the driver to apply
more steering corrections at a higher frequency but the net result was still poorer control of the tractor (yaw rate).
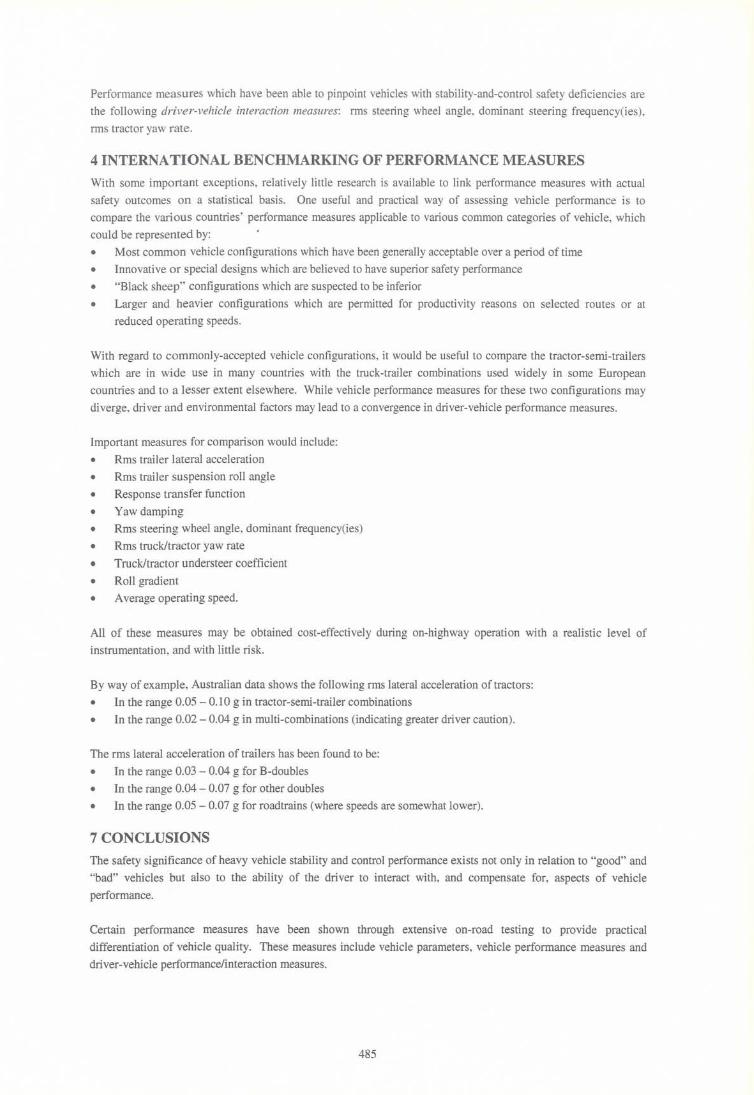
2.2 Doubles Combinations
A range of doubles (see Figure 1) was tested on-road in response to regulatory agency concerns about stability and
control for some configurations (3). Certain standard test manoeuvres were also carried out (lane-change and yaw
damping).
482
The following vehicle performance measures were able to differentiate poor combinations from the other
combinations:
• Roll gradient
• Response transfer functions
• Rear amplifi cation ratio
• Yaw damping
• Rearward amplification.
The following driver-vehicle performance measures were able to differentiate poor combinations from the other
combinations:
• Rms suspension roll angle
• Rms lateral acceleration of rear trailer.
This work showed that there are three key indicators of poor performance in doubles combinations:
• Suspension roll angles developed by all units (expressed as rms values); these are affected by suspension roll
characteristics (represented in the roll gradient)
• Various measures of rear amplification
• Yaw damping.
Of these measures, suspension roll angle characteristics and rear amplification can be measured in normal travel or
in stylised lane-change manoeuvres. Yaw damping can only be measured in a pulse steer manoeuvre, but this is
readily carried out during normal on-road operation.
It should be noted that several measures of "rear amplification" were obtained:
• What was termed rear amplification (rms lateral acceleration of rear trailer divided by rms lateral acceleration
of tractor, obtained during normal travel) - this can also be measured using yaw rates
• Rearward amplification as measured in the well -defined SAE lane-change manoeuvre
• Transfer functions between the lateral acceleration (or yaw rate) of the rear trailer and that of the tractor.
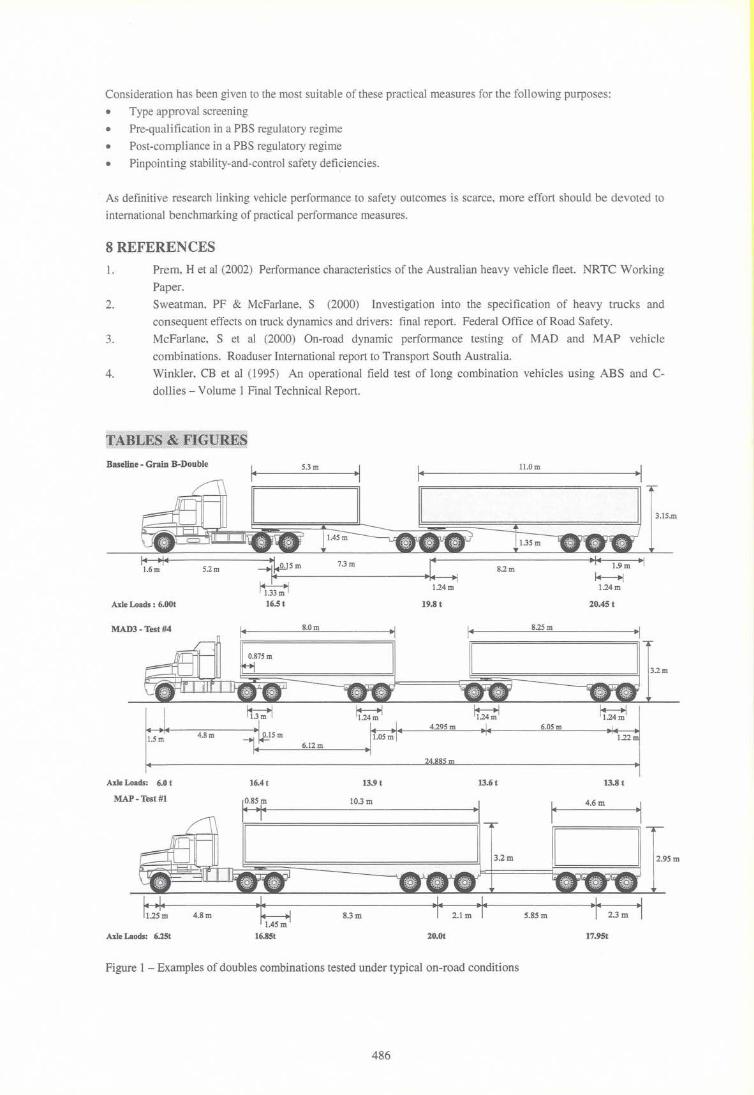
The latter transfer functions provide valuable insight into "resonances" in the response of multi-combination
vehicles. Figure 2 shows the lateral acceleration transfer function for the B-double. It is apparent that the peak
gain of 2.85 occurs at a frequency of 0.8 Hz; by comparison, the standard lane-change test of rearward
amplification returns a gain of 1.11 at a frequency of 0.4 Hz. It was found that the standard test missed the peak
gain for all doubles tested. Does this matter? Driver steering input has a dominant frequency in the range 0.2 - 0.6
Hz (2) and therefore high gains occurring above this frequency are of lesser concern (unless they coincide with
suspension frequencies).
Extensive US research (4) also measured rearward amplification of multi-combinations under actual operating
conditions. Measures which were found to be useful in relation to quantifying the stability-enhancing
characteristics of improved trailer coupling arrangements included:
• The lateral acceleration transfer function gain described above
• The peak rearward amplification obtained from the transfer function gain
• Comparison of front and rear histograms of lateral acceleration (percent of time spent above a certain lateral
acceleration, front versus rear)
• A measure termed the lateral acceleration experience of trailers relative to the experience of tractors; this was
computed as the ratio of the percent of time spent above a certain lateral acceleration value (trailer over
tractor) plotted against lateral acceleration.
2.3 Roadtrains
Candidate innovative roadtrains of GCM in excess of 100 t have been tested on-route alongside currently
permitted triple roadtrains to provide performance data to guide permitting procedures. Certain standard test
manoeuvres have also been carried out (lane-change and yaw damping).
483
The followin g vehicle performance measures were able to differentiate poor combinations from the other
combinations:
• Response transfer functions
• Rear amplification ratio
• Yaw damping
• Rearward amplification
The following driver-vehicle performance measures were able to differentiate poor combinations from the other
combinations :
• Rms suspension roll angle of rear trailer
• Rms lateral acceleration of rear trailer.
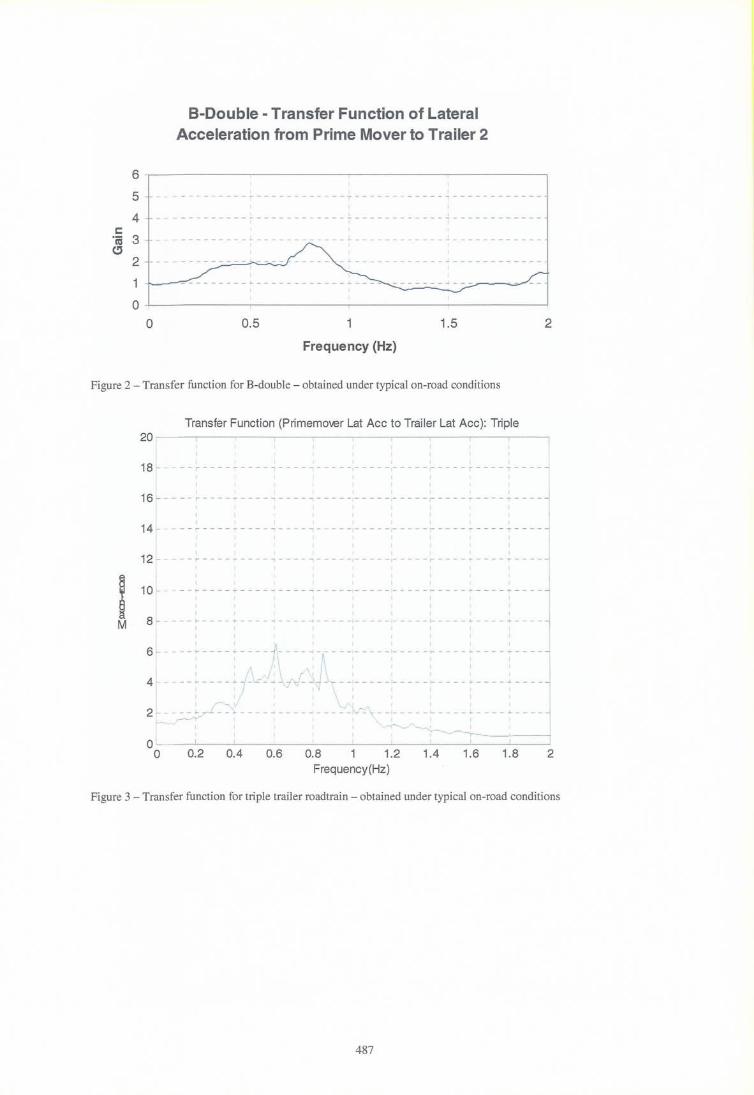
A key finding for some roadtrains is that the response transfer functions may have more than one peak. Multi
trailer combinations tend to have a response peak in the lower-frequency range (0.2 - 0.5 Hz) plus a peak in the
higher-frequency range (0.8 - 1.2 Hz). Figure 3 shows a typical example for a conventional Australian triple
roadtrain. These transfer functions have important implications for performance measurement because:
• The lower-frequency peak mayor may not coincide with the standard lane-change test (0.4 Hz)
• The rear amplification may vary rapidly at frequencies varying from 0.4 Hz (adversely affecting the accuracy
of rearward amplification measurement)
• The higher-frequency peak tends to be higher for B-coupled combinations
• In some cases, the higher-frequency peak may coincide with the suspension bounce frequency, causing
dramatic yaw oscillations under some road conditions.
It is also important to consider the effect of driver steering behaviour on vehicle behaviour, as well as the reverse:
the effect of vehicle behaviour on driver steering behaviour. Driver behaviour is evidenced in the power spectrum
of steering wheel angle or front wheel angle movements. Drivers normally have a dominant steering frequency of
0.2 - 0.3 Hz. Under demanding conditions or emergency manoeuvres, the dominant frequency increases to 0.5 -
0.6 Hz. It is therefore possible that the driver' s emergency mode would excite an undesirable yaw resonance.
However, observation of roadtrain drivers suggests that they are well aware of vehicle resonant frequencies and
modify their steering behaviour to avoid these frequencies.
3 VOCATIONAL USE OF PERFORMANCE MEASURES
Performance measures which have proven vital in the make-up of problem vehicles, and which may be used to
screen vehicles in a type approval sense are the following vehicle parameters: suspension roll stiffness and roll
centre height, suspension roll steer coefficient and front axle bump steer coefficient.
Performance measures which have a proven track record in the identification of problem vehicles, and which may
be used for pre-qualification regulatory purposes under a PBS regime include:
• The following vehicle parameters: suspension roll stiffness and roll centre height, suspension roll steer
coefficient and front axle bump steer coefficient
• The following vehicle performance measures: Static Roll Stability, understeer coefficient, roll gradient, yaw
damping, rearward amplification (in various forms including rearward amplification in the lane-change,
response transfer function using lateral acceleration or yaw rate, peak response gain and peak frequencies).
Performance measures which have a proven track record in the benchmarking and comparison of vehicles, and
which may be used for post-compliance regulatory purposes under a PBS regime include:
• The following vehicle performance measures: Static Roll Stability, understeer coefficient, roll gradient, yaw
damping, rearward amplification (in various forms including rearward amplification in the lane-change,
response transfer function using lateral acceleration or yaw rate, peak response gain and peak frequencies)
• The following driver-vehicle performance measures: rms roll angle of each unit, rms lateral acceleration of
each unit.
484
Performance measures which have been able to pinpoint vehicles with stability-and-control safety deficiencies are
the following driver-vehicle interaction measures: rms steering wheel angle, dominant steering frequency(ies),
rms tractor yaw rate.
4 INTERNATIONAL BENCHMARKING OF PERFORMANCE MEASURES
With some important exceptions, relatively little research is available to link performance measures with actual
safety outcomes on a statistical basis. One useful and practical way of assessing vehicle performance is to
compare the various countries' performance measures applicable to various common categories of vehicle, which
could be represented by:
• Most common vehicle configurations which have been generally acceptable over a period of time
• Innovative or special designs which are believed to have superior safety performance
• "Black sheep" configurations which are suspected to be inferior
• Larger and heavier configurations which are permitted for productivity reasons on selected routes or at
reduced operating speeds.
With regard to commonly-accepted vehicle configurations, it would be useful to compare the tractor-serni-trailers
which are in wide use in many countries with the truck-trailer combinations used widely in some European
countries and to a lesser extent elsewhere. While vehicle performance measures for these two configurations may
diverge, driver and environmental factors may lead to a convergence in driver-vehicle performance measures.
Important measures for comparison would include:
• Rms trailer lateral acceleration
• Rms trailer suspension roll angle
• Response transfer function
• Yaw damping
• Rms steering wheel angle, dominant frequency(ies)
• Rms truck/tractor yaw rate
• Truck/tractor understeer coefficient
• Roll gradient
• A verage operating speed.
All of these measures may be obtained cost-effectively during on-highway operation with a realistic level of
instrumentation, and with little risk.
Byway of example, Australian data shows the following rms lateral acceleration of tractors:
• In the range 0.05 - 0.10 g in tractor-semi-trailer combinations
• In the range 0.02 - 0.04 g in multi-combinations (indicating greater driver caution).
The rms lateral acceleration of trailers has been found to be:
• In the range 0.03 - 0.04 g for B-doubles
• In the range 0.04 - 0.07 g for other doubles
• In the range 0.05 - 0.07 g for roadtrains (where speeds are somewhat lower) .
7 CONCLUSIONS
The safety significance of heavy vehicle stability and control performance exists not only in relation to "good" and
"bad" vehicles but also to the ability of the driver to interact with, and compensate for, aspects of vehicle
performance.
Certain performance measures have been shown through extensive on-road testing to provide practical
differentiation of vehicle qUality. These measures include vehicle parameters, vehicle performance measures and
driver-vehicle performance/interaction measures.
485
Consideration has been given to the most suitable of these practical measures for the following purposes:
• Type approval screening
• Pre-qualification in a PBS regulatory regime
• Post-compliance in a PBS regulatory regime
• Pinpointing stability-and-control safety deficiencies.
As definitive research linking vehicle performance to safety outcomes is scarce, more effort should be devoted to
international benchmarking of practical performance measures.
8 REFERENCES
1. Prem, Het al (2002) Performance characteristics of the Australian heavy vehicle fleet. NRTC Working
Paper.
2. Sweatman, PF & McFarlane, S (2000) Investigation into the specification of heavy trucks and
consequent effects on truck dynamics and drivers: final report. Federal Office of Road Safety.
3. McFarlane, S et al (2000) On-road dynamic performance testing of MAD and MAP vehicle
combinations. Roaduser International report to Transport South Australia.
4. Winkler, CB et al (1995) An operational field test of long combination vehicles using ABS and C
dollies - Volume 1 Final Technical Report.
Baseline - Grain B-Double 14 S.3 rn
~ 1.6rn S.2m
Axle Loads: 6.00t
l.5rn 4.8m
Axle Loads: 6.0 t
1~sm 141.33 ;1
16.5 t
14 o.l
sm
16.4t
6.12m
7.3 m
13.9t
14 • 4 .1
·14 1.9 m ~I 8.2 m
~ 1.24rn 1.24 m
19.8 t 20.45 t
4.29Sm 6.05 m 1.22rn
24.885 m
13.6 t 13.8 t
MAP-Test #1 11+~_·8+1~i~4 _______ 10_.3_ m ______ __ ---.J.1 14 4.6m .1
.u;; :lmt]lm ~I5m 1.25 m 4.8m 8.3 m .14 ·1- ·1- ·1
Axle Laods: 6.25t 16.85t 20.0t 17.95t
Figure 1 - Examples of doubles combinations tested under typical on-road conditions
486
c:
6
5
4
"(6 3 o
2
o o
B-Double - Transfer Function of Lateral Acceleration from Prime Mover to Trailer 2
1
- - ------- ----- ----- - --,---- - - - ----- 1" ------------
1
1 1 - -- ----------------- - ---- 1 -------- - ---1------------
1
___ ______________________ L ____________ -'- ___________ _
_ __ ___ ______ L ___ _
1
0.5
1
_ 1. ____________ ....1 ___________ _
1
1
------- -+ ----:..7-----~
1.5
Frequency (Hz)
2
Figure 2 - Transfer function for B-double - obtained under typical on-road conditions
Transfer Function (Primemover Lat Acc to Trailer Lat Acc): Triple 20 ~--~----~----~----~----~----~--~----~----~----,
1 8 - - - - I - - - - T - - - - "1 - - - - I - - - - - I - - - - - 1- - - - - I - - - - T - - - - T - - - -
1 1 1 1 1 1
16 - - - - I - - - - T - - - - - - - - - , - - - - - - - - - - 1- - - - - I - - - - - - - - - T - - - -
1 1 1 1 1 1 1
14 - - - - ;- - - - - T - - - - - - - - - , - - - - - 1- - - - - 1- - - - - I - - - - - - - - - T - - - -
1 1 1 1 1 1 1 1
12 - - - - ;- - - - - T - - - - -, - - - - , - - - - - 1- - - - - 1- - - - - r - - - - T - - - - T - - - -
1 1 1 1 1 1 1
~ M
10 -- -- ~ ----~---- ~- ---~---------- ~ ---- ~ ----~----+----1 I 1
1 1
8 - - - - ~ - - - - + - - - - -t - - - - -j - - - - - 1- - - - - 1- - - - - f- - - - - ~ - - - - + - - - -1 1 1 1 1 1
1 I I I I
~ ~ -~ [ ~ ~ --tA~:;: ~ : -: i-: --~ [ : ~ ~ -f ~ - ~ - ; - : : ~ - - - - I- £: + - - - - - - - - - -' - - - - -l_r:"\ - -1- - - - - I- - - - - + - - - - -+ - - - -~ 1 "I 1 ; 1 I
1 1 I~~
I : : 1 : 1 1 I O L----~----~----~----~----~----~----~----~----~----~.
6
4
2
o 0.2 0.4 0.6 0.8 1.2 1.4 1.6 1.8 2 Frequency(Hz)
Figure 3 - Transfer function for triple trailer roadtrain - obtained under typical on-road conditions
487

488